Article

Distribution Characteristics of High Wetness Loss Area in the Last Two Stages of Steam Turbine under Varying Conditions

1
Laboratory for Space Environment and Physical Sciences, Harbin Institute of Technology, Harbin 150001, China
2
College of Energy and Power Engineering, Northeast Electric Power University, Jilin 132000, China
3
College of Power and Energy Engineering, Harbin Engineering University, Harbin 150009, China
4
School of Electrical Engineering and Automation, Harbin Institute of Technology, Harbin 150001, China
5
School of Energy Science and Engineering, Harbin Institute of Technology, Harbin 150001, China
*
Authors to whom correspondence should be addressed.
Energies 2022, 15(7), 2527; https://doi.org/10.3390/en15072527
Submission received: 10 March 2022 / Revised: 28 March 2022 / Accepted: 29 March 2022 / Published: 30 March 2022

Abstract

:
Wetness loss of a steam turbine seriously affects the security of the unit when operating in deep peak regulation. To obtain the distribution characteristics of the high wetness loss area under different working conditions, especially low-load conditions, the last two stages of the low-pressure cylinder (LPC) of a 600 MW steam turbine were simulated using the non-equilibrium condensation model proposed in this study. The nucleation rate distribution, supercooling degree, and steam velocity droplet were analyzed. Consequently, the diameter distribution of coarse water droplets under 100%, 50%, 40%, 30%, and 20% THA conditions and the distribution of the thermodynamic loss and water droplet resistance loss were obtained. Thermodynamic loss mainly occurred at the front end of second-stage stator blades and trailing end of the last-stage stator blades. The water droplet resistance loss mainly occurred at 40% of the blade height and at the tip of the last-stage stator blades. Moreover, with a reduction in the unit load, the thermodynamic loss continued to decrease, but the water droplet resistance loss continued to increase.

1. Introduction

The generation of wet steam is inevitable in the process of steam turbine running in a wide range of working conditions [1]. In particular, the last two stages of LPC are in a wet steam environment for a long time. During the flow of wet steam, the generation and development of small droplets leads to the wetness loss, which not only reduces the efficiency of the unit, but even threatens the operation safety [2,3]. The area of the distribution of high wetness loss, is accurately obtained. There is a certain sense of improving the operational safety and economy of the steam turbine.
Wet steam condensation flow is a long-standing problem. An accurate stepwise description of the flow characteristics is carried out, from the initial one-dimensional nozzle structure [4] and two-dimensional cascade structure [5], to the current three-dimensional multi-stage structure [6,7]. Simultaneously, an empirical estimation method for wetness loss was proposed, where a 1% average humidity corresponding to a 1% drop in the turbine efficiency [8] was obtained. However, some researchers have found that this estimation method is not completely accurate. This is because the value of the humidity and deposition distribution of water droplets should be considered in the process of estimating wetness loss [9,10,11]. Therefore, as indicated by references [12], the surface pressure and humidity distribution in the wet steam stage undergo significant changes. Thus, by comparing the two different flows, the non-design loss and the non-equilibrium loss was roughly evaluated. Simultaneously, some scholars began to study the value of the wetness loss using a semi-analytical method [13] and numerical simulation calculations [14], which laid the foundation for the subsequent three-dimensional simulation calculation of the wetness loss. The influence of the nozzle and cascade on the thermodynamic loss was studied in reference [15]. In [16], condensation loss was analyzed from two aspects: multi-dispersed droplets and cascade trailing edge reduction. To reduce the condensation loss, the idea of turbulent flow disturbance on the suction side to reduce the liquid phase fraction was proposed in reference [17], and reference [7] took the initiative of injecting droplets.
In summary, the current research on wetness loss is limited to the quantitative estimation of empirical algorithms, where the distribution of wetness loss in steam turbines is not given under different operating conditions.
Therefore, the following issues need to be discussed:
  • How are the thermodynamic losses distributed in the last two stages of steam turbine LPC under different working conditions?
  • How are the water droplet resistance losses distributed in the last two stages of steam turbine LPC under different working conditions?
  • What factors are related to the above two losses?
In order to study the high wetness loss area (thermodynamic and water droplet resistance losses) in the last two stages of the LPC under different working conditions of steam turbine, corresponding measures are taken to reduce the wetness loss. Therefore, efficiency and safety are guaranteed. Thus, in this study, the last two stages of a 600 MW steam turbine LPC were considered as the research object. The distribution characteristics of the high wetness loss area under different working conditions, which is of great significance in improving the design level of the steam turbine, were analyzed using simulations.
The paper is organized as follows: Section 2 introduces the physical model, numerical methods, mathematical model verification, and composition of high wetness loss. In Section 3.1 and Section 3.2, the thermodynamic loss and the water droplets resistance loss are analyzed, and their distributions in the last two stages of the low-pressure cylinder of the steam turbine are summarized in Section 3.3. In Section 3.4, the methods to control wetness loss is proposed, and Section 4 provides the concluding remarks.

2. Models and Numerical Methods

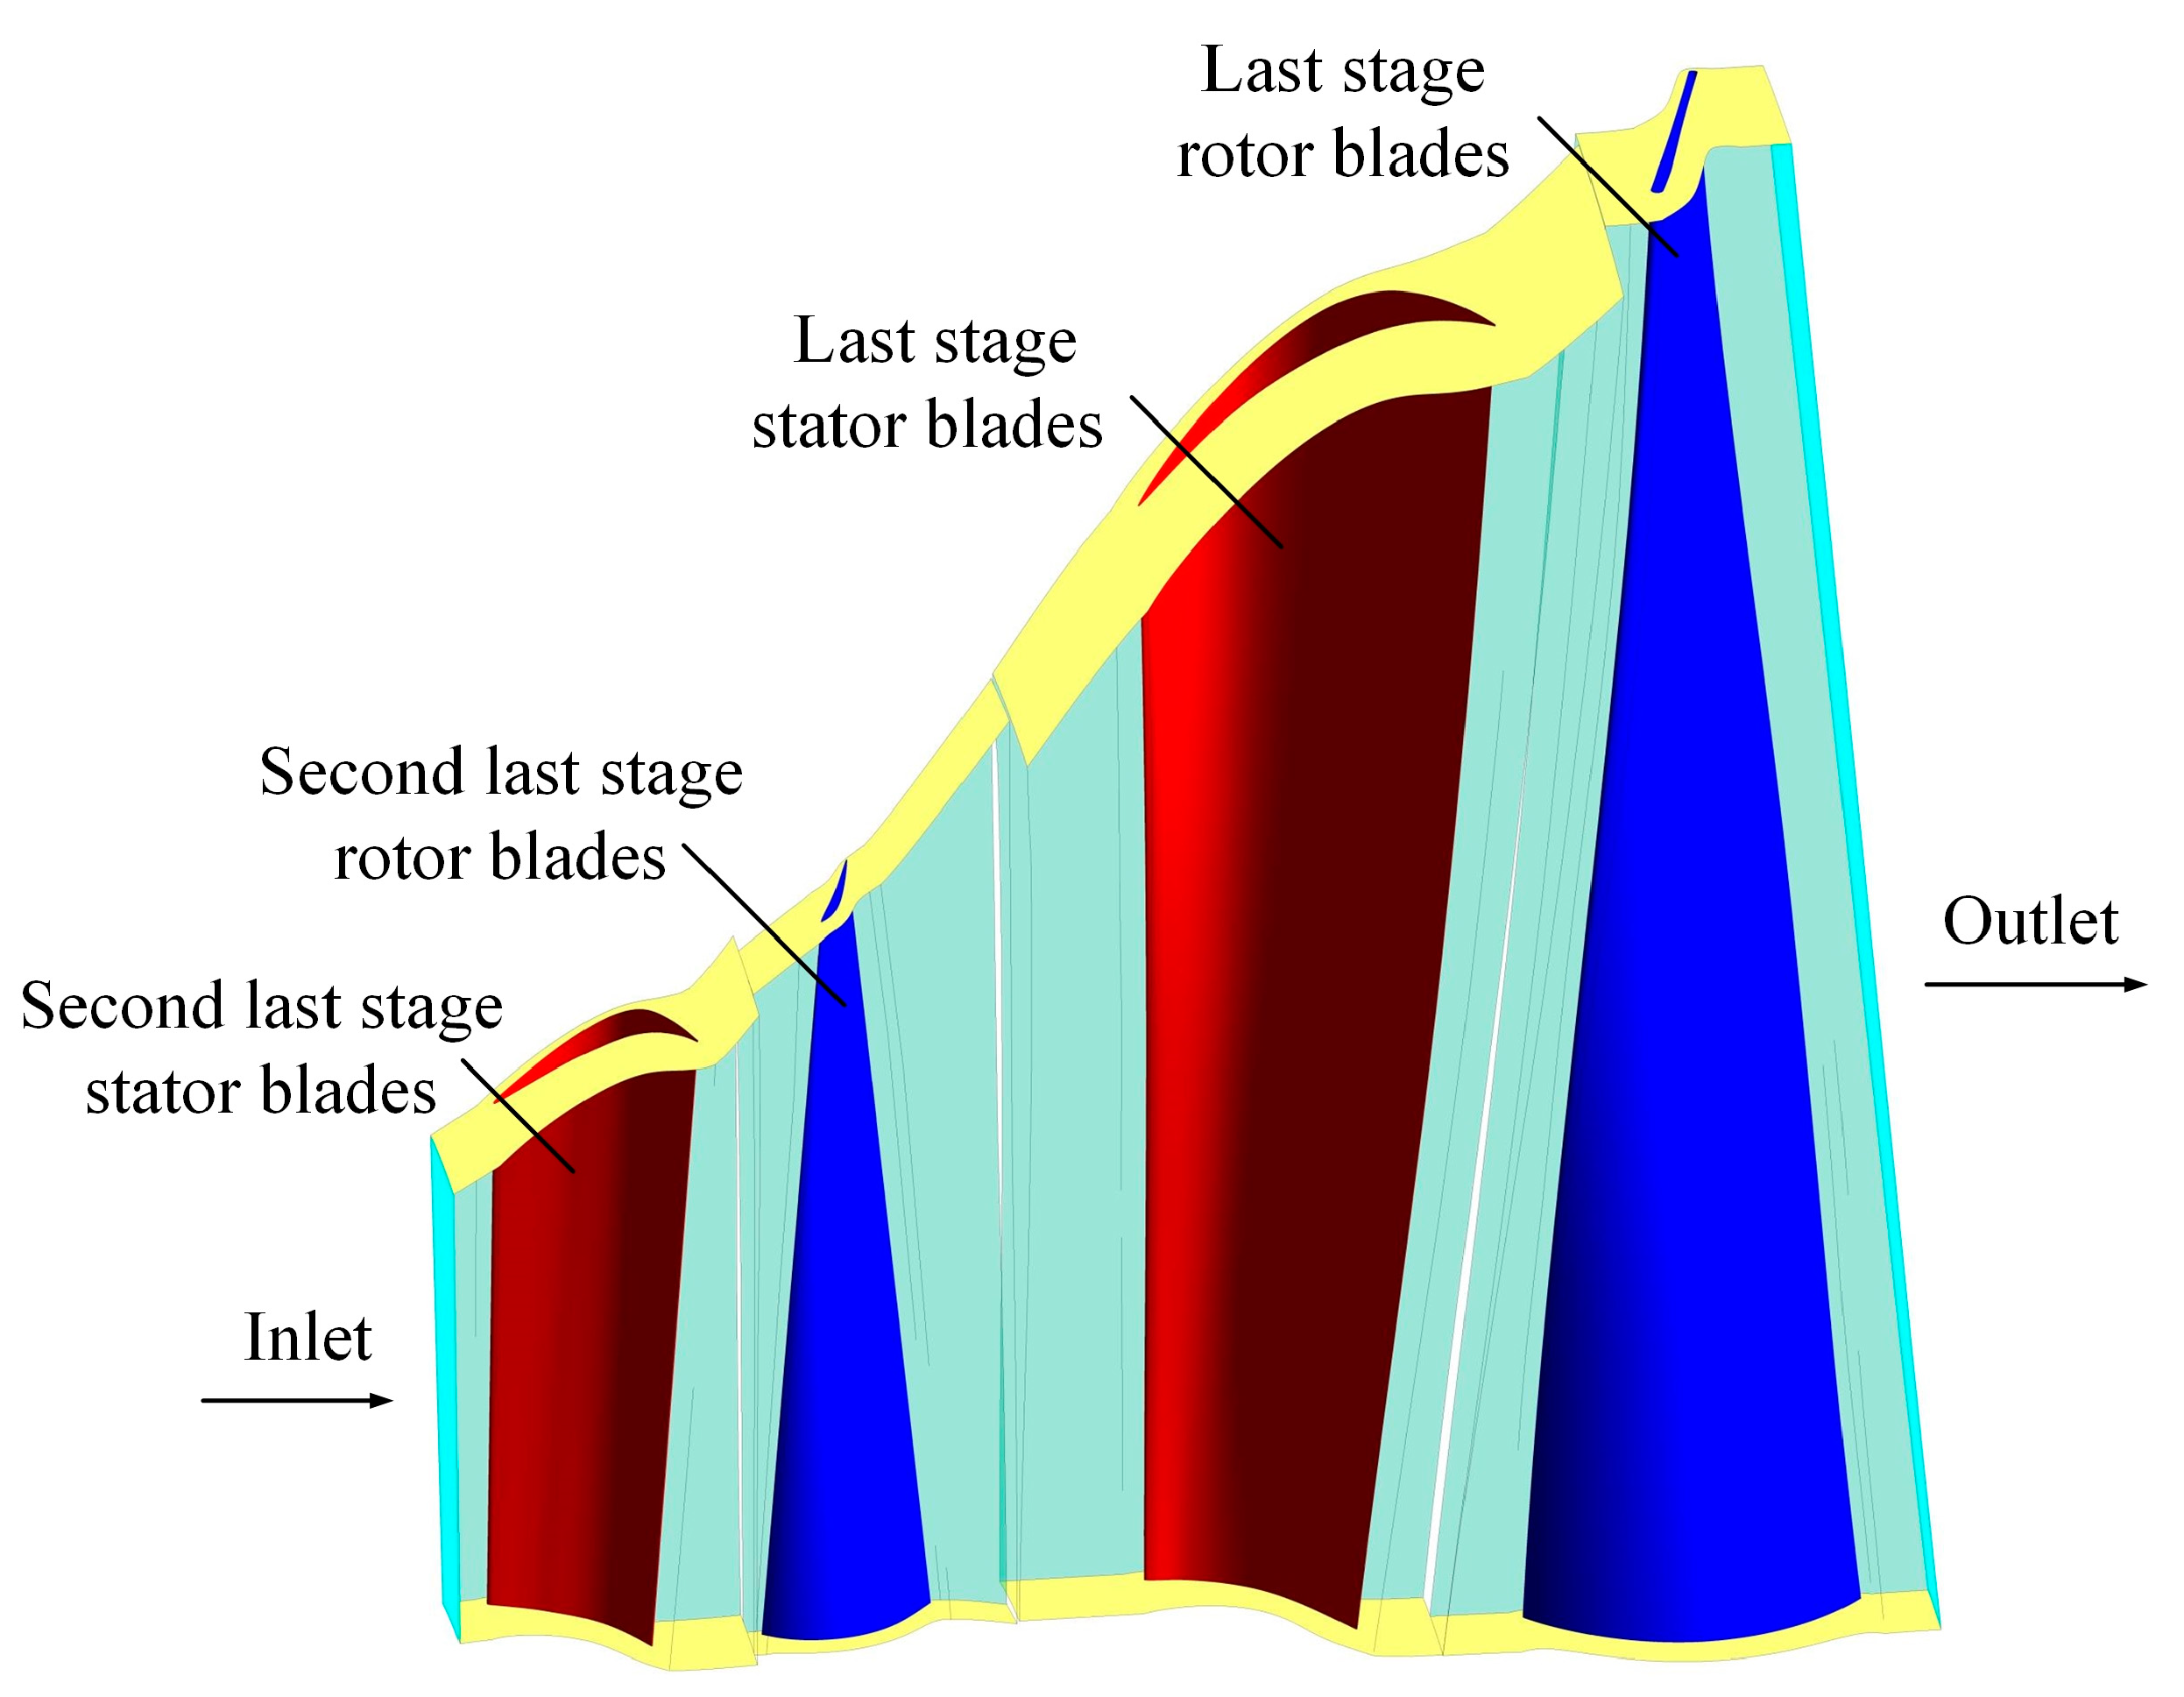
2.1. Physical Model and Boundary Conditions

A 600 MW steam turbine low-pressure cylinder with the last two stage blades was taken as the research object, where the calculated single-flow channel structure is shown in Figure 1. According to the thermodynamic characteristics specification, the steam turbine speed was 3000 r/min, the inlet temperature of the last second stage was 357.45 K, the inlet humidity was 1.5%, the mass flow rate was 1.305 kg/s, and the outlet pressure of the last stage was 4.9 kPa. The frozen rotor method is used for the interface [18,19], and the convergence residual limit was set to the order of 10−5.

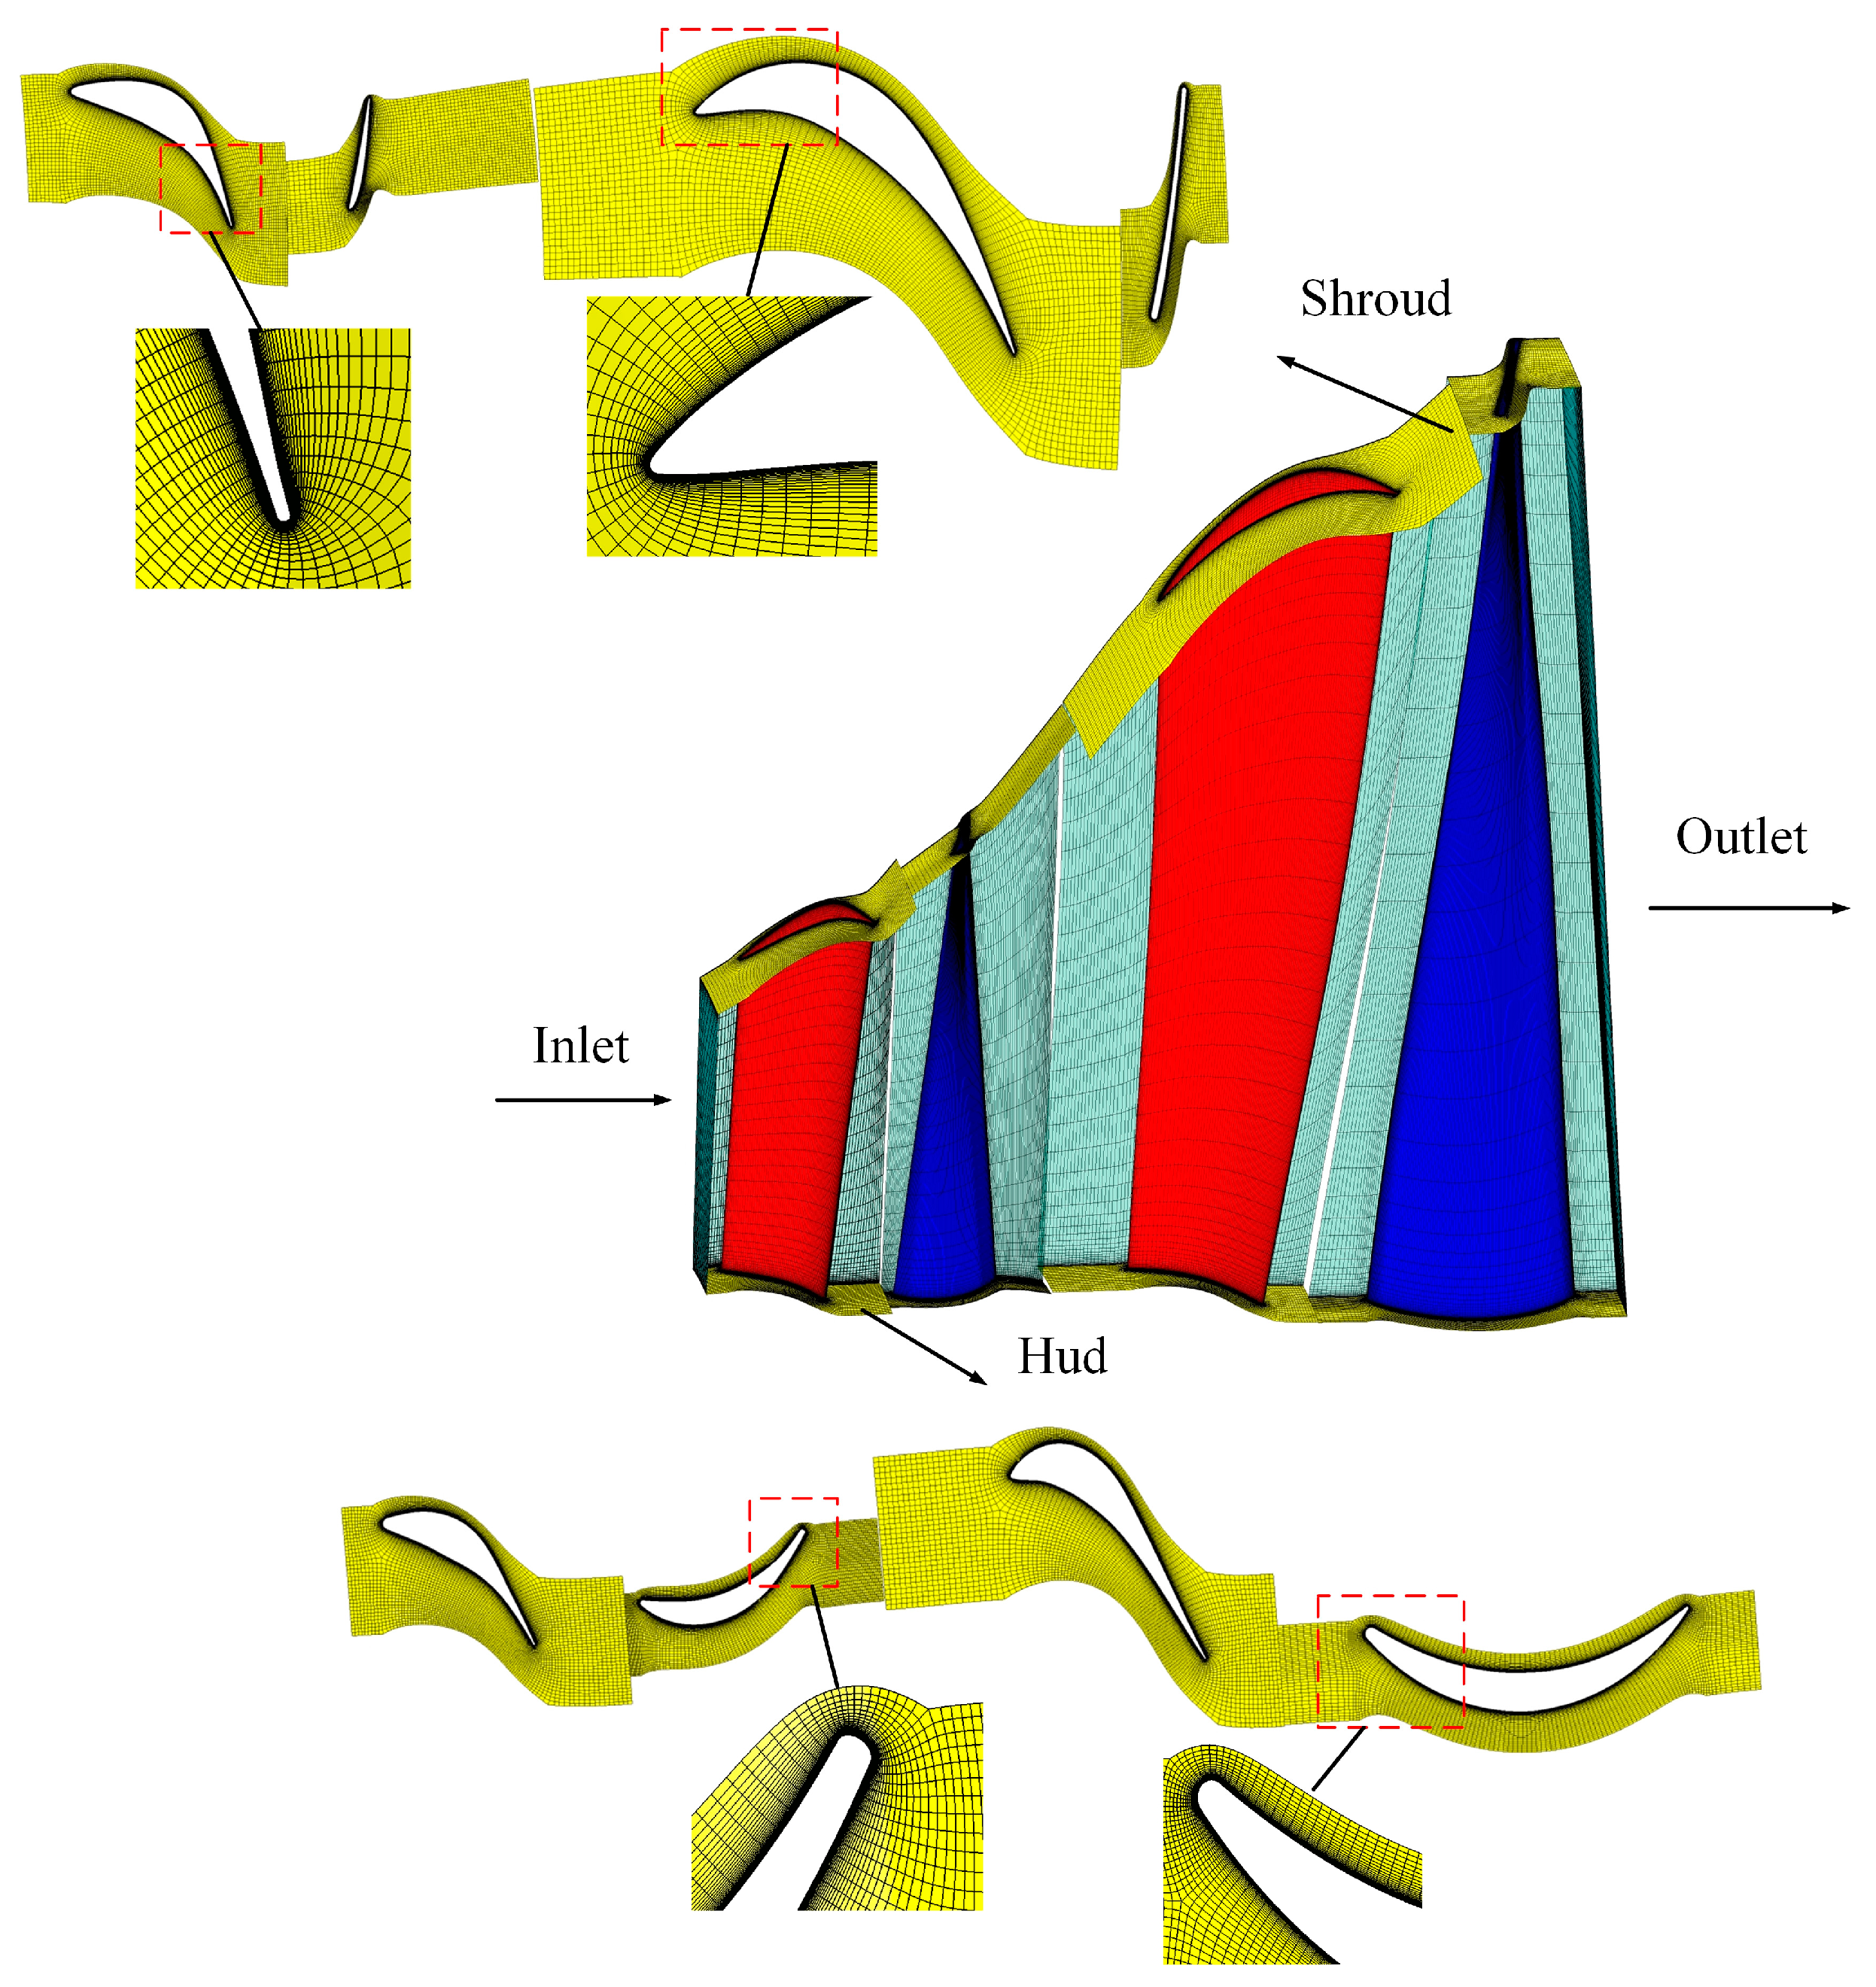
2.2. Grid Independence Verification

The ANSYS Turbogrid in ANSYS is used to mesh the physical model, whose grid around the blade is refined at the same time. The model grid is shown in Figure 2. The grid independence has been verified in reference [20], and the number of grids is chosen to be 6 million.

2.3. Wet Steam Condensation Flow Model

The wet steam condensation nucleation model adopts the Kantrowitz model modified by the non-isothermal effect [21,22]. The nucleation equation is shown in Equation (1):
J m = q c 1 + θ ρ c 2 ρ d 2 σ π m 3 e x p ( 4 π r * 2 σ 3 k T c )
where Jm is the nucleation rate of the droplets, qc is the condensation coefficient, ρc and ρd are the densities of the vapor and liquid phases, respectively, σ is the surface tension, m and r* represent mass and radius of the droplet, respectively, k is the Boltzmann constant, Tc is the gas phase temperature, and θ is the non-isothermal correction coefficient. The subscripts c and d are the vapor phase and the liquid phase, respectively.

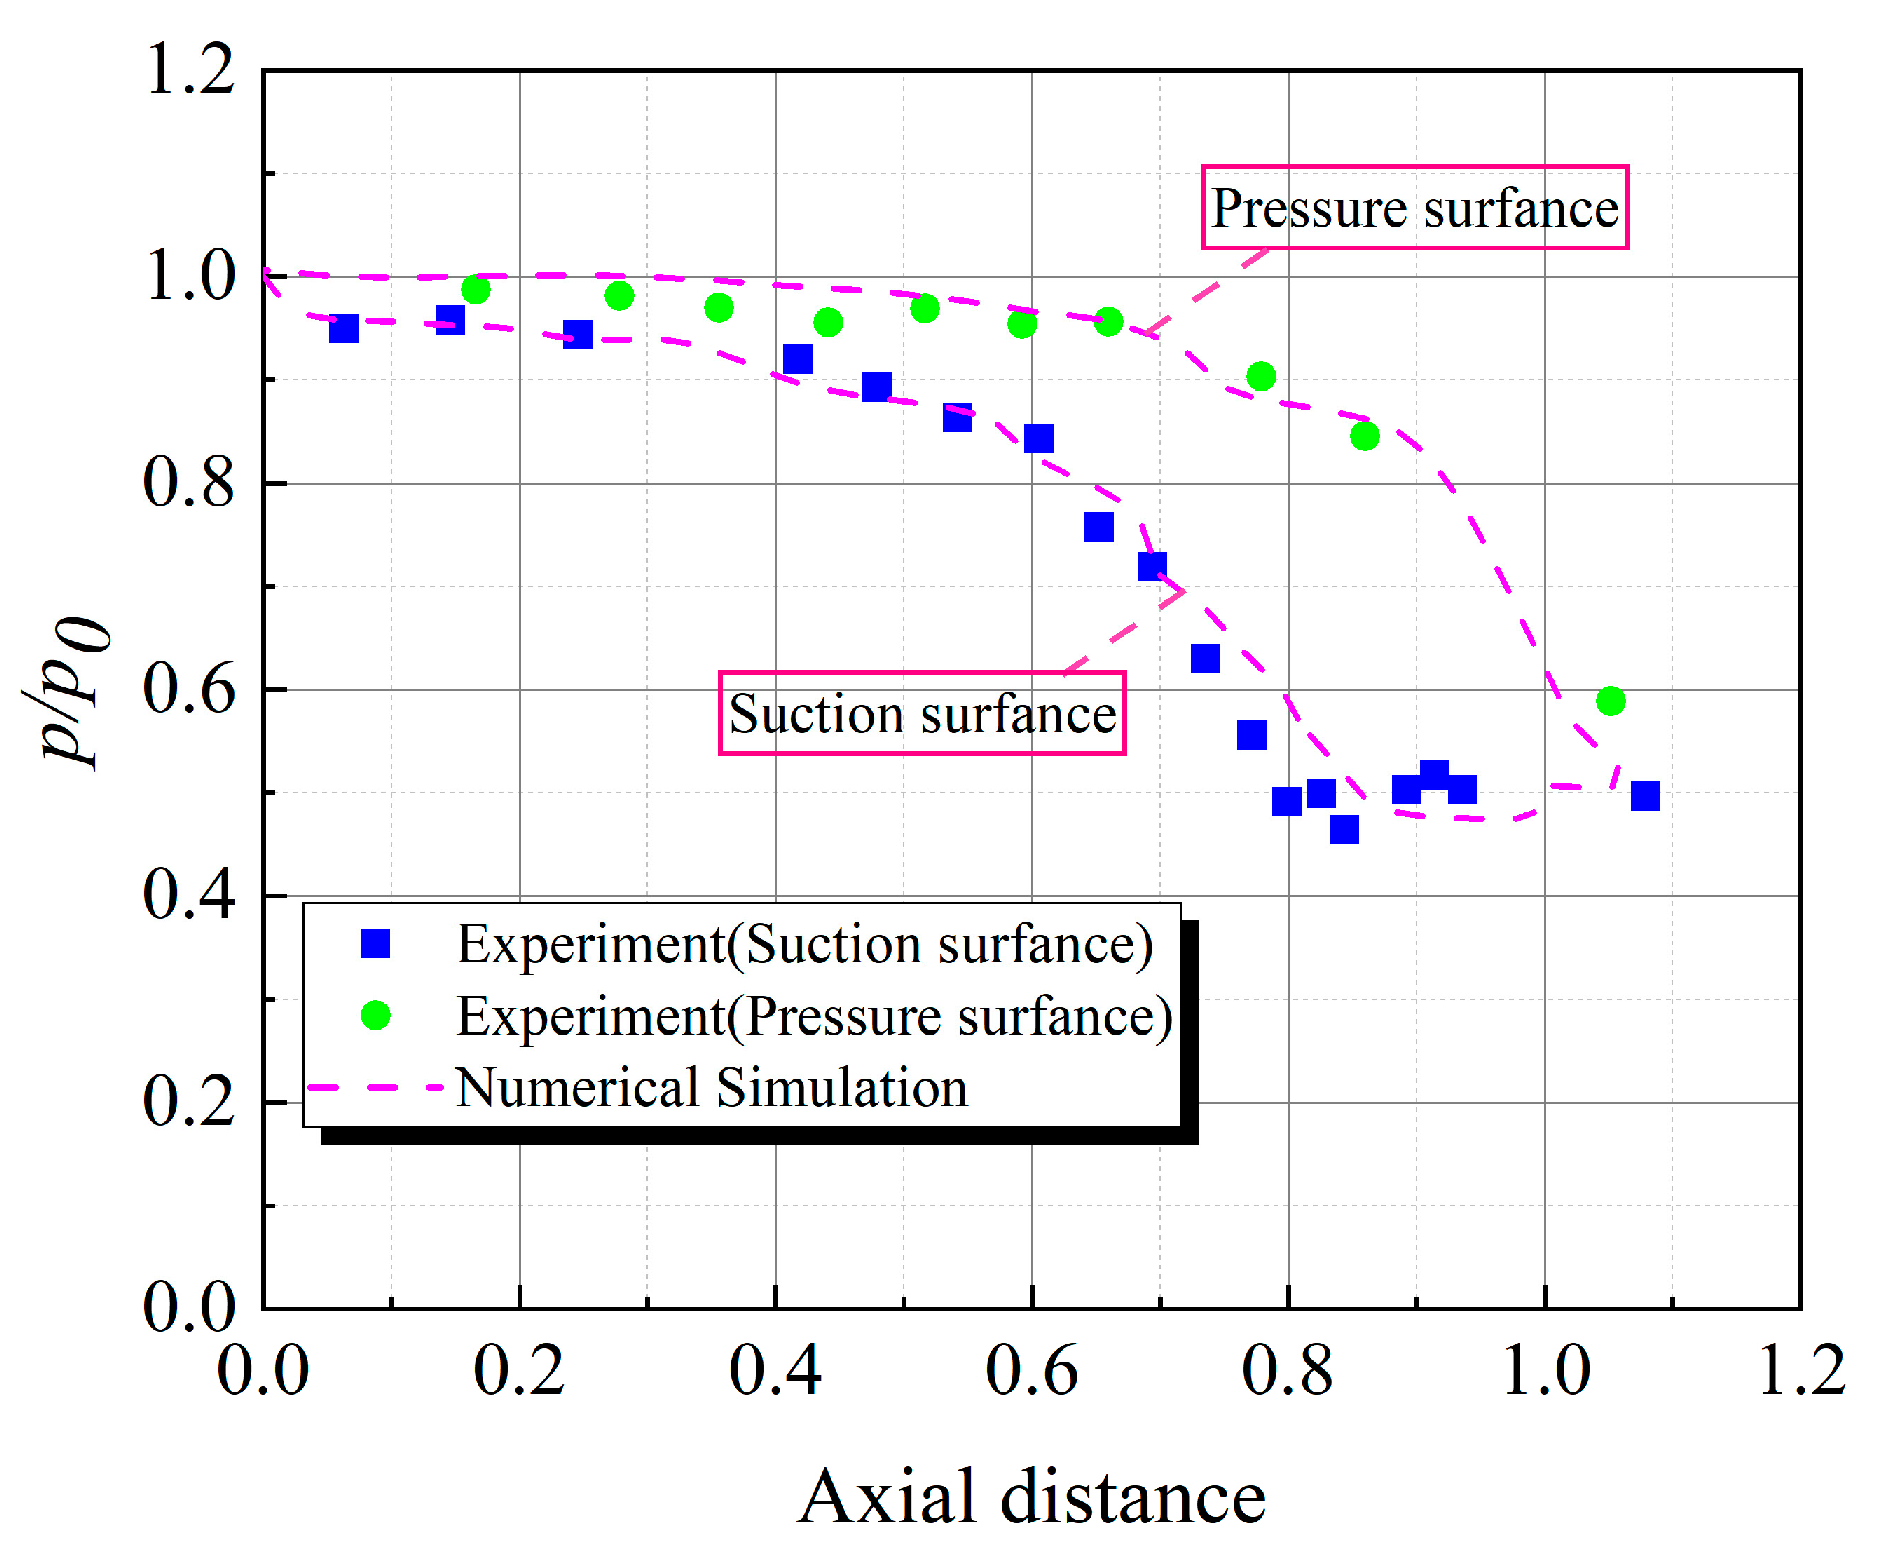
2.4. Mathematical Model Verification

In order to ensure the accuracy of results, the mathematical model used in this paper is verified. The simulation results in this paper are compared with the experimental data in reference [23]. First, the same physical model is built as the experimental object. The span, chord length, pitch, axial chord length, and inlet flow angel are 76, 35.76, 18.26, 25.27, and 0, respectively. Then, the same boundary conditions as the experimental conditions were set, and used the mathematical model for calculation in this paper. The inlet pressure and temperature were 172 kPa and 380.7 K, respectively. The outlet and inlet pressure ratio was 0.48.
The static pressure distributions on the suction side and pressure side of the blade obtained by numerical simulation are compared with the experimental results, as shown in Figure 3. It can be seen that the numerical results are basically consistent with the experimental results. Simultaneously, non-equilibrium condensation was used as the numerical calculation method, whereby a large number of studies have verified its accuracy [18,24]. Therefore, the mathematical model used is accurate in this paper, and the simulation results are also credible.

2.5. Wetness High Loss Composition

According to the different formation mechanisms, wetness loss can be divided into five types: thermodynamic, hydrophobic, water droplet, droplet impact, and centrifugal losses. In the process of steam flow, the proportion of water droplet resistance loss is negligible because the diameter of the primary water droplet is less than 1 μm. The hydrophobic and centrifugal losses can be ignored to account for a small proportion of the wetness loss, which has little impact on the unit [25,26,27]. Therefore, only two high wetness losses, thermodynamic loss and droplet impingement loss, were analyzed in detail.

2.5.1. Thermodynamic Loss

In the process of the condensation of wet steam in the steam turbine cascade channel, supercooling is caused by steam flow at a high velocity. After non-equilibrium condensation, nucleation leads to thermodynamic losses, which are inseparable from the supercooling value. The formula is shown in Equation (2) [27]:
Δ P h = Z 1 Z 2 L d Q 1 d Z Δ T T s d Z
where Z1 is the axial starting point coordinate of the turbine stage, Z2 is the axial endpoint coordinate of the turbine stage, L is the latent heat, Q1 is the mass flow rate, ∆T is the degree of supercooling, and Ts is the saturation temperature; 1 and 2 indicate start and end, respectively.

2.5.2. Water Droplet Resistance Loss

Under the action of steam flow, the water film deposited on the trailing edge of the stationary blade is torn and converges into larger diameter water droplets called coarse. These cannot efficiently pass through the cascade channel with the steam and impinge on the rotor blades. The rotor blades are inhibited, thereby consuming the mechanical work of the steam turbine and causing losses, known as water droplet impact losses. The formula is shown in Equation (3) [27]:
Δ P s = M ω R 1 R 2 P w l R R ( 1 α 2 ) d R
where M and ω represent the number and angular velocity of rotor, respectively, R1 is the radial coordinates of the blade root, R2 is the radial coordinate of the blade tip, lR is the axial direction in the radial direction brake length, and (1 − α2) and PW represent the volume fraction and hammer pressure of water, respectively.

3. Computational Results and Analysis

3.1. Thermodynamic Loss Distribution Characteristics under Different Steam Turbine Working Conditions

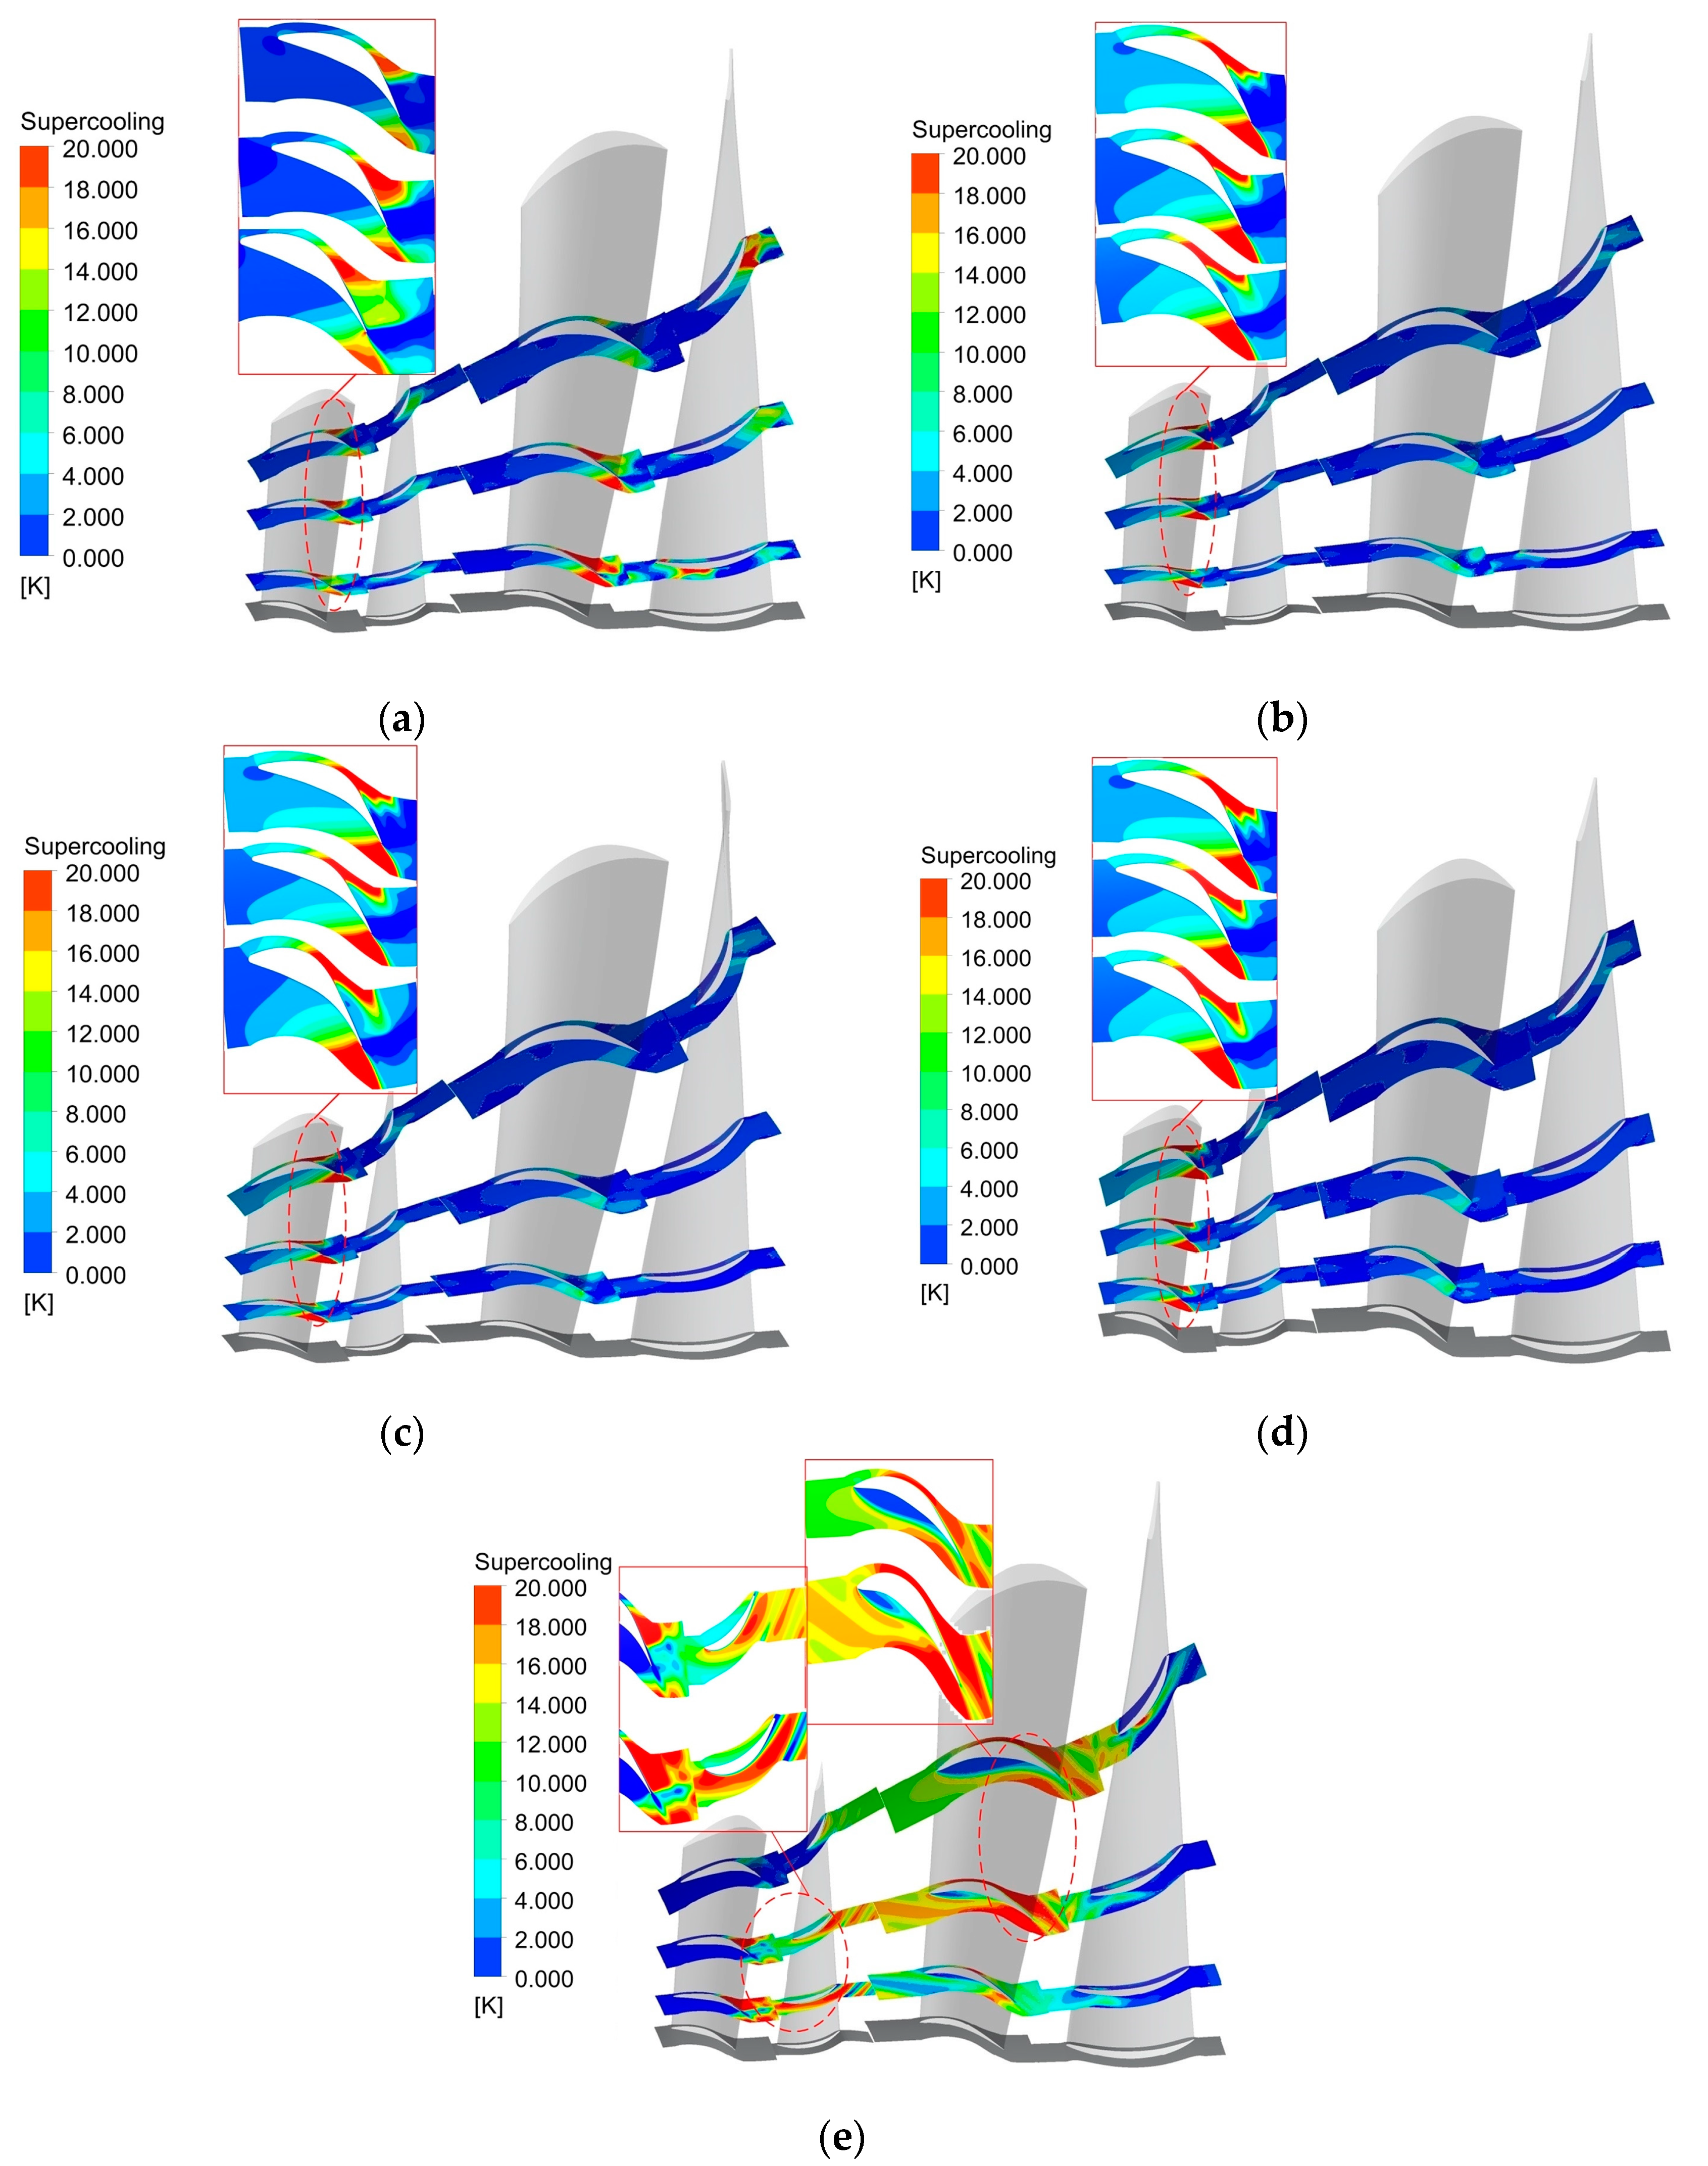
3.1.1. Distribution of the Supercooling Degree under Different Working Conditions

Figure 4 shows the distribution of the degree of supercooling under different working conditions. It can be seen from the figure that irrespective of the blade tip, 50% blade height, and blade root, the extreme value of the supercooling degree, whose value is 20 K, first appears at the trail end of the second-stage stator blades under the same working conditions. Subsequently, the supercooling value began to gradually decrease until it reached 0 K. Before reaching the extreme supercooling degree, the steam expands continuously in the low-pressure cylinder channel and gradually approaches the equilibrium point. The supercooling degree reaches the maximum value because the unbalanced degree of the steam reaches the extreme value. Therefore, this is an important factor affecting the thermodynamic loss, that is, the position where the thermodynamic loss is the largest. Subsequently, the steam expands rapidly at the large local curvature of the trailing edge blade on the coarse last pressure surface. The trailing edge of the pressure surface becomes the peak nucleation area under the action of the violent expansion of the steam flow. A large number of water droplets are generated in the flow channel with steam flow, which weakens the continuous accumulation of the imbalance. At this time, the supercooling value began to decrease until the supercooling value reached 0. With the flow of steam, the supercooling degree reaches a maximum at the trail end of the last-stage stator blades. However, different operating conditions corresponded to different extreme supercooling values. The steam reaches supersonic flow, which accelerates its own expansion rate, resulting in secondary nucleation of the last-stage stator blade, and the supercooling degree increases from zero to the peak again.

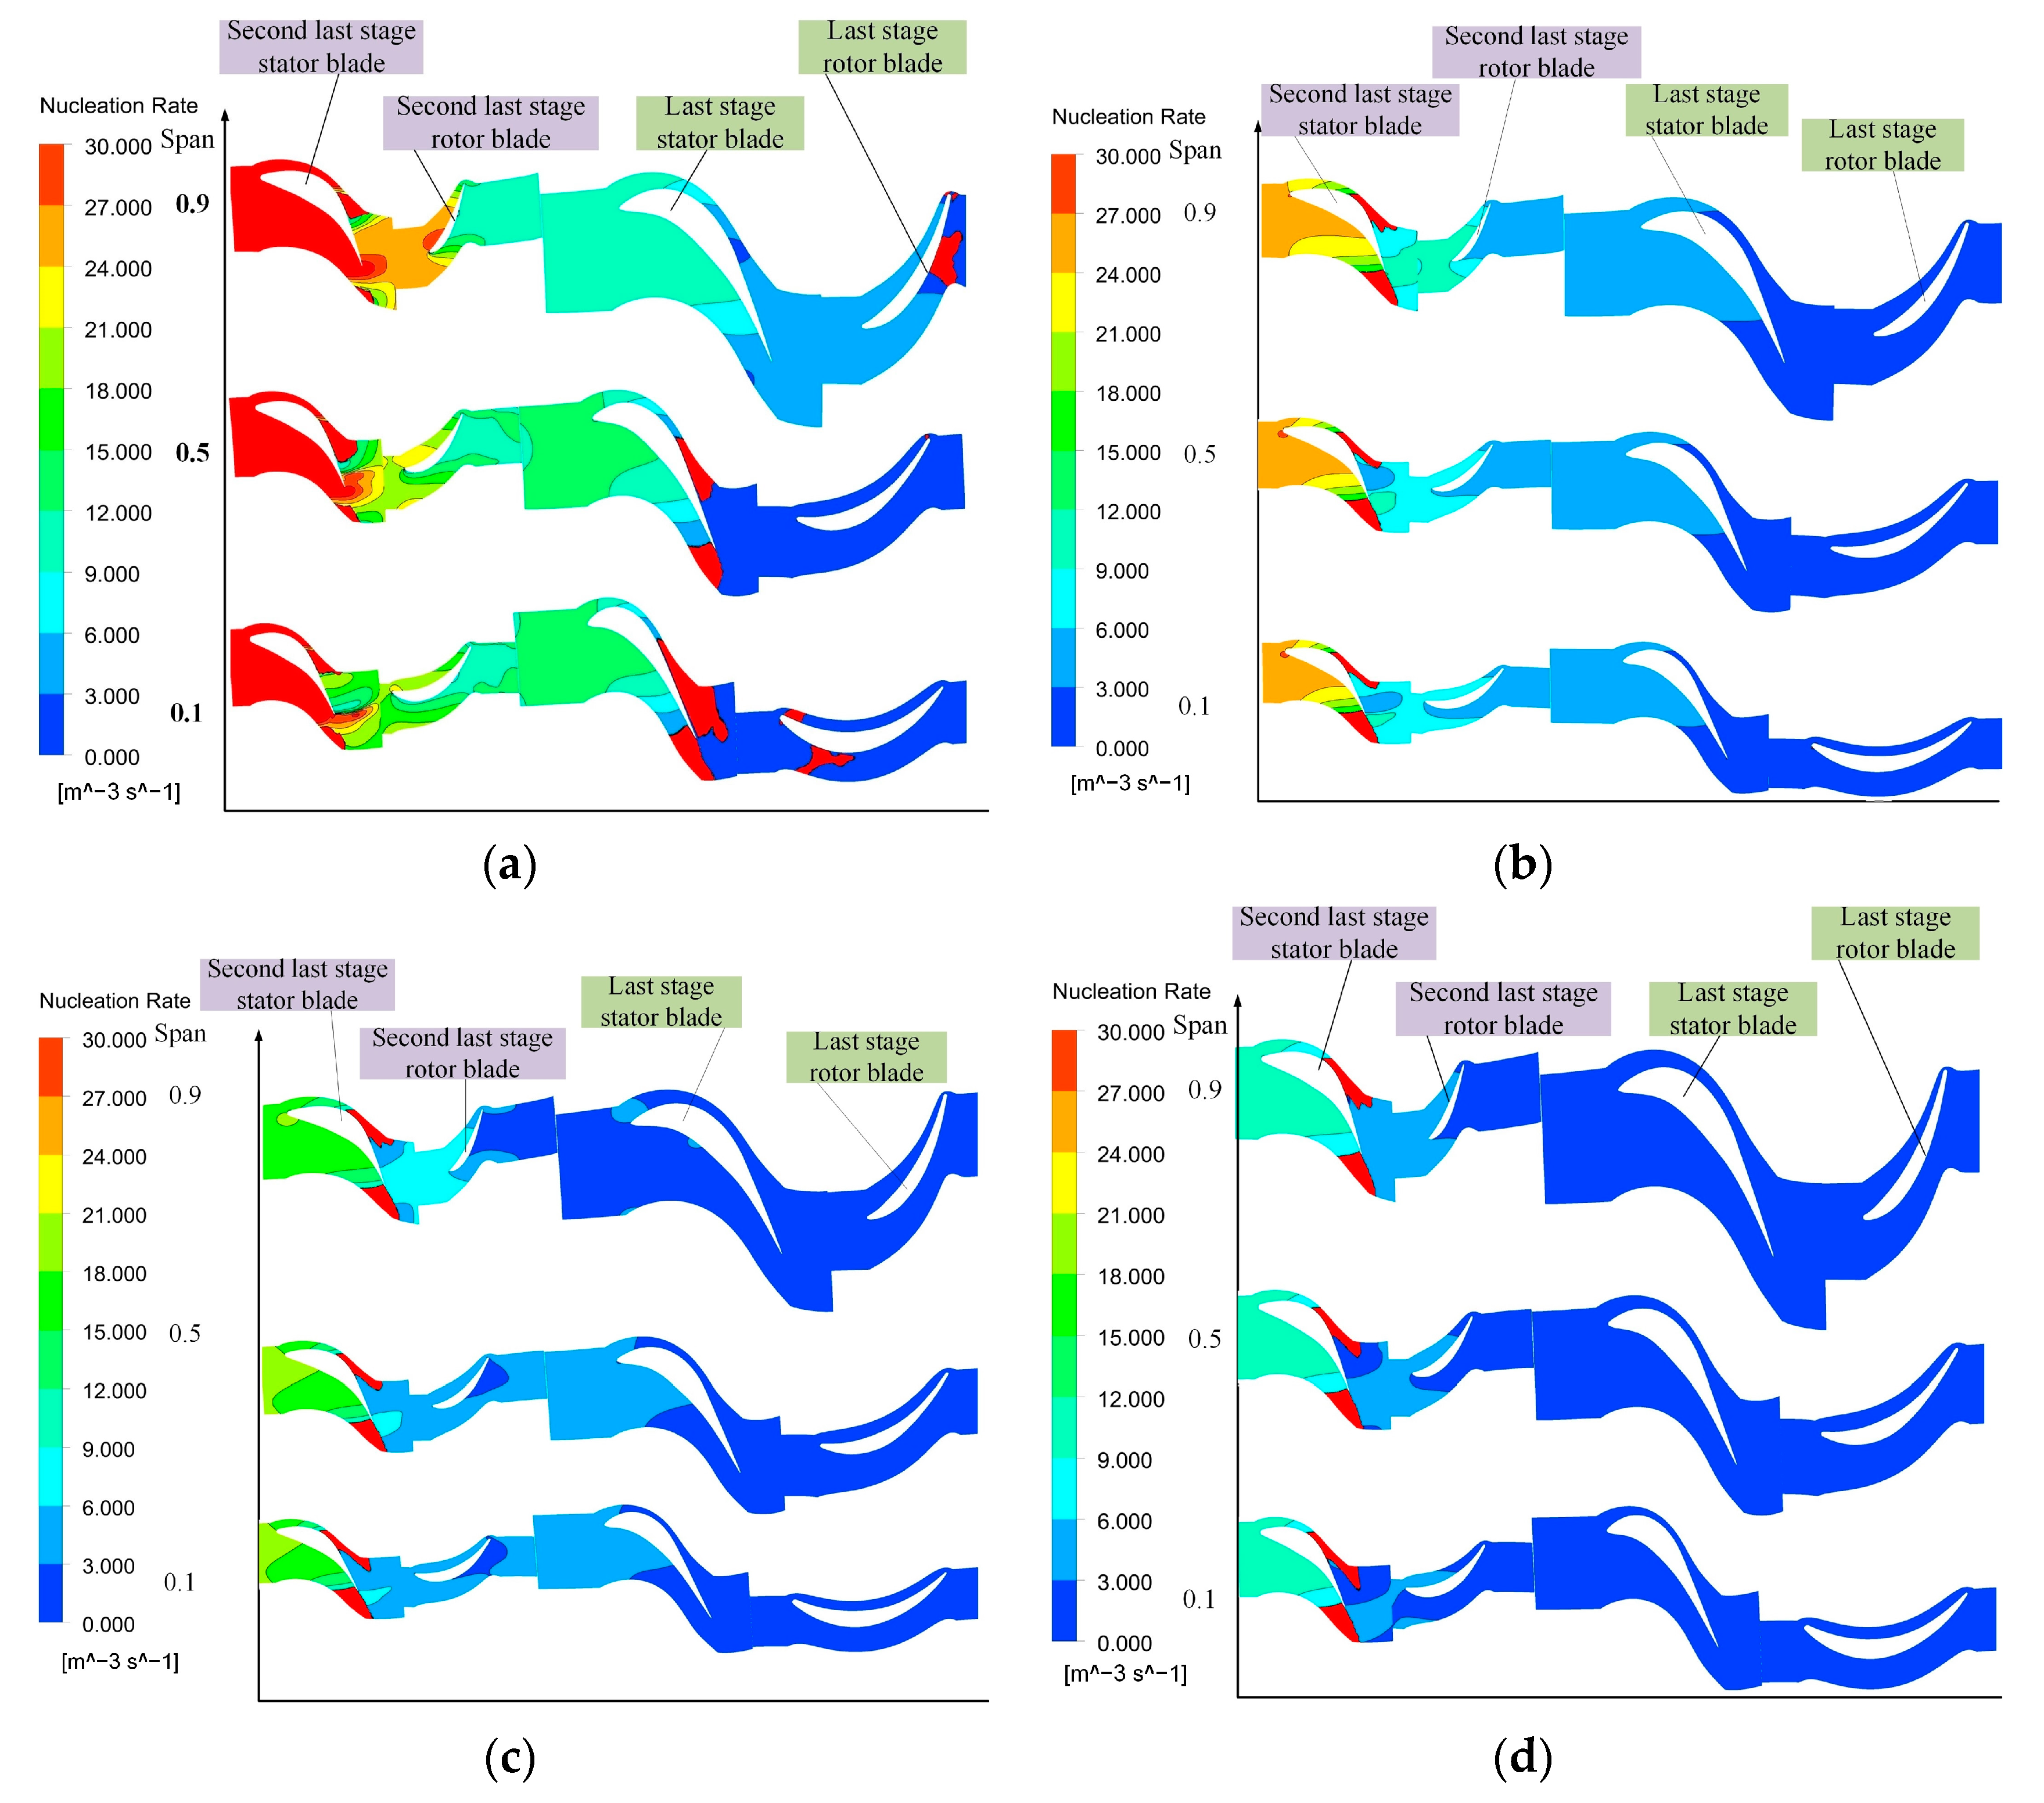
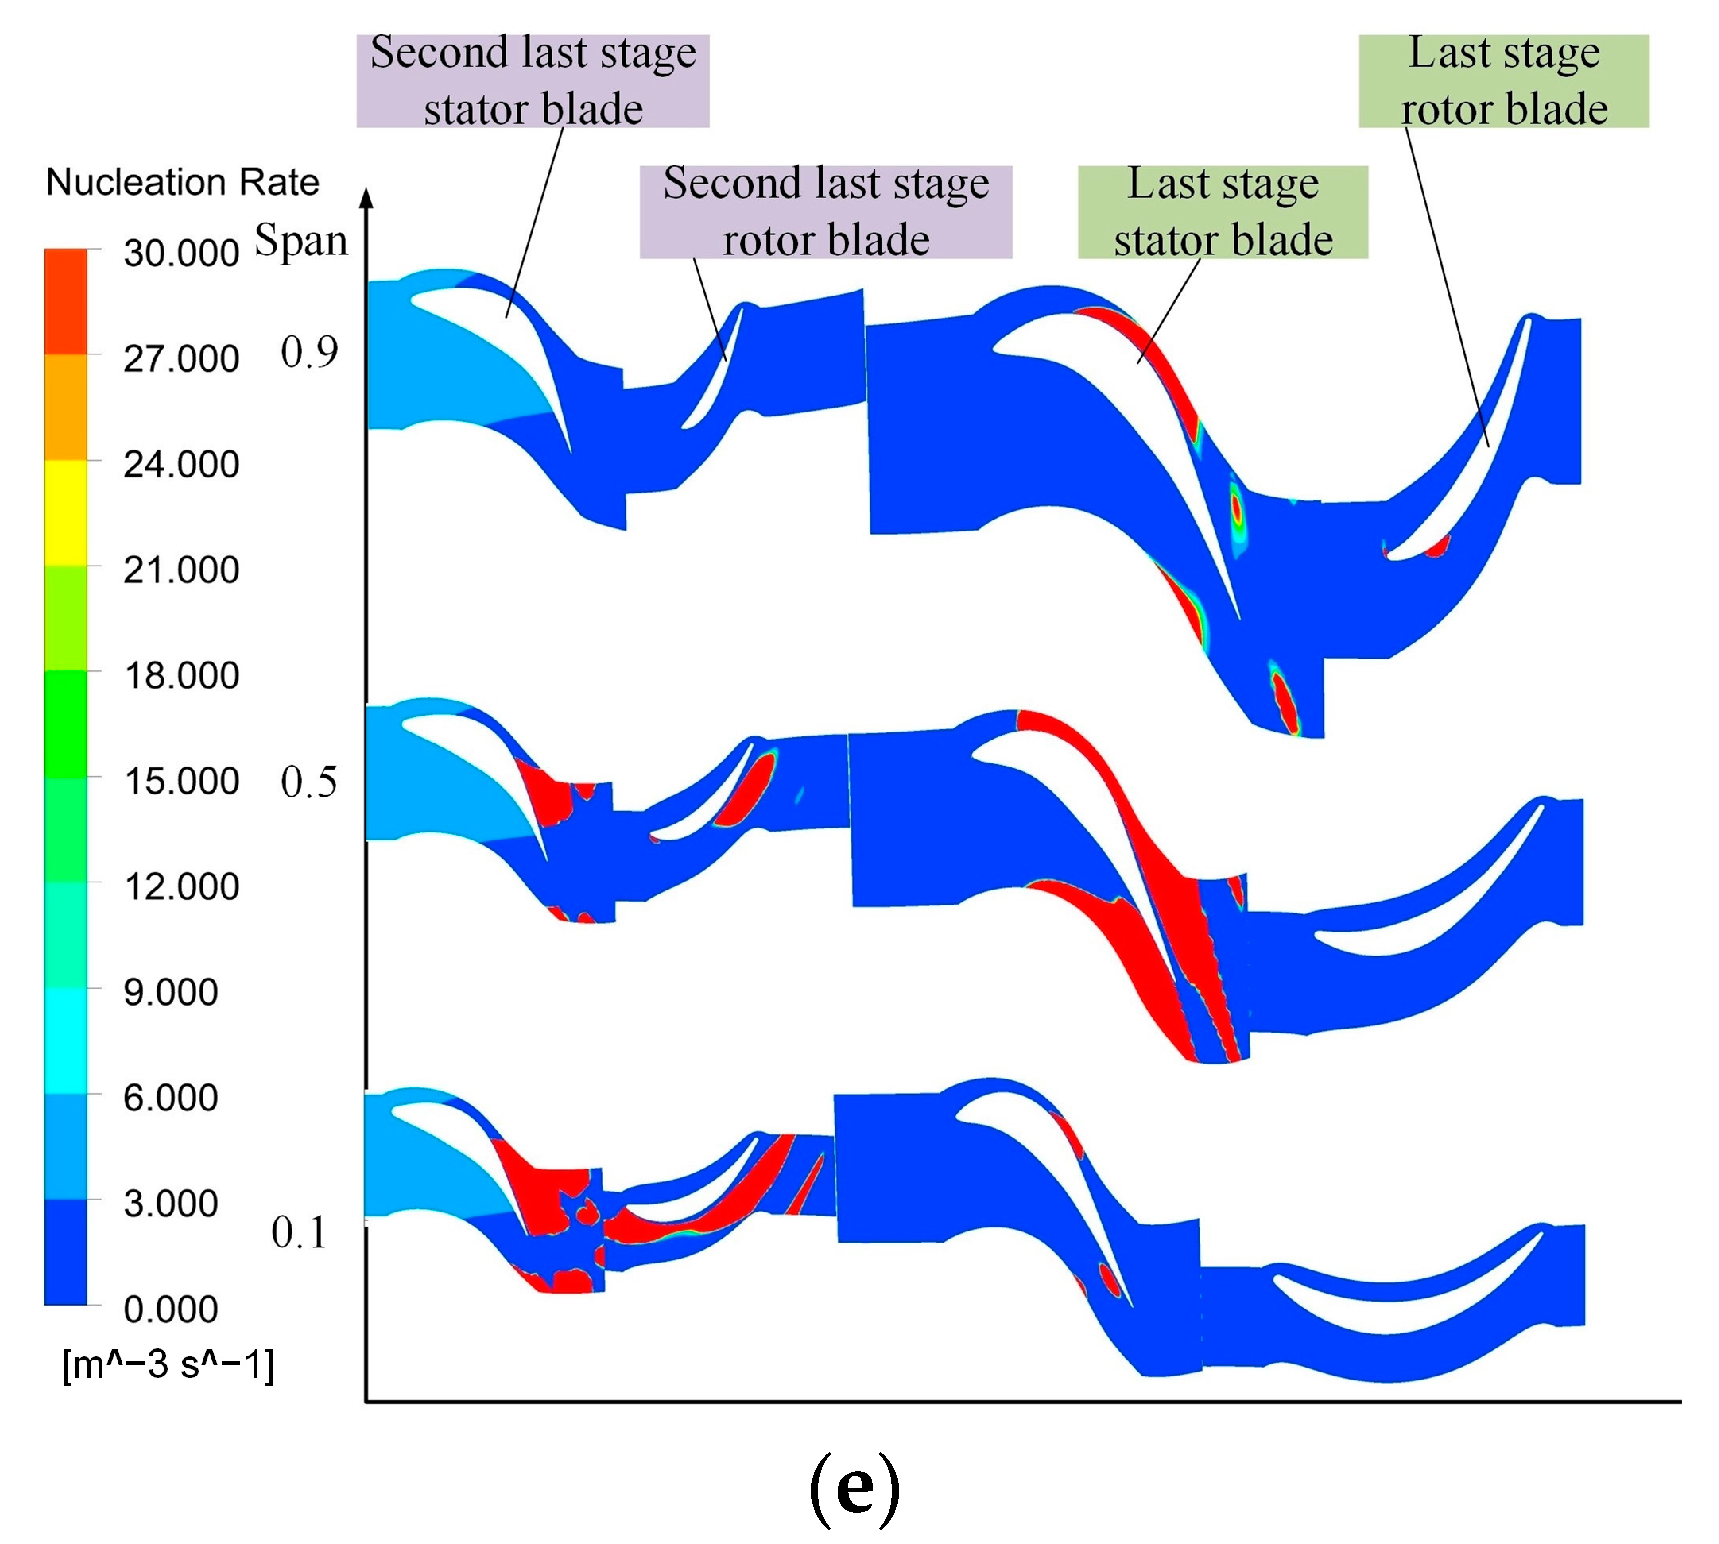
3.1.2. Nucleation Rate Distribution for the Last Two Stages of the Steam Turbine under Different Working Conditions

Figure 5 shows the distribution of the nucleation rate along the blade height of the steam turbine under different working conditions. From the above analysis, we know that the supercooling degree gradually increases starting from the second-last-stage stator blades and reaches the maximum value at the trail end of the second-last-stage stator blades. Therefore, a larger supercooling degree leads to the nucleation process of steam from the second-last-stage stator blades, where the peak position of the nucleation rate is also advanced. With an increase in the degree of supercooling, the area of the nucleation rate gradually increases, and the nucleation phenomenon becomes more intense. For five different working conditions, regardless of the blade tip, 50% leaf height, and blade root, the nucleation rate value at the second-last stage of the stator blade is the largest. The corresponding extreme values of the nucleation rate were 30 m−3 s−1, 27 m−3 s−1, 21 m−3 s−1, 9 m−3 s−1, and 6 m−3 s−1 under five working conditions. Subsequently, the supercooling degree begins to gradually decrease to 0 with a decrease in the nucleation rate. Simultaneously, the nucleation rate at the last stage of the stator blade increases again to 30 m−3 s−1 under the 20% THA condition. This is also because the value of the supercooling degree increases again to a peak value of 20 K under the 20% THA conditions. With a gradual decrease in the unit load, the peak value of the nucleation rate also gradually decreased by approximately five times from 30 m−3 s−1 in the 100% THA condition to 6 m−3 s−1 in the 20% THA condition. This is because the steam flow is not sufficiently expanded in the process of spontaneous condensation, which leads to the degree of supercooling not reaching the condensation condition. In addition, the nucleation rate decreased sharply with a decrease in the supercooling degree.
The above analysis of the distribution of the supercooling degree and nucleation rate shows that the maximum of the supercooling degree occurs at the trail end of the second-last-stage stator blades and the last-stage stator blades. This means that the thermodynamic losses in these two places are relatively large, owing to the large influence of the degree of subcooling on the thermodynamic loss. Combined with the analysis of the distribution of the nucleation rate, it was further proved that the thermodynamic losses in these two locations are the largest. Meanwhile, a decrease in the unit load resulted in continuous decrease in the supercooling degree and nucleation rate. Therefore, the thermodynamic losses also decreased as the unit load decreased.

3.2. Water Droplet Resistance Loss under Different Steam Turbine Working Conditions

The diameter distribution of the coarse water droplet has a great influence on the water droplets resistance loss. Therefore, it is necessary to obtain the diameter distribution of the coarse water droplets along the leaf height direction. The windage phenomenon occurs in the steam turbine under the working condition of 20% THA, which causes the temperature to rise in the last two stages. It could not be deposited on the trail end of the blade by a water film.
Hence, only the 100%, 50%, 40%, and 30% THA conditions were analyzed for water droplet resistance loss.
The maximum coarse water droplet diameter was calculated using Equation (4):
d max = W e σ ρ g ( u u p ) 2
where We is the critical Weber number, ρg and u represent the density and velocity of steam, up is the movement velocity of the water droplet, and dmax is the maximum coarse water droplet diameter. The subscript g stands for steam.
According to the results of the experimental measurement, the diameter of the coarse water droplets approximately satisfies the normal distribution law; thus, half of the maximum diameter is taken as the average diameter of the coarse water droplets [28].
The calculation formula is shown in Equation (5):
d ¯ = 1 2 d max
where d ¯ is the average diameter.

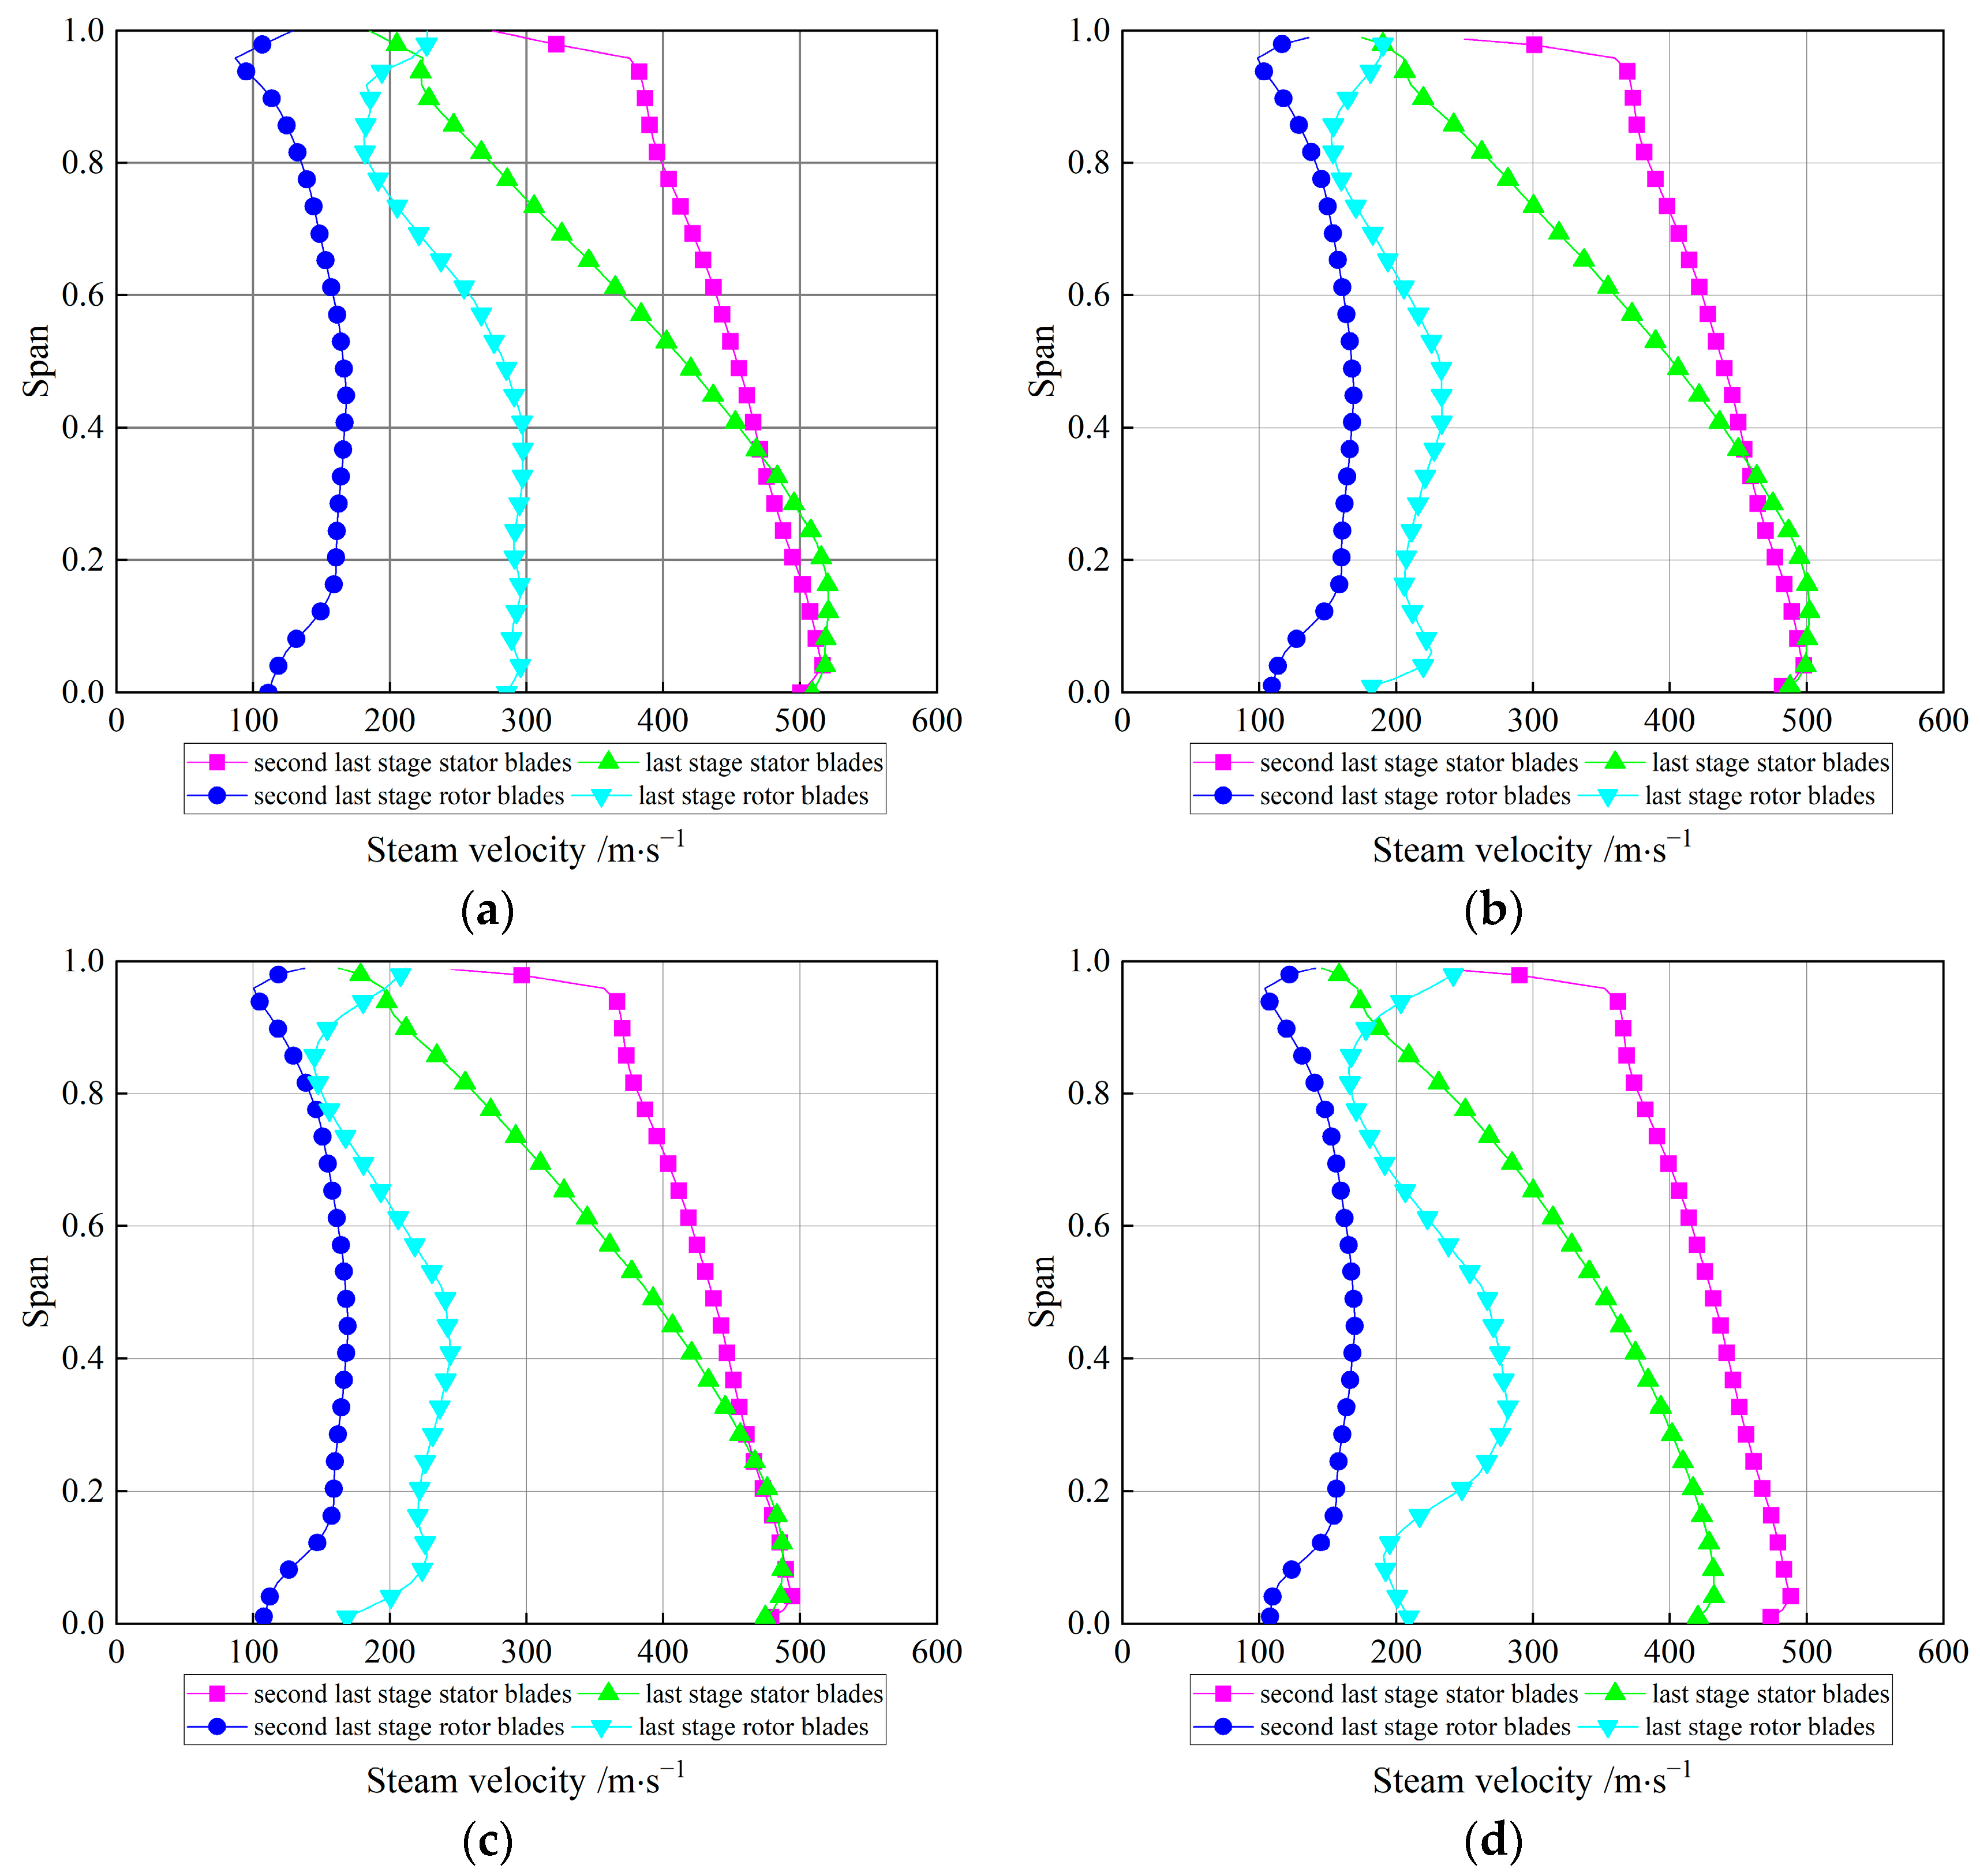
3.2.1. Velocity Distribution of Steam under Different Working Conditions

It can be seen from Equation (4) that the steam velocity needs to be obtained. As shown in Figure 6, it is the distribution of steam velocity in the last two stages of the steam turbine under different working conditions. For four working conditions, the value of steam velocity decreases gradually from the blade root to the blade tip, and the value ranges between 100 m/s and 500 m/s.

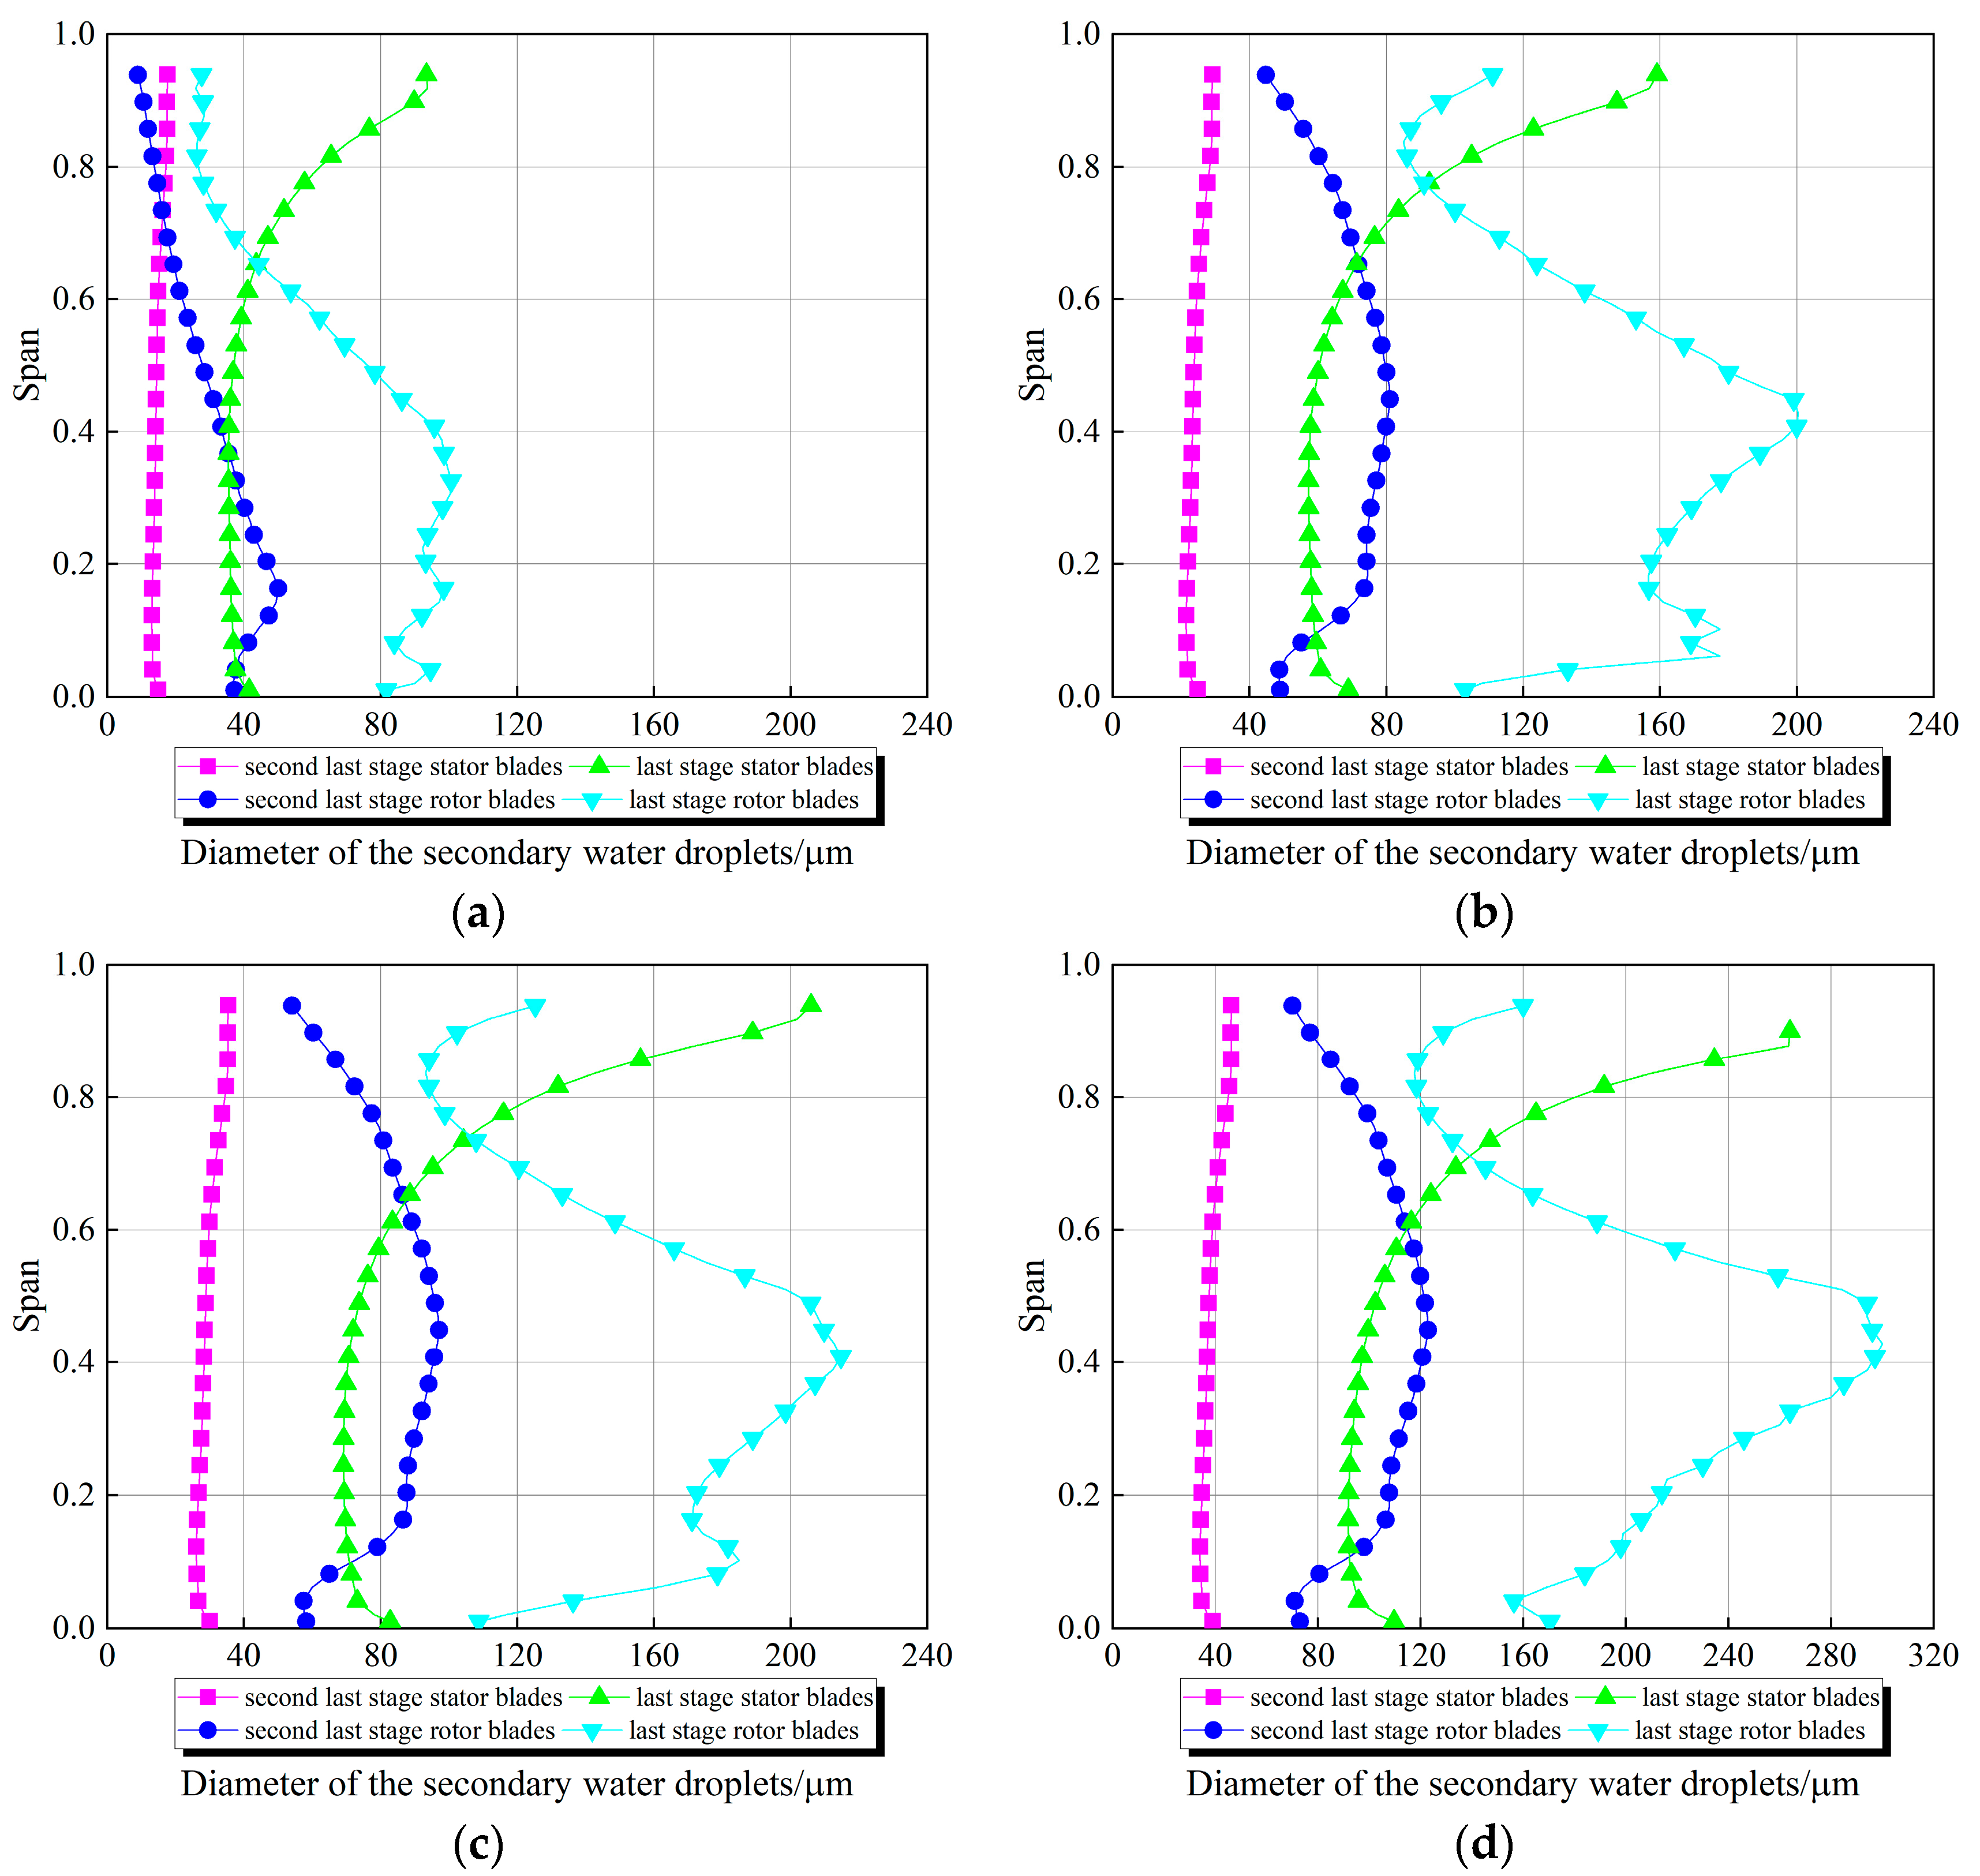
3.2.2. Diameter Distribution of Coarse Water Droplets in the Last Two Stages under Different Steam Turbine Working Conditions

When wet steam flows in the passages of the last two stage blades of the turbine, the velocity of the water droplets on the trailing edges of the last two stage stator blades is 0, and the velocity on the trailing edges of the last two stage rotor blades is equal to the rotation velocity of the blades. The diameter distribution of coarse water droplets can be obtained using Equations (4) and (5), as shown in Figure 7.
The water film deposited on the trail end of the blade begins to tear under the action of steam, and then converges to form coarse water droplets, whose diameter is larger, which has a greater impact on the turbine blades and is the key factor causing the water droplets resistance loss. Figure 6 shows the water droplets diameter distribution along the blade height with different working conditions. For the same working condition, the diameter of the stator blades increases from the root to the tip, whereas the diameter of the rotor blade increases from the root to 40% of the blade height; and from the tip to 40%, the leaf height is reduced.
Based on the above analysis, the maximum diameter of the coarse water droplets occurs at the tip of the last-stage stator blade and at 40% of the blade height of the rotor blade, which indicates that the water droplet resistance loss is the largest at these two locations. Simultaneously, as the unit loads decreased, the diameter of the coarse water droplets gradually increased. In other words, the corresponding water droplet resistance loss increased.

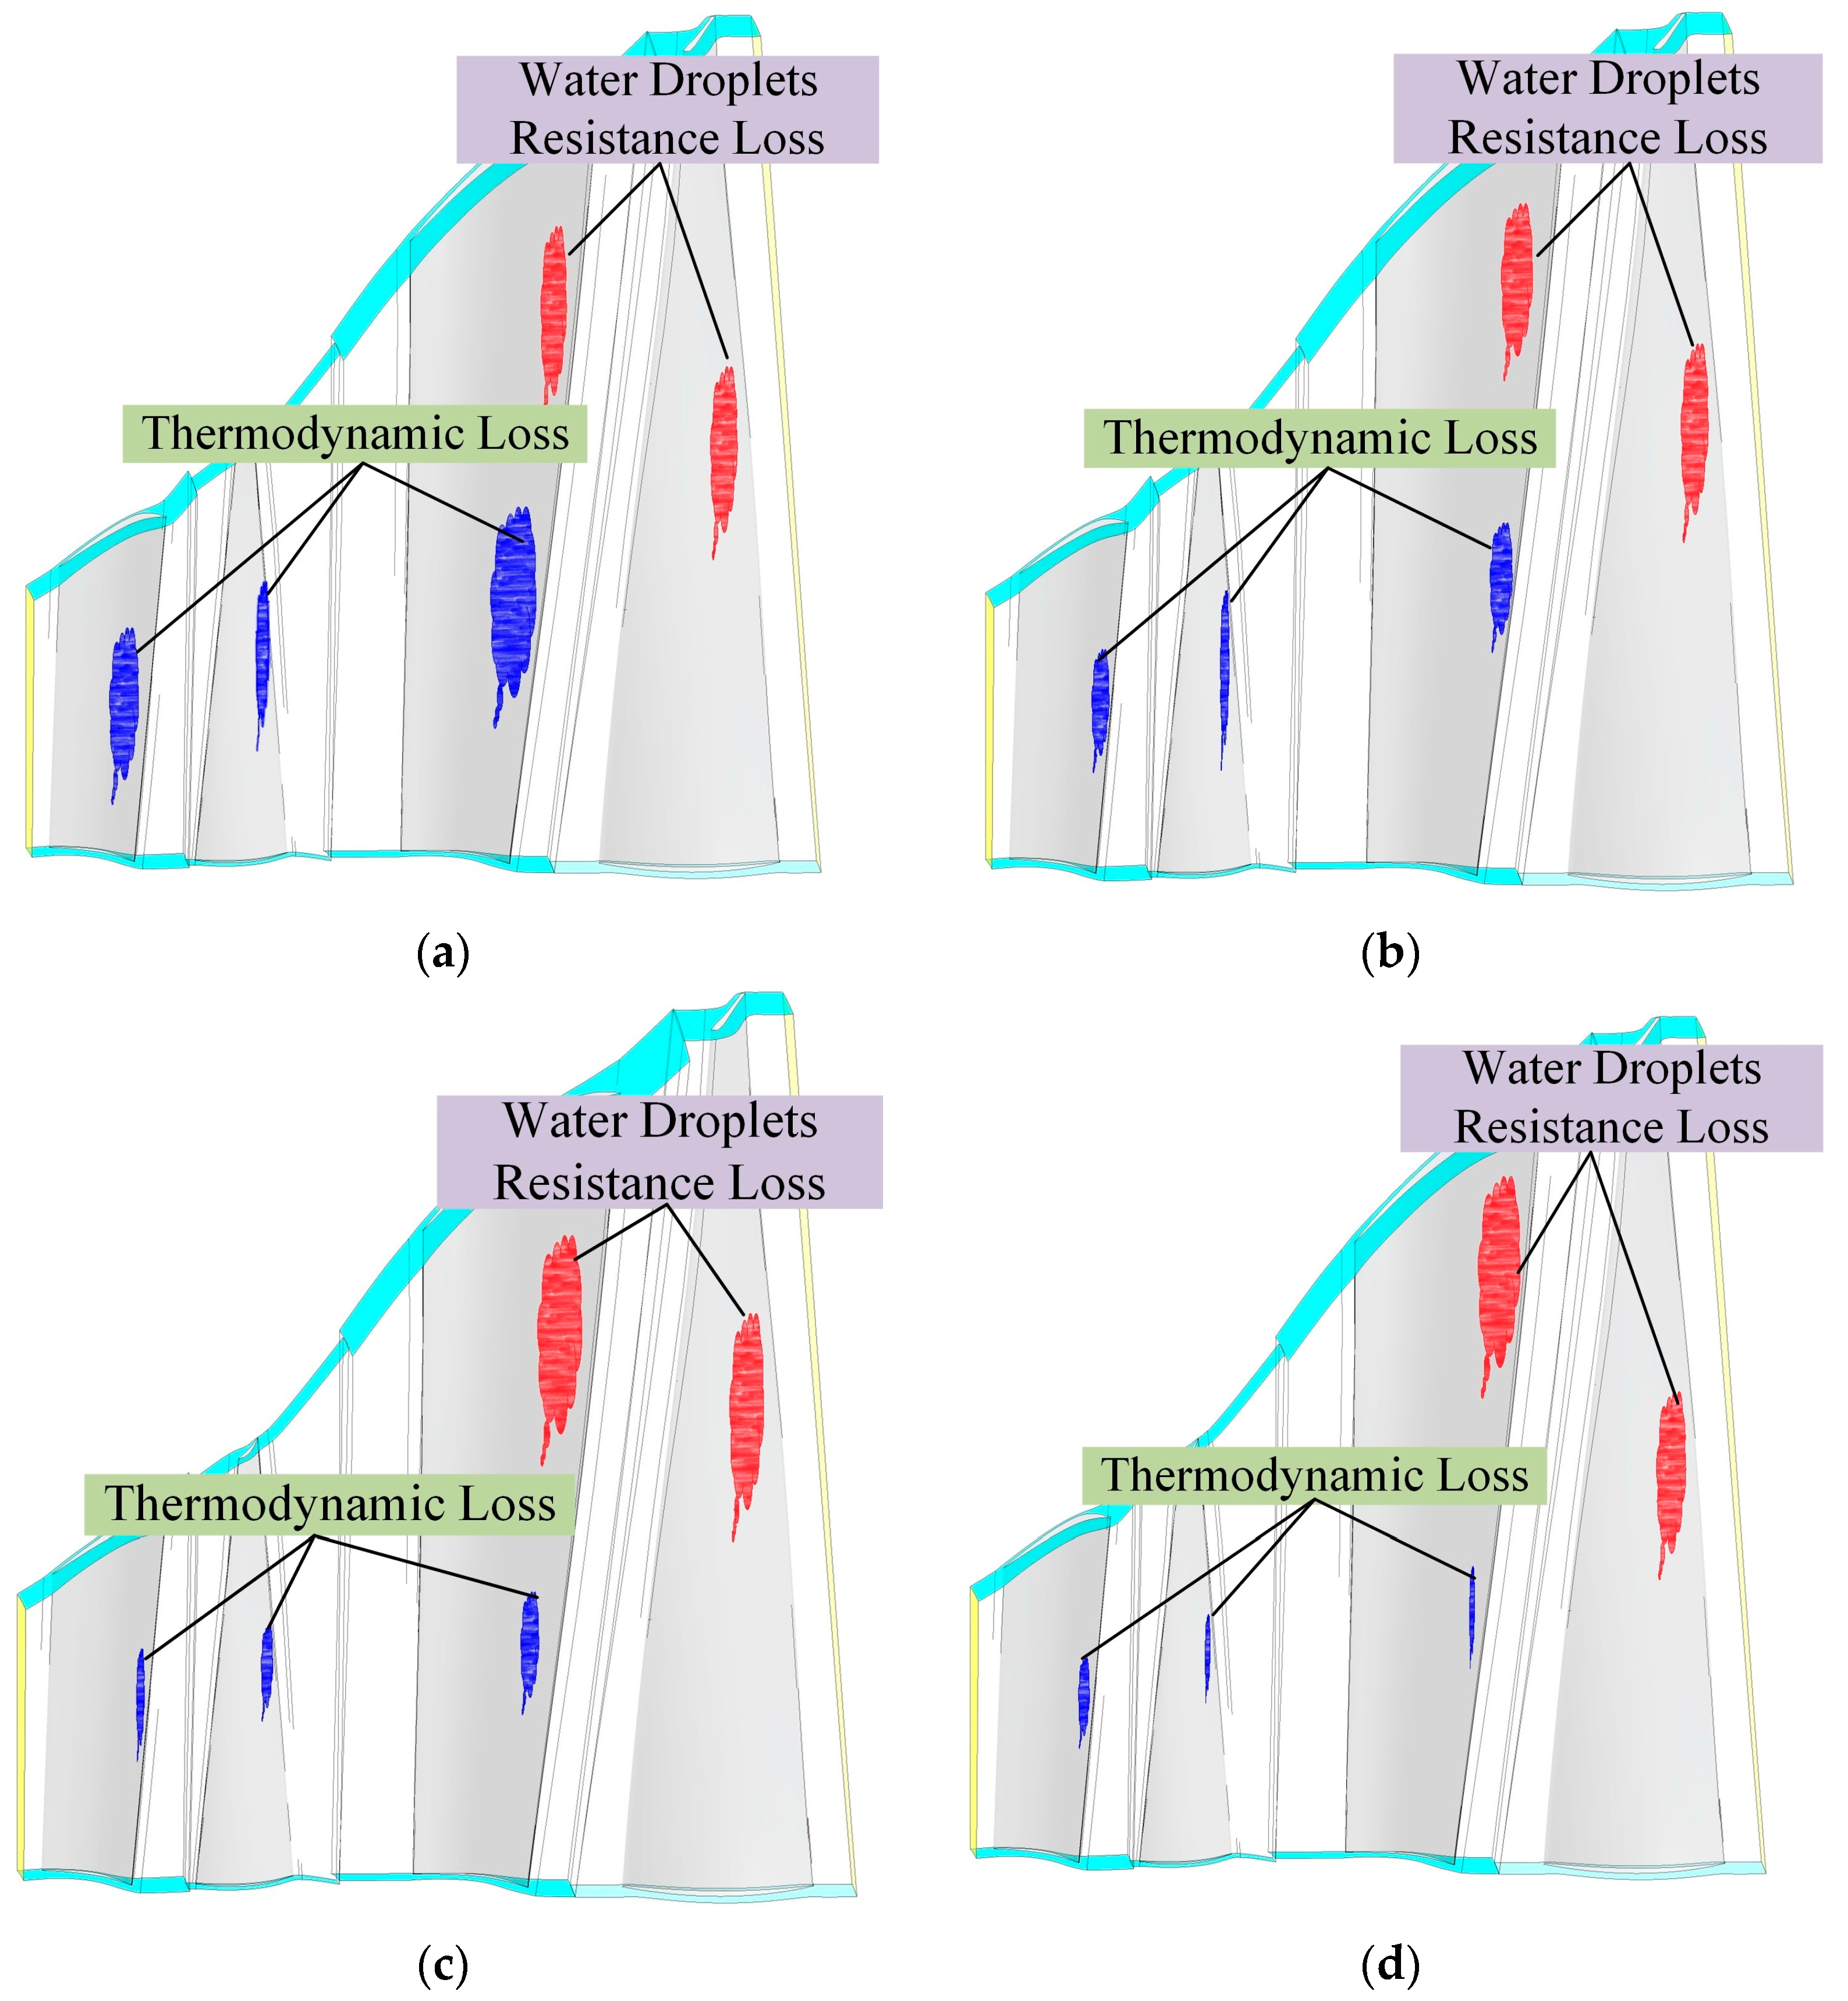
3.3. Analysis of High Wetness Loss Areas under Different Working Conditions

Figure 8 shows the distribution of the high wetness loss area of the steam turbine under different working conditions. The two major losses that make up the wetness loss are thermodynamic loss and water droplet resistance loss. The figure above shows the areas where these two major losses occur under different working conditions of the steam turbine. It can be seen from the figure that thermodynamic loss mainly occurs at the leading edge of the second-stage stator blades and the trail end of the last-stage stator blades. The water droplet resistance loss mainly occurs at 40% of the blade height and at the tip of the last-stage stator blades. Simultaneously, with a reduction in the unit load, the thermodynamic loss continues to decrease, but the water droplet resistance loss continues to increase.

3.4. Method of Controlling High Wetness Loss

After obtaining the distribution characteristics of the thermodynamic and droplet impingement losses, an effective method is proposed to control these two high moisture losses. Surface heating treatment is performed on the dynamic and static blade cascades in two stages at the end of the low-pressure cylinder of the steam turbine [29]. In this way, the growth rate of droplets is gradually reduced, and the condensation nuclei require a longer time to form droplets, thereby reducing the thermodynamic loss. At the same time, the reduction in the growth rate of water droplets leads to a smaller droplet radius, which in turn reduces the diameter of the secondary water droplet, and finally reduces the droplet impact loss.
The degree of supercooling and nucleation rate were analyzed. Consequently, the distribution of thermodynamic losses was obtained in the last two stages of the LPC under different working conditions of the steam turbine; the distribution of water droplet resistance losses was acquired by studying the diameter distribution of the coarse water droplets. The two regions of high wetness losses were analyzed and the following results were obtained: thermodynamic loss mainly occurred at the front end of second-stage stator blades and trailing end of the last-stage stator blades. The water droplet resistance loss mainly occurred at 40% of the blade height and at the tip of the last-stage stator blades. Moreover, with a reduction in the unit load, the thermodynamic loss continued to de-crease, but the water droplet resistance loss continued to increase.

4. Conclusions

Taking a 600 MW steam turbine as the research object, the nucleation phenomenon of wet steam was simulated. The distributions of the degree of supercooling, nucleation rate, and steam velocity were obtained, and the diameter distribution of the coarse water droplets was calculated. Finally, the distributions of the two wetness high-loss regions, namely, the thermodynamic loss and water droplet resistance loss, were obtained. The conclusions are as follows.
(1)
Regardless of the blade tip, 50% blade height, and blade root, the extreme value of the supercooling degree with a value of 20 K first appears at the trailing edge of the second-last-stage stator blades under the same working conditions. Subsequently, the supercooling value began to gradually decrease until it reached 0 K. The value of the nucleation rate at the second-last-stage stator blade was the largest. The corresponding extreme values of the nucleation rate were 30 m−3 s−1, 27 m−3 s−1, 21 m−3 s−1, 9 m−3 s−1, and 6 m−3 s−1 under the five working conditions. Subsequently, the value of the nucleation rate begins to decrease. However, the nucleation rate at the last stage of the stator blade increased again to 30 m−3 s−1 under the 20% THA condition.
(2)
For four working conditions, the value of steam velocity decreases gradually from the blade root to the blade tip, and the value ranges between 100 m/s and 500 m/s. The maximum diameter of the coarse water droplets occurs at the tip of the last-stage stator blade and 40% of the blade height of the rotor blade. At the same time, as the unit loads decrease, the diameter of the secondary coarse water droplets gradually increases.
(3)
Thermodynamic loss mainly occurs at the leading edge of the second-stage stator blades and trail end of the last-stage stator blades. The water droplet resistance loss mainly occurs at 40% of the blade height and at the tip of the last-stage stator blades. Moreover, with a reduction in the unit load, the thermodynamic loss continued to decrease, but the water droplet resistance loss continued to increase.

Author Contributions

All authors contributed equally for the investigation task and presented the article in its final format as full research work outcome. All authors have read and agreed to the published version of the manuscript.

Funding

This work was supported by the National Key R&D Program of China (Grant No. 2017YFB0902100) and the China Postdoctoral Science Foundation (Grant No. 2021T140154).

Informed Consent Statement

Not applicable.

Conflicts of Interest

The authors declare no conflict of interest.

References

  1. Wen, C.; Yang, Y.; Ding, H.; Sun, C.; Yan, Y. Wet steam flow and condensation loss in turbine blade cascades. Appl. Therm. Eng. 2021, 189, 116748. [Google Scholar] [CrossRef]
  2. Gribin, V.G.; Tishchenko, A.A.; Tishchenko, V.A.; Gavrilov, I.Y.; Sorokin, I.Y.; Alexeev, R.A. Experimental Study of the Features of the Motion of Liquid-Phase Particles in the Interblade Channel of the Nozzle Array of a Steam Turbine 1. Power Technol. Eng. 2017, 51, 82–88. [Google Scholar] [CrossRef]
  3. Tishchenko, V.A.; Alekseev, R.A. Numerically Simulating the Formation and Motion of Water Films and Erosion-Hazardous Droplets in Flow-Through Parts of Steam Turbines. Therm. Eng. 2019, 66, 830–838. [Google Scholar] [CrossRef]
  4. Li, L.; Feng, Z.; Li, G. Numerical Simulation of Wet Steam Condensing Flow with an Eulerian/Eulerian Model. Chin. J. Mech. Eng. 2003, 16, 156–159. [Google Scholar] [CrossRef]
  5. Senoo, S.; White, A.J. Numerical simulations of unsteady wet steam flows with non-equilibrium condensation in the nozzle and the steam turbine. In Proceedings of the Fluids Engineering Division Summer Meeting, Miami, FL, USA, 17–20 July 2006; Volume 47500, pp. 757–767. [Google Scholar]
  6. Han, X.; Han, Z.; Zeng, W.; Li, P.; Qian, J. Numerical simulation of wet steam transonic condensation flow in the last stage of a steam turbine. Int. J. Numer. Methods Heat Fluid Flow 2018, 28, 2378–2403. [Google Scholar] [CrossRef]
  7. Aliabadi, M.A.F.; Zhang, G.; Dykas, S.; Li, H. Control of two-phase heat transfer and condensation loss in turbine blade cascade by injection water droplets. Appl. Therm. Eng. 2021, 186, 116541. [Google Scholar] [CrossRef]
  8. Baumann, K. Recent Developments in Steam Turbine Practice. J. Inst. Electr. Eng. 1912, 48, 768–842. [Google Scholar] [CrossRef]
  9. Jaiswal, A.K.; Khandekar, S. Dynamics of a Droplet Impacting a Sessile Droplet on a Superhydrophobic Surface: Role of Boundary Conditions during Droplet Placement. J. Flow Vis. Image Process. 2021, 28, 69–89. [Google Scholar] [CrossRef]
  10. Zhan, Y.; Kuwata, Y.; Okawa, T.; Aoyagi, M.; Takata, T. Experimental Study on Coarse Droplets Produced During Liquid Jet Impingement onto A Horizon Solid Surface. Exp. Therm. Fluid Sci. 2021, 120, 110249. [Google Scholar] [CrossRef]
  11. Lopez-Gavilan, P.; Velazquez, A.; García-Magariño, A.; Sor, S. Breakup Criterion for Droplets Exposed to the Unsteady Flow Generated by An Incoming Aerodynamic Surface. Aerosp. Sci. Technol. 2020, 98, 105687. [Google Scholar] [CrossRef]
  12. Li, L.; Li, Y.; Wu, L.; You, W.; Li, J.; Feng, Z. Numerical Study on Condensing Flow in Low Pressure Cylinder of A 300MW Steam Turbine. In Proceedings of the Turbo Expo: Power for Land, Sea, and Air, Glasgow, UK, 14–18 June 2010; Volume 44021, pp. 2289–2296. [Google Scholar]
  13. Kawagishi, H.; Onoda, A.; Shibukawa, N.; Niizeki, Y. Development of Wetness Loss Models in Steam Turbines. Heat Transf.—Asian Res. 2013, 42, 651–664. [Google Scholar] [CrossRef]
  14. Starzmann, J.; Casey, M.; Sieverding, F. Non-Equilibrium Condensation Effects on the Flow Field and the Performance of a Low Pressure Steam Turbine. In Proceedings of the Turbo Expo: Power for Land, Sea, and Air, Glasgow, UK, 14–18 June 2010; Volume 44021, pp. 2199–2208. [Google Scholar]
  15. Joseph, J.; Subramanian, S.; Vigney, K.; Prasad, B.V.S.S.S.; Biswas, D. Thermodynamic wetness loss calculation in nozzle and turbine cascade: Nucleating steam flow. Heat Mass Transf. 2018, 54, 2521–2531. [Google Scholar] [CrossRef]
  16. Aliabadi, M.A.F.; Lakzian, E.; Jahangiri, A.; Khazaei, I. Numerical investigation of effects polydispersed droplets on the erosion rate and condensation loss in the wet steam flow in the turbine blade cascade. Appl. Therm. Eng. 2020, 164, 114478. [Google Scholar] [CrossRef]
  17. Yang, Y.; Peng, H.; Wen, C. A Novel Dehumidification Strategy to Reduce Liquid Fraction and Condensation Loss in Steam Turbines. Entropy 2021, 23, 1225. [Google Scholar] [CrossRef] [PubMed]
  18. Cao, L.; Wang, J.; Luo, H.; Si, H.; Yang, R. Distribution of condensation droplets in the last stage of steam turbine under small flow rate condition. Appl. Therm. Eng. 2020, 181, 116021. [Google Scholar] [CrossRef]
  19. Laksana, A.R.; Kokong, A.M.; Sigit, P.A.; Widjajanto, T.; Setiawan, H.; Djunaedi, I. Flutter Analysis of Last Stage Steam Turbine Power Plant Blade Through Transient Blade Row Simulation. In IOP Conference Series: Materials Science and Engineering; IOP Publishing: Atlanta, GA, USA, 2021; Volume 1096, p. 012093. [Google Scholar]
  20. Fan, S.; Wang, Y.; Yao, K.; Fan, Y.; Wan, J.; Gu, W. Research on Water Droplet Movement Characteristics in the Last Two Stages of Low-pressure Cylinder of Steam Turbine under Low Load Conditions. Front. Energy Res. 2021, 9, 798305. [Google Scholar] [CrossRef]
  21. Kantrowitz, A. Nucleation in Very Rapid Vapor Expansions. J. Chem. Phys. 1951, 19, 1097–1100. [Google Scholar] [CrossRef]
  22. Gyarmathy, G. Grundlagen Einer Theorie Der Nassdampfturbine; Jurisv-Erlag: Zürich, Switzerland, 1962. [Google Scholar]
  23. Ding, H.; Li, Y.; Lakzian, E.; Wen, C.; Wang, C. Entropy generation and exergy destruction in condensing steam flow through turbine blade with surface roughness. Energy Convers. Manag. 2019, 196, 1089–1104. [Google Scholar] [CrossRef]
  24. Han, Z.; Zeng, W.; Han, X.; Xiang, P. Investigating the dehumidification characteristics of turbine stator cascades with parallel channels. Energies 2018, 11, 2306. [Google Scholar] [CrossRef] [Green Version]
  25. Li, L.; Li, Y.; Xie, X.; Li, J. Quantitative evaluation of wetness losses in steam turbines based on three-dimensional simulations of non-equilibrium condensing flows. Proc. Inst. Mech. Eng. Part A J. Power Energy 2014, 228, 708–716. [Google Scholar] [CrossRef]
  26. Petr, V.; Kolovratnik, M. Wet steam energy loss and related Baumann rule in low pressure steam turbines. Proc. Inst. Mech. Eng. Part A J. Power Energy 2014, 228, 206–215. [Google Scholar] [CrossRef]
  27. Starzmann, J.; Casey, M.M.; Mayer, J.F.; Sieverding, F. Wetness loss prediction for a low pressure steam turbine using computational fluid dynamics. Proc. Inst. Mech. Eng. Part A J. Power Energy 2014, 228, 216–231. [Google Scholar] [CrossRef]
  28. Yang, B.; Xiang, Y.; Cai, X.; Zhou, W.; Liu, H.; Li, S.; Gao, W. Simultaneous measurements of fine and coarse droplets of wet steam in a 330 MW steam turbine by using imaging method. Proc. Inst. Mech. Eng. Part A J. Power Energy 2017, 231, 161–172. [Google Scholar] [CrossRef]
  29. Han, X.; Zeng, W.; Han, Z. Investigating the dehumidification characteristics of the low-pressure stage with blade surface heating. Appl. Therm. Eng. 2020, 164, 114538. [Google Scholar] [CrossRef]
Figure 1. Last two stages of the single-channel structure in the low-pressure cylinder of a steam turbine.
Energies 15 02527 g001
Figure 2. Last two stages of the structure grid and local grid enlargement in the low-pressure cylinder of steam turbine.
Energies 15 02527 g002
Figure 3. Comparison between numerical simulation results and experimental results.
Energies 15 02527 g003
Figure 4. The distribution of supercooling degree along the blade height of steam turbine under different working conditions. (ae), respectively, represent 100%, 50%, 40%, 30%, and 20% THA.
Energies 15 02527 g004
Figure 5. Distribution of nucleation rate along the blade height of steam turbine under different working conditions. (ae), respectively, represent 100%, 50%, 40%, 30%, and 20% THA.
Energies 15 02527 g005aEnergies 15 02527 g005b
Figure 6. Steam velocity under different working conditions. (ad), respectively, represent 100%, 50%, 40%, and 30% THA.
Energies 15 02527 g006
Figure 7. Diameter distribution of coarse water droplets along the blade height under different working conditions. (ad), respectively, represent 100%, 50%, 40%, and 30% THA.
Energies 15 02527 g007
Figure 8. Distribution of high wetness loss area under different working conditions. (ad), respectively, represent 100%, 50%, 40%, and 30% THA.
Energies 15 02527 g008
Publisher’s Note: MDPI stays neutral with regard to jurisdictional claims in published maps and institutional affiliations.

