Article

The Crude Oil International Trade Competition Networks: Evolution Trends and Estimating Potential Competition Links

1
School of Economics and Management, China University of Geosciences, Beijing 100083, China
2
School of Management, China University of Mining and Technology, Beijing 100083, China
3
Development Research Center of China Geological Survey, Beijing 100037, China
4
Teacher’s College, Beijing Union University, No. 5 Waiguan Oblique Street, Chaoyang District, Beijing 100011, China
5
School of Liberal Arts, Ludong University, 186 Middle Hongqi Road, Zhifu District, Yantai 264000, China
*
Authors to whom correspondence should be addressed.
Energies 2022, 15(7), 2395; https://doi.org/10.3390/en15072395
Submission received: 14 February 2022 / Revised: 15 March 2022 / Accepted: 18 March 2022 / Published: 24 March 2022
(This article belongs to the Topic Frontier Research in Energy Forecasting)

Abstract

:
In the context of the economic situation, international relations, and the consequences of COVID-19, the future competition pattern of crude oil trade is uncertain. In this paper, the crude oil international import competition and export competition networks are based on a complex network model. The link prediction method is used to construct a crude oil competition relationship prediction model. We summarize the evolving characteristics of the competitive landscape of the global crude oil trade from 2000 to 2019 and explore the reasons for the changes. Finally, we forecast the future potential crude oil import and export competition. The results indicate the following. (1) The crude oil import competition center is transferred from Europe and America to the Asia–Pacific region and it may continue to shift to developing regions. (2) At present, the competition among traditional crude oil exporters is the core of crude oil export competition, such as OPEC, Canada, and Russia. The United States has become the world’s largest crude oil exporter, which means that the core of crude oil export competition has begun to shift to emerging countries. The competition intensity of emerging crude oil exporters is gradually increasing. There is likely to be fierce export competition between traditional and emerging exporters. (3) In the future crude oil competition, we should pay attention to the trend of the United States, which may lead to the restructuring of the global oil trade pattern. Finally, this paper considers the exporters and importers and puts forward policy suggestions for policymakers to deal with the future global crude oil trade competition.

Graphical Abstract

1. Introduction

Crude oil is the lifeblood of national energy security. It has become one of the most traded commodities globally due to the uneven geographical distribution of crude oil resources, the imbalance of supply and demand, and the highly developed international trade [1]. Although clean energy is advocated internationally, crude oil consumption still accounts for the most significant global energy consumption [2] and maintains a low growth trend. Crude oil safety is an integral part of national security, and it has an overarching and strategic bearing on the economic development of each country. As crude oil is closely related to economic growth and geopolitics, the competition for crude oil has always been the international community’s focus [3]. Since the start of the 21st century, the international crude oil trade market has not been peaceful [4]. On the one hand, the rapid rise of the economies of Asian countries led by China and India has dramatically increased the demand for crude oil. The competition for crude oil resources between the East and the West is becoming increasingly fierce [5]. On the other hand, due to the exhaustion of crude oil in resource-endowed regions, the number of exporters is decreasing. However, the demand for importers is still increasing, which directly intensifies the crude oil import competition and leads to competition among exporters for export shares [6]. In addition, geopolitics, trade agreements, and political alliances are also essential factors [7]. For example, the current Russia–Ukraine war has led to a rise in oil prices and the cut-off of energy supplies, which has caused a series of chain reactions and added uncertainties to the development of the crude oil trade. Therefore, it is necessary to understand the crude oil trade pattern and competition situation. Moreover, it is crucial to accurately predict the future evolution trend of crude oil trade competition. It is of great significance for countries to adjust their policies and ensure the security of the crude oil supply.
At present, the research of crude oil trade patterns mainly focuses on three aspects, which are as follows. (1) The evolution trend of crude oil trade patterns. Existing studies have found that in the international crude oil trade, both major trading countries and trading communities have gradually shifted their crude oil trade focus from Europe and America to Asia [4,8]. (2) Research on the influencing factors. The influencing factors promoting the evolution of national and regional crude oil trade pattern mainly include oil reserves and social security [9], oil prices [10], the supply–demand relationship [11], technology and energy efficiency [12], distance [13], and geopolitics [14]. (3) Research on energy security issues brought by the evolution of crude oil trade pattern. Studies have found that as members of the international crude oil trading system become more and more stable, economic activities between countries will lead to fluctuations in crude oil demand [15]. Furthermore, the diversification of crude oil import sources is one of the most effective measures to ensure energy security and reduce supply risks [16,17].
In the analysis of international crude oil trade patterns and their evolution, complex network theories and models are relatively mature and advanced. The early complex network methods mainly studied the primary trade network of crude oil, focusing on the connotations and correlations between crude oil flow in the main topological indicators, such as network connectivity, betweenness centrality, and closeness centrality [18,19], and they analyzed the trade status and evolution of trading communities of countries in the network through trade performance [20]. However, trade networks pay more attention to the changes in trade volume and trade relations, but cannot reveal the hidden relations behind trade [21]. Therefore, some scholars have built derivative networks to analyze the deeper implications of trade. For example, the trade dependence network is constructed to analyze the degree of crude oil trade dependence of each country; it also provides a new way to study oil supply risk [22]. Another example is constructing a crude oil trade import competition network to analyze the competition between importers.
The existing research on competitive networks is all carried out from the perspective of import competition. However, the profound influence of crude oil exporters on trade patterns cannot be ignored. In 2016, OPEC reached an agreement to cut production. Some Middle Eastern exporters suffered energy sanctions, and the USA lifted its 40-year ban on crude oil exports in 2015. Crude exporters are changing, and so is the competitive landscape for exports. Therefore, a single research perspective on import competition can no longer fully predict the future crude oil trade competition pattern. It is necessary to study the future crude oil trade competition pattern from import and export perspectives. Based on this, this paper constructs the import competition network and the export competition network of international crude oil trade and studies the competitive trend of global crude oil trade from the two aspects of import and export.
Moreover, the existing research mainly focuses on analyzing past and current crude oil trade patterns and there is less research on the future potential trade competition relations. It is essential to evaluate the future evolution and timely adjustment of trade policies for exporters and importers. The trade gravity model is a conventional algorithm to estimate the potential trade volume between countries [23]. It can predict the future trade volume and price through the distance between countries [24], common language [25], and other influencing factors. However, it cannot effectively predict the potential trade relationship [26]. In addition, Vidmer et al. [27] adopted a recommendation method applied to e-commerce systems to predict the types of goods increasing in trade. By contrast, link prediction algorithms can predict future potential relationships based on network structure characteristics. As a predictive tool for future relations, the link prediction model is mainly used in the field of biological science [28], sociology, and psychology [29], and has been gradually used in the field of mineral resources and energy trade in recent years to help countries gain insight into the future trade pattern and find potential trading partners. Existing research involves the prediction of potential trade relations for crude oil [30], natural gas [31], cobalt ore [32], aluminum ore [33], and so on. The predicted results are divided into net importers and net exporters and summarize the rules of establishing trade relations, which can provide references for the government to find new trade partners according to each country’s import and export topological properties. However, there are shortcomings in this division method. Suppose that the net importer and net exporter are divided by the net volume of trade. In this case, it will lead to the loss of many potential competitive relations between countries with both export and import behaviors. Therefore, this paper redefines two competition intensity indexes of crude oil import and crude oil export based on the mineral competition intensity index from the importer’s perspective.
Overall, to grasp the global crude oil trade pattern and competition situation, and predict the future crude oil competition market trend, this paper analyzes the evolution trend of the past and present competition pattern by constructing the global crude oil trade import and export competition network. Then, we use the link prediction model to find the potential crude oil competition relationship. Based on the present situation and forecast results, this paper provides a reference and basis for adjusting the crude oil policy for all countries. The main contributions are as follows. (1) Based on the complex network method, we construct the competition intensity index and competitive network of crude oil international trade. In addition, we fully consider the influence of geopolitics and the economy on the evolution of crude oil trade competition patterns. Finally, we obtain a general conclusion about the characteristics of the competitive pattern and the reasons. (2) We establish a link prediction model to summarize the characteristics of the new oil competition relationship in the past 20 years and predict the new oil competition relationship in the future. (3) We fully consider the impact of geopolitical and institutional conflicts, and put forward suggestions from the perspective of exporters and importers, respectively.

2. Materials and Methods

2.1. Model of Crude Oil Trade Competition Network

First, we construct an undirected weighted Crude Oil Competition Network (COCN). The COCN was built with the set of G = V , E , in which the nodes V   v 1 , v 2 , v 3 v n represent the countries with crude oil import activities, as the network node of the import competition network; V v 1 , v 2 , v 3 v n represents crude oil exporters, as the network node of the export competition network. E e ij   represents the network competition edge, S ij   indicates the intensity of the competition between importers v i   and importers v j , and the premise of importers v i   and importers v j producing import competition is that they have a common source v p of imports that do not belong to the import competition network. The export competition relationship is the same. Both import and export competition relationships are expressed in Figure 1.
The crude oil import competitive network and export competitive network are both undirected weighted networks. Based on the index provided by Glick et al. [34], and referring to an index proposed by Wang et al. [35], which is used to measure the competition level of graphite trade resources, the competition intensity index of the crude oil import and export competition network is defined.
S ij = m W mi + W mj W w × 1 W mi W i W mj W j W mi W i + W mj W j × 100
where S ij   is the competition intensity between crude oil import sources   v i   and   v j , and m represents the common crude oil import source   v m .   W mi   represents the crude oil volume that importer v i imports from the common import source v m . Similarly, W mj represents the crude oil volume that importer   v j   imports from   v m .   W i   and   W j   represent the total import volume of importers   v i   and   v j   .   W w   is the world’s total crude oil import volume. In the export competition network, all indicators in the formula below represent export in crude oil export competition and will not be described in the following.

2.2. Link Prediction

The crude oil trade competition network can describe the past and present global oil trade import and export competition patterns intuitively. However, the information of the “hidden trade competition partner” in the future is what the countries focus on. However, this information cannot be directly obtained from the complex network. It requires the analysis of future potential trade relationships with link prediction.

2.2.1. Calculate the Stability of a Complex Network of Crude Oil Competition Networks

The stability coefficient is an essential factor in measuring a competitive network’s stability. We calculate the stability of the international crude oil import and export competition network for 2010–2019 using the autocorrelation function [36]. The calculation formula is shown in Equation (2).
Z f t = Q t 1 Q t Q t 1 Q t
Z f t represents the stability coefficient of the network node since the year of t,   Q t   represents the node set of all countries in the crude oil import competitive network in the year of t.   Q t 1   represents the node set of all countries in the crude oil competitive network in year t − 1.   Q t Q t 1   represents a common collection of nodes in the years of t and t − 1. Q t 1 Q t represents the set of national nodes that appear in year t and year t − 1. The greater the value of   Z f t   is, the higher the stability of national nodes in the crude oil international trade network is.

2.2.2. Main Algorithm of the Link Prediction Model

The core of the link prediction model is to select a suitable prediction algorithm. At present, the similarity-based algorithm is the mainstream of link prediction [37], including CN, AA, RA, and PA, which are four algorithms. CN is generally considered the most effective indicator for assessing the linking probability of most subjects [38]. AA has been proven to be more effective than other algorithms in describing potential relationships of networks [39]. Zhou et al. [38] proposed that RA had a better prediction effect than CN and AA. PA is widely used to explore potential relationships that may appear in the future in network dynamics [40]. The formulas are as follows.
(1)
CN algorithm
Common neighbors are directly explained as the two nodes being similar if more common neighbor nodes exist between two particular nodes in a complex network. In the link prediction model, there are two calculation methods of the CN algorithm. One is the powerless CN algorithm without weight, and other is the weighted CN algorithm. Specific algorithms are shown in Formulas (3) and (4).
P xy CN = Γ x Γ y
In the crude oil import competition network, x   and   y   represent two competing countries in the crude oil import or export competition network,   Γ x   represents the import with x rival state collection,   Γ y   represents the import competitive relationship with   y   national collection,   Γ x Γ y represents the combination of countries competing with   Γ x   and   Γ y   for imports. The more indirect competition that exists between two importers, the greater the possibility of direct competition between them.
P xy CN = z Γ x Γ y w ( x , z ) α + w ( y , z ) α 2
In the import competition network,   z   is the common import competition country of importing country   x   and   y , and w x , y is the competition intensity   S ij   between importing country   x   and the import competition country   z . According to the weak connection effect, weakly connected edges with smaller weight may have a greater contribution to the prediction of future connected edge generation. Therefore, we defined an exponent   α   based on the competition intensity, through the evaluation of   α   to determine the role of competition intensity in the future edge prediction. When   α = 1 , the competition intensity plays a full role in future edge prediction. When   α = 0 , the competition intensity does not play any role, and the competitive network is an undirected network without authority. When   α < 0 , the larger the competition intensity is, the smaller the contribution to edge prediction is.   α has the same meaning below.
(2)
AA algorithm
The principle of the Adamic Adar algorithm is that the contribution of the common neighbors of a point with a smaller degree to future edge prediction is greater than that of the common neighbors of a point with a larger degree. In the crude oil competition network,   k z   is the degree value of the co-competing country. In formula   P z = i Γ z w z , i ,   i represents the country in direct competition with z ;   α   is given a detailed explanation in the CN algorithm.
P xy AA = z Γ x Γ y 1 log k z
P xy AA = z Γ x Γ y w ( x , z ) α + w ( z , y ) α log ( 1 + P z )
(3)
RA algorithm
RA is similar to the AA index. There are no two interconnected nodes   v x   and v y   in the network.   v x   can transmit some information to   v y   through the intermediary, and the proportion of information   v y   receives is the similarity between   v x   and   v y . The most significant difference between the RA and AA indexes lies in the weights assigned to the common neighbor nodes. The competitive network with a large average degree and weight may have a better prediction effect.
P xy RA = z Γ x Γ y 1 k z
P xy RA = z Γ x Γ y w ( x , z ) α + w ( z , y ) α P z
(4)
PA algorithm
What the preferred dependency algorithm expresses is that the possibility of establishing competitive relations between two importing countries is proportional to the product of the number of competitive relations already established. Here,   j   is the import competitor country of   x , and   q   is the import competitor country of   y .
P xy PA = Γ x × Γ y
P xy PA = j Γ x w ( x , j ) α × q Γ y w y , q α

2.2.3. Division of Test Set and Training Set

The existing crude oil import competition network is randomly divided into the test set and training set. Let   E   be the competition relation set of the whole import competition network; test set   E test   accounts for 10%, and the rest is training set   E train .
E = E test + E train
E test = 10 % × E
In this paper, the four algorithms above were used to calculate the scores of connected edges and non-connected edges in the test sets of import and export competitive networks, respectively. Then, the scores were sorted in descending order. The more edges of the test sets that ranked highly, the stronger the reliability of the edge prediction of the crude oil import and export competition network.

2.2.4. Evaluating the Merits of the Model

AUC is the most used measure of link prediction accuracy, which measures the algorithm’s accuracy, so we used AUC to evaluate the effectiveness of the link prediction algorithm in this paper. The similarity value between each pair of nodes in the network is obtained through the algorithm. The AUC index compares the similarity value of the edge in the test set with the size of the non-existent edge similarity value. For times of independent comparison, if the edge similarity value of the test set is greater than the similarity value of the non-existent edge, it is denoted as 1; if it is equal, it is denoted as 0.5. If it is less than, it is denoted as 0. The calculation result is obtained by adding the comparison scores and dividing them by the comparison times. The specific formula is as follows:
AUC = n + 0.5 n n

2.3. Data

The crude oil trade data are obtained from the UN COMTRADE database, and the selected commodities are petroleum oils and oils obtained from bituminous minerals: crude (HS code 2709). Based on the trade data, the authors constructed the crude oil trade import competition network and the crude oil trade export competition network. The data cover a period of 20 years from 2000 to 2019.

3. Evolution of Crude Oil Trade Status and Competition Pattern

3.1. Status of Crude Oil Trade

According to the BP 2020 Statistical Review of World Energy [41], in 2019, the proven global reserves of crude oil amounted to 1732.4 million barrels. OPEC has 1214.4 thousand million barrels, accounting for 70%, and non-OPEC has 520.1 thousand million barrels, accounting for 30% only. The unbalanced distribution of crude oil is a fundamental reason for the high internationalization of the crude oil trade. Figure 2 visualizes the data of UN COMTRADE [42]. We found that the top five crude oil importers in 2019 were China, the USA, India, Japan, and Korea, which accounted for 61% of global imports. Europe as a whole imported 20% of crude oil. The top five crude oil exporters were the USA, Saudi Arabia, the Russian Federation, Canada, and Iraq, accounting for 48% of global exports.
For traditional developed countries and emerging developing countries, crude oil is the basis of production. For countries whose economy highly depends on crude oil exports, crude oil is an important tool to maximize interests and gain international status, so its value goes beyond the scope of economics [43]. This has led to an increasingly complex global crude oil trade. In the international crude oil trade study, it is not easy to deeply analyze the inherent complex and hidden correlation between the trade theory of general commodities and the economic theory.

3.2. The Present Situation and Evolution of Competition Network Pattern

Due to the factors of production, price, and international relations, crude oil exporters usually do not sell crude oil to a single importer, just as the importers do not usually import oil from only one exporter; it inevitably leads to several importers simultaneously importing one exporter’s oil resources and several exporters simultaneously exporting oil to one importer. This is the deep relationship of trade: competition. Therefore, this paper constructs a crude oil import competition network based on whether the oil importing country has the same crude oil import source and a crude oil export competition network based on whether the oil exporters have the same crude oil export destination. This section analyzes the pattern and evolution of the import competition network and export competition network in the global crude oil trade from 2000 to 2019. It also judges who and which behaviors have promoted the evolution of the competition network and what impact this evolution has brought.

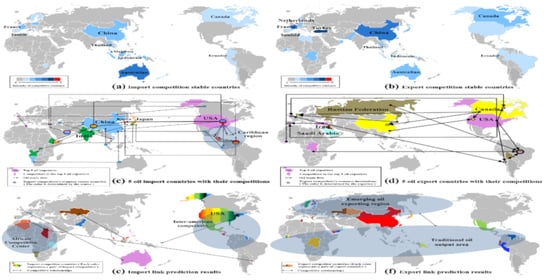
3.2.1. Import Competition Network

During the study period, the USA’s crude oil import competition intensity continued to weaken, while that of Asian countries such as China and India continued to strengthen. The core of crude oil import competition has changed from the USA to China. European import competition intensity has not changed distinctly. Figure 3 shows that the USA’s share of crude oil imports has gradually decreased since 2000, the import competition relationships have gradually decreased, and the import competition intensity has weakened. This trend accelerated from 2015, but it did not prevent the USA from remaining the major importer of crude oil, and it remained the largest importer for a long time, until 2017, when it was overtaken by China [41].
Compared with the previous studies about crude oil trade and competition, it is found that the reasons leading to the change in importers’ competition intensity are different. The shale oil revolution in the USA has increased domestic crude oil production and reduced the import trade, which is the direct reason for the weakening of its import competition intensity. The fundamental reason is a shift in the strategic objectives of American energy [44]. That is, the change in the USA was mainly caused by technological change and a change in energy strategy. By contrast, oil reserves in China and India, two large and fast-growing economies, are relatively modest. Since the start of the 21st century, crude oil production and import scale have been unable to supply their crude oil demand. The immediate solution is to diversify the source of crude oil import [45]. For developing countries such as China and India, the change in their crude oil import competition intensity was mainly caused by economic development and the imbalance between supply and demand.

3.2.2. Export Competition Network

In Figure 4, we can see that from 2000 to 2005, the core of crude oil trade export competition was concentrated between OPEC countries such as Saudi Arabia, Iraq, and Venezuela and traditional exporting non-OPEC countries such as the Russian Federation and Canada. In addition, 2005–2019 was a period of significant crude oil export from the USA, with the export market share catching up with other exporters. Comparing each country’s share in the crude oil export market in 2000 and 2019, Venezuela declined significantly. Saudi Arabia, Iraq, the Russian Federation, and Canada experienced slight declines or gains. The USA rose to first place. In terms of the intensity of export competition, Saudi Arabia, Iraq, the Russian Federation, and Canada saw fluctuating increases, Venezuela continued to decline, and the United States rose significantly after 2015.
Table 1 organizes and analyzes the changes in competition intensity and market share of major crude oil exporters in Figure 4. It is found that major crude oil exporters had different trade performance in this study period: the export share and export competition intensity of the United States, Iraq, Canada, and the Russian Federation all increased, which shows that they are targeting high-volume markets, where they are taking the export share from exporters; Venezuela’s export share and export competition intensity both decreased, indicating that it was gradually forced out of the market with large flow and the remaining market was mostly a small-flow market; Saudi Arabia’s share of exports decreased, but its export competition increased. This means that many countries are entering Saudi Arabia’s oil market, taking its share of exports and forcing it to withdraw from some oil markets. Nevertheless, this compromise only makes the competition more intense. There are no exporters who can gain a greater market share and reduce competition. This is mainly because exporters have moved into markets with low crude oil flows. Distinctly, major exporters prefer high-volume markets. If exporters have the same goal, why the trade discrepancy? What has created this pattern of export competition?
For a long time, the USA has maintained the strategic goal of “world oil hegemony”. As the country with the largest increase in crude oil export share and export competition intensity, the path of achieving the “world oil hegemony” has undergone a fundamental change. Before 2014, the USA guaranteed a sizeable crude oil supply through economic sanctions and intervention in the Middle East issue [46]. However, it was criticized by the international community. In 2014, the US shale oil production technology had a breakthrough innovation, officially lifted the 40-year ban on crude oil export, rapidly expanded the crude oil export, and began to transform into a prominent exporter of crude oil, trying to master the initiative in crude oil trade. Looking at the crude oil export market changes in the past 20 years, and the timeline of the crude oil events, we can suggest that the USA promoted the rapid evolution of the crude oil export competition pattern, which affected the major crude oil exporters. However, the specific reasons for the change in crude oil exporters cannot be generalized due to their different economic conditions, political positions, and changes in competition intensity.
Venezuela and Iraq have a single economic structure and are highly dependent on crude oil exports. Both countries have been subjected to economic and energy sanctions by the USA for years. The economic growth of Saudi Arabia also depends on crude oil exports, but thanks to years of export dividends, its domestic economic foundation is good, and its neutral political stance also enables it to maintain stable trade relations [47]. Canada is a highly developed capitalist country. Its heavy oil has been exported to the USA for a long time. In addition, its industry and agriculture also make outstanding contributions to the economy. Canada and the United States are members of the North American Free Trade Area (NAFTA) and the North Atlantic Treaty Organization (NATO). They have established close trade, political, and military alliances with each other. Today, the fuel and energy complex is the major structural constituent of the economy of the Russian Federation. In connection with the intense geopolitical situation globally, the Russian Federation has faced financial and economic sanctions from the United States of America. The Russian Federation and the USA have differences in both politics and economy. In fact, energy sanctions against the Russian Federation have always existed [48], and Russia’s energy policy has been constantly optimized [49]. Due to the differences in exporters themselves and the external environment, their situation is also different: the share of Venezuela’s crude oil export decreased year by year, and the export competition intensity weakened. After the war, Iraq’s crude oil export decreased. In the post-war period, Iraq’s exports were at historically low levels; after the USA waived sanctions, Iraq’s competition intensity increased. In order to resist the impact of a large amount of crude oil exported from the USA on crude oil prices, Saudi Arabia and other OPEC members reached an agreement to cut production, weakening the intensity of export competition; Canada’s heavy oil export share has increased steadily, and its export competition has intensified. The energy policy of the Russian Federation has reduced the impact of economic sanctions to a certain extent. The increase in its crude oil export has enhanced the intensity of export competition, reduced the dependence of crude oil importers on the Middle East, and strengthened the export competition between the Russian Federation and the Middle East [50].
Therefore, whether it is the crude oil import competition network or the crude oil export competition network, the change in the USA alone is the greatest. Consequently, how important is USA in the oil trade competition? This study ranked the directly related competition of the USA by using the normalization method (Figure 5).
The closer the dot is to 1, the higher the competition intensity is and the higher the world ranking. The closer the dot is to 0, the lower the competition intensity is and the lower the world ranking is. In this study period, although the share of crude oil imports of the USA decreased significantly, the import competition intensity of the USA did not change significantly. There was still fierce crude oil import competition with other countries. The intensity of export competition increased significantly, with two thirds of the countries ranked in the top 50% by 2019. As the only major importer and exporter of crude oil trade in the world, the USA has high competition intensity, which means that most of the world’s importers and exporters are vulnerable to the impact of energy security problems, so it is necessary to make accurate predictions of the future competition pattern of crude oil trade in time.

4. Link Prediction of Crude Oil Trade Competition Relationship

4.1. Test of Link Prediction

In order to make the link prediction model effective, the premise test, feasibility test, and effect test are carried out successively before the prediction of the potential competition relationship of crude oil trade.

4.1.1. Premise Test and Algorithm Selection

The link prediction model’s premise is that the relationship between research objects has certain volatility [24]. Therefore, before establishing the link prediction model, it is necessary to test whether the current crude oil international trade competition network is unstable. The link prediction is of practical significance only in an unstable condition. One of the main criteria to determine the stability of a complex network is the change in nodes in the network. This paper calculates the stability coefficient of nodes in the complex crude oil international trade network from 2010 to 2019 using the autocorrelation function [36] and Formula (2). The stability coefficients of 2013, 2014, 2016, and 2017 were all around 0.5, while those of other years were between 0.8 and 0.95. This proves that the crude oil import competition network and crude oil trade export competition network are unstable, conforming to the premise of using the link prediction algorithm (Figure 6).
Different forecasting algorithms for link forecasting models produce different forecasting results. Studies have used the link prediction model to forecast crude oil trade relationships [30], but only the CN algorithm has been used to evaluate potential trade relationships. However, a competition network is more complex than a trade network, and their intrinsic associations are more complex. Considering one forecasting algorithm alone may limit the understanding of motivation research and forecasting results. Instead, comparing multiple algorithms and selecting the best link predictor among them can provide strong evidence for the prediction mechanism and make the prediction results more accurate [51]. Therefore, the article used the AUC metric to determine how many algorithms should be chosen to predict potential competitive relationships.
Each year’s crude oil competitions were randomly divided into a 10% test set and a 90% training set. In Figure 7, the higher the AUC is, the closer the color is to dark red; the lower the AUC is, the closer the color is to dark blue. The results show that in all years when α is taken as 0, the AUC values of all four algorithms reach the maximum simultaneously. All of them are higher than 0.95, which means that the highest accuracy rate of all four algorithms exceeds 95%, but one algorithm may not be the most accurate in every year. Thus, it is necessary to ensure that all predictions are optimal, minimizing the risk of a single algorithm bias in the forecasting process, causing the entire forecast to fail. This paper uses four algorithms for forecasting at the same time. Whichever algorithm has the highest score in the same year, the prediction of this algorithm is taken as the prediction result for that year. The higher the predicted ranking of the competition, the more likely it is that a natural competition will arise. We extracted the top 10 of each year’s forecast results as the “potential future rivalry” for that year.

4.1.2. Feasibility Test and Effectiveness Test

In this paper, the principle of predicting potential crude oil competition is to predict a competition that has never existed based on real competition data in the current year. Suppose that a predicted competitive relationship has not yet occurred by the end of the time series (2019). In this case, the prediction of this competitive relationship is deemed to have failed. Otherwise, it is successful. The number of successes as a percentage of the total number of predictions is the success rate of the link prediction model. Based on the crude oil import competition network and export competition network from 2000 to 2019, a total of 259 import competition relationships and 241 export competition relationships were predicted in this study. As of 2019, 233 of these import competition relationships and 231 export competition relationships have been successfully generated, with success rates of 89.96% and 95.85%, indicating that it is feasible to use the link prediction model to forecast potential future crude oil import and export competition relationships.
Figure 8 is a flow chart for the effectiveness test of crude oil competitions. The effectiveness test is based on the predicted and realized competitions as of 2019. The measures of prediction effectiveness are “immediacy” and “persistence”. “Immediacy” is defined as the speed to establish the competitive relationships: suppose that the annual distance between the year when the two countries first have a real competitive relationship and the forecast base year is L; if 1 ≤ L ≤ 3, the immediacy of the competitive relationship is excellent; if 4 ≤ L ≤ 10, then the immediacy is general; and if L ≥ 11, the immediacy of the competitive relationship is poor. “Persistence” is defined as the duration of competition relationships: suppose that the number of years in which a certain potential trade relationship appears in the future is K, and the number of all observation years is L, n = K/L. The continuity of the relationship is excellent if n ≥ 0.8, fair if 0.8 > n ≥ 0.5, and poor if n > 0.5. “Immediacy” is used to determine the speed of response when a potential competitive relationship becomes a reality. “Persistence” is used to determine the extent to which a potential competitive relationship is maintained once it becomes a reality. Competitive relationships that are slow to react and weak in persistence are generally caused by occasional political and economic factors, and are less relevant for research. Only those competitive relationships that are high in “immediacy” and high in “persistence” are “stable” and meaningful to explore.
This paper defines a competitive relationship with both “immediacy” and “persistence” excellence as a “stable” competitive relationship. In Table 2, the “immediacy” of both import and export relationships is higher than their respective “persistence”, suggesting that fewer relationships meet the criteria of both good “immediacy” and “persistence”. However, this “stability” part of the competition is of interest to study. It is possible to summarize the characteristics of the new competitive relationships that have emerged over the past 20 years and analyze the impact of their emergence on the competitive landscape of crude oil. Similarly, this study focuses on those competitive relationships that have not yet been created in absolute terms and can be “stable” in the future.

4.2. Analysis of New Competitive Relationships in International Crude Oil from 2000 to 2019

From the perspective of geopolitical and economic developments, we have analyzed the characteristics and causes of the crude oil import and export competitive evolution. However, what competitions have driven the evolution of the competition pattern? In this study, we collate the new and “stable” competitive relationships that have emerged over the last 20 years. It is found that the new relationships have certain patterns and characteristics. As crude oil has always involved politics and economics between major countries, this paper focuses on the competitive relationships between major exporters and importers that have been added and have the “stability” characteristics over the period 2000–2019, and we draw a general pattern.

4.2.1. Asia–Pacific Has Become the Core of Crude Oil Competition, with a More Pronounced Intermediary Role for Europe

In Figure 9a,b, the deeper color of a country represents a greater increase in import competition intensity, while the lighter color of a country represents a smaller increase in import competition intensity. In the Asia–Pacific region, where there are developed countries such as the USA and Japan, as well as developing countries such as China and Indonesia, there is a huge demand for crude oil. At the same time, the Asia–Pacific region is rich in crude oil reserves, but most countries suffer from overcapacity and transportation difficulties. Therefore, the Asia–Pacific region imports large quantities of crude oil while also exporting large quantities of crude oil. The Asia–Pacific region has become the core of global crude oil trade competition, which is consistent with the conclusions reached in previous studies [6].
In Figure 9a,b, we can observe that Europe has seen a minor increase in import competition intensity and a larger increase in export competition intensity. UN COMTRADE supports this. Europe is currently playing more of an intermediary country role. Before 2016, this phenomenon may have been caused by the European debt crisis in 2010, which brought about a plunge in demand for crude oil in Europe. This phenomenon has persisted beyond 2016 because it is more likely to be influenced by carbon-neutral schemes. The strong push for clean energy has led directly to a reduction in demand for crude oil.

4.2.2. Cross-Continental Import Competition Has Emerged among Major Importers; Non-OPEC Countries Are More Likely to Generate New Competitions

Figure 9c identifies the top five crude oil importers: China, Korea, Japan, India, the USA, and their import competitors. The new import competitors are located over long linear distances. Most typically, Korea’s new import competitors are all located in the Caribbean region. Their common source of imports is the USA. This means that Korea’s new import competitions have penetrated the intra-American crude oil trade market, almost regardless of geographical location. In fact, the additional import competitors of other major importers and their common sources of imports are also primarily distributed across continents.
Figure 9d marks the top five crude oil exporters: the USA, Saudi Arabia, the Russian Federation, Canada, and Iraq, and their export competitors. Three non-OPECs—the USA, the Russian Federation and Canada—generate new export competition. The USA is better in volume and distance, covering three continents. In contrast, Saudi Arabia and Iraq, which are members of OPEC, have not generated export competition in 20 years.

4.3. Future Evolution Trend Analysis of Global Crude Oil Trade Competition Network

In addition to analyzing the results of the “stable” competitive relationships that have been generated, this paper also explores competitive relationships that have not yet been generated and that meet the “stability” criterion (Figure 10), as they are closely related to the development of the future competitive landscape for crude oil.

4.3.1. Potential Import Competition Is Concentrated in Latin America and Africa

Figure 10a shows that the additional import competitors will be mainly African and Latin American countries. The additional competitive relationships will mainly exist with intra-America, and between Africa and other regions in the future. The main import competition with Latin American countries is with the USA. This forecast result further supports the conclusion above that the USA, with a significantly reduced share of crude oil imports, is still in fierce competition with other countries for crude oil imports. We predict that the USA will be more willing to compete with smaller neighbors for crude oil from the same import sources. Competition between African countries and other regions for crude oil imports cannot be ignored. The African region is rich in crude oil reserves. Due to factors such as the concentration of crude oil resources and backward production capacity, crude oil importation is a major drain on the economy of Africa [52]. Africa has also been promoting industrialization in recent years as the most economically underdeveloped region, with projects such as the Central African Transport Corridor interconnection infrastructure and APSSET. The demand for crude oil will continue to grow, and there is a greater probability of import competition with importers from other regions in the future.

4.3.2. Traditional Crude Oil Exporters Will Be Challenged by Emerging Crude Oil Exporters

Figure 10b shows that potential export competition is mainly concentrated between traditional crude-oil-exporting regions (such as OPEC, Colombia, and Mexico) and emerging crude-oil-exporting regions (such as Japan, China, and the Netherlands). This is broadly consistent with the evolution of the competitive crude oil landscape over 2000–2019. With the precedent set by the USA, it is not difficult to deduce that the entry of emerging crude oil exporters into the competitive crude oil export market will generally have an impact on oil prices, while traditional crude oil exporters are likely to be forced once again to rely on trade instruments such as production cuts to reduce their impact while reducing their initiative in the crude oil trade. Contrary to the evolution of the current competition pattern, the USA did not display a potential new stable export competition relationship. We believe that there are two main reasons. First, according to the UN COMTRADE database, a total of 105 countries in the world imported crude oil from other countries in 2019, of which 61 countries imported crude oil from the USA. The USA’s coverage of all crude-oil-importing countries reached 58.1%, while the Russian Federation and Saudi Arabia, which are ranked second and third, only export crude oil to 42 and 35 countries, respectively. This makes it difficult for the USA to generate new export destinations quickly. Second, the shale oil revolution in the USA has made crude oil cheaper and more attractive to importing countries than traditional exporters, and it is less likely that other crude oil exporters will capture a share of USA exports.

4.3.3. Geopolitical, Economic, and Social Emergencies Have a Significant Impact on Crude Oil Security

In the past 20 years, geopolitical and economic and social emergencies have significantly impacted crude oil prices and the security of the crude oil supply. For example, the Iraq War in 2003, the Arab Spring in 2011, and the Russia–Ukraine war in February 2022 were all international geopolitical events that directly led to a significant increase in oil prices and raised energy security issues for countries around the world; the global financial crisis in 2008 and the European debt crisis in 2010 were oil price fluctuations caused by economic crises; and the COVID-19 pandemic, which is ongoing, has led to crude oil price volatility due to unexpected health events. Currently, the Russia–Ukraine war is attracting a high level of international attention. It has generated a series of economic and social emergencies relevant to the future development of the international crude oil competition. In 2020, the Russian Federation’s crude oil exports accounted for approximately 11.5% of total global exports, with 22 billion kilograms of crude oil exported to 42 countries, with a total value of over USD 74.3 billion [42]. Although the forecasting model cannot predict the Russian Federation’s competition in the future, as a non-negligible player in the international crude oil trade, the Russian Federation is facing a policy of economic sanctions by the West that could lead to the failure of monetary payments for crude oil [53], higher oil prices [54], and the shelving of energy cooperation [55]. This could cause the Russian Federation to lose part of its crude oil exports in the West, especially in Europe. In order to reduce the impact of economic sanctions, there is a possibility that the Russian Federation will shift its target market for crude oil exports in the future and instead export crude oil to non-restricted countries, which may create new export competition between former exporters of these countries and the Russian Federation. There is no doubt that the Russia–Ukraine war will have many implications for the competitive landscape of the international crude oil trade.

5. Conclusions and Recommendations

This paper offers a complete account of the impact of geopolitical and economic development factors on the evolution of the competitive landscape of crude oil trade. It draws general conclusions on the current state of the competitive landscape and its evolutionary characteristics. On this basis, we forecast the future evolution of import and export competition in the crude oil trade. The conclusions are summarized as follows.
(1)
The crude oil import competition evolution is mainly influenced by economic development. The rise of developing countries’ economies has shifted the core of crude oil import competition from Europe and the USA to the Asia–Pacific region. The import competition will mainly be concentrated in Latin America and Africa. The core of competition for crude oil imports has shifted along with the general world development pattern of “developed regions—sub-developed regions—developing regions”.
(2)
The crude oil export competition evolution is heavily influenced by geopolitics. It is particularly sensitive to the crude oil trading activities of the USA. The export competition will take shape between traditional and emerging exporters. The main route of the shift in the core of crude oil export competition is “traditional crude oil exporters—traditional crude oil exporters and emerging crude oil exporters”, which seems to be in line with the general development pattern. The current and future shift in the core of export competition should be more rationally described as “crude oil endowment areas—crude oil endowment areas and crude oil deficit areas”. With the US exporting large volumes of crude oil as the starting point for the shift, more exporters may be subject to similar export shocks in the future. The international crude oil export competition should receive more attention.
(3)
In future crude oil trade competition, the USA is likely to show the opposite of its past actions. The USA has seen a reduction in the intensity of import competition and an increase in export competition over the past 20 years, with many new export competitive relationships. However, projections of potential competitive relationships indicate that the USA will have import competition with neighboring countries and that no new export competition will arise.
(4)
The Russia–Ukraine war may lead to the withdrawal of the Russian Federation from some crude oil export markets in favor of new crude oil export markets, generating new export competition, which could lead to a series of problems, such as the security of the energy supply for some countries and the difficult economic situation of developed capitalist economies after the crisis.
In conclusion, crude oil trade competition is a complex network of economic, political, cultural, and military factors. Each country has to adopt the most reasonable crude oil policy according to the changes and prognosis of the competitive landscape. In summary, this paper makes three recommendations as follows.
(1)
For crude oil importers, it is vital to ensure the security of the national energy supply. Firstly, it is necessary to improve crude oil utilization rates, promote the diversification of import sources, and reduce the risk of being constrained by other countries; secondly, it is necessary to invest heavily in and research and develop clean energy, promote a cleaner and more diversified energy consumption structure, and foster energy self-sufficiency. Third, we must vigorously pursue policies to liberalize the energy market, lift price controls on some energy sources, and work to create a policy environment that is fully competitive and encourages private investment and technological progress.
(2)
For crude oil exporters, it is vital to safeguard national economic and social security. First, they should vigorously develop the midstream and downstream industrial chains of crude oil, increase the added value of crude oil exports, and optimize and upgrade their industrial structure, especially for countries whose fiscal revenue and economic structure are highly dependent on crude oil exports, which will definitely cause domestic economic crisis once they are subject to energy sanctions; second, they should establish good diplomatic relations and promote the continuous expansion and deepening of energy cooperation with crude oil importing countries.
(3)
For each crude oil trading country, it is important to advocate for a fair and free multilateral trading system, resist oil hegemony and energy sanctions, and build a benign and healthy international crude oil trading environment. From the Middle East, which has monopolized the oil market in the last century, to the United States, which has become increasingly energy-independent in the 21st century, to the current energy sanctions and crude oil supply crisis triggered by the Russia–Ukraine war, they have all had a huge impact on the global crude oil market. The threat of oil hegemony seems to have been hanging over the crude oil market, seriously hindering the energy autonomy of countries and international energy cooperation, while energy sanctions are not a scientific and reasonable solution means. Countries should resolve international trade disputes in a peaceful and developmental manner, based on the principle of mutual benefit.

Author Contributions

Writing—original draft preparation, X.Z.; writing—review and editing, H.Z. and W.X.; conceptualization, P.Z. and H.L.; methodology, S.Z. All authors have read and agreed to the published version of the manuscript.

Funding

This work was supported by grants from the National Natural Science Foundation of China (Grant No. 71991481 and No.71991480) and the Basic Science Center Project for National Natural Science Foundation of China (No. 72088101, the Theory and Application of Resource and Environment Management in the Digital Economy Era).

Institutional Review Board Statement

Not applicable.

Informed Consent Statement

Not applicable.

Data Availability Statement

Not applicable.

Conflicts of Interest

The authors declare no conflict of interest.

References

  1. An, H.; Zhong, W.; Chen, Y.; Li, H.; Gao, X. Features and evolution of international crude oil trade relationships: A trading-based network analysis. Energy 2020, 74, 254–259. [Google Scholar] [CrossRef]
  2. BP Statistical Review of World Energy. 2017. Available online: https://www.bp.com/ (accessed on 4 March 2021).
  3. Wu, G.; Liu, L.; Wei, Y. Comparison of China’s oil import risk: Results based on portfolio theory and a diversification index approach. Energy Pol. 2009, 37, 3557–3565. [Google Scholar] [CrossRef]
  4. Du, R.; Wang, Y.; Dong, G.; Tian, L.; Liu, Y.; Wang, M.; Fang, G. A complex network perspective on interrelations and evolution features of international oil trade, 2002–2013. Appl. Energy 2017, 196, 142–151. [Google Scholar] [CrossRef]
  5. Zhang, Z.; Lan, H.; Xing, W. Global trade pattern of crude oil and petroleum products: Analysis based on complex network. In IOP Conference Series Earth and Environmental Science; IOP Publishing: Bristol, UK, 2018; Volume 153, p. 022033. [Google Scholar]
  6. Zhang, H.; Ji, Q.; Fan, Y. Competition, transmission and pattern evolution: A network analysis of global oil trade. Energy Pol. 2014, 73, 312–322. [Google Scholar] [CrossRef]
  7. Mon, Y.; Lim, S.; Kakinaka, M. Multiplex relations between states: Coevolution of trade agreements and political alliances. Sustainability 2019, 11, 3911. [Google Scholar] [CrossRef] [Green Version]
  8. Kitamura, T.; Managi, S. Driving force and resistance: Network feature in oil trade. Appl. Energy 2017, 208, 361–375. [Google Scholar] [CrossRef]
  9. Yang, Y.; Poon, J.P.; Liu, Y.; Bagchi-Sen, S. Small and flat worlds: A complex network analysis of international trade in crude oil. Energy 2015, 93, 534–543. [Google Scholar] [CrossRef]
  10. An, Q.; Wang, L.; Qu, D.; Zhang, H. Dependency network of international oil trade before and after oil price drop. Energy 2018, 165, 1021–1033. [Google Scholar] [CrossRef]
  11. Shao, Y.; Qiao, H.; Wang, S. What determines China’s crude oil importing trade patterns? Empirical evidences from 55 countries between 1992 and 2015. Energy Pol. 2017, 109, 854–862. [Google Scholar] [CrossRef]
  12. Zhang, H.; Ji, Q.; Fan, Y. What drives the formation of global oil trade patterns? Energy Econ. 2015, 49, 639–648. [Google Scholar] [CrossRef]
  13. Li, Y.; Ran, D. Network Structure and Influence Factors of Oil Industry Chain Trade about the Countries along “the Belt and Road”. Econ. Probl. 2021, 9, 11–118. (In Chinese) [Google Scholar]
  14. Zhang, C.; Fu, J.; Pu, Z. A study of the petroleum trade network of countries along “The Belt and Road Initiative”. J. Clean. Prod. 2019, 222, 593–605. [Google Scholar] [CrossRef]
  15. Ji, Q.; Zhang, H.; Fan, Y. Identification of global oil trade patterns: An empirical research based on complex network theory. Energy Convers. Manag. 2014, 85, 856–865. [Google Scholar] [CrossRef]
  16. Vivoda, V. Diversification of oil import sources and energy security: A key strategy or an elusive objective? Energy Pol. 2009, 37, 4615–4623. [Google Scholar] [CrossRef]
  17. Dong, G.; Qing, T.; Du, R.; Wang, C.; Li, R.; Wang, M.; Stanley, H.E. Complex network approach for the structural optimization of global crude oil trade system. J. Clean. Prod. 2020, 251, 119366. [Google Scholar] [CrossRef]
  18. Hao, X.; An, H.; Qi, H.; Gao, X. Evolution of the exergy flow network embodied in the global fossil energy trade: Based on complex network. Appl. Energy 2016, 162, 1515–1522. [Google Scholar] [CrossRef]
  19. He, Z.; Yang, Y.; Liu, Y.; Jin, F. Characteristics of evolution of global energy trading network and relationships between major countries. Prog. Geogr. 2019, 38, 1621–1632. (In Chinese) [Google Scholar] [CrossRef]
  20. Wang, M.; Tian, L.; Du, R. Research on the interaction patterns among the global crude oil import dependency countries: A complex network approach. Appl. Energy 2016, 180, 779–791. [Google Scholar] [CrossRef]
  21. Jedrzej, G.F.; Manue, P. A New Scramble for African Oil? Historical, Political, and Business Perspectives. Afr. Aff. 2007, 106, 229–251. [Google Scholar]
  22. Xia, S.; Hao, L.; Tang, W.; Cui, P.; Wu, F. The evolution of competition and cooperation in world crude oil flows from the perspective of complex networks and its enlightenment to China’s oil cooperation. J. Nat. Resour. 2020, 35, 2655–2673. (In Chinese) [Google Scholar] [CrossRef]
  23. Duenas, M.; Fagiolo, G. Modeling the international-trade network: A gravity approach. J. Econ. Interact. Coord. 2013, 8, 155–178. [Google Scholar] [CrossRef]
  24. Ravishankar, G.; Stack, M.M. The gravity model and trade efficiency: A stochastic frontier analysis of eastern European countries’ potential trade. World Econ. 2014, 37, 690–704. [Google Scholar] [CrossRef] [Green Version]
  25. Eita, J.H. Estimating export potential for a small open economy using a gravity model approach: Evidence from Namibia. J. Dev. Areas 2016, 50, 273–288. [Google Scholar] [CrossRef]
  26. Gómez, H.E. Comparing alternative methods to estimate gravity models of bilateral trade. Empir. Econ. 2013, 44, 1087–1111. [Google Scholar] [CrossRef] [Green Version]
  27. Vidmer, A.; Zeng, A.; Medo, M.; Zhang, Y. Prediction in complex systems: The case of the international trade network. Phys. A 2015, 436, 188–199. [Google Scholar] [CrossRef] [Green Version]
  28. Cannistraci, C.V.; Alanis, L.G.; Ravasi, T. Erratum: From link-prediction in brain connectomes and protein interactomes to the local-community-paradigm in complex networks. Sci. Rep. 2013, 3, 1613. [Google Scholar] [CrossRef] [PubMed] [Green Version]
  29. Lada, A.A.; Eytan, A. Friends and neighbors on the Web. Soc. Netw. 2003, 25, 211–230. [Google Scholar]
  30. Guan, Q.; An, H.; Gao, X.; Huang, S.; Li, H. Estimating potential trade links in the international crude oil trade: A link prediction approach. Energy 2016, 102, 406–415. [Google Scholar] [CrossRef]
  31. Feng, S.; Li, H.; Qi, Y.; Guan, Q.; Wen, S. Who will build new trade relations? Finding potential relations in international liquefied natural gas trade. Energy 2017, 141, 1226–1238. [Google Scholar] [CrossRef]
  32. Liu, S.; Dong, Z. Who will trade bauxite with whom? Finding potential links through link prediction. Resour. Pol. 2019, 63, 101417. [Google Scholar] [CrossRef]
  33. Liu, S.; Dong, Z.; Ding, C.; Wang, T.; Zhang, Y. Do you need cobalt ore? Estimating potential trade relations through link prediction. Resour. Pol. 2020, 66, 101632. [Google Scholar] [CrossRef]
  34. Glick, R.; Rose, A.K. Contagion and trade: Why are currency crises regional? Int. Money Financ. 1999, 18, 603–617. [Google Scholar] [CrossRef]
  35. Wang, X.; Li, H.; Yao, H.; Chen, Z.; Guan, Q. Network feature and influence factors of global nature graphite trade competition. Resour. Pol. 2019, 60, 153–161. [Google Scholar] [CrossRef]
  36. Palla, G.; Barabási, A.L.; Vicsek, T. Quantifying social group evolution. Nature 2007, 446, 664–666. [Google Scholar] [CrossRef] [Green Version]
  37. Lü, L.; Zhou, T. Link prediction in complex networks: A survey. Phys. A 2011, 390, 1150–1170. [Google Scholar] [CrossRef] [Green Version]
  38. Zhou, T.; Lu, L.; Zhang, Y. Predicting missing links via local information. Eur. Phys. J. B 2009, 71, 623–630. [Google Scholar] [CrossRef] [Green Version]
  39. Libel, D.; Kleinberg, J. The link-prediction problem for social networks. J. Am. Soc. Inf. Sci. 2003, 58, 1019–1031. [Google Scholar]
  40. Holme, P.; Kim, B.J.; Yoon, C.N.; Han, S.K. Attack vulnerability of complex networks. Phys. Rev. E 2002, 65, 056109. [Google Scholar] [CrossRef] [Green Version]
  41. BP Statistical Review of World Energy. 2020. Available online: https://www.bp.com/ (accessed on 5 March 2022).
  42. Un Comtrade. Available online: https://comtrade.un.org/ (accessed on 24 April 2021).
  43. Paul, R. The End of Oil: On the Edge of a Perilous New World; Houghton Mifflin Harcourt: Boston, MA, USA, 2005. [Google Scholar]
  44. Zhang, J.; The, U.S. Hegemony and International Oil Politics. J. SJTU Philos. Soc. Sci. 2006, 14, 26–31. (In Chinese) [Google Scholar]
  45. Hao, H.; Xing, W.; Song, N.; Li, Z. A preliminary study for the impact of India’s future oil demand to China: Based on the cooperation between China and India. China Min. Mag. 2017, 26, 7–12. (In Chinese) [Google Scholar]
  46. Zhong, W.; An, H.; Shen, L.; Dai, T.; Fang, W.; Gao, X. Global pattern of the international fossil fuel trade: The evolution of communities. Energy 2017, 123, 260–270. [Google Scholar] [CrossRef]
  47. Rachel, B. The United States in the Middle East: Bound by Growing Energy Demand. Middle East Pol. 2014, 21, 34–39. [Google Scholar]
  48. Novikau, A. What does energy security mean for energy-exporting countries? A closer look at the Russian energy security strategy. J. Energy Nat. Resour. Law 2021, 39, 105–123. [Google Scholar] [CrossRef]
  49. Albuquerque, F.P.S.; Pacheco, C.C.; Leite, A.C.C.; Fuccille, A. The instrumentalization of the energy sector under Putin-Medvedev (2000–2018) and the Russian return to the international geopolitical scenario. Rev. Relac. Int. Estrateg. Segur. 2021, 16, 125–152. [Google Scholar] [CrossRef]
  50. Christy, S. Increasing Russia crude oil exports changing worldwide trade patterns. Oil Gas J. 2004, 102, 54–66. [Google Scholar]
  51. Lü, L.; Pan, L.; Zhou, T.; Zhang, Y.; Stanley, H. Toward link predictability of complex networks. Proc. Natl. Acad. Sci. USA 2015, 112, 2325–2330. [Google Scholar] [CrossRef] [PubMed] [Green Version]
  52. George, M. Understanding crude oil import demand behaviour in Africa: The Ghana case. J. Afr. Trade 2017, 4, 75–87. [Google Scholar]
  53. Kapustina, L.M.; Kornilova, K.V.; Vozmilov, I.D. Consequences of introducing and removing economic sanctions against Iran for global economy. Int. Relat. Curr. Issues World Econ. Politics 2015, 12, 394–403. [Google Scholar]
  54. Tuzova, Y.; Qayum, F. Global oil glut and sanctions: The impact on Putin’s Russia. Energy Pol. 2016, 90, 140–151. [Google Scholar] [CrossRef]
  55. Gurvich, E.; Prilepskiy, I. The impact of financial sanctions on the Russian economy. Russ. J. Econ. 2015, 1, 359–385. [Google Scholar] [CrossRef]
Figure 1. Competition network diagram.
Energies 15 02395 g001
Figure 2. Major crude oil trade countries and the share of imports and exports in 2019.
Energies 15 02395 g002
Figure 3. The evolution of competition among importers from 2000 to 2019.
Energies 15 02395 g003
Figure 4. The evolution of competition among exporters from 2000 to 2019.
Energies 15 02395 g004
Figure 5. Changes in the competition intensity rankings of the US and other countries in 2000–2019.
Energies 15 02395 g005
Figure 6. Stability coefficient of import competition network and export competition network.
Energies 15 02395 g006
Figure 7. AUC scores of α with year for four different algorithms.
Energies 15 02395 g007
Figure 8. Flow chart for effectiveness test of crude oil competitions.
Energies 15 02395 g008
Figure 9. Increased competition among major importers and exporters, 2000–2019. (a) Import competition “stable” countries; (b) Export competition “stable” countries; (c) The top 5 importers with their competitions; (d) The top 5 exporters with their competitions.
Energies 15 02395 g009
Figure 10. Potential competitive relationships analysis in the future. (a) Import Link Prediction results; (b) Export Link Prediction results.
Energies 15 02395 g010
Table 1. The trade performance of major exporters in the crude oil export competition.
Market ShareCompetition IntensityTrade PerformanceMajor
Exporter
Energies 15 02395 i001 Energies 15 02395 i001Enter markets with large crude flowsUSA, Iraq, Canada, Russian Federation
Energies 15 02395 i002 Energies 15 02395 i002Exit most of the markets with high flow
Remaining markets with small flows
Venezuela
Energies 15 02395 i002 Energies 15 02395 i001Exit part of the crude oil market
Remaining markets with high flows
Saudi Arabia
Energies 15 02395 i001 Energies 15 02395 i002Enter markets with low crude flowsNone
Table 2. Effectiveness test checklist.
IndicatorsImport (%)Export (%)
Immediacyexcellent87.5091.63
general10.808.37
poor1.700
Persistenceexcellent30.0040.25
general29.6235.68
poor40.3824.07
Publisher’s Note: MDPI stays neutral with regard to jurisdictional claims in published maps and institutional affiliations.

