
Exploring Different Binders for a LiFePO4 Battery, Battery Testing, Modeling and Simulations

 , , and
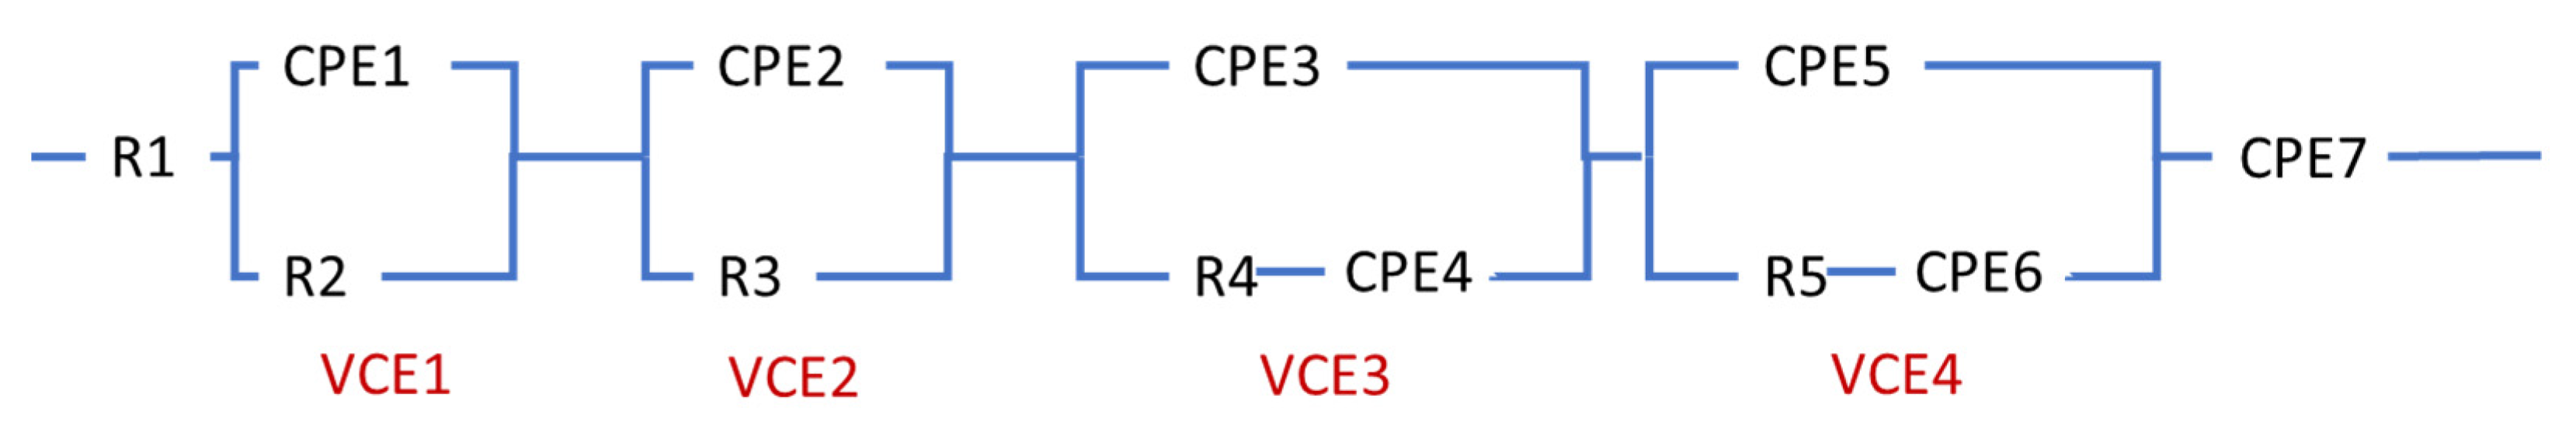
Abstract
:1. Introduction
2. LFP Battery Models
2.1. Single Particle Model
2.2. Equivalent Circuit Model
3. Materials and Methods
4. Results
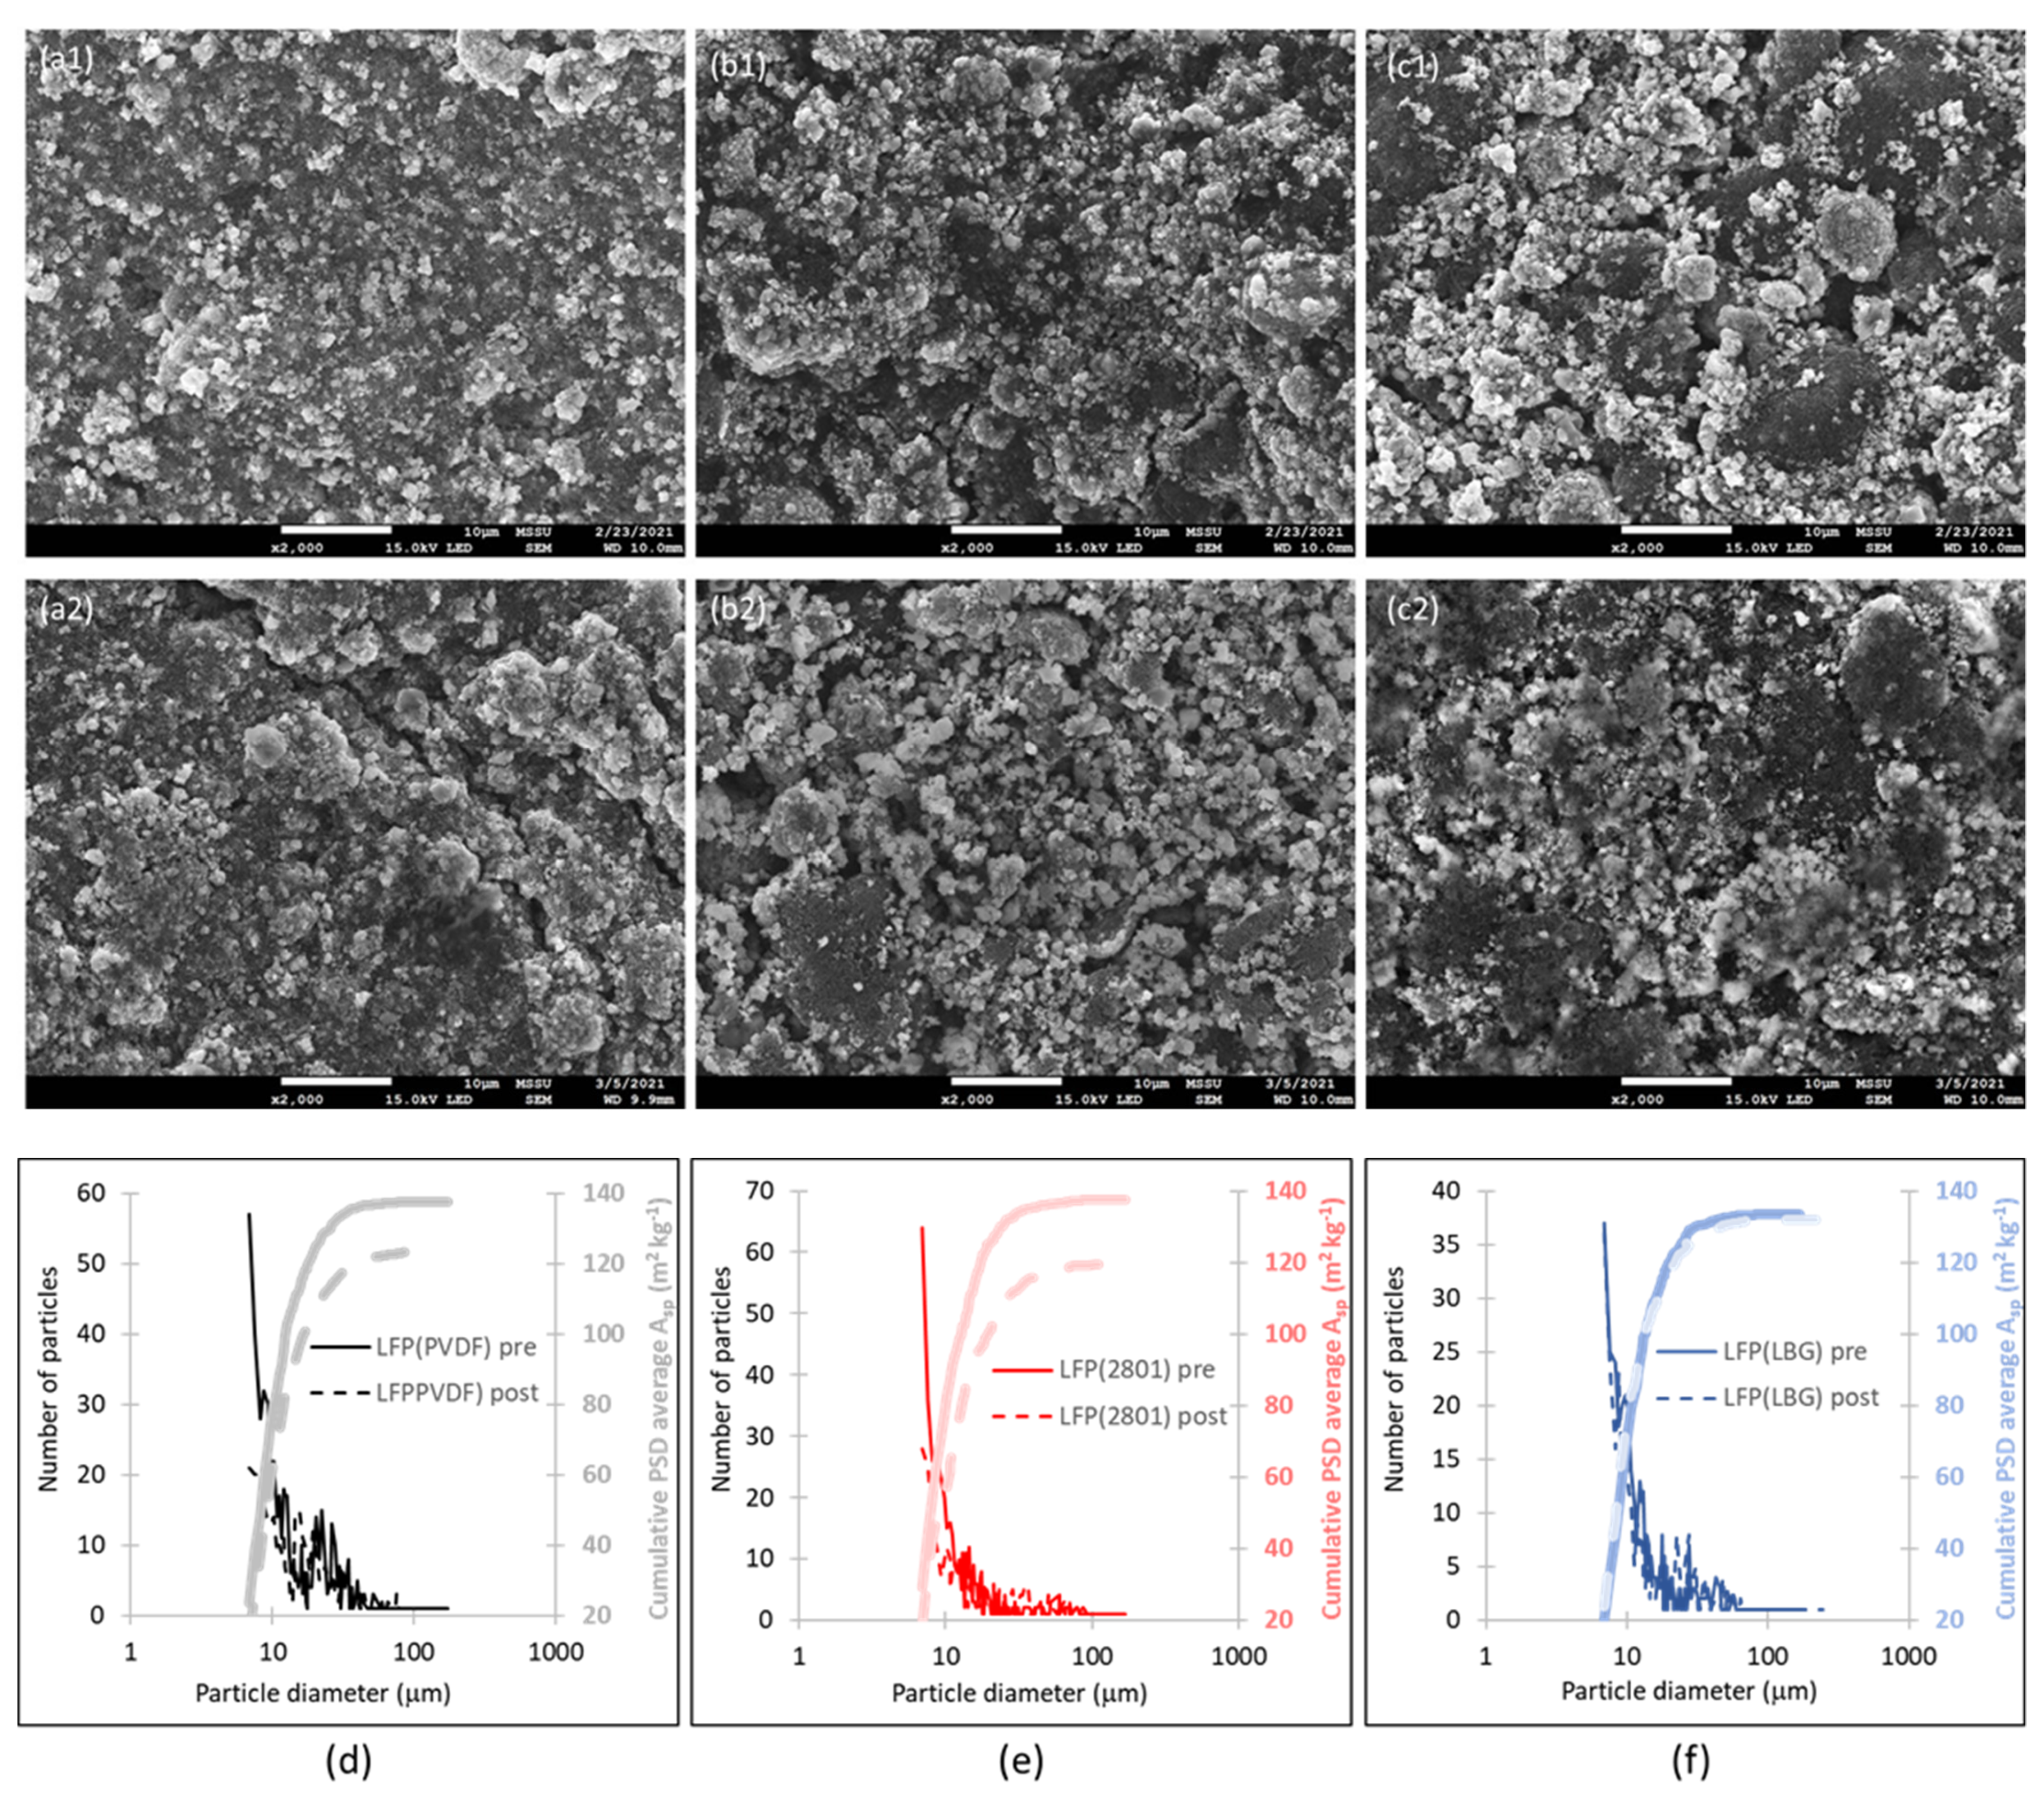
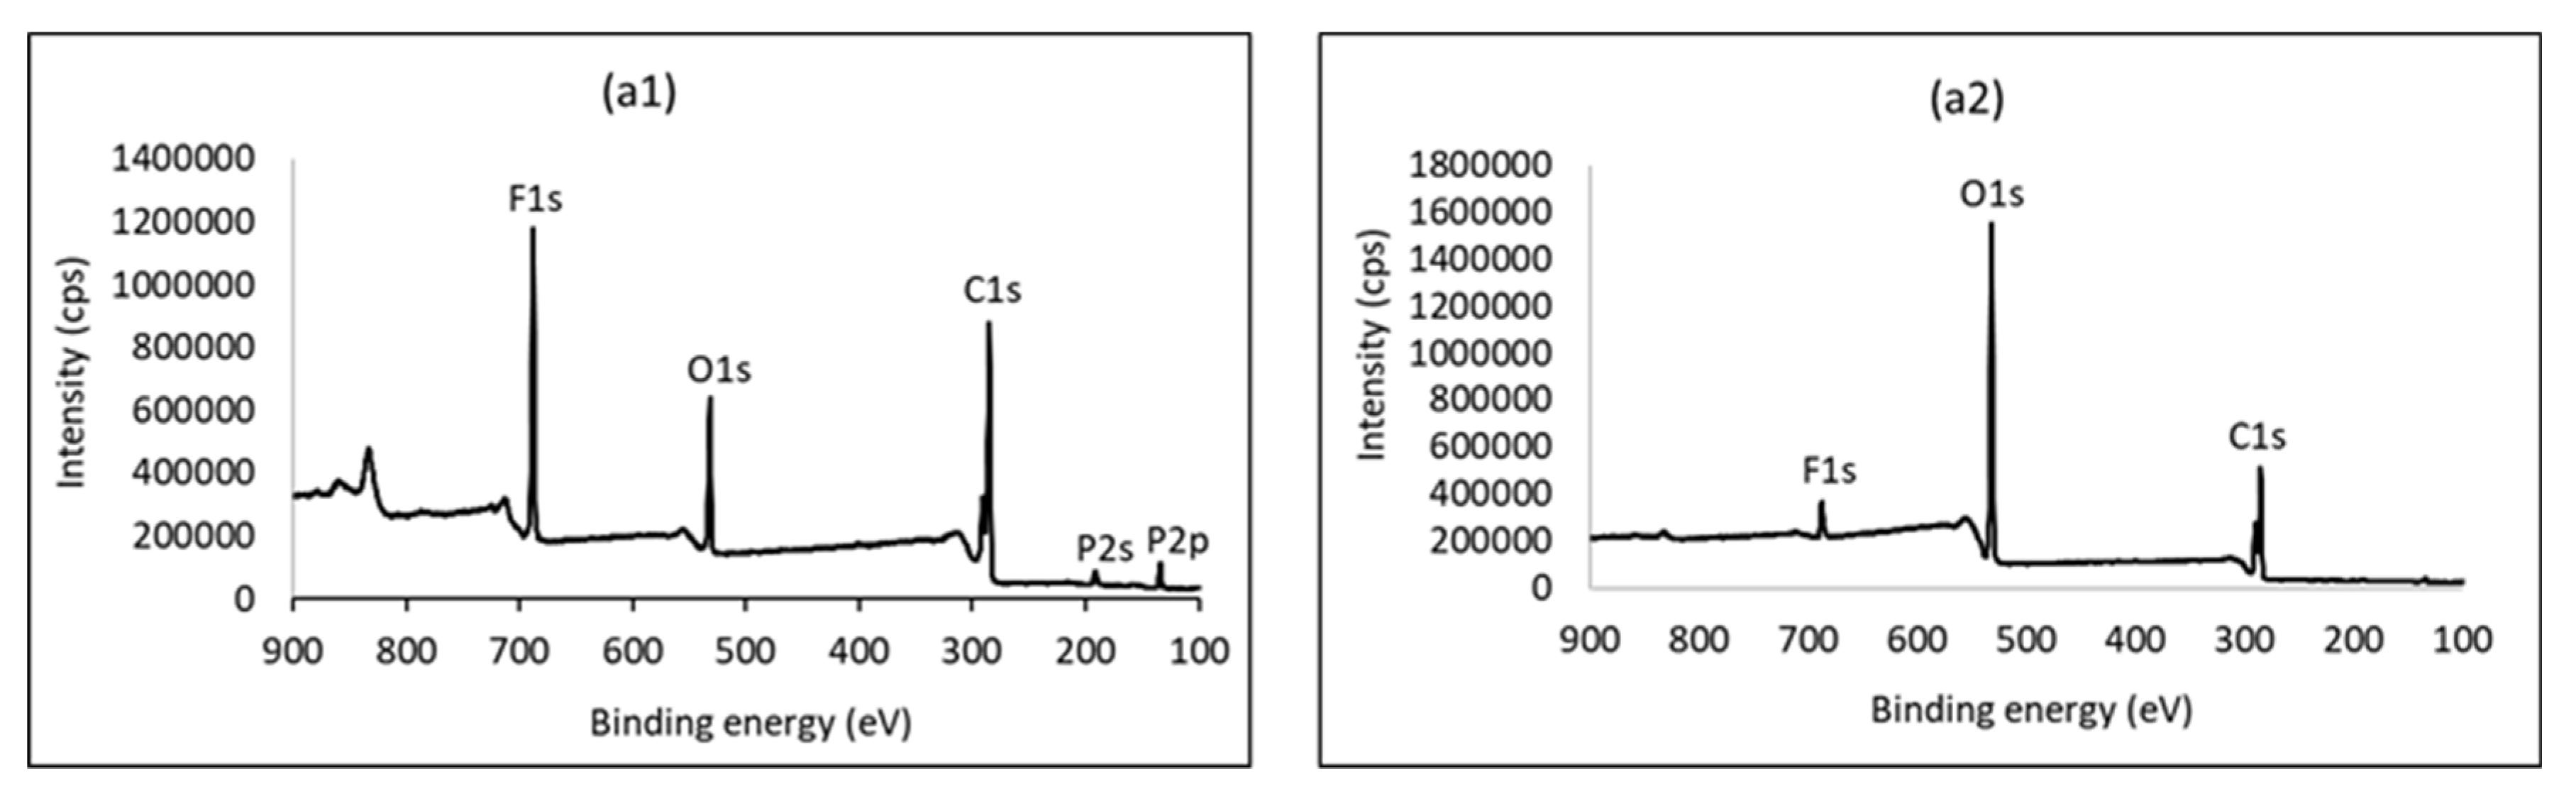
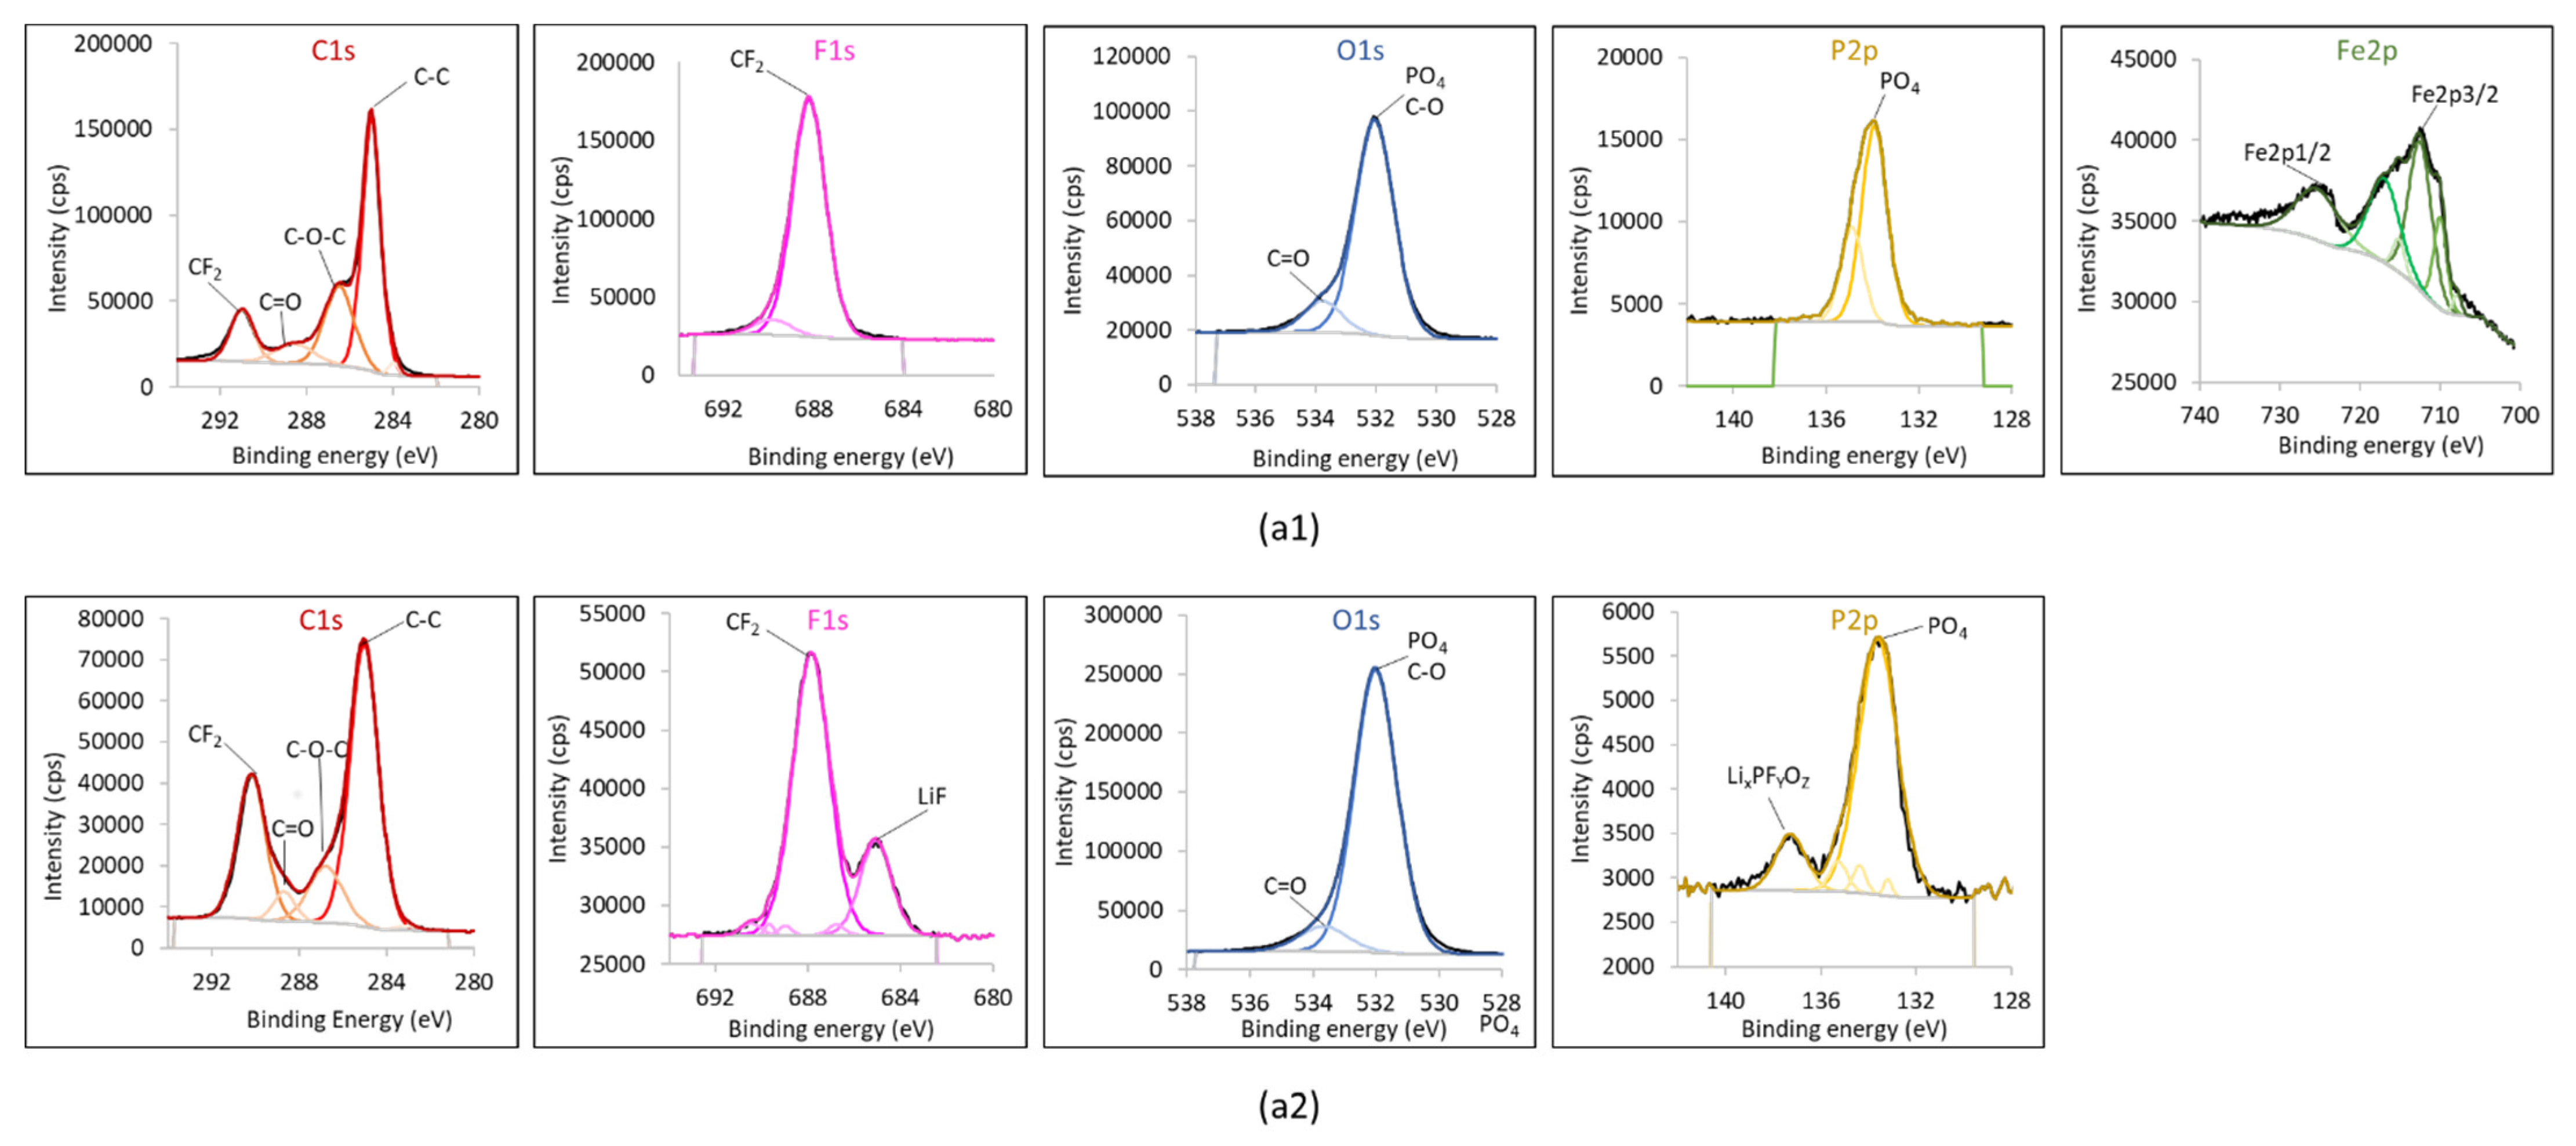
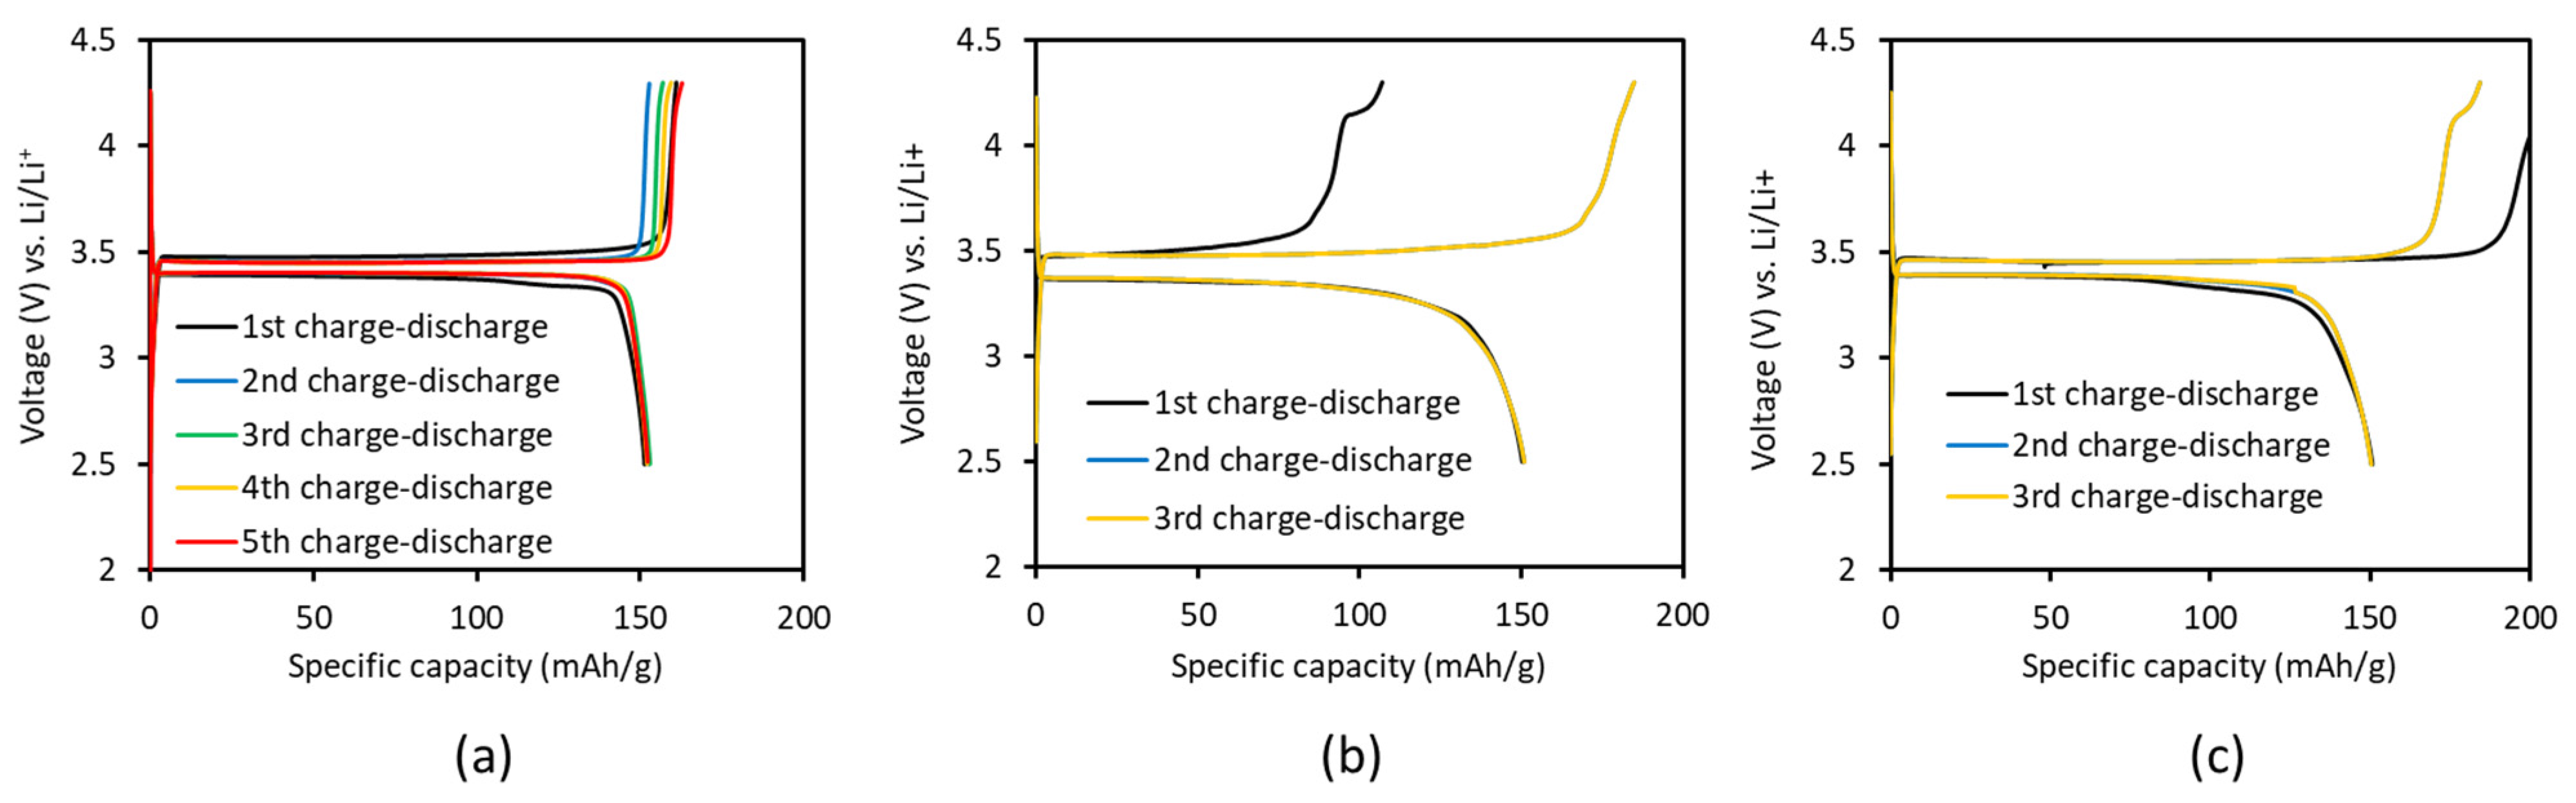
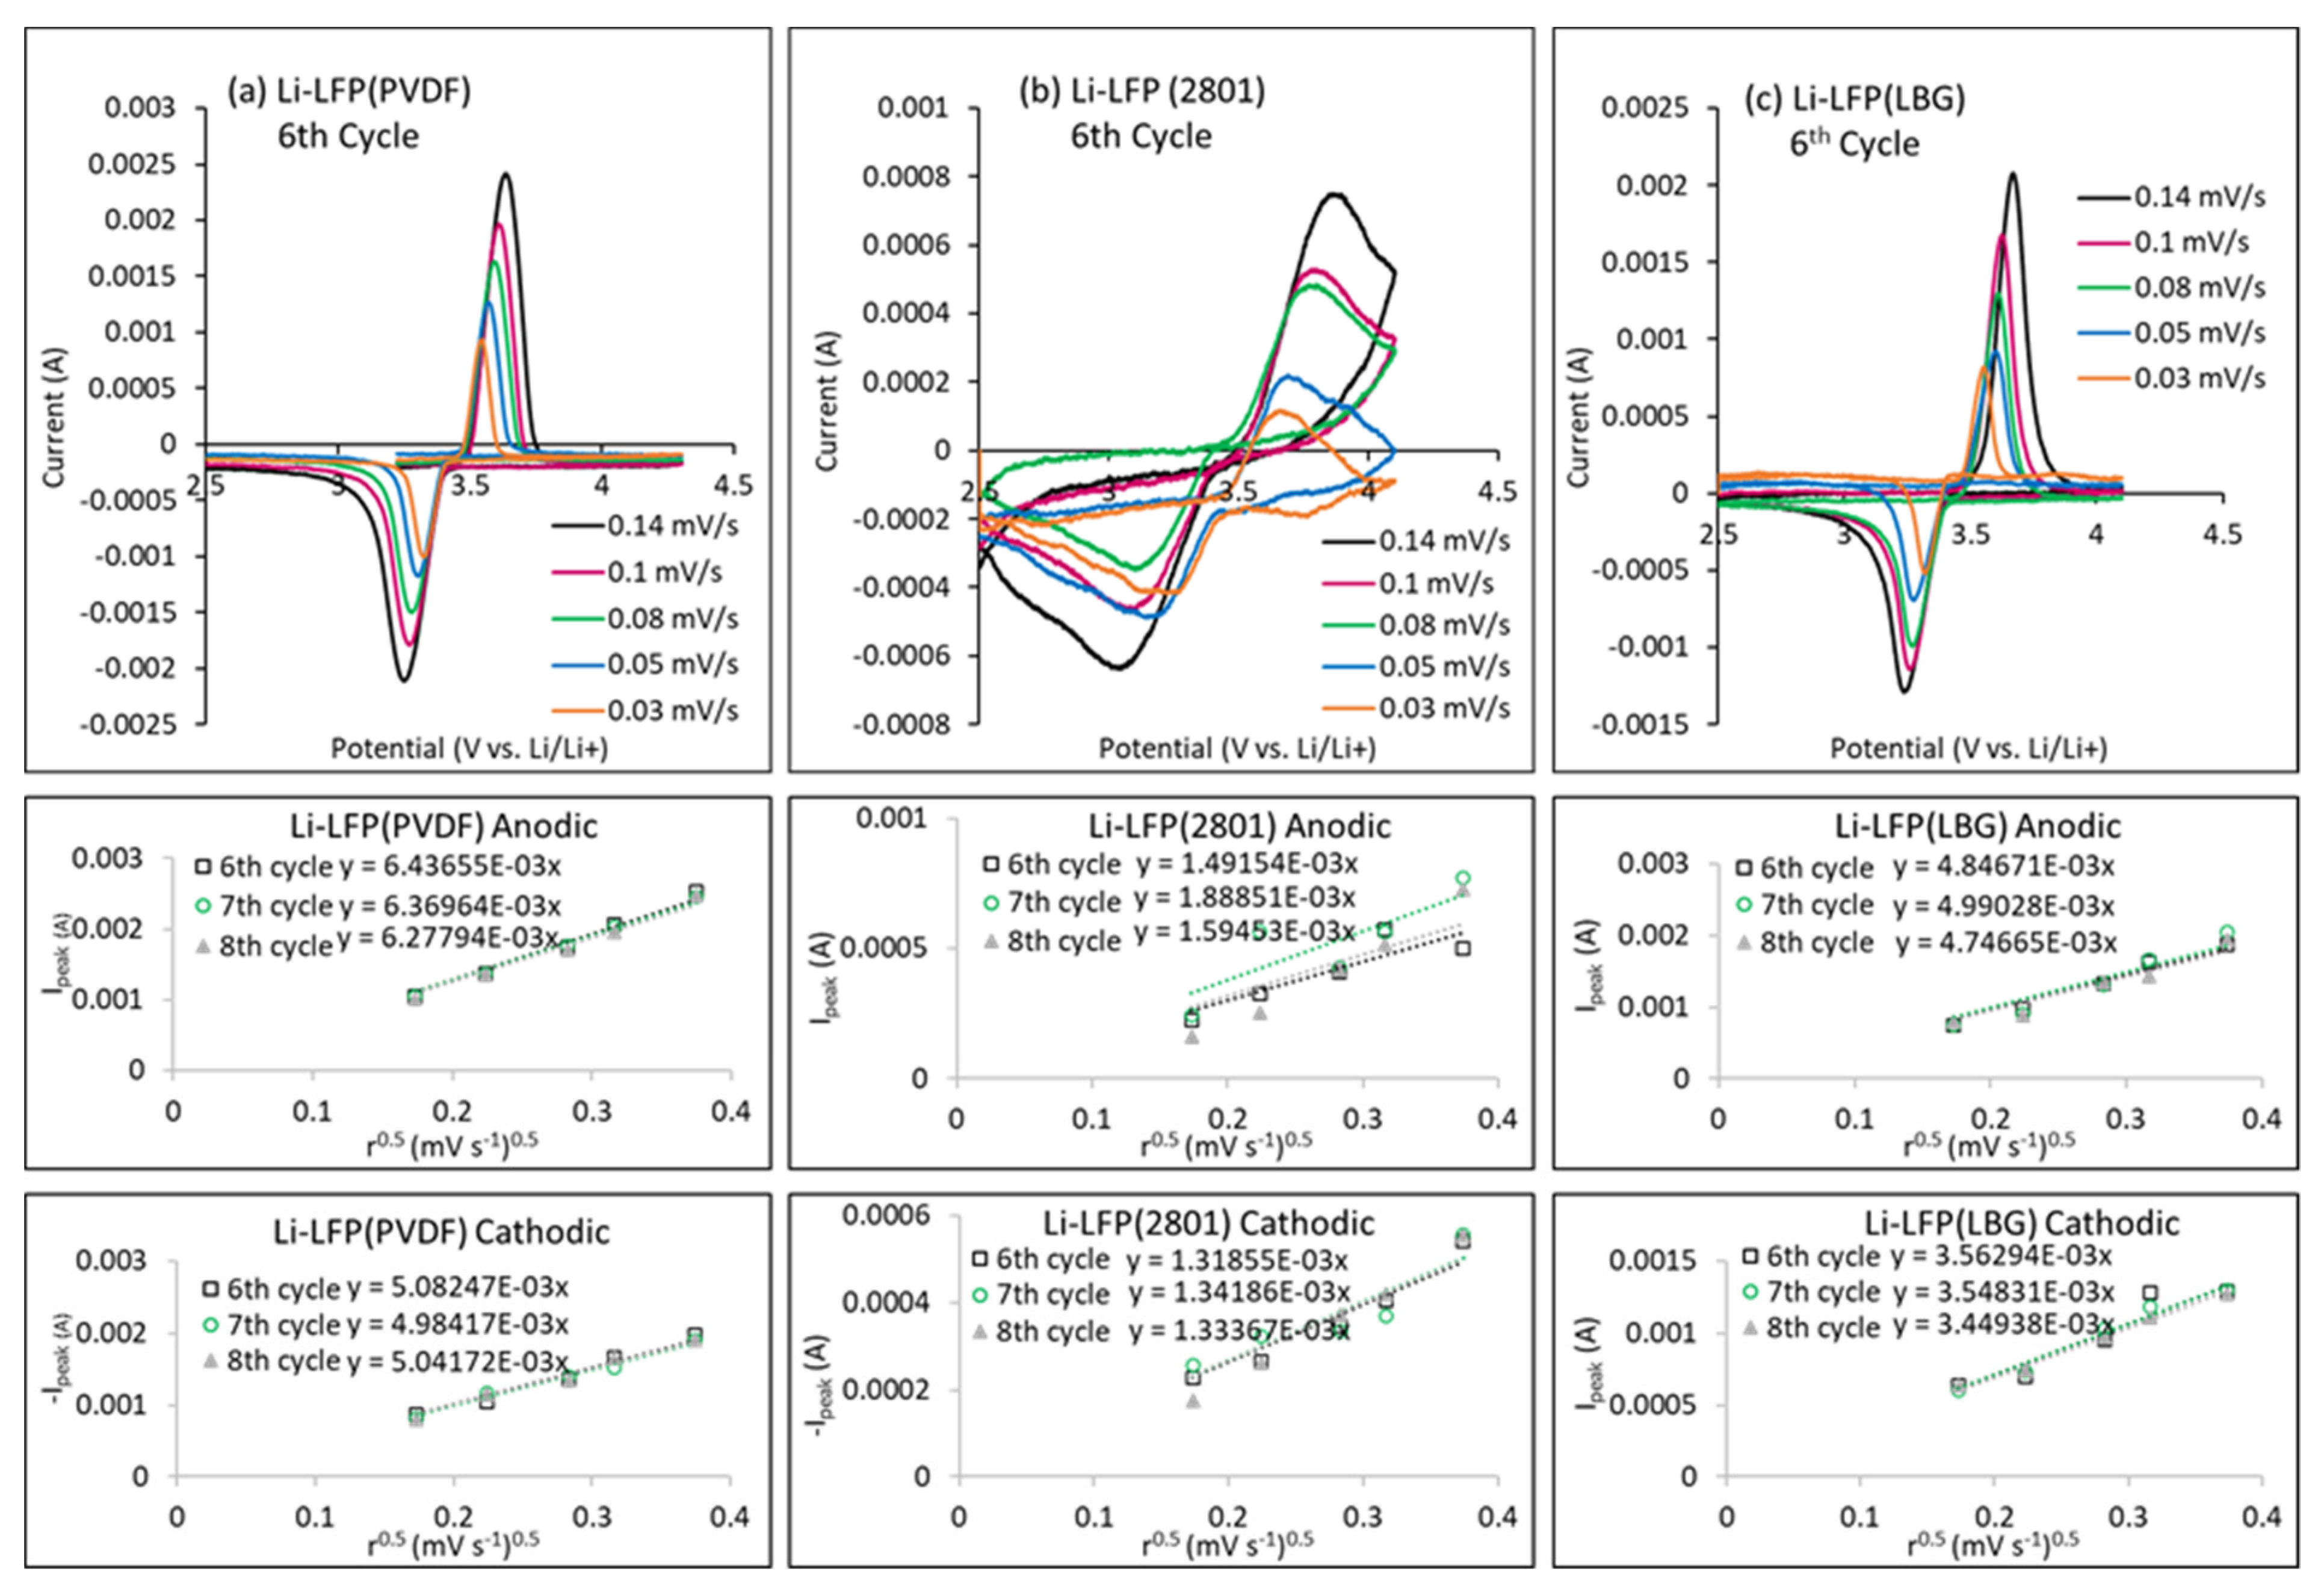
4.1. Experimental Results
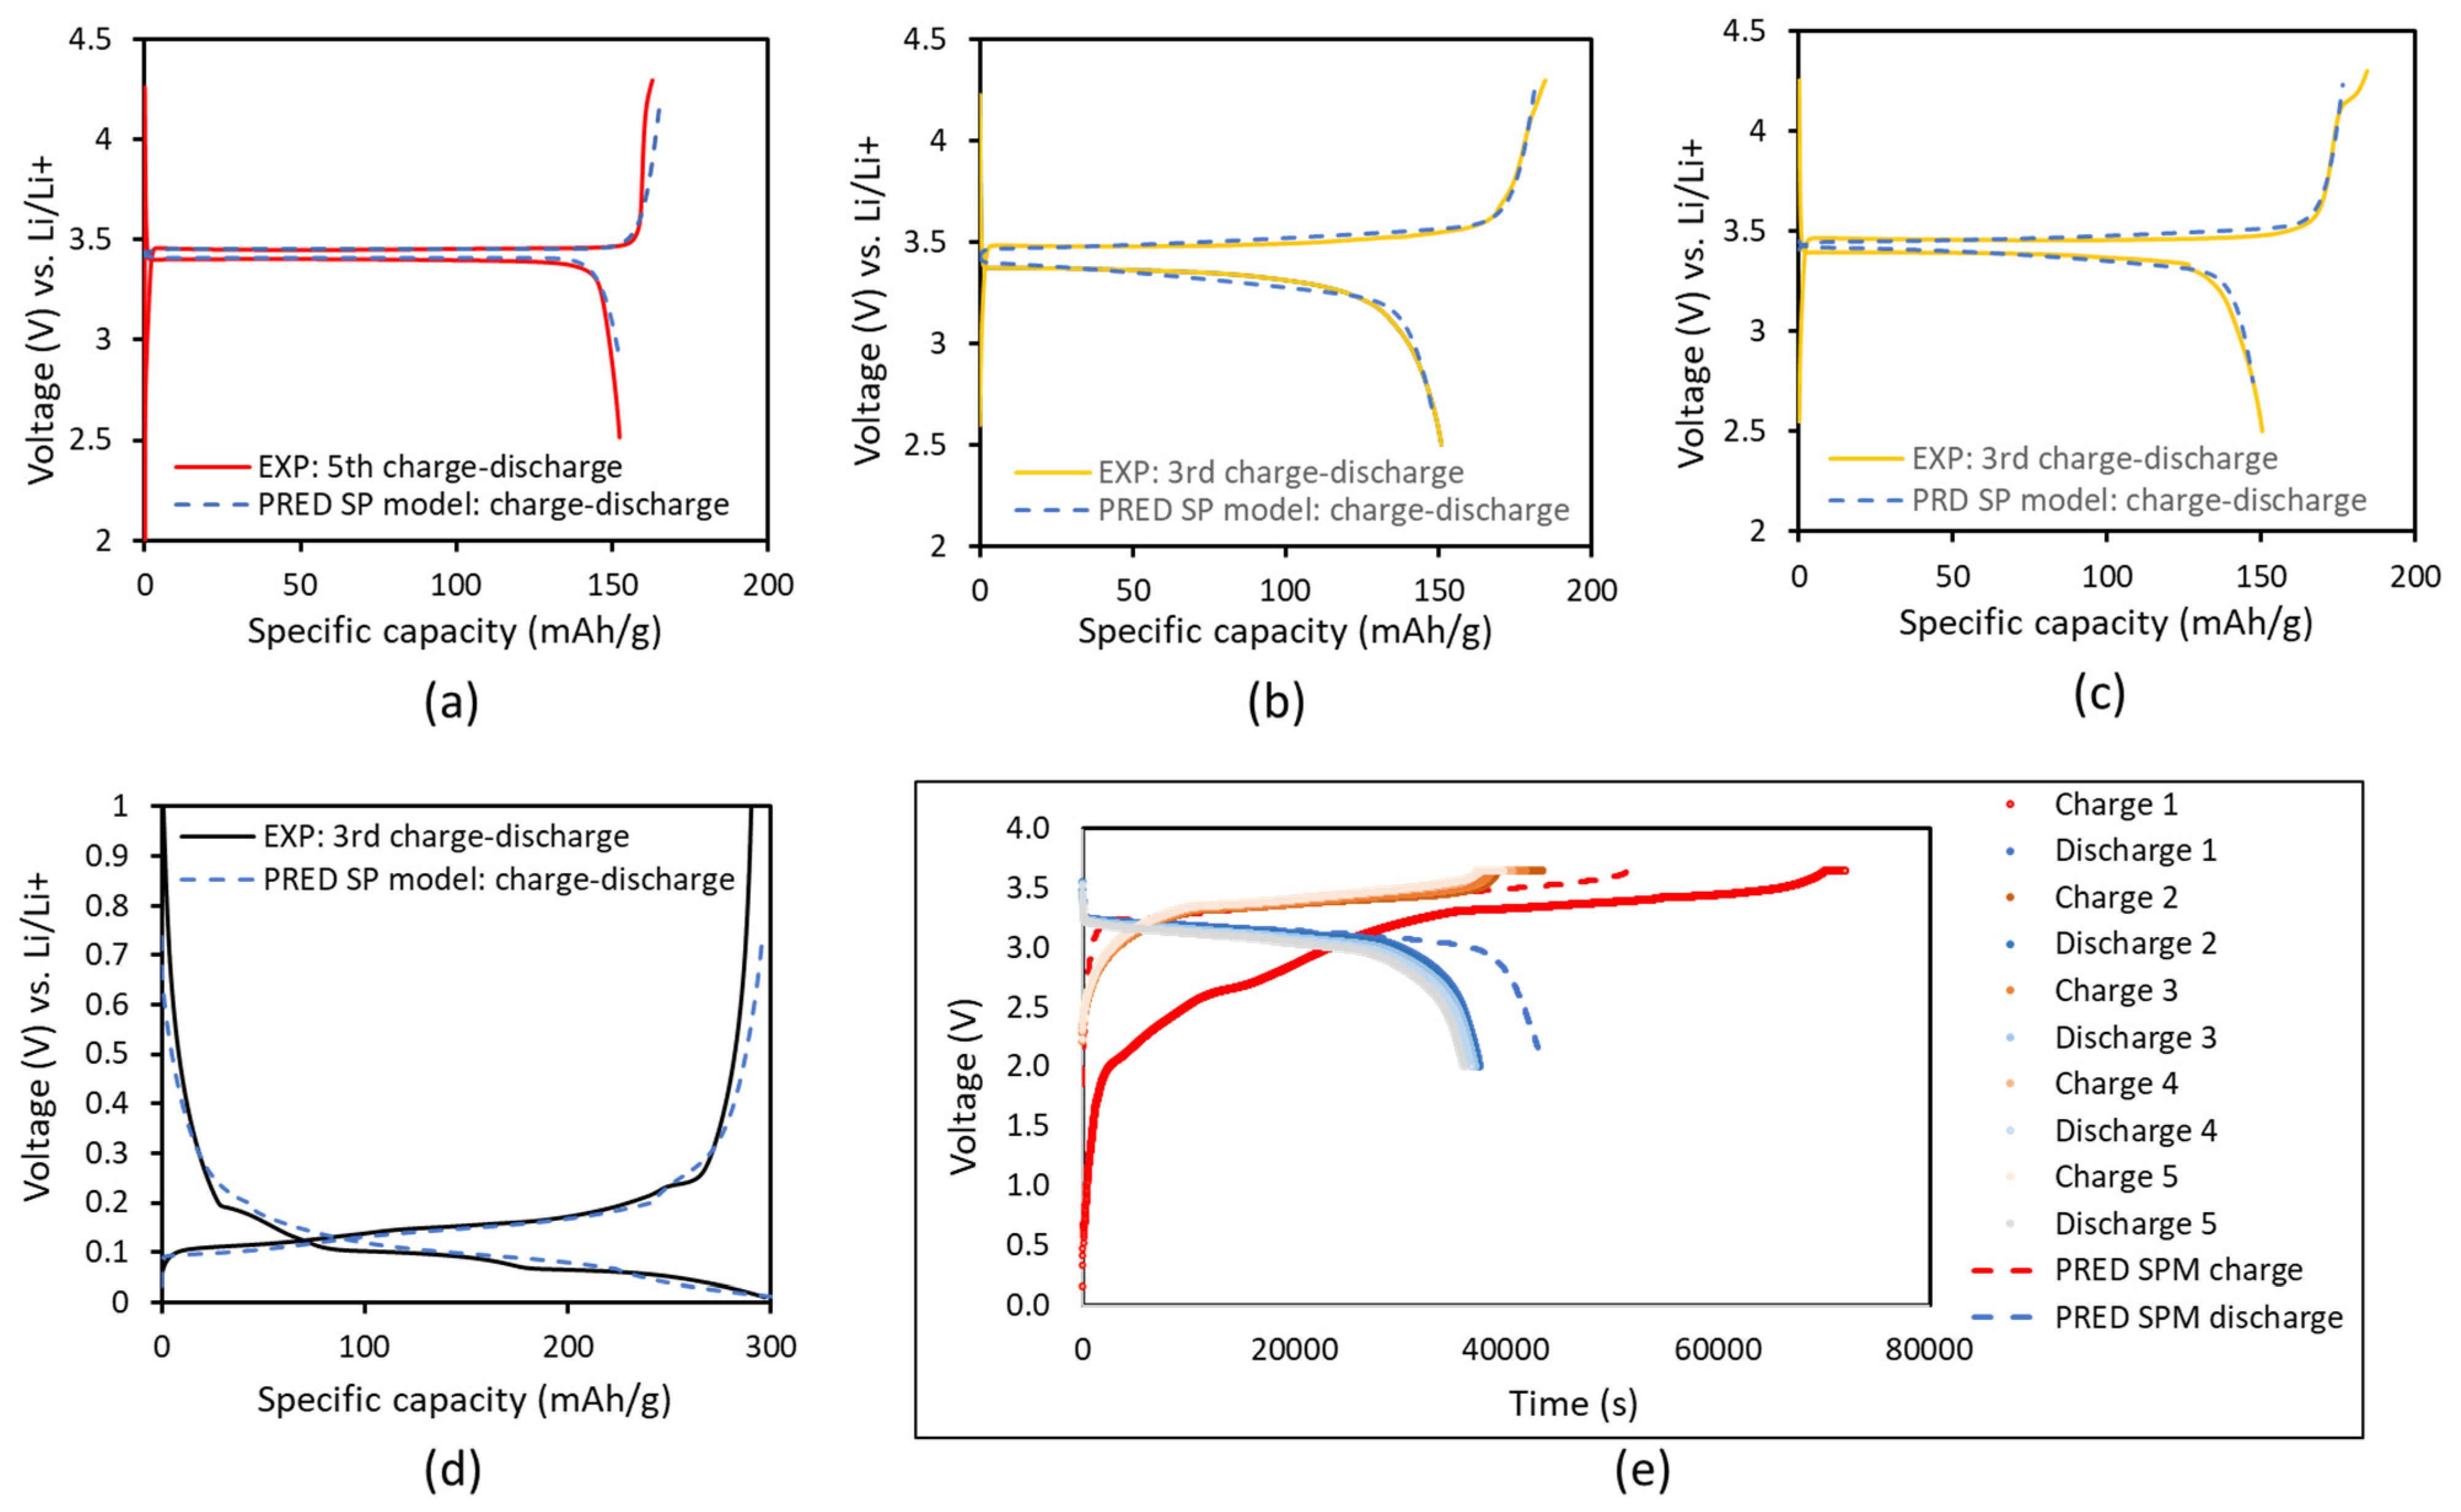
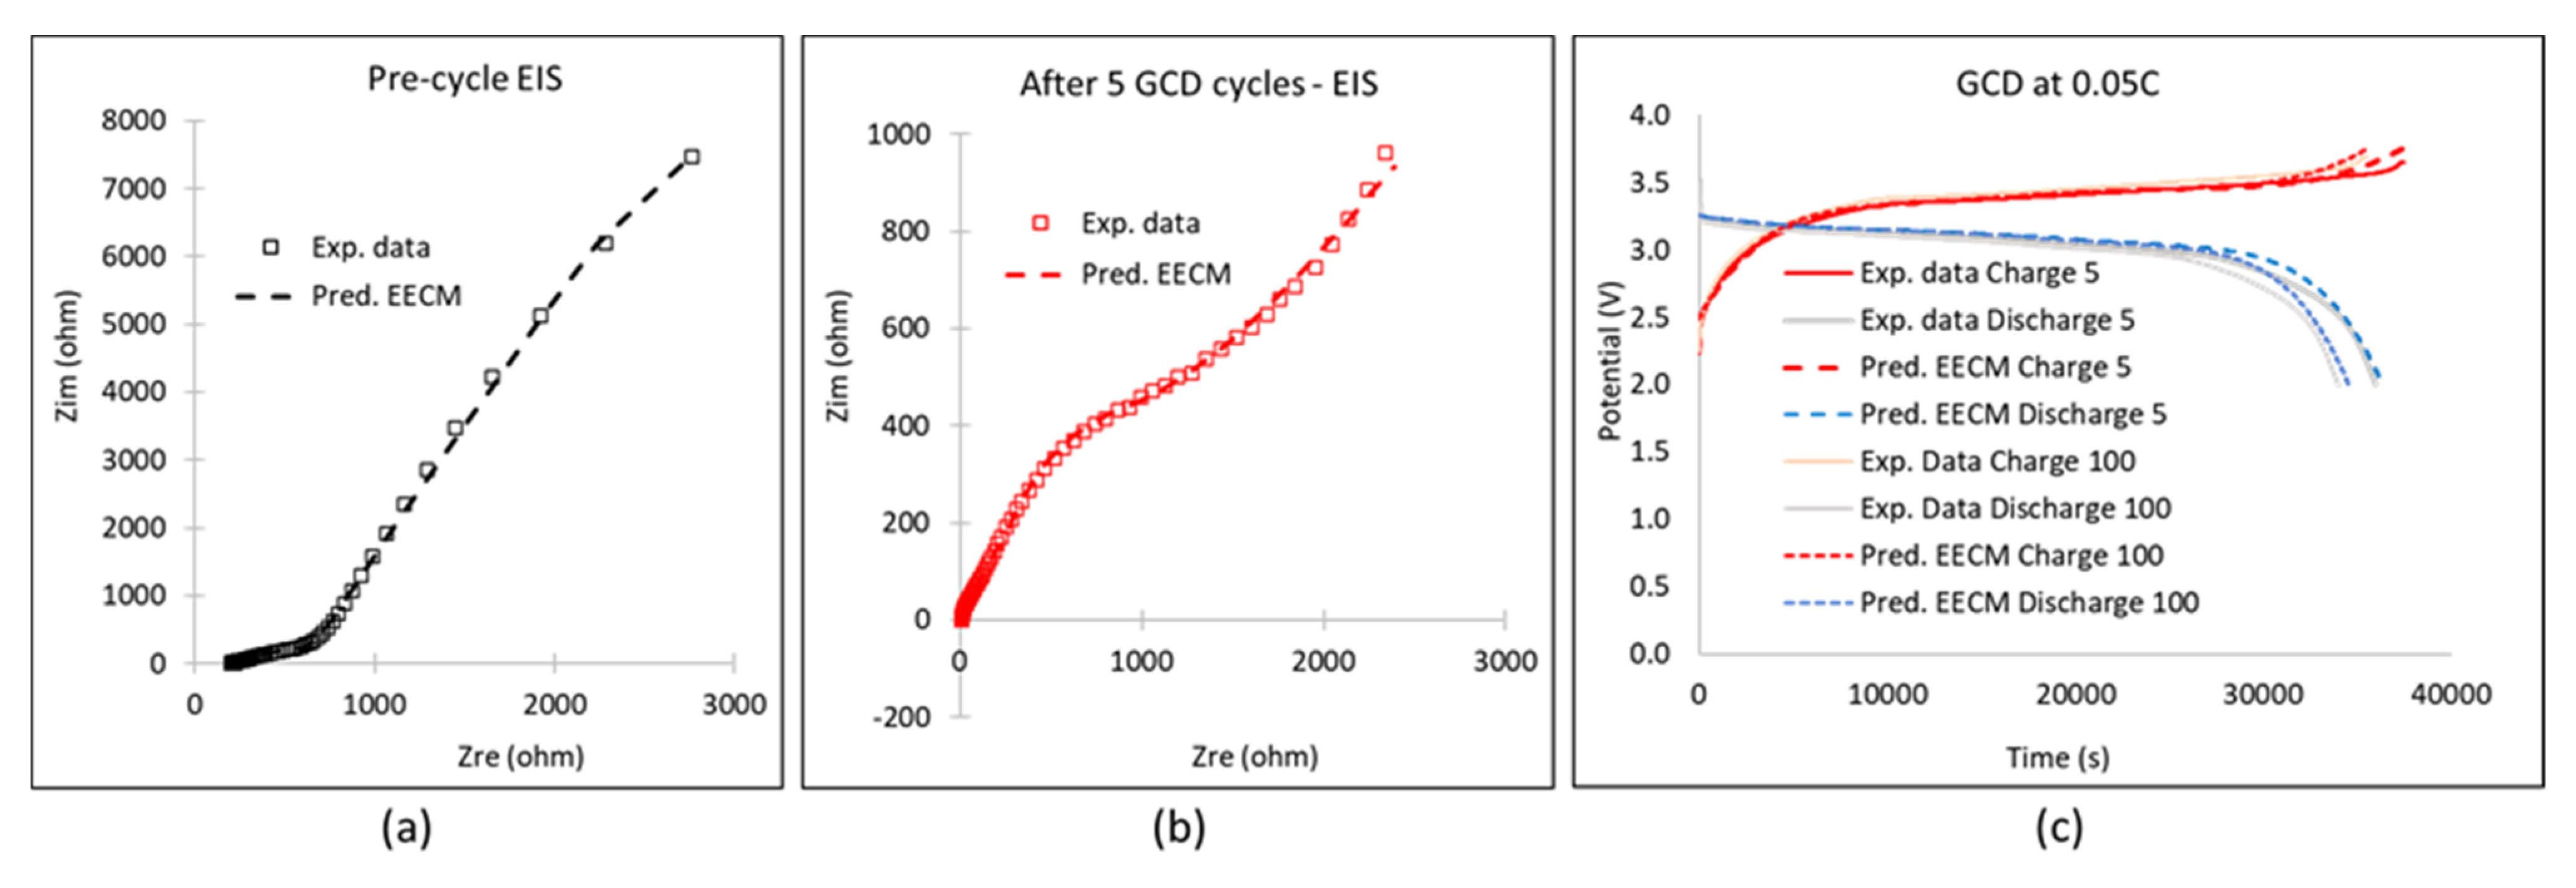
4.2. Simulation Results
5. Discussion and Concluding Remarks
Supplementary Materials
Author Contributions
Funding
Institutional Review Board Statement
Informed Consent Statement
Data Availability Statement
Acknowledgments
Conflicts of Interest
References
- Chen, Y.; Kang, Y.; Zhao, Y.; Wang, L.; Liu, J.; Li, Y.; Liang, Z.; He, X.; Li, X.; Tavajohi, N.; et al. A review of lithium-ion battery safety concerns: The issues, strategies, and testing standards. J. Energy Chem. 2021, 59, 83–99. [Google Scholar] [CrossRef]
- Saleh, A.; Lekakou, C.; Doherty, J. An investigation into energy harvesting and storage to power a more electric regional aircraft. Adv. Aircr. Spacecr. Sci. 2021, 8, 17–30. [Google Scholar]
- Santucci, A.; Sorniotti, A.; Lekakou, C. Power split strategies for hybrid energy storage systems for vehicular applications. J. Power Sources 2014, 258, 395–407. [Google Scholar] [CrossRef] [Green Version]
- Lei, C.; Fields, R.; Wilson, P.; Lekakou, C.; Amini, N.; Tennison, S.; Perry, J.; Gosso, M.; Martorana, B. Development and evaluation of a composite supercapacitor-based 12 V transient start–stop power system for vehicles: Modelling, design and fabrication scaling up. Proc. Inst. Mech. Eng. Part A J. Power Energy 2021, 235, 914–927. [Google Scholar] [CrossRef]
- Reece, R.; Lekakou, C.; Smith, P.A. A high-performance structural supercapacitor. ACS Appl. Mater. Interfaces 2020, 12, 25683–25692. [Google Scholar] [CrossRef]
- Lei, C.; Lekakou, C. Activated carbon–carbon nanotube nanocomposite coatings for supercapacitor applications. Surf. Coat. Technol. 2013, 232, 326–330. [Google Scholar] [CrossRef]
- Lekakou, C.; Moudam, O.; Markoulidis, F.; Andrews, T.; Watts, J.F.; Reed, G.T. Carbon-based fibrous EDLC capacitors and supercapacitors. J. Nanotechnol. 2011, 2011, 409382. [Google Scholar] [CrossRef] [Green Version]
- Vermisoglou, E.C.; Giannakopoulou, T.; Romanos, G.; Giannouri, M.; Boukos, N.; Lei, C.; Lekakou, C.; Trapalis, C. Effect of hydrothermal reaction time and alkaline conditions on the electrochemical properties of reduced graphene oxide. Appl. Surf. Sci. 2015, 358, 100–109. [Google Scholar] [CrossRef]
- Vermisoglou, E.C.; Giannakopoulou, T.; Romanos, G.F.; Boukos, N.; Giannouri, M.; Lei, C.; Lekakou, C.; Trapalis, C. Non-activated high surface area expanded graphite oxide for supercapacitors. Appl. Surf. Sci. 2015, 358, 110–121. [Google Scholar] [CrossRef]
- Vermisoglou, E.C.; Giannakopoulou, T.; Romanos, G.; Boukos, N.; Psycharis, V.; Lei, C.; Lekakou, C.; Petridis, D.; Trapalis, C. Graphene-based materials via benzidine-assisted exfoliation and reduction of graphite oxide and their electrochemical properties. Appl. Surf. Sci. 2017, 392, 244–255. [Google Scholar] [CrossRef]
- Reniers, J.M.; Mulder, G.; Howey, D.A. Review and performance comparison of mechanical-chemical degradation models for lithium-ion batteries. J. Electrochem. Soc. 2019, 166, A3189–A3200. [Google Scholar] [CrossRef] [Green Version]
- Ozdogru, B.; Dykes, H.; Padwal, S.; Harimkar, S.; Çapraz, O. Electrochemical strain evolution in iron phosphate composite cathodes during lithium and sodium ion intercalation. Electrochim. Acta 2020, 353, 136594. [Google Scholar] [CrossRef]
- Junga, D.H.; Kima, D.; Kimb, S.; Kima, T.W. Internal heat self-generation in lifepo4 battery module. Appl. Sci. Converg. Technol. 2020, 29, 94–97. [Google Scholar] [CrossRef]
- Wang, C.-J.; Zhu, Y.-L.; Gao, F.; Qi, C.; Zhao, P.L.; Meng, Q.-F.; Wang, J.-Y.; Wu, Q.B. Thermal runaway behavior and features of LiFePO4/graphite aged batteries under overcharge. Int. J. Energy Res. 2020, 44, 5477–5487. [Google Scholar] [CrossRef]
- Du, Z.; Wood, D.L., III; Daniel, C.; Kalnaus, S.; Li, J. Understanding limiting factors in thick electrode performance as applied to high energy density Li-ion batteries. J. Appl. Electrochem. 2017, 47, 405–415. [Google Scholar] [CrossRef]
- Frenck, L.; Sethi, G.K.; Maslyn, J.A.; Balsara, N.P. Factors that control the formation of dendrites and other morphologies on lithium metal anodes. Front. Energy Res. 2019. [Google Scholar] [CrossRef] [Green Version]
- Wang, T.; Li, Y.; Zhang, J.; Yan, K.; Jaumaux, P.; Yang, J.; Wang, C.; Shanmukaraj, D.; Sun, B.; Armand, M.; et al. Immunizing lithium metal anodes against dendrite growth using protein molecules to achieve high energy batteries. Nat. Comm. 2020, 11, 5429. [Google Scholar] [CrossRef]
- Ruschhaupt, P.; Varzi, A.; Passerini, S. Greener supercapacitors: Aqueous binders and moisture tolerant electrolytes. ECS Meet. Abstr. 2020, 3, 609. [Google Scholar] [CrossRef]
- Scalia, A.; Zaccagnini, P.; Armandi, M.; Latini, G.; Versaci, D.; Lanzio, V.; Varzi, A.; Passerini, A.; Lamberti, A. Tragacanth gum as green binder for sustainable water-processable electrochemical capacitor. ChemSusChem 2021, 14, 356–362. [Google Scholar] [CrossRef]
- Fields, R.; Lei, C.; Markoulidis, F.; Lekakou, C. The composite supercapacitor. Energy Technol. 2016, 4, 517–525. [Google Scholar] [CrossRef] [Green Version]
- Markoulidis, F.; Dawe, A.; Lekakou, C. Electrochemical double-layer capacitors with lithium-ion electrolyte and electrode coatings with PEDOT: PSS binder. J. Appl. Electrochem. 2021, 51, 373–385. [Google Scholar] [CrossRef]
- Cuesta, N.; Ramos, A.; Cameán, I.; Antuña, C.; García, A.B. Hydrocolloids as binders for graphite anodes of lithium-ion batteries. Electrochim. Acta 2015, 155, 140–147. [Google Scholar] [CrossRef]
- Aguiló-Aguayo, N.; Hubmann, D.; Khan, F.U.; Arzbacher, S.; Bechtold, T. Water-based slurries for high-energy LiFePO4 batteries using embroidered current collectors. Sci. Rep. 2020, 10, 5565. [Google Scholar] [CrossRef]
- Jeong, S.S.; Böckenfeld, N.; Balducci, A.; Winter, M.; Passerini, S. Natural cellulose as binder for lithium battery electrodes. J. Power Sources 2012, 199, 331–335. [Google Scholar] [CrossRef]
- La Monaca, A.; De Giorgio, F.; Focarete, M.L.; Fabiani, D.; Zaccaria, M.; Arbizzani, C. Polyvinylidene difluoride–polyethyleneoxide blends for electrospun separators in Li-ion batteries. J. Electrochem. Soc. 2017, 164, A6431–A6439. [Google Scholar] [CrossRef]
- Elsayed, Y.; Lekakou, C.; Labeed, F.; Tomlins, P. Fabrication and characterisation of biomimetic, electrospun gelatin fibre scaffolds for tunica media-equivalent, tissue engineered vascular grafts. Mater. Sci. Eng. C 2016, 61, 473–483. [Google Scholar] [CrossRef] [Green Version]
- Salifu, A.A.; Lekakou, C.; Labeed, F.H. Electrospun oriented gelatin-hydroxyapatite fiber scaffolds for bone tissue engineering. J. Biomed. Mater. Res. Part A 2017, 105, 1911–1926. [Google Scholar] [CrossRef]
- Markoulidis, F.; Bates, J.; Lekakou, C.; Slade, R.; Laudone, G.M. Supercapacitors with lithium-ion electrolyte: An experimental study and design of the activated carbon electrodes via modelling and simulations. Carbon 2021, 164, 422–434. [Google Scholar] [CrossRef]
- Bates, J.; Markoulidis, F.; Lekakou, C.; Laudone, G.M. Design of porous carbons for supercapacitor applications for different organic solvent-electrolytes. C 2021, 7, 15. [Google Scholar] [CrossRef]
- Baboo, J.P.; Babar, S.; Kale, D.; Lekakou, C.; Laudone, G.M. Designing a graphene coating-based supercapacitor with lithium ion electrolyte: An experimental and computational study via multiscale modeling. Nanomaterials 2021, 11, 2899. [Google Scholar] [CrossRef]
- Robinson, J.B.; Xi, K.; Kumar, R.V.; Ferrari, A.C.; Au, H.; Titirici, M.-M.; Parra-Puerto, A.; Kucernak, A.; Fitch, S.D.S.; Garcia-Araez, N.; et al. 2021 roadmap on lithium sulfur batteries. J. Phys. Energy 2021, 3, 031501. [Google Scholar] [CrossRef]
- Lasetta, K.; Baboo, J.P.; Lekakou, C. Modeling and simulations of the sulfur infiltration in activated carbon fabrics during composite cathode fabrication for lithium-sulfur batteries. J. Compos. Sci. 2021, 5, 65. [Google Scholar] [CrossRef]
- Grabe, S.; Baboo, J.P.; Tennison, S.; Zhang, T.; Lekakou, C.; Andritsos, E.I.; Cai, Q.; Downes, S.; Hinder, S.; Watts, J.F. Sulfur infiltration and allotrope formation in porous cathode hosts for lithium-sulfur batteries. AIChE J. 2022. [Google Scholar] [CrossRef]
- Dent, M.; Jakubczyk, E.; Zhang, T.; Lekakou, C. Kinetics of sulphur dissolution in lithium-sulphur batteries. J. Phys. Energy 2022, 4, 024001. Available online: https://iopscience.iop.org/article/10.1088/2515-7655/ac521d (accessed on 1 March 2022). [CrossRef]
- Doyle, M.; Fuller, T.F.; Newman, J. Modeling of galvanostatic charge and discharge of the lithium/polymer/insertion cell. J. Electrochem. Soc. 1993, 140, 1526–1533. [Google Scholar] [CrossRef]
- Fuller, T.F.; Doyle, M.; Newman, J. Simulation and optimization of the dual lithium ion insertion cell. J. Electrochem. Soc. 1994, 141, 1. [Google Scholar] [CrossRef] [Green Version]
- Doyle, M.; Newman, J.; Gozdz, A.S.; Schmutz, C.N.; Tarascon, J.-M. Comparison of modeling predictions with experimental data from plastic lithium ion cells. J. Electrochem. Soc. 1996, 143, 1890–1903. [Google Scholar] [CrossRef]
- Korotkin, I.; Sahu, S.; O’Kane, S.E.J.; Richardson, G.; Foster, J.M. DandeLiion v1: An extremely fast solver for the Newman model of lithium-ion battery (dis)charge. J. Electrochem. Soc. 2021, 168, 060544. [Google Scholar] [CrossRef]
- Gao, L.; Liu, S.; Dougal, R.A. Dynamic lithium-ion battery model for system simulation. IEEE Trans. Compon. Packag. Technol. 2002, 25, 495–505. [Google Scholar]
- Chen, W.J.; Tan, X.J.; Cai, M. Parameter identification of equivalent circuit models for li ion batteries based on tree seeds algorithm. In Proceedings of the International Conference on Sustainable Energy Engineering, Perth, Australia, 12–14 June 2017; Volume 73, p. 012024. [Google Scholar] [CrossRef]
- Tran, N.T.; Vilathgamuwa, M.; Farrell, T.; Choi, S.S. Matlab simulation of lithium ion cell using electrochemical single particle model. In Proceedings of the 2016 IEEE 2nd Annual Southern Power Electronics Conference (SPEC), Auckland, New Zealand, 5–8 December 2016; IEEE: Manhattan, NY, USA, 2017. [Google Scholar] [CrossRef]
- Schimpe, M.; von Kuepach, M.E.; Naumann, M.; Hesse, H.C.; Smith, K.; Jossen, A. Comprehensive modeling of temperature-dependent degradation mechanisms in lithium iron phosphate batteries. J. Electrochem. Soc. 2018, 165, A181–A193. [Google Scholar] [CrossRef] [Green Version]
- Safari, M.; Delacourt, C. Modeling of a commercial graphite/LiFePO4 cell. J. Electrochem. Soc. 2011, 158, A562–A572. [Google Scholar] [CrossRef]
- Rajabloo, B.; Jokar, A.; Desilets, M.; Lacroix, M. An inverse method for estimating the electrochemical parameters of lithium-ion batteries. J. Electrochem. Soc. 2017, 164, A99–A105. [Google Scholar] [CrossRef]
- Lekakou, C.N.; Richardson, S.M. Simulation of reacting flow during filling in reaction injection molding (RIM). Polym. Eng. Sci. 1986, 26, 1264–1275. [Google Scholar] [CrossRef]
- Elsayed, Y.; Lekakou, C.; Tomlins, P. Modeling, simulations, and optimization of smooth muscle cell tissue engineering for the production of vascular grafts. Biotechnol. Bioeng. 2019, 116, 1509–1522. [Google Scholar] [CrossRef]
- Markoulidis, F.; Lei, C.; Lekakou, C. Investigations of activated carbon fabric-based supercapacitors with different interlayers via experiments and modelling of electrochemical processes of different timescales. Electroch. Acta 2017, 249, 122–134. [Google Scholar] [CrossRef]
- Murugesh, A.K.; Uthayanan, A.; Lekakou, C. Electrophoresis and orientation of multiple wall carbon nanotubes in polymer solution. Appl. Phys. A 2010, 100, 135–144. [Google Scholar] [CrossRef]
- Meng, M.; Yan, H.; Jiao, Y.; Wu, A.; Zhang, X.; Wang, R.; Tian, C. A “1-methylimidazole-fixation” route to anchor small-sized nitrides on carbon supports as non-Pt catalysts for the hydrogen evolution reaction. RSC Adv. 2016, 6, 29303–29307. [Google Scholar] [CrossRef]
- Parimalam, B.S.; Lucht, B.L. Reduction reactions of electrolyte salts for lithium ion batteries: LiPF6, LiBF4, LiDFOB, LiBOB, and LiTFSI. J. Electrochem. Soc. 2018, 165, A251–A255. [Google Scholar] [CrossRef] [Green Version]
- Lee, H.; Lim, H.-S.; Ren, X.; Yu, L.; Engelhard, M.H.; Han, K.S.; Lee, J.; Kim, H.-T.; Xiao, J.; Liu, J.; et al. Detrimental effects of chemical crossover from the lithium anode to cathode in rechargeable lithium metal batteries. ACS Energy Lett. 2018, 3, 2921–2930. [Google Scholar] [CrossRef]
- Lyu, H.; Li, Y.; Jafta, C.J.; Bridges, C.A.; Meyer, H.M., III; Borisevich, A.; Paranthaman, M.P.; Dai, S.; Sun, X.-G. Bis(trimethylsilyl) 2-fluoromalonate derivatives as electrolyte additives for high voltage lithium ion batteries. J. Power Sources 2019, 412, 527–535. [Google Scholar] [CrossRef]
- Galaguz, V.A.; Potapenko, O.V.; Panov, E.V. Diffusion characteristics of the LiFePO4/C composite in an electrolyte based on LiBOB. RREC 2015, 6, 49–57. [Google Scholar]
- An, S.J.; Li, J.; Daniel, C.; Mohanty, D.; Nagpure, S.; Wood, D.L., III. The state of understanding of the lithium-ion-battery graphite solid electrolyte interphase (SEI) and its relationship to formation cycling. Carbon 2016, 105, 52–76. [Google Scholar] [CrossRef] [Green Version]
- Mercer, M.P.; Otero, M.; Ferrer-Huerta, M.; Sigal, A.; Barraco, D.E.; Hoster, H.E.; Leiva, E.P.M. Transitions of lithium occupation in graphite: A physically informed model in the dilute lithium occupation limit supported by electrochemical and thermodynamic measurements. Electrochim. Acta 2019, 324, 134774. [Google Scholar] [CrossRef] [Green Version]
- Antonopoulos, B.K.; Stock, C.; Maglia, F.; Hoster, H.E. Solid electrolyte interphase: Can faster formation at lower potentials yield better performance? Electrochim. Acta 2018, 269, 331–339. [Google Scholar] [CrossRef] [Green Version]
- Gavilán-Arriazu, E.M.; Mercer, M.P.; Pinto, O.A.; Oviedo, O.A.; Barraco, D.E.; Hoster, H.E.; Leiva, E.P.M. Effect of temperature on the kinetics of electrochemical insertion of Li-ions into a graphite electrode studied by kinetic Monte Carlo. J. Electrochem. Soc. 2020, 167, 013533. [Google Scholar] [CrossRef]


Publisher’s Note: MDPI stays neutral with regard to jurisdictional claims in published maps and institutional affiliations. |
© 2022 by the authors. Licensee MDPI, Basel, Switzerland. This article is an open access article distributed under the terms and conditions of the Creative Commons Attribution (CC BY) license (https://creativecommons.org/licenses/by/4.0/).
Share and Cite
Baboo, J.P.; Yatoo, M.A.; Dent, M.; Hojaji Najafabadi, E.; Lekakou, C.; Slade, R.; Hinder, S.J.; Watts, J.F. Exploring Different Binders for a LiFePO4 Battery, Battery Testing, Modeling and Simulations. Energies 2022, 15, 2332. https://doi.org/10.3390/en15072332
Baboo JP, Yatoo MA, Dent M, Hojaji Najafabadi E, Lekakou C, Slade R, Hinder SJ, Watts JF. Exploring Different Binders for a LiFePO4 Battery, Battery Testing, Modeling and Simulations. Energies. 2022; 15(7):2332. https://doi.org/10.3390/en15072332
Chicago/Turabian StyleBaboo, Joseph Paul, Mudasir A. Yatoo, Matthew Dent, Elaheh Hojaji Najafabadi, Constantina Lekakou, Robert Slade, Steven J. Hinder, and John F. Watts. 2022. "Exploring Different Binders for a LiFePO4 Battery, Battery Testing, Modeling and Simulations" Energies 15, no. 7: 2332. https://doi.org/10.3390/en15072332