Article

The Effect of Hydrogen Peroxide on NH3/O2 Counterflow Diffusion Flames

by
Wenkai Yang
1,
Ashraf N. Al Khateeb
2 and
Dimitrios C. Kyritsis
1,3,*
1
Department of Mechanical Engineering, Khalifa University of Science and Technology, Abu Dhabi P.O. Box 127788, United Arab Emirates
2
Department of Aerospace Engineering, Khalifa University of Science and Technology, Abu Dhabi P.O. Box 127788, United Arab Emirates
3
Research and Innovation Center for CO2 and H2, Khalifa University of Science and Technology, Abu Dhabi P.O. Box 127788, United Arab Emirates
*
Author to whom correspondence should be addressed.
Energies 2022, 15(6), 2216; https://doi.org/10.3390/en15062216
Submission received: 30 December 2021 / Revised: 1 March 2022 / Accepted: 7 March 2022 / Published: 17 March 2022
(This article belongs to the Special Issue Energy-Saving and Carbon-Neutral Technologies for Maritime Transport)

Abstract

:
The impact of adding H2O2 in the fuel stream on the structure of non-premixed opposed-flow NH3/O2 flames was investigated numerically using a verified computational tool and validated mechanism. The results illustrate the dual role of the added H2O2 within the fuel jet. A small amount of H2O2 within the NH3 stream acted as a fuel additive that enhanced the reaction rate via reducing the kinetic time scale. However, a novel flame structure appeared when the H2O2 mole fraction within the fuel stream increased to χ H 2 O 2 > 16%. Unlike the pure NH3/O2 flame, a premixed reaction zone was discerned on the fuel side, in which H2O2 reacts with NH3 and played the role of an oxidizer. Then, the remaining NH3 that survived premixed combustion continues reacting with O2 and forms a non-premixed flame. As a result of this structure, it was shown that the well-established conclusion of “near-equilibrium” non-premixed flame analysis in which the strain on the flame is determined by the momentum fluxes of the counter-flowing streams does not hold for the flames that were studied in this paper. It was also shown that when H2O2 acted as an oxidizer, it produced substantial amounts of HO2, which allowed for low-temperature formation of NO2 through the reaction of NO with HO2.

1. Introduction

According to the International Maritime Organization, maritime shipping contributes approximately 3% of the global greenhouse gas emissions, which are to be reduced to 50% of their 2008 level by 2050 [1]. In order to achieve this ambitious goal, this multi-trillion sector of the world economy will need an energy source that is carbonless, has a high-energy density, and for which the technology and infrastructure of storage and distribution is advanced to the point that it can be deployed, stored, and managed at the quantities and conditions that the marine application demands. Ammonia fits all these demands; it can notably provide an energy density (obviously crucial for the maritime application) that is higher than the one of liquid hydrogen [2] and 10 times higher than the one of lithium battery [1]. Although a ship that uses ammonia as a fuel does not exist currently, this will not be for long: Wärtsilä have already begun testing ammonia as a fuel in a maritime combustion engine and MAN and Samsung Heavy Industries are collaborating in order to deliver the first ammonia-fueled tanker by 2024 [1]. At exactly the same time, i.e., in 2024, Equinor’s Viking Energy will become the first vessel powered by an ammonia fuel cell. The American Bureau of Shipping has published estimates indicating that as much as 35% of maritime fuel can be ammonia by 2050 [3] and M.B. Christiansen, VP and Head of Decarbonization in A.P. Moller–Maersk, has stated that “Alongside methanol… we see green ammonia as an important future fuel for the decarbonization of our fleet [4]”.
It is of course realized that the technical challenges associated with NH3 combustion are non-trivial. In particular, NH3 demonstrates long ignition delays and low flame speeds [5], as well as increased NOx emissions [6,7,8]. Interestingly, the two main caveats of NH3 combustion are not extremely problematic for the low-speed marine engines that are used for the very large majority of their time of operation far away from urban areas, and this makes the possible maritime application of ammonia even more attractive. However, bustling research activity has recently been initiated in order to address these issues, which includes detailed, high-fidelity modeling of the chemistry of ammonia oxidation [9,10] and combustion of fuel blends of ammonia with carbon-containing fuels of reduced carbon footprint such as light ethers [11,12] and oxyethylene ethers (OMEx) [13]. A system design that will allow ammonia combustion in marine vessels is described in what we consider a masterly article that is part of this special collection [14], is based on an idea that is similar to what was originally proposed for smaller engines by Frigo and Gentili [15], and involves on-board cracking of ammonia in a catalytic reactor in order to first generate hydrogen and then use as a fuel the NH3/H2 mixture sometimes referred to with the (perhaps misleading) term “dissociated ammonia.”
Cracking ammonia with an on-board catalytic reactor is a very good way to tackle the serious issues of ammonia combustion but not necessarily the only one. In a line of recent work, we were able to point to the effectiveness of H2O2 in alleviating the issues of NH3 combustion. In particular, in [16,17] we were able to show that H2O2 addition to a homogeneous NH3/air mixture could reduce the ignition delay drastically: with an addition of just 2%-molar H2O2, a reduction in ignition delay by a factor of as much as 30 could be achieved, along with a mild increase in maximum temperature that could reach as much as 100 K for 10%-molar H2O2. The detrimental effect of the flame temperature increase in relation to NO formation could be relatively easily managed with H2O addition, as shown in [17]. As much as these results are promising in terms of the potential of NH3/H2O2 mixtures as carbonless fuels that can serve current combustion engines, they relate to homogeneous, zero-dimensional mixtures in which no transport has been accounted for and the combustion develops as a homogeneous explosion and not in the form of flames.
In this paper, we are covering this shortage and study counterflow diffusion flames of NH3 with O2, in which H2O2 is added to the fuel stream. With this comparison, we are building on our recent work that compared the structure of NH3/O2 diffusion flames with the well-established structure of CH4/O2 flames [18] as well as the fundamentals of NH3 and CH4 oxidation [19]. The counterflow flame configuration, which can provide flat, strained premixed and non-premixed flames has already been used in order to address the fundamentals of NH3 combustion and the importance of this canonical configuration for both experimental and computational studies is highlighted in [5]. So far, counterflow ammonia flames have been used mainly for the determination of extinction strain rates in flames of pure NH3 [20] as well as NH3/CH4 mixtures [21,22,23], however, to our knowledge the effect of H2O2 addition in ammonia flames has not been explored.
A series of considerations point to the potential importance of transport in flames of NH3/H2O2 mixtures. First, H2O2 is much heavier and therefore less diffusive than NH3, something that will undoubtedly affect its transport in the flow-field. More importantly, and similarly to what happens extensively in propulsion applications [24], H2O2 can act as an oxidizer, even in the complete absence of oxygen. In this paper, we explored the effect of H2O2 addition in the fuel stream on NH3/O2 diffusion flames with a computational tool that we have verified extensively in [18] and we were able to show structural phenomena that, to our knowledge, have not been reported before and call for expedient experimental validation.

2. Methodology

Adopted from Farraj et al. [25], a schematic diagram of the considered non-premixed crossflow burner and the assigned computational domain are shown in Figure 1. The showed domain is extended 40 mm radially and axially. It mimics the vicinity around two 15 mm diameter coaxial nozzles, which lie opposite to each other with d = 15 mm gap between them. For the fuel and the oxidizer inlets, uniform temperature and velocity profiles were adopted. The outer walls of the two nozzles were assigned as adiabatic walls with no slip conditions and at a fixed temperature of 300 K.
Within the 2D axisymmetric computational domain, the interaction between N molecular species composed of L atomic elements that undergo M reversible reactions is governed by the conservation equations of mass, momentum, and energy, and the species evolution equations [26,27]. Ignoring the body force, the radiative heat transfer, and the thermal diffusion, these equations are:
· ( ρ u ) = 0  
· ( ρ u u + p I τ ) = 0  
· ( ρ u ( e + u · u 2 ) + ( p I τ ) · u + q ) = 0  
· ( ρ u Y i + J i ) = W i ω ˙ i ,   i = 1 , 2 , , N 1  
The independent variables are the spatial coordinate r and z. The dependent variables are pressure p, mixture velocity vector u, mixture density ρ, mixture mass-based specific internal energy e, and the ith species mass fraction Yi. Here, τ is the mixture viscous stress, q is the total heat flux, and for the ith species, Ji, W i , and ω ˙ i , are the diffusive mass flux, the molecular mass, and the molar production rate per unit volume, respectively.
To complete this system of equations, the following standard set of constitutive relations for an ideal mixture of calorically imperfect ideal gases is adopted [28]:
τ = η [ u + ( u ) T 2 3 ( · u )   I ]
q = κ T + i = 1 N h i J i  
J i = ρ D i Y i ,   i = 1 , 2 , , N 1  
where κ is the thermal conductivity of the mixture, and for the ith species, hi and Di are the mass-based enthalpy and the mixture-averaged diffusion coefficient, respectively. The species are reacting according to the law of mass action for detailed kinetics using Arrhenius temperature-dependency,
ω ˙ i = j = 1 M ( ν i j ` ` ν i j ` )   A j T β j e E j R T   ( i = 1 N ( c i ) ν i j ` 1 K j c i = 1 N ( c i ) ν i j ` ` ) ,   i = 1 , 2 , , N 1
Here, R is the universal gas constant, c i = ρ Y i W i is the molar concentration of the ith species, and for the jth reaction, ν i j ` ` ,   ν i j ` ,   A j ,   β j ,   E j ,     and   K j c are the stoichiometric coefficients of the ith species, denoting the number of moles of products and reactants, the collision frequency factor, the temperature-dependency power, the activation energy, and the Gibbs free energy based equilibrium constant, respectively.
To simulate the reactive flow within the computational domain illustrated in Figure 1, the computational domain is discretized into 140,850 quadrilateral cells using a uniform grid of size Δxi = 0.1 mm. Then, the complete system of equations, Equations (1)–(8), along with the applied boundary conditions listed in Table 1, is solved using ANSYS-Fluent platform via employing a second-order central-difference integrating scheme. A detailed kinetic mechanism identical to that of Khalil et al. [16], with L = 3 elements, N = 33 species, and M = 211 reversible reactions, is employed in the simulation. All computations were undertaken at Khalifa University HPC; the 64-node, 12-core 2.9-GHz cluster.
The choice of mechanism for the modeling of the chemical kinetics was guided by a comparison between two state-of-the-art mechanisms that we have reported in [18] and we will summarize here for the purpose of completeness. In particular, in [18] we have compared the performance of the mechanism that we constructed by removing the carbon chemistry from the Aramco 2.0 mechanism with the performance of the recently published mechanism by Zhang et al. [10], which is supported by high-fidelity data in a jet-stirred reactor. The two mechanisms were employed to model a laminar, non-premixed, counterflow ammonia flame. The comparison in [18] showed excellent agreement in terms of computation of temperature, flow field, and major species (N2, H2, and H2O). The comparison was also very good in terms of calculation of NO mass fraction with the two mechanisms differing by a maximum of 15% in the computed result for the mass fraction across the flame. The mechanism employed in [18] and here were overestimating the production of NO with respect to the mechanism of [10]. The agreement was less satisfactory with respect to the computation of NO2 mass fraction, for which the result computed using the two mechanisms could differ by as much as 50%. However, given that the arguments that we will develop in this paper refer to the macroscopic features of the flames and not to detailed computations of emissions, we consider the agreement of our mechanism with the one in [10] and the experimental data therein satisfactory.
Similarly, the employed CFD tool has been already rigorously verified in our recent work [18] via, (1) performing a formal grid convergence study, (2) comparing the obtained results to those previously reported in the classical counterflow-computation of Smooke et al. [29] for CH4 diffusion flame. For the first verification test, a mesh convergence study was conducted, in which five different uniform grid sizes were used to obtain the stationary structures of non-premixed, opposed-flow methane flames. In this test, the rate of convergence of the relative error was consistent with the used numerical scheme truncation error. For the second test, the methane–air flame structure reported in the classical results of [29] was reproduced using our own CFD tool. The presented results in [29] were obtained using oppdif, which is the 1D Chemkin code for modeling opposed-flow diffusion flames. A comparison between the obtained results using our CFD tool and the results presented in [29] showed a satisfactory agreement in terms of resolving temperature, major species, even OH and H in the high-temperature zone of the flame. Minor disagreements between the two results in the low-temperature regions of the flame were attributed to the fact that the computations in [18] and here are computations in a finite domain, whereas Smooke et al. [29] performed an essentially 1D computation using infinitely wide counterflowing streams.

3. Results and Discussion

In [18], we compared combustion characteristics and flame structure of NH3/O2 and CH4/O2 counterflow diffusion flames and showed that NH3 combustion underwent slower kinetics and caused a weaker thermal expansion than CH4 combustion. In order to address weaknesses of ammonia flames, a possible solution was provided by the recent results of Khalil et al. [16], which showed that for homogeneous, isochoric, and adiabatic auto-ignition of ammonia, the addition of H2O2 brought about a significant reduction in the ignition time in the ammonia/air combustion. The analysis of [16] did not take any transport phenomena into consideration. In this paper, we address this shortage by investigating the structure of counterflow diffusion flames where H2O2 is added to the stream of NH3 fuel.
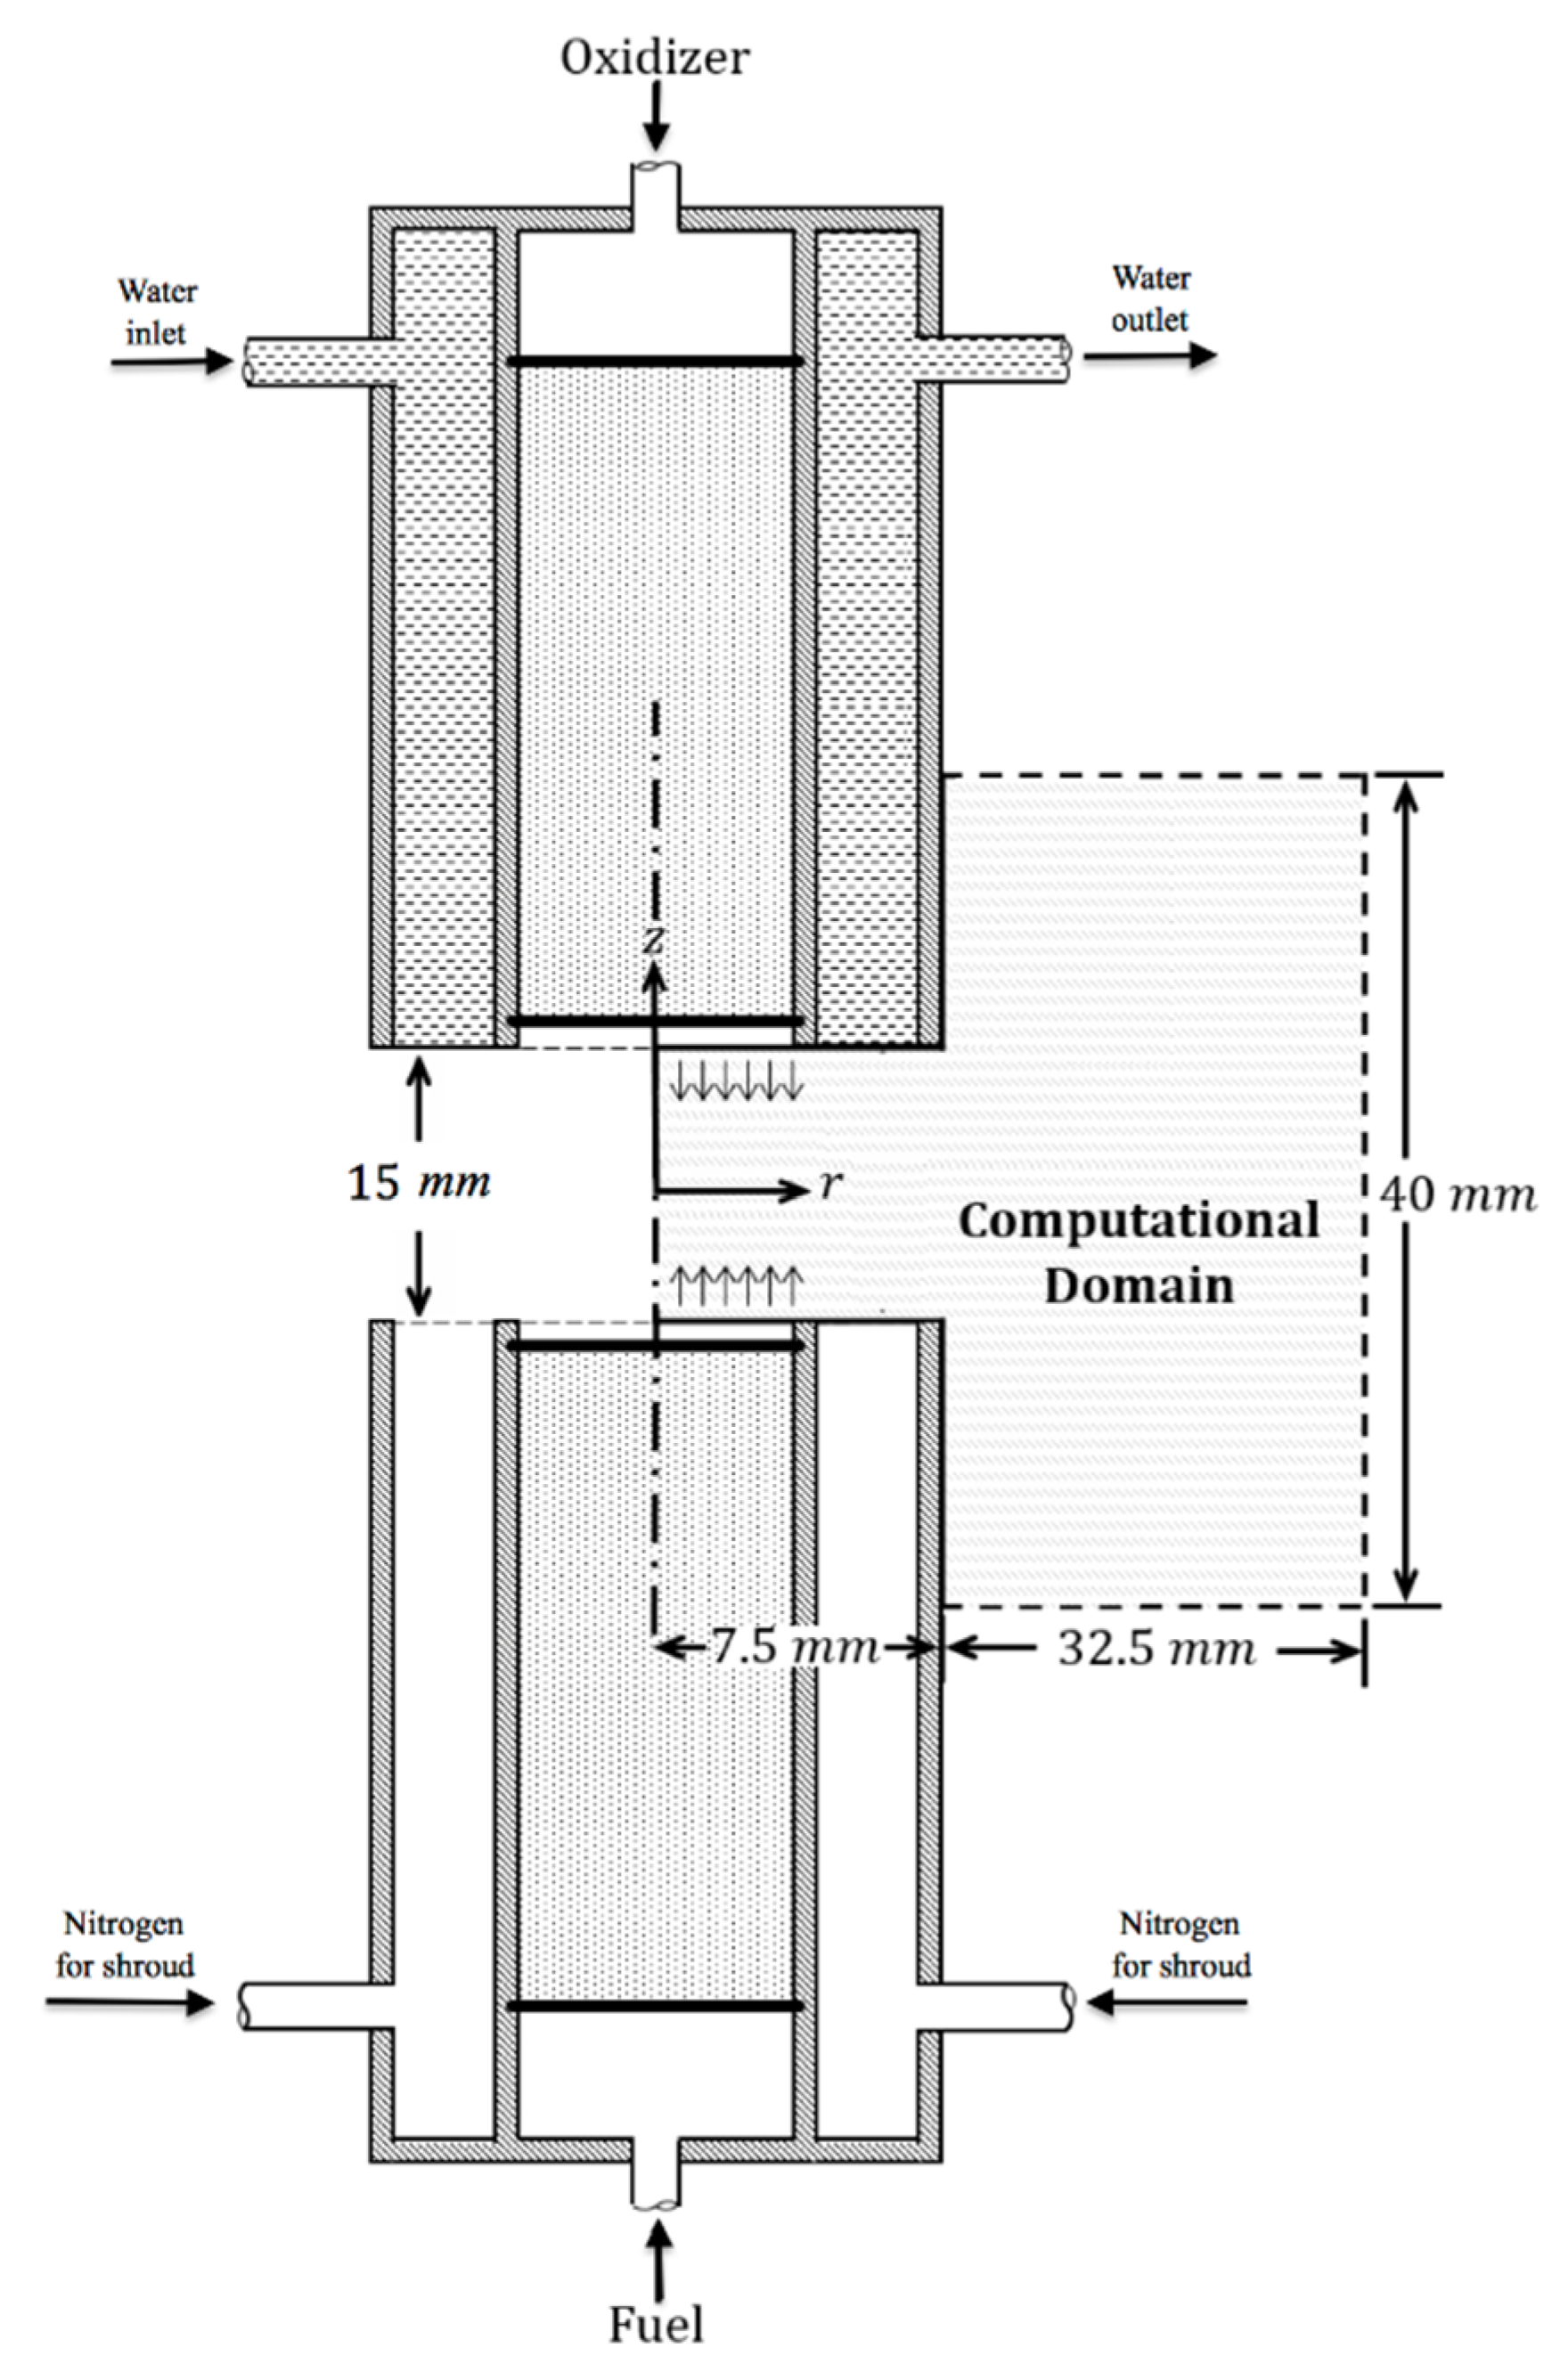
In order to pursue this, the flow fields of five counterflow diffusion NH3-H2O2/O2 flames with varying H2O2 composition were computed utilizing ANSYS-Fluent. In these five flames, the mole fractions of H2O2 in the fuel stream were 0%, 10%, 16%, 20%, and 30%, respectively. An estimate of the strain rate at the stoichiometric surface (Kstoich) was calculated using the equation formulated by Seshadri and Williams [30]:
K s t o i c h = 2   U o x d [ 1 + U f U o x ( ρ f ρ o x ) 1 2 ]
where Uox is the velocity of the oxidizer stream; ρox is the density of the oxidizer stream; Uf is the velocity of the fuel stream; ρf is the density of the fuel stream; and d is the distance between the fuel and oxidizer nozzle. This expression assumes that the NH3/H2O2–O2 flame is a “near-equilibrium” flame in the sense indicated in the classical paper by Liñán [31]. Thus, the reaction happens at a relatively thin sheet at the “stoichiometric” surface, which is the surface at which the transport rates of the two reactants are at a stoichiometric proportion. This is the only location in the non-premixed flame where the reaction rate is non-zero and it is the maximum temperature locus. As shown in [26,27], in order to determine the location of the stoichiometric surface we first define the mixture fraction Z as:
Z = X X o X F X 0
where the subscripts F and O denote the fuel and oxidizer inlet, respectively, and X is the so-called “conserved scalar”, which can be formulated as X = Y f Y O 2 / ν . Y denotes mass fraction, ν the oxidizer/fuel stoichiometric mass ratio, and the subscripts f and O2 denote fuel and oxygen, respectively. By construction, X = 0 at the stoichiometric surface, which means that the value of Z at this surface (Zstoich) can be immediately calculated from Equation (10). The locus of the points in the solved flow field for which Z = Zstoich is the stoichiometric surface. We will very shortly show that, for several of our flames the flame structure underlying these assumptions and therefore the validity of Equation (9) does not pertain. When we establish this result, we will re-visit the validity of the approximation of Equation (9).
In order to focus on fuel chemistry on the flames and isolate inertial effects, the fuel and oxidizer streams of all five flames had the same momentum. The velocities of oxidizer streams were kept at 0.2 m/s. Because of the varying H2O2 content, the fuel stream speed had to vary in order for the momentum of all five streams to be the same, as shown in Table 2.

3.1. Novel Flame Structure

Results for temperature and axial velocity of five NH3-H2O2/O2 flames along the axisymmetric line are provided in Figure 2 and Figure 3, respectively. In the abscissa of these and similar following figures, the spatial location along the centerline is presented. The location zero is in the middle of the distance between two nozzles. The fuel nozzle from which the NH3/H2O2 mixture emanates is located at −7.5 mm and the oxidizer nozzle at 7.5 mm.
Figure 2 shows that the gradual increase in H2O2 content has a spectacular effect on flame structure that to our knowledge has not been reported in the literature before. Specifically, for low H2O2 content (mole fraction under 16%), basically the structure is similar to the one that shown in [18] for non-premixed NH3/O2 flames, which is the usual, “near equilibrium”, non-premixed flame structure of [26,27,31]. Specifically, it comprises one high-temperature zone approximately in the middle of the gap between the nozzles. The results are in agreement with [4], which points out that the oxidation of NH3 is different than that of hydrocarbons such as CH4, which is completed with formation of CO2. Instead, the equilibrium product of NH3 oxidation is N2. Thus, the inability to form a significant amount of nitrogen oxide as equilibrium product results in relatively small heat release and limit the reaction in one, relatively thin (compared to CH4) reaction zone.
However, this situation changes drastically when the mole fraction of H2O2 increases above 16%. As shown in Figure 2, for molar fractions of 20% and 30%, the temperature rises near the fuel nozzle, immediately when the mixture enters the flow field and reaches an intermediate plateau where it stays at an intermediate value in the order of 1400 K. This temperature increase also causes a strong expansion and acceleration of the flow in the vicinity of the fuel nozzle, as shown in Figure 3. As shown in Figure 2, a first indication of this two-step temperature increase is provided when the mole fraction of H2O2 in the initial mixture is 16% and, when this value reaches 20%, the plateau is clearly discernible. Figure 4 presents the two-dimensional distributions of temperature in the flow field. Focusing on the region near the fuel inlet, one can see that for H2O2 mole fraction at the entrance higher than 16%, the high-temperature region expands towards the fuel nozzle and for H2O2 inlet mole fractions larger than 20%, there is an extended high-temperature zone that extends all the way to the fuel nozzle.
The reason for this, to our knowledge, unprecedented flame structure is revealed when one looks at the mole-fraction distribution of NH3, H2O2, and O2 in Figure 5.
It is shown there, that for H2O2 mole fraction at the entrance smaller than 16%, H2O2 acts as a fuel additive. NH3 and H2O2 are both transported towards the high-temperature region of the flow, and they disappear gradually as they diffuse into this region and react with oxygen that diffuses from the other side into the high-temperature zone in order to react with the fuel. As pointed out in [16,17,19], in such mixtures the main action of H2O2 is to accelerate the NH3-oxidation kinetics by providing OH radicals that realize the very limited chemical runaway of the NH3-oxidation reaction.
However, this changes drastically for initial H2O2 mole fractions larger than 16%. As shown in Figure 5, in such mixtures, H2O2 disappears practically immediately upon entrance in the flow field, whereas ammonia first decreases rapidly and then retains an intermediate value of the mixture fraction until it is transported further and then reacts with oxygen. Since no oxygen is present in the region of this initial ammonia depletion, this shows that NH3 actually reacts with H2O2 according to the reaction
2NH3 + 3H2O2 → N2 + 6H2O
The main conclusion of this paper is that the chemical function of H2O2 changes drastically, when its addition to the NH3 fuel surpasses 16% molar: specifically, H2O2 turns from a fuel additive to an oxidizer, in a way similar to the one that it has been reported to act in rocket propulsion [32]. The equivalence ratio of reaction (11) as a function of H2O2 mole fraction in the mixture is shown in Figure 6.
For mole fraction of H2O2  χ H 2 O 2 > 16%, H2O2 acts as an oxidizer and provides O atoms for NH3 oxidation. However, this reaction will not happen outside its “flammability limits”. When the H2O2 mole fraction in the initial fuel mixture is below 16%, the structure of the reactive flow field is similar to the one of pure NH3/O2 flames, because the NH3/H2O2 mixture is too rich for reaction (11) to ignite. As shown in Figure 6, a mixture of ammonia with 10%-molar H2O2 addition corresponds to an equivalence ratio of 13.5, which is too high to make the NH3/H2O2 reaction ignite. Evidently the reaction occurs when the mole fraction of H2O2 exceeds 16%, which is equivalent to the equivalence ratio of reaction (11) dropping below 7.9.

3.2. Distributions of Reaction Intermediates and Products

This novel flame structure causes interesting distributions of major combustion products, as shown in Figure 7.
H2O, N2, and H2 are all produced near the fuel nozzle in sizeable mole fractions when the mole fraction of H2O2 in the fuel mixture increases over 16% and oxidation through reaction (11) becomes possible. H2O and N2 are the products of complete oxidation through this reaction, but as Figure 6 shows, these are very rich mixtures, so there is not enough oxygen in H2O2 for all hydrogen to be oxidized to H2O, thus the formation of molecular hydrogen. Notably, the mole fractions of the products reach an approximately constant plateau as the NH3-H2O2 premixed reaction is completed, similarly to what happens with temperature in Figure 2. As more H2O2 is added in the initial mixture, more NH3 is consumed in the premixed-reaction zone, and a higher temperature plateau is achieved as indicated in Figure 2, along with stronger production of H2O, N2, and H2. The fuel of the non-premixed flame is not simply NH3, but rather a mixture of NH3 and H2, which is referred to as “dissociated ammonia” [15] and has been shown to be preferable in terms of combustion properties, such as resilience to extinction. In the way proposed here, of course, no catalyst is needed in order to achieve hydrogen generation.
After completion of the premixed reaction, H2O2 is depleted, as shown in Figure 5b, while Figure 5a shows that the remaining NH3 survives rich combustion. This is in stark contrast with what happens in rich premixed combustion of hydrocarbons, where basically none of the fuel survives and CO and H2 form. As shown in Figure 7c, a substantial mole fraction of H2 also forms here, however, the difficulty in forming NOx allows for a substantial amount of NH3 to survive. This remaining NH3 is transported together with H2 towards the oxidizer nozzle and further reacts with O2, as shown in Figure 5a and Figure 7c.
Following (with the NH3 stream) the initial stage of premixed reaction, the second stage reaction happens between O2 and the remaining NH3 as well as the H2 that was generated as a result of rich NH3 oxidation with H2O2. As seen from Figure 5a, the higher the mole fraction of H2O2 addition, the closer to the O2 nozzle the reactants of the non-premixed flame will meet and react, which is due to the increase in the momentum of the fuel stream with increasing H2O2-content, which pushes the stagnation plane towards the oxidizer nozzle. As the non-premixed reaction is being carried out, the temperature gradually increases to its peak, however, the maximum temperature that is reached is lower with increasing H2O2 content. This is because less NH3 participates in the second reaction when more H2O2 is added in the fuel stream and consumes NH3 in the premixed reaction. This can also explain the formation of less N2 during the non-premixed reaction with O2 in the high-H2O2-content cases as shown in Figure 7b. The position in which formation of N2 reaches its peak shifts closer to the oxidizer nozzle due to larger momentum of the fuel stream as more H2O2 is added in the fuel stream. The peak value decreases as more H2O2 is added in the fuel stream, because the N atoms of ammonia have already been used in order to generate N2 in the region of the premixed reaction with H2O2. Similar to N2, the two other major products of NH3 oxidation, namely H2O and H2, reach their maximum values at a location that shifts towards the O2 inlet as more H2O2 is added in fuel stream. More H2O is produced as H2O2-addition increases, because H2O can form through the oxidation of ammonia by both O2 and H2O2. On the contrary, less H2 is formed as more H2O2 is added, because the equivalence ratio of reaction (10) drops, resulting in more complete oxidation to H2O and less H2 production.
Notably, formation of nitric oxide (NO) and nitrogen dioxide (NO2) happens in both reaction zones as shown in Figure 8. Specifically, NO formation occurs predominantly in the non-premixed reaction stage, in which high temperature and formation of N2 peaks occurs. This proves that the formed NO is mainly thermal. NO forms mainly in the high-temperature zone of the flame, which suggests that its formation proceeds mainly through the thermal Zeldovich mechanism, with NH3 acting as a source of N atoms for this mechanism. H2O2 addition has limited impact on NO production, since (as shown in Figure 8) for all five cases the differences in NO distributions are minor, with a peak mole fraction on the order of 10−3 and a shift of the location of the peak value, which follows the one of the peak temperatures, as it can be seen through a comparison with Figure 2. This is another strong indication that the produced NO is thermal.
On the other hand, formation of NO2 depends on H2O2 addition and occurs mainly in the relatively low temperature stage of premixed reaction between NH3 and H2O2. As more H2O2 is added in the NH3 stream, more NO2 is formed and, interestingly, there seems to be some NO2 formation, even at the very low temperatures that prevail near the fuel nozzle when the mole fraction of H2O2 in the fuel stream is below 16%.
This is due to the route for low-temperature NO2 formation that is suggested in [33,34] and proceeds through the reaction:
NO + HO2 → NO2 + OH
As shown in Figure 8c and as a result of the chemical activity of H2O2 as an oxidizer, a substantial amount of HO2 forms not only in the high-temperature non-premixed flame, but also (and actually, even more so) at in the initial stages of the premixed reaction between NH3 and H2O2, when this reaction is active. In fact, Figure 8b,c shows that the distributions of HO2 and NO correlate precisely in the region of premixed reaction, which confirms that NO2 formation happens through reaction (12). Of course, the action of (12) is an additional reason for depletion of NO in the relatively low temperature zone of the reaction, which leaves the production of thermal NO in the high-temperature non-premixed flame as the main source of NO generation.
Contrary to HO2, H and OH only form in the high-temperature zone of the non-premixed combustion with oxygen and they are absent from the zone of relatively low temperature premixed reaction of NH3 with H2O2, as shown in Figure 9. Following closely the location of maximum temperature (see Figure 2), the location of maximum mole fraction for these two radicals moves closer to the O2-nozzle with increasing H2O2 addition. The peak values of the mass fractions of these radicals decreases with increasing H2O2 content in the fuel stream because less fuel is available for combustion in the non-premixed flame, which leads to reduced heat release and maximum flame temperatures, as shown in Figure 2.

3.3. Flow-Field Considerations

The occurrence of reaction (11) affects drastically the flow field as demonstrated in Figure 3 and Figure 4. Specifically, when the mole fraction of H2O2 is below 16%, the flow fields show no obvious structural difference with respect to the pure NH3 flame except for relatively higher axial velocity as the addition of H2O2 increases. However, when H2O2 addition increases over 16% and premixed combustion occurs, the heat release from NH3-H2O2 premixed combustion has a strong effect on the flow field as the axial velocity gets boosted significantly by the expansion that the exothermic reaction (11) causes. As NH3 is consumed and reacts with H2O2, the mixture reaches abruptly a very high temperature near the fuel nozzle (see Figure 2), which consequently causes a strong increase in axial velocity as shown in Figure 3.
The drastically different velocity distributions that ensue for H2O2 mole fractions higher than 16% and the substantially different flame structures that increased H2O2 addition causes call for a re-evaluation of the validity of Equation (9) that we used in order to estimate initially the strain rate at the stoichiometric surface and was based on the “near-equilibrium” structure of non-premixed flames [26,27,31]. In that model, the stoichiometric surface is the surface of maximum temperature and the strain rate at this surface can be approximated through Equation (9). In order to evaluate this approximation, we present in Figure 10 the actually computed stain rate K = d u z d z (uz is the velocity component and z is the spatial location along the burner axis) calculated at the location of maximum temperature (as determined from Figure 2) as a function of H2O2 content in the fuel stream.
We show with dashed line in Figure 10 the prediction of Equation (9). The comparison of the precise value of the prediction with the actually computed values is not important; what Equation (9) provides is after all only an approximate estimate of the order of magnitude of the strain rate at the stoichiometric surface, i.e., the surface of maximum temperature. However, what is important is that the formulation of Equation (9) implies that the momentum flux of the counterflowing streams ρU2 (as reported in Table 2) determines the strain rate at the maximum-temperature surface [30]. In fact, Equation (9) essentially states that the strain rate at the maximum-temperature surface is determined by the square root of the momentum fluxes of the counterflowing streams. Figure 10 shows that this is not the case for the novel flame structures that we discussed in this paper. In particular, and although ρU2 remains practically constant for the fuel and the oxidizer stream (as shown in Table 2), the strain rate at the surface of maximum temperature increases with increasing H2O2 mole fraction in the fuel stream, as shown in Figure 10. What causes a drastic increase in strain on the flame for χ H 2 O 2 > 16% is the initiation of reaction (11) in a premixed reaction zone, which makes the flame structure that we analyzed in this paper drastically different than the structure that is implied for the validity of Equation (9). An increase of as much as 35% is computed between the case of χ H 2 O 2 = 10% and the corresponding one of χ H 2 O 2 = 30% for the same momentum fluxes of counterflowing streams. Notably, this increase in strain rate does not cause extinction, but only a minor decrease in maximum temperature as Figure 2 and Figure 4 indicate.

4. Conclusions

Computations of five counterflow diffusion NH3-H2O2/O2 flames with differing H2O2 contents with a well validated computational tool showed that H2O2 addition has great effects on ammonia combustion. For the cases of low H2O2 contents, the NH3-H2O2/O2 flame structure is similar to the “near equilibrium” non-premixed NH3/O2 flames, and H2O2 acts as a fuel additive. A novel flame structure was found when H2O2 mole fraction in the fuel stream rose to 16% (for atmospheric pressure and room temperature of the counterflowing reactant streams). A fast NH3-H2O2 premixed reaction occurred, in which H2O2 turned from a fuel additive to an oxidizer. This reaction would not happen outside its “flammability limit” which was at an equivalence ratio of 7.9. Contrary to what happens with hydrocarbons (where the fuel is practically consumed in its entirety and CO and H2 forms), NH3 survives very rich combustion and the NH3/H2O2 premixed reaction is followed by a non-premixed reaction between the remaining NH3 and O2. In the zone of premixed reaction of NH3 with H2O2, substantial amounts of HO2 form, which lead to the formation of substantial quantities of NO2 through the reaction of NO with HO2. The well-established conclusion of “near equilibrium” non-premixed flame analysis that the strain on the flame is determined by the momentum fluxes of the counterflowing streams was shown not be valid for this novel flame structure that includes a zone of premixed oxidation with H2O2 acting as an oxidizer.

Author Contributions

Conceptualization, A.N.A.K., D.C.K. and W.Y.; methodology, A.N.A.K. and W.Y.; software, A.N.A.K. and W.Y.; validation, A.N.A.K. and W.Y.; formal analysis, A.N.A.K., D.C.K. and W.Y.; investigation, A.N.A.K., D.C.K. and W.Y.; data curation, W.Y.; writing—original draft preparation, A.N.A.K., D.C.K. and W.Y.; writing—review and editing, A.N.A.K. and D.C.K. visualization, W.Y.; supervision, A.N.A.K. and D.C.K.; project administration, A.N.A.K. and D.C.K.; funding acquisition, A.N.A.K. and D.C.K. All authors have read and agreed to the published version of the manuscript.

Funding

This research received no external funding.

Data Availability Statement

All data reported in this manuscript are available from the corresponding author upon request.

Acknowledgments

We would like to acknowledge support for this work from Khalifa University of Science and Technology under projects RC2-2019-007 and CIRA-2019-033. We would like to also thank the center of high-performance computing at Khalifa University for their help.

Conflicts of Interest

The authors declare no conflict of interest.

References

  1. Galucci, M. The ammonia solution. IEEE Spectr. 2021, 3, 47–50. [Google Scholar]
  2. Dimitriou, P.; Javaid, R. A review of ammonia as a compression ignition engine fuel. Int. J. Hydrogen Energy 2020, 45, 7098–7118. [Google Scholar] [CrossRef]
  3. Atchison, J. ABS Publishes New Guide for Ammonia-Fueled Vessels, Ammonia Energy Association. Available online: https://www.ammoniaenergy.org/articles/abs-publishes-new-guide-for-ammonia-fueled-vessels/ (accessed on 29 September 2021).
  4. Linnet, M.E. Maritime Industry Leaders to Explore Ammonia as Maritime Fuel in Singapore—A.P.Moller—Maersk Press Release. Available online: https://www.maersk.com/news/articles/2021/03/10/maritime-industry-leaders-to-explore-ammonia-as-marine-fuel-in-singapore (accessed on 10 March 2021).
  5. Kobayashi, H.; Hayakawa, A.; Somarathne, K.D.K.A.; Okafor, E.C. Science and technology of ammonia combustion. Proc. Combust. Inst. 2019, 37, 109–133. [Google Scholar] [CrossRef]
  6. Li, J.; Huang, H.; Kobayashi, N.; He, Z.; Osaka, Y.; Zeng, T. Numerical study on effect of oxygen content in combustion air on ammonia combustion. Energy 2015, 93, 2053–2068. [Google Scholar] [CrossRef]
  7. Cai, T.; Zhao, D.; Wang, B.; Li, J.; Guan, Y. NOx emission and thermal performances studies on premixed ammonia-oxygen combustion in a CO2-free micro-planar combustor. Fuel 2020, 280, 118554. [Google Scholar] [CrossRef]
  8. Sorrentino, G.; Sabia, P.; Bozza, P.; Ragucci, R.; de Joannon, M. Low-NOx conversion of pure ammonia in a cyclonic burner under locally diluted and preheated conditions. Appl. Energy 2019, 254, 113676. [Google Scholar] [CrossRef]
  9. Glarborg, P.; Miller, J.A.; Ruscic, B.; Klippenstein, S.J. Modeling nitrogen chemistry in combustion. Prog. Energy Combust. Sci. 2018, 67, 31–68. [Google Scholar] [CrossRef] [Green Version]
  10. Zhang, X.; Moosakutty, S.P.; Rajan, R.P.; Younes, M.; Sarathy, S.M. Combustion chemistry of ammonia/hydrogen mixtures: Jet-stirred reactor measurements and comprehensive kinetic modeling. Combust. Flame 2021, 234, 111653. [Google Scholar] [CrossRef]
  11. Dai, L.; Hashemi, H.; Glarborg, P.; Gersen, S.; Marshall, P.; Mokhov, A.; Levinsky, H. Ignition delay times of NH3 /DME blends at high pressure and low DME fraction: RCM experiments and simulations. Combust. Flame 2021, 227, 120–134. [Google Scholar] [CrossRef]
  12. Issayev, G.; Giri, B.R.; Elbaz, A.M.; Shrestha, K.P.; Mauss, F.; Roberts, W.L.; Farooq, A. Combustion behavior of ammonia blended with diethyl ether. Proc. Combust. Inst. 2021, 38, 499–506. [Google Scholar] [CrossRef]
  13. Elbaz, A.; Giri, B.; Issayev, G.; Shrestha, K.P.; Mauss, F.; Farooq, A.; Roberts, W.L. Experimental and Kinetic Modeling Study of Laminar Flame Speed of Dimethoxymethane and Ammonia Blends. Energy Fuels 2020, 34, 14726–14740. [Google Scholar] [CrossRef]
  14. Immhoff, T.B.; Gkantonas, S.; Mastorakos, E. Analyzing the performance of ammonia powertrains in the marine environment. Energies 2021, 14, 7447. [Google Scholar] [CrossRef]
  15. Frigo, S.; Gentili, R. Analysis of the behaviour of a 4-stroke Si engine fuelled with ammonia and hydrogen. Int. J. Hydrogen Energy 2013, 38, 1607. [Google Scholar] [CrossRef]
  16. Khalil, A.T.; Manias, D.M.; Tingas, E.-A.; Kyritsis, D.C.; Goussis, D.A. Algorithmic Analysis of Chemical Dynamics of the Autoignition of NH3–H2O2/Air Mixtures. Energies 2019, 12, 4422. [Google Scholar] [CrossRef] [Green Version]
  17. Khalil, A.T.; Manias, D.M.; Kyritsis, D.C.; Goussis, D.A. NO Formation and Autoignition Dynamics during Combustion of H2O-Diluted NH3/H2O2 Mixtures with Air. Energies 2020, 14, 84. [Google Scholar] [CrossRef]
  18. Yang, W.; Al-Khateeb, A.N.; Kyritsis, D.C. A computational comparison of NH3/O2 and CH4/O2 non-premixed laminar flames. Fuel 2022, 309, 122200. [Google Scholar] [CrossRef]
  19. Manias, D.M.; Patsatzis, D.G.; Kyritsis, D.C.; Goussis, D.A. NH3 vs. CH4 autoignition: A comparison of chemical dynamics. Combust. Theory Model. 2021, 25, 1110–1131. [Google Scholar] [CrossRef]
  20. Colson, S.; Hayakawa, A.; Kudo, T.; Kobayashi, H. Extinction characteristics of ammonia/air counterflow premixed flames at various pressures. J. Therm. Sci. Technol. 2016, 11, JTST0048. [Google Scholar] [CrossRef] [Green Version]
  21. Colson, S.; Hirano, Y.; Hayakawa, A.; Kudo, T.; Kobayashi, H.; Galizzi, C.; Escudié, D. Experimental and Numerical Study of NH3/CH4 Counterflow Premixed and Non-Premixed Flames for Various NH3 Mixing Ratios. Combust. Sci. Technol. 2020, 193, 2872–2889. [Google Scholar] [CrossRef]
  22. Xiao, H.; Lai, S.; Valera-Medina, A.; Li, J.; Liu, J.; Fu, H. Study on counterflow premixed flames using high concentration ammonia mixed with methane. Fuel 2020, 275, 117902. [Google Scholar] [CrossRef]
  23. Ku, J.W.; Choi, S.; Kim, H.K.; Lee, S.; Kwon, O.C. Extinction limits and structure of counterflow nonpremixed methane-ammonia/air flames. Energy 2018, 165, 314–325. [Google Scholar] [CrossRef]
  24. Wang, Z.; Herbinet, O.; Hansen, N.; Battin-Leclerc, F. Exploring hyperoxides in combustion: History, recent advances, and perspectives. Prog. Energy Combust. Sci. 2019, 73, 132–181. [Google Scholar] [CrossRef]
  25. Farraj, A.R.D.; Al-Naeemy, A.M.; Al-Khateeb, A.N.; Kyritsis, D.C. Laminar Non-Premixed Counterflow Flames Manipulation through the Application of External Direct Current Fields. J. Energy Eng. 2017, 143, 04017002. [Google Scholar] [CrossRef]
  26. Law, C.K. Combustion Physics; Cambridge University Press: New York, NY, USA, 2006. [Google Scholar] [CrossRef]
  27. Williams, F.A. Combustion Theory; CRC Press: Boca Raton, FL, USA, 2018. [Google Scholar] [CrossRef]
  28. Bird, R.B.; Stewart, W.E.; Lightfoot, E.N. Transport. Phenomena; Wiley: New York, NY, USA, 2006. [Google Scholar]
  29. Smooke, M.D.; Puri, I.K.; Seshadri, K. A comparison between numerical calculations and experimental measurements of the structure of a counterflow diffusion flame burning diluted methane in diluted air. Proc. Comb. Inst. 1988, 21, 1783–1792. [Google Scholar] [CrossRef]
  30. Seshadri, K.; Williams, F.A. Laminar flow between parallel plates with injection of a reactant at high Reynolds number. Int. J. Heat Mass Transf. 1978, 21, 251–253. [Google Scholar] [CrossRef]
  31. Liñán, A. The asymptotic structure of counterflow diffusion flames for large activation energies. Acta Astronaut. 1978, 1, 1007–1039. [Google Scholar] [CrossRef]
  32. Ventura, M.C.; Heister, S.D. Hydrogen peroxide as an alternate oxidizer for a hybrid rocket booster. J. Prop. Powers 1995, 11, 562–571. [Google Scholar] [CrossRef]
  33. Glassman, I.; Yetter, R.A.; Glumac, N.G. Combustion; Elsevier: Amsterdam, The Netherlands, 2014. [Google Scholar] [CrossRef]
  34. Merryman, E.L.; Levy, A. Nitorgen oxide formation in fames: The roles of NO2 and fuel nitrogen. Proc. Comb. Inst. 1975, 15, 1073–1083. [Google Scholar] [CrossRef]
Figure 1. Schematic diagram of the non-premixed crossflow burner and the considered computational domain.
Energies 15 02216 g001
Figure 2. Temperature along the centerline as a function of spatial location and H2O2 content in the fuel stream.
Energies 15 02216 g002
Figure 3. Axial velocity along the centerline as a function of spatial location and H2O2 content in the fuel stream.
Energies 15 02216 g003
Figure 4. Temperature distributions in the flow field for the five NH3-H2O2/O2 flames with varying H2O2 addition under consideration.
Energies 15 02216 g004
Figure 5. NH3 and O2 (a), as well as H2O2 (b), mole fraction distributions along the burner center line.
Energies 15 02216 g005
Figure 6. Equivalence ratio of reaction (11) as a function of mole fraction of H2O2 in the mixture. The red dashed line indicates the location of the rich flammability limit of (11) as suggested by our findings.
Energies 15 02216 g006
Figure 7. H2O (a), N2 (b), and H2 (c) mole fraction distributions along the burner center line.
Energies 15 02216 g007aEnergies 15 02216 g007b
Figure 8. NO (a), NO2 (b), and HO2 (c), mole fraction distributions along the burner center line.
Energies 15 02216 g008aEnergies 15 02216 g008b
Figure 9. OH (a) and H (b) mole fraction distributions along the burner center line.
Energies 15 02216 g009
Figure 10. Computed strain rate at the location of maximum temperature (K) as a function of the H2O2 mole fraction in the NH3/H2O2 stream. A dashed line shows the prediction of Equation (9).
Energies 15 02216 g010
Table 1. Boundary conditions (T0 = 300 K).
LocationTemperature, TVelocity Vector, u (ur, uz)Mass Fraction, Yi
Axisymmetric line (r = 0) T r = 0 u r = 0 Y i r = 0
Fuel inlet
(z = −7.5 mm, 0 < r < 7.5 mm)
T0(Ufuel, 0)Yi = 0; i ≠ NH3 or NH3/H2O2
Oxidizer inlet
(z = 7.5 mm, 0 < r < 7.5 mm)
T0(−Uoxidizer, 0)Yi = 0; i ≠ O2
Outer domain
(r = 40 mm) and
(z = ±20 mm, 7.5 < r < 40 mm)
T = 0 u = 0 Y i = 0
Wall
(r = 7.5 mm, −7.5 < z < −20 mm) and
(r = 7.5 mm, 7.5 < z < 20 mm)
T0 u = 0 Y i = 0
Table 2. Density, velocity, momentum flux, and estimated strain rate at the stoichiometric surface for NH3-H2O2/O2 flames.
Pure NH310% H2O216% H2O220% H2O230% H2O2
ρNH3 (kg/m3)0.692
ρH2O2 (kg/m3)1.382
ρO2 (kg/m3)1.300
ρf (kg/m3)0.6920.7610.8020.8300.899
Uf (m/s)0.20.1910.1860.1830.175
Momentum flux of the fuel stream ρf Uf2 (kg/m·s2)0.02770.02780.02770.02780.0275
Uox (m/s)0.2
K (s−1)46.12
Publisher’s Note: MDPI stays neutral with regard to jurisdictional claims in published maps and institutional affiliations.

