
An Experimental Study of Thermal Comfort and Indoor Air Quality—A Case Study of a Hotel Building


Abstract
:1. Introduction
- M—the metabolic rate (W/m2);
- W—the external work (W/m2);
- pa—the partial vapor pressure (Pa);
- fcl—the ratio of the area of the body covered by clothing to the area of the exposed body;
- hc—the convective heat transfer coefficient;
- tcl—average temperature of the human body surface covered with clothing (°C);
- ta—the air temperature (°C);
- trm—the mean radiant temperature (°C).
2. Materials and Methods
2.1. Investigated Building
2.2. Methods for Measuring and Calculation
3. Results
4. Discussion
5. Conclusions
Author Contributions
Funding
Institutional Review Board Statement
Informed Consent Statement
Data Availability Statement
Conflicts of Interest
References
- ASHRAE. ASHRAE Handbook-Fundamentals; ASHRAE: Peachtree Corners, GA, USA, 2021. [Google Scholar]
- Al horr, Y.; Arif, M.; Katafygiotou, M.; Mazroei, A.; Kaushik, A.; Elsarrag, E. Impact of indoor environmental quality on occupant well-being and comfort: A review of the literature. Int. J. Sustain. Built Environ. 2016, 5, 1–11. [Google Scholar] [CrossRef]
- Sakhare, V.V.; Ralegaonkar, R.V. Indoor environmental quality: Review of parameters and assessment models. Archit. Sci. Rev. 2014, 57, 147–154. [Google Scholar] [CrossRef]
- Leccese, F.; Rocca, M.; Salvadori, G.; Belloni, E.; Buratti, C. Towards a holistic approach to indoor environmental quality assessment: Weighting schemes to combine effects of multiple environmental factors. Energy Build. 2021, 245, 111056. [Google Scholar] [CrossRef]
- MacPherson, K. The assessment of the thermal environment a review. Br. J. Ind. Med. 1962, 19, 151–164. [Google Scholar] [CrossRef] [PubMed]
- Carlucci, S.; Pagliano, L. A review of indices for the long-term evaluation of the general thermal comfort conditions in buildings. Energy Build. 2012, 53, 194–205. [Google Scholar] [CrossRef]
- Fantozzi, F.; Rocca, M. An Extensive Collection of Evaluation Indicators to Assess Occupants’ Health and Comfort in Indoor Environment. Atmosphere 2020, 11, 90. [Google Scholar] [CrossRef] [Green Version]
- Parson, K. Human Thermal Comfort; CRS Press Taylor & Francis Group: Boca Raton, FL, USA, 2020; pp. 1–29. [Google Scholar]
- ASHRAE-ANSI-ASHRAE Standard 55; Thermal Environmental Conditions for Human Occupancy. American Society of Heating, Refrigerating and Air Conditioning Engineers: Atlanta, GA, USA, 2017.
- ISO Standard 7730; Ergonomics of the Thermal Environment—Analytical Determination and Interpretation of Thermal Comfort Using Calculation of the PMV and PPD Indices and Local Thermal Comfort. International Organization for Standardization: Geneva, Switzerland, 2005.
- Fang, L.; Clausen, G.; Fanger, P.O. Impact of temperature and humidity on the perception of indoor air quality. Indoor Air 1998, 8, 80–90. [Google Scholar] [CrossRef]
- Gunnarsen, L.; Fanger, P.O. Adaptation to indoor air pollution. J. Environ. Int. 1992, 18, 43–54. [Google Scholar] [CrossRef]
- Fang, L.; Clausen, G.; Fanger, P.O. Impact of Temperature and Humidity on Perception of Indoor Air Quality During Immediate and Longer Whole-Body Exposures. Indoor Air 1998, 8, 276–284. [Google Scholar] [CrossRef]
- ASHRAE-ANSI-ASHRAE Standard 62.1-2019; Ventilation for Acceptable Indoor Air Quality. ASHRAE: Atlanta, GA, USA, 2019.
- ASHRAE-ANSI-ASHRAE Standard 62.2-2019; Ventilation and Acceptable Indoor Air Quality in Residential Buildings. ASHRAE: Atlanta, GA, USA, 2019.
- EN 16798-1:2019; Energy Performance of Buildings—Ventilation for Buildings—Part 1: Indoor Environmental Input Parameters for Design and Assessment of Energy Performance of Buildings Addressing Indoor Air Quality, Thermal Environment, Lighting and Acoustics. European Committee for Standardization: Brussels, Belgium, 2019.
- Pełech, A. Wentylacja i Klimatyzacja. Podstawy; Oficyna Wydawnicza Politechniki Wrocławskiej: Wrocław, Poland, 2013; ISBN 978-83-7493-641-5. [Google Scholar]
- Von Pettenkofer, M. Über den Luftwechsel in Wohngebäuden; Der, J.G., Ed.; Cotta’schen Buchhandlung: München, Germany, 1858. [Google Scholar]
- Fanger, P.O. Sensor characterization of Air Quality and Pollution Sources. In Chemical, Microbiological, Health and Comfort Aspects of Indoor Air Quality; Knöppel, H., Wolkoff, P., Eds.; Kluwer Academic Publishers: Dordrecht, The Netherlands, 1992; pp. 59–71. [Google Scholar]
- Bienfait, D. ECA Report No. 11; Guidelines for Ventilation Requirements in Buildings; Commission of the European Communities: Brussels, Belgium, 1992. [Google Scholar]
- Hong, S.H.; Lee, J.M.; Moon, J.W.; Lee, K.H. Thermal Comfort, Energy and Cost Impacts of PMV Control Considering Individual Metabolic Rate Variations in Residential Building. Energies 2018, 11, 1767. [Google Scholar] [CrossRef] [Green Version]
- Borowski, M.; Łuczak, R.; Halibart, J.; Zwolińska, K.; Karch, M. Airflow Fluctuation from Linear Diffusers in an Office Building: The Thermal Comfort Analysis. Energies 2021, 14, 4808. [Google Scholar] [CrossRef]
- Michalak, P. Selected Aspects of Indoor Climate in a Passive Office Building with a Thermally Activated Building System: A Case Study from Poland. Energies 2021, 14, 860. [Google Scholar] [CrossRef]
- Valdiserri, P.; Cesari, S.; Coccagna, M.; Romio, P.; Mazzacane, S. Experimental Data and Simulations of Performance and Thermal Comfort in a Patient Room Equipped with Radiant Ceiling Panels. Buildings 2020, 10, 235. [Google Scholar] [CrossRef]
- Argunhan, Z.; Avci, A.S. Statistical Evaluation of Indoor Air Quality Parameters in Classrooms of a University. Adv. Meteorol. 2018, 4391579, 10. [Google Scholar] [CrossRef]
- Balbis-Morejón, M.; Rey-Hernández, J.M.; Amaris-Castilla, C.; Velasco-Gómez, E.; San José-Alonso, J.F.; Rey-Martínez, F.J. Experimental Study and Analysis of Thermal Comfort in a University Campus Building in Tropical Climate. Sustainability 2020, 12, 8886. [Google Scholar] [CrossRef]
- Hu, J.; He, Y.; Hao, X.; Li, N.; Su, Y.; Qu, H. Optimal temperature ranges considering gender differences in thermal comfort, work performance, and sick building syndrome: A winter field study in university classrooms. Energy Build. 2022, 254, 7378–7788. [Google Scholar] [CrossRef]
- Guevara, G.; Soriano, G.; Mino-Rodriguez, I. Thermal comfort in university classrooms: An experimental study in the tropics. Build. Environ. 2021, 187, 107430. [Google Scholar] [CrossRef]
- Lau, S.S.L.; Zhang, J.; Tao, Y. A comparative study of thermal comfort in learning spaces using three different ventilation strategies on a tropical university campus. Build. Environ. 2019, 148, 579–599. [Google Scholar] [CrossRef]
- Lee, M.C.; Mui, K.W.; Wong, L.T.; Chan, W.Y.; Lee, E.W.M.; Cheung, C.T. Student learning performance and indoor environmental quality (IEQ) in air-conditioned university teaching rooms. Build. Environ. 2012, 49, 238–244. [Google Scholar] [CrossRef]
- Jiang, J.; Wang, D.; Liu, Y.; Xu, Y.; Liu, J. A study on pupils’ learning performance and thermal comfort of primary schools in China. Build. Environ. 2018, 134, 102–113. [Google Scholar] [CrossRef]
- Lan, L.; Wargocki, P.; Wyon, D.P.; Lian, Z. Effects of thermal discomfort in an office on perceived air quality, SBS symptoms, physiological responses, and human performance. Indoor Air 2011, 21, 376–390. [Google Scholar] [CrossRef] [PubMed]
- Vimalanathan, K.; Ramesh Babu, T. The effect of indoor office environment on the work performance, health and well-being of office workers. J. Environ. Health Sci. Eng. 2014, 12, 113. [Google Scholar] [CrossRef] [PubMed] [Green Version]
- Nagy, R.; Mečiarová, Ľ.; Vilčeková, S.; Krídlová Burdová, E.; Košičanová, D. Investigation of a Ventilation System for Energy Efficiency and Indoor Environmental Quality in a Renovated Historical Building: A Case Study. Int. J. Environ. Res. Public Health 2019, 16, 4133. [Google Scholar] [CrossRef] [PubMed] [Green Version]
- Varas-Muriel, M.J.; Fort, R.; Gómez-Heras, M. Assessment of an underfloor heating system in a restored chapel: Balancing thermal comfort and historic heritage conservation. Energy Build. 2021, 251, 111361. [Google Scholar] [CrossRef]
- González, C.M.M.; Rodríguez, A.L.L.; Medina, S.R.; Jaramillo, J.R. Effects of future climate change on the preservation of artworks, thermal comfort and energy consumption in historic buildings. Appl. Energy 2020, 276, 115483. [Google Scholar] [CrossRef]
- Martinez-Molina, A.; Boarin, P.; Tort-Ausina, I.; Vivancos, J.L. Post-occupancy evaluation of a historic primary school in Spain: Comparing PMV, TSV and PD for teachers’ and pupils’ thermal comfort. Build. Environ. 2017, 117, 248–259. [Google Scholar] [CrossRef]
- Martinez-Molina, A.; Boarin, P.; Tort-Ausina, I.; Vivancos, J.L. Assessing visitors’ thermal comfort in historic museum buildings: Results from a Post-Occupancy Evaluation on a case study. Build. Environ. 2018, 132, 291–302. [Google Scholar] [CrossRef] [Green Version]
- Buratti, C.; Vergoni, M.; Palladino, D. Thermal Comfort Evaluation Within Non-residential Environments: Development of Artificial Neural Network by Using the Adaptive Approach Data. Energy Procedia 2015, 78, 2875–2880. [Google Scholar] [CrossRef] [Green Version]
- Chaudhuri, T.; Zhai, D.; Chai Soh, Y.; Li, H.; Xie, L. Random forest based thermal comfort prediction from gender-specific physiological parameters using wearable sensing technology. Energy Build. 2018, 166, 391–406. [Google Scholar] [CrossRef]
- Moon, J.W.; Kim, J.J. ANN-based thermal control models for residential buildings. Build. Environ. 2010, 45, 1612–1625. [Google Scholar] [CrossRef]
- Karyono, K.; Abdullah, B.M.; Cotgrave, A.J.; Bras, A. The adaptive thermal comfort review from the 1920s, the present, and the future. Dev. Built Environ. 2020, 4, 100032. [Google Scholar] [CrossRef]
- Bohdanowicz, P.; Martinac, I.M. Thermal Comfort and Energy Saving in the Hotel Industry. In Proceedings of the AMS 15th Conference on Biometeorology and Aerobiology & 16th International Congress on Biometeorology, Kansas City, MO, USA, 28 October–1 November 2002. [Google Scholar]
- Kim, H.; Oldham, E. Characterizing Variations in the Indoor Temperature and Humidity of Guest Rooms with an Occupancy-Based Climate Control Technology. Energies 2020, 13, 1575. [Google Scholar] [CrossRef] [Green Version]
- Kuo, N.W.; Chiang, H.C.; Chiang, C.M. Development and application of an integrated indoor air quality audit to an international hotel building in Taiwan. Environ. Monit. Assess. 2008, 147, 139–147. [Google Scholar] [CrossRef] [PubMed]
- Sahid, N.; Rahim, R.; Hamzah, B.; Mulyadi, R. Analysis of Indoor Thermal Comfort of Room Space in the International Standard Hotel Building. Adv. Soc. Sci. Res. J. 2019, 6, 504–523. [Google Scholar] [CrossRef] [Green Version]
- Asadi, E.; Costa, J.J.; Gameiro da Silva, M. Indoor air quality audit implementation in a hotel building in Portugal. Build. Environ. 2011, 46, 1617–1623. [Google Scholar] [CrossRef] [PubMed]
- Shen, Z.; Yang, X.; Liu, C.; Li, J. Assessment of Indoor Environmental Quality in Budget Hotels Using Text-Mining Method: Case Study of Top Five Brands in China. Sustainability 2021, 13, 4490. [Google Scholar] [CrossRef]
- Buso, T.; Dell’Anna, F.; Becchio, C.; Bottero, M.C.; Corgnati, S.P. Of comfort and cost: Examining indoor comfort conditions and guests’ valuations in Italian hotel rooms. Energy Res. Soc. Sci. 2017, 32, 94–111. [Google Scholar] [CrossRef]
- Park, J.; Yoo, J.L.; Yu, J. Effect of Hotel Air Quality Management on Guests’ Cognitive and Affective Images and Revisit Intentions. Int. J. Environ. Res. Public Health 2021, 18, 9346. [Google Scholar] [CrossRef]
- Qi, M.; Li, X.; Zhu, E.; Shi, Y. Evaluation of perceived indoor environmental quality of five-star hotels in China: An application of online review analysis. Build. Environ. 2017, 111, 1–9. [Google Scholar] [CrossRef]
- Zanni, S.; Motta, G.; Mura, M.; Longo, M.; Caiulo, D. The Challenge of Indoor Air Quality Management: A Case Study in the Hospitality Industry at the Time of the Pandemic. Atmosphere 2021, 12, 880. [Google Scholar] [CrossRef]
- Lowther, S.D.; Dimitroulopoulou, S.; Foxall, K.; Shrubsole, C.; Cheek, E.; Gadeberg, B.; Sepai, O. Low Level Carbon Dioxide Indoors—A Pollution Indicator or a Pollutant? A Health-Based Perspective. Environments 2021, 8, 125. [Google Scholar] [CrossRef]
- Park, B.; Ryu, S.R.; Cheong, C.H. Thermal Comfort Analysis of Combined Radiation-Convection Floor Heating System. Energies 2020, 13, 1420. [Google Scholar] [CrossRef] [Green Version]
- Espejel-Blanco, D.F.; Hoyo-Montaño, J.A.; Arau, J.; Valencia-Palomo, G.; García-Barrientos, A.; Hernández-De-León, H.R.; Camas-Anzueto, J.L. HVAC Control System Using Predicted Mean Vote Index for Energy Savings in Buildings. Buildings 2022, 12, 38. [Google Scholar] [CrossRef]
- Lou, R.; Hallinan, K.P.; Huang, K.; Reissman, T. Smart Wifi Thermostat-Enabled Thermal Comfort Control in Residences. Sustainability 2020, 12, 1919. [Google Scholar] [CrossRef] [Green Version]
- Ku, K.L.; Liaw, J.S.; Tsai, M.Y.; Liu, T.S. Automatic Control System for Thermal Comfort Based on Predicted Mean Vote and Energy Saving. IEEE Trans. Autom. Sci. Eng. 2015, 12, 378–383. [Google Scholar] [CrossRef]
- Park, J.; Kim, T.; Lee, C.S. Development of Thermal Comfort-Based Controller and Potential Reduction of the Cooling Energy Consumption of a Residential Building in Kuwait. Energies 2019, 12, 3348. [Google Scholar] [CrossRef] [Green Version]
- Farzaneh, Y.; Tootoonchi, A.A. Controlling automobile thermal comfort using optimized fuzzy controller. Appl. Therm. Eng. 2008, 28, 1906–1917. [Google Scholar] [CrossRef]


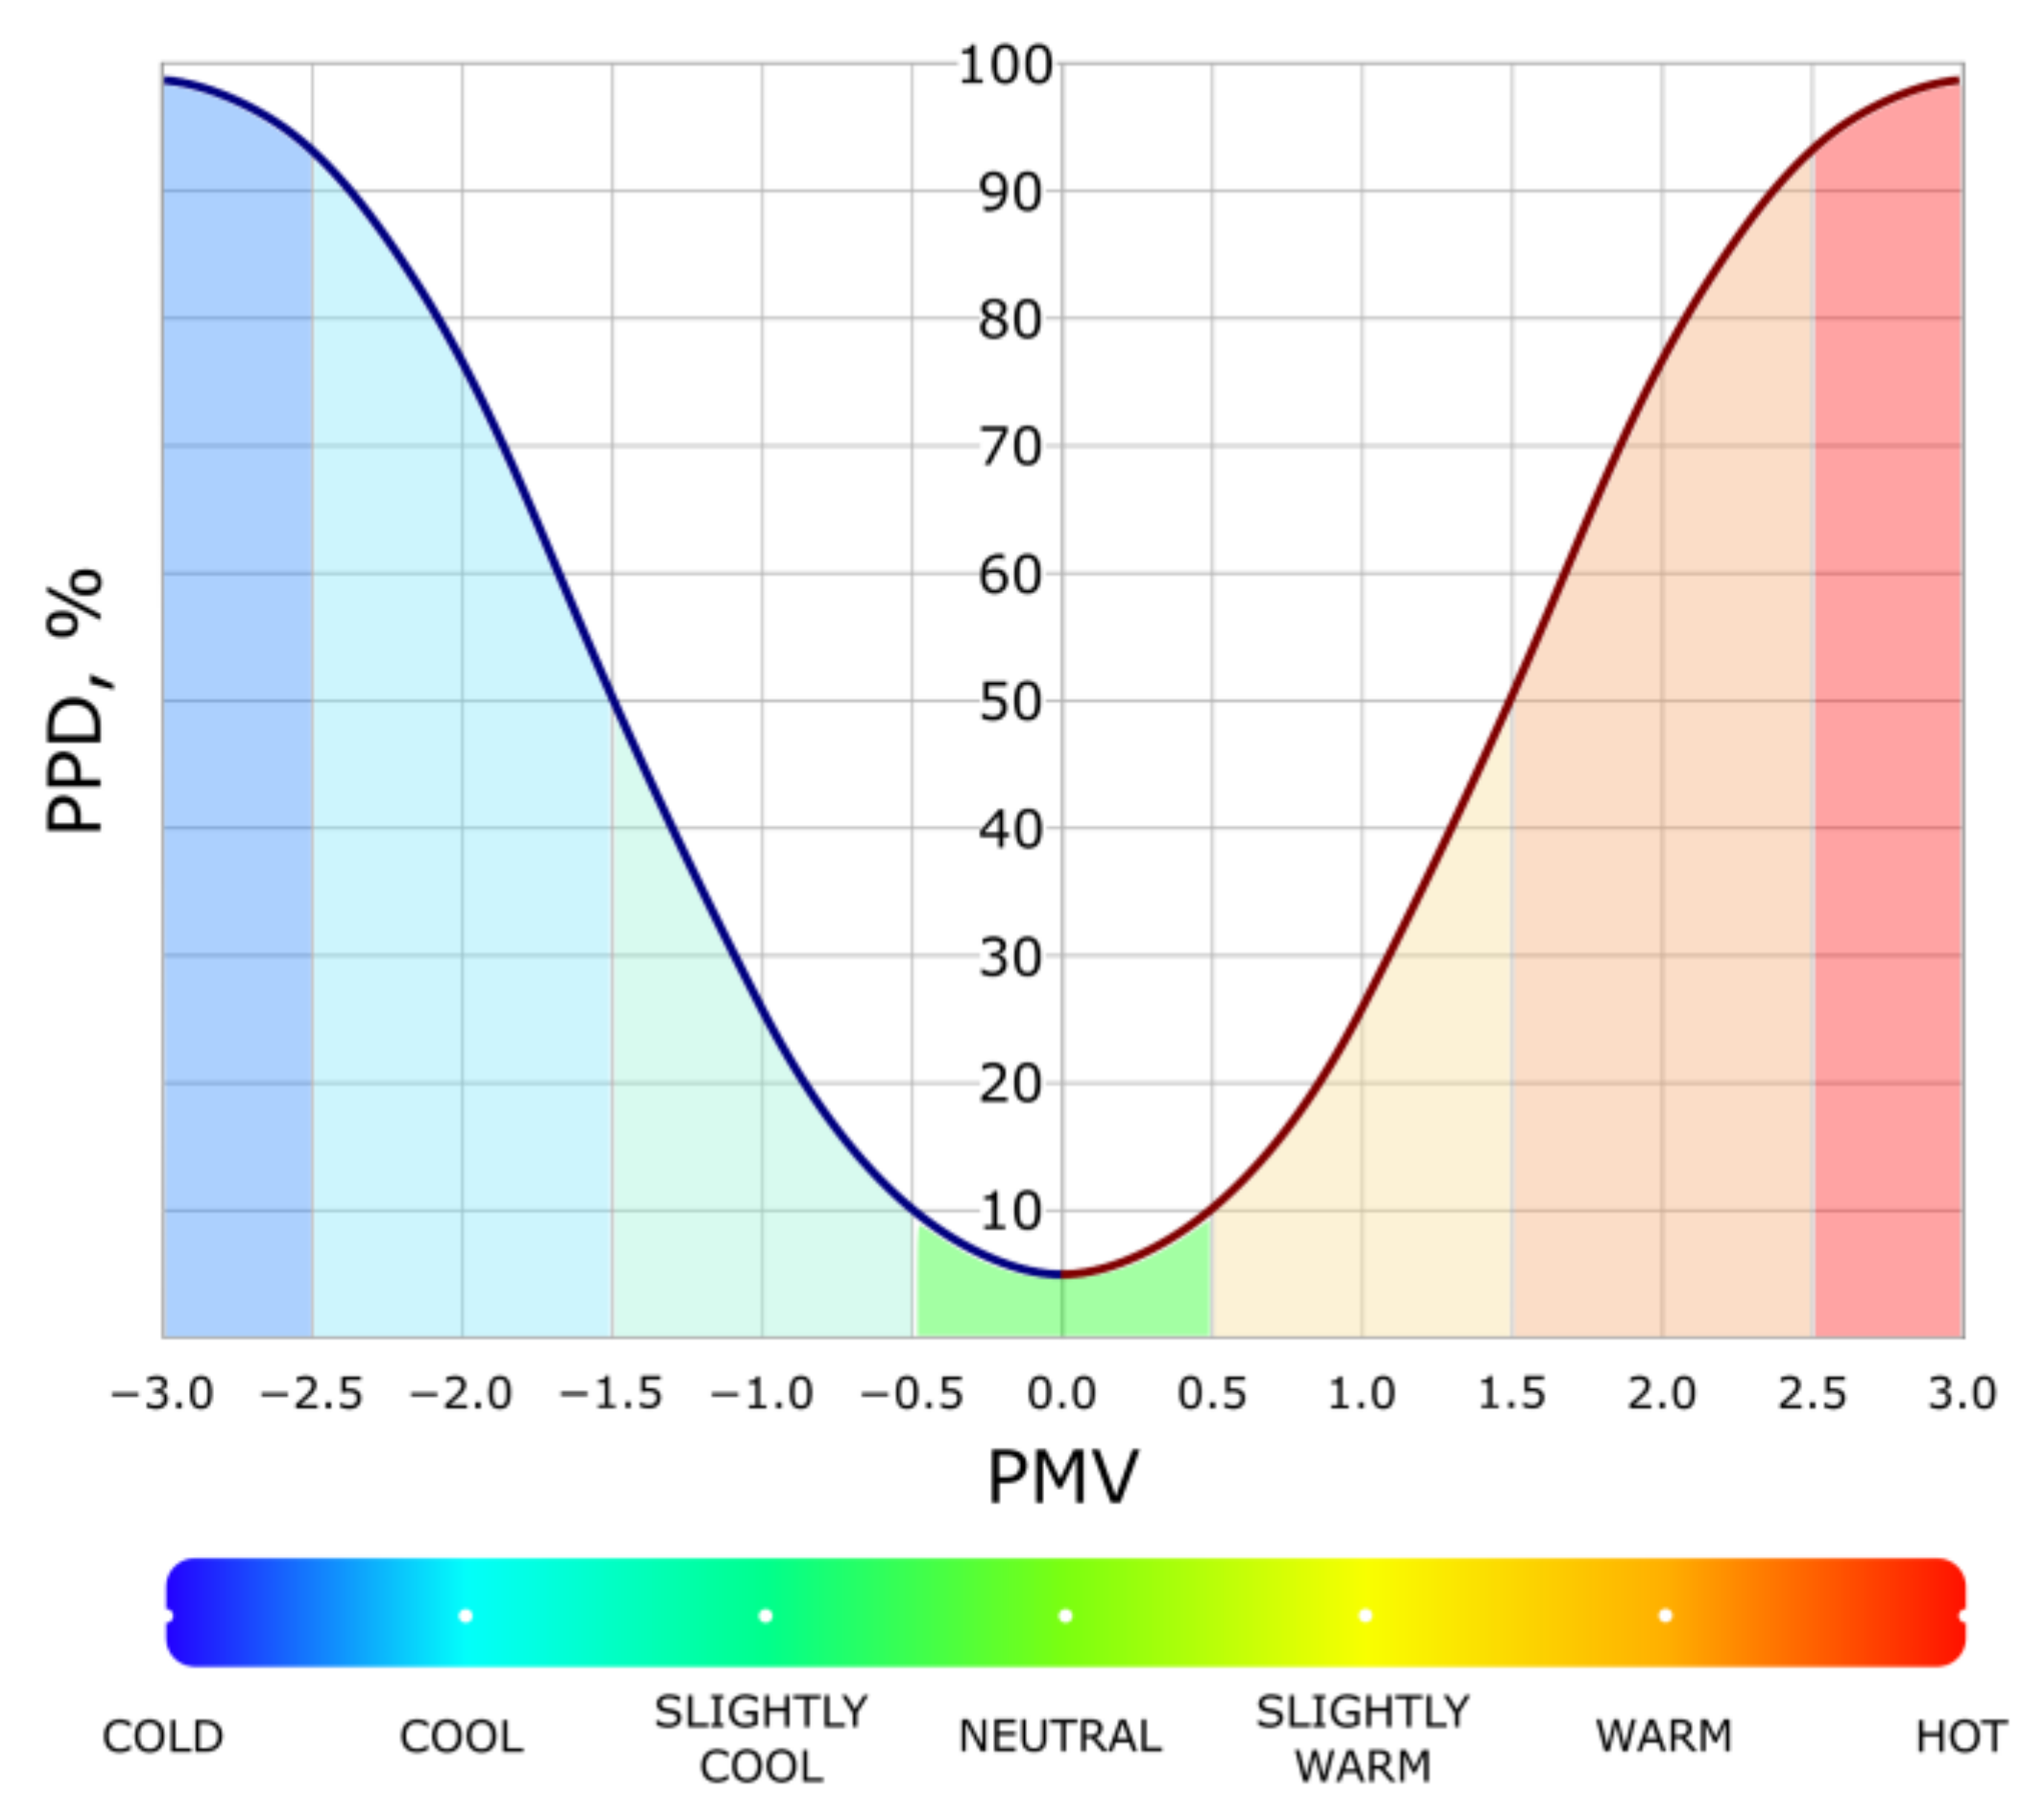
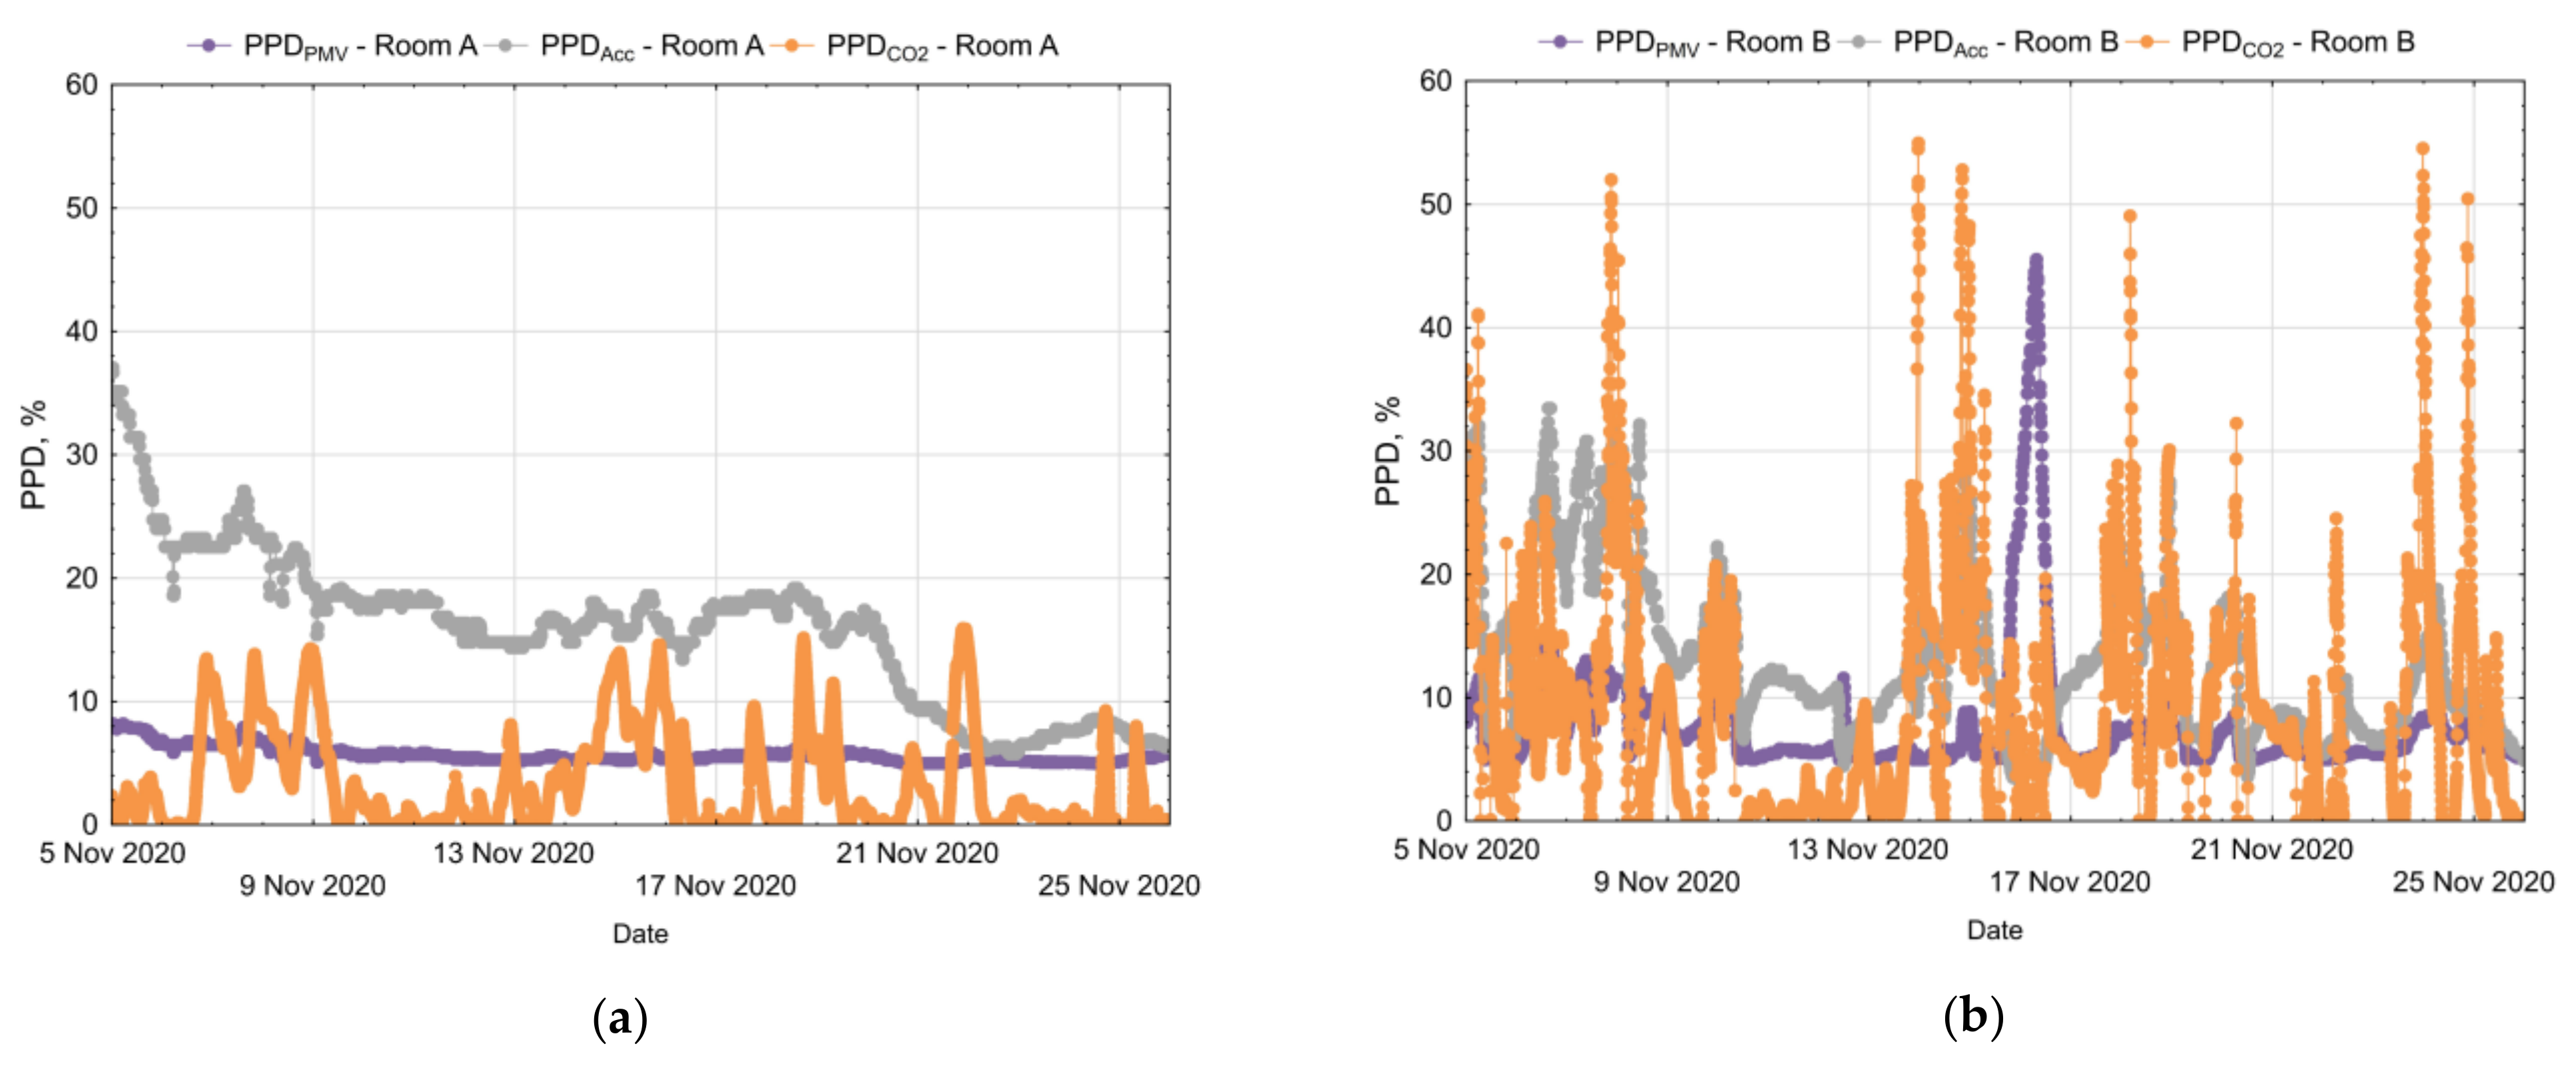
| Cat. | Applicability | PPD | PMV |
|---|---|---|---|
| I | High expectation of good quality (this level should be considered when occupants have special needs, for example small children, elderly people, or people with disabilities). | <6 | −0.2 < PMV < +0.2 |
| II | Medium expectation of good quality (this level is the normal situation that should be applied for buildings). | <10 | −0.5 < PMV < +0.5 |
| III | Moderate expectation of good quality (while acceptable IAQ will still be delivered, there is an increased risk of IAQ sometimes affecting occupant performance). | <15 | −0.7 < PMV < +0.7 |
| IV | Low expectation of good quality (should only be considered for building areas that are only occupied for short periods of time, only by a small fraction of building occupants or only during exceptional circumstances that do not occur for prolonged periods). | <25 | −1.0 < PMV < +1.0 |
| Category | Design ΔCO2 for Living Rooms, ppm | Design ΔCO2 for Bedrooms, ppm |
|---|---|---|
| I | 550 | 380 |
| II | 800 | 550 |
| III | 1350 | 950 |
| IV | 1350 | 950 |
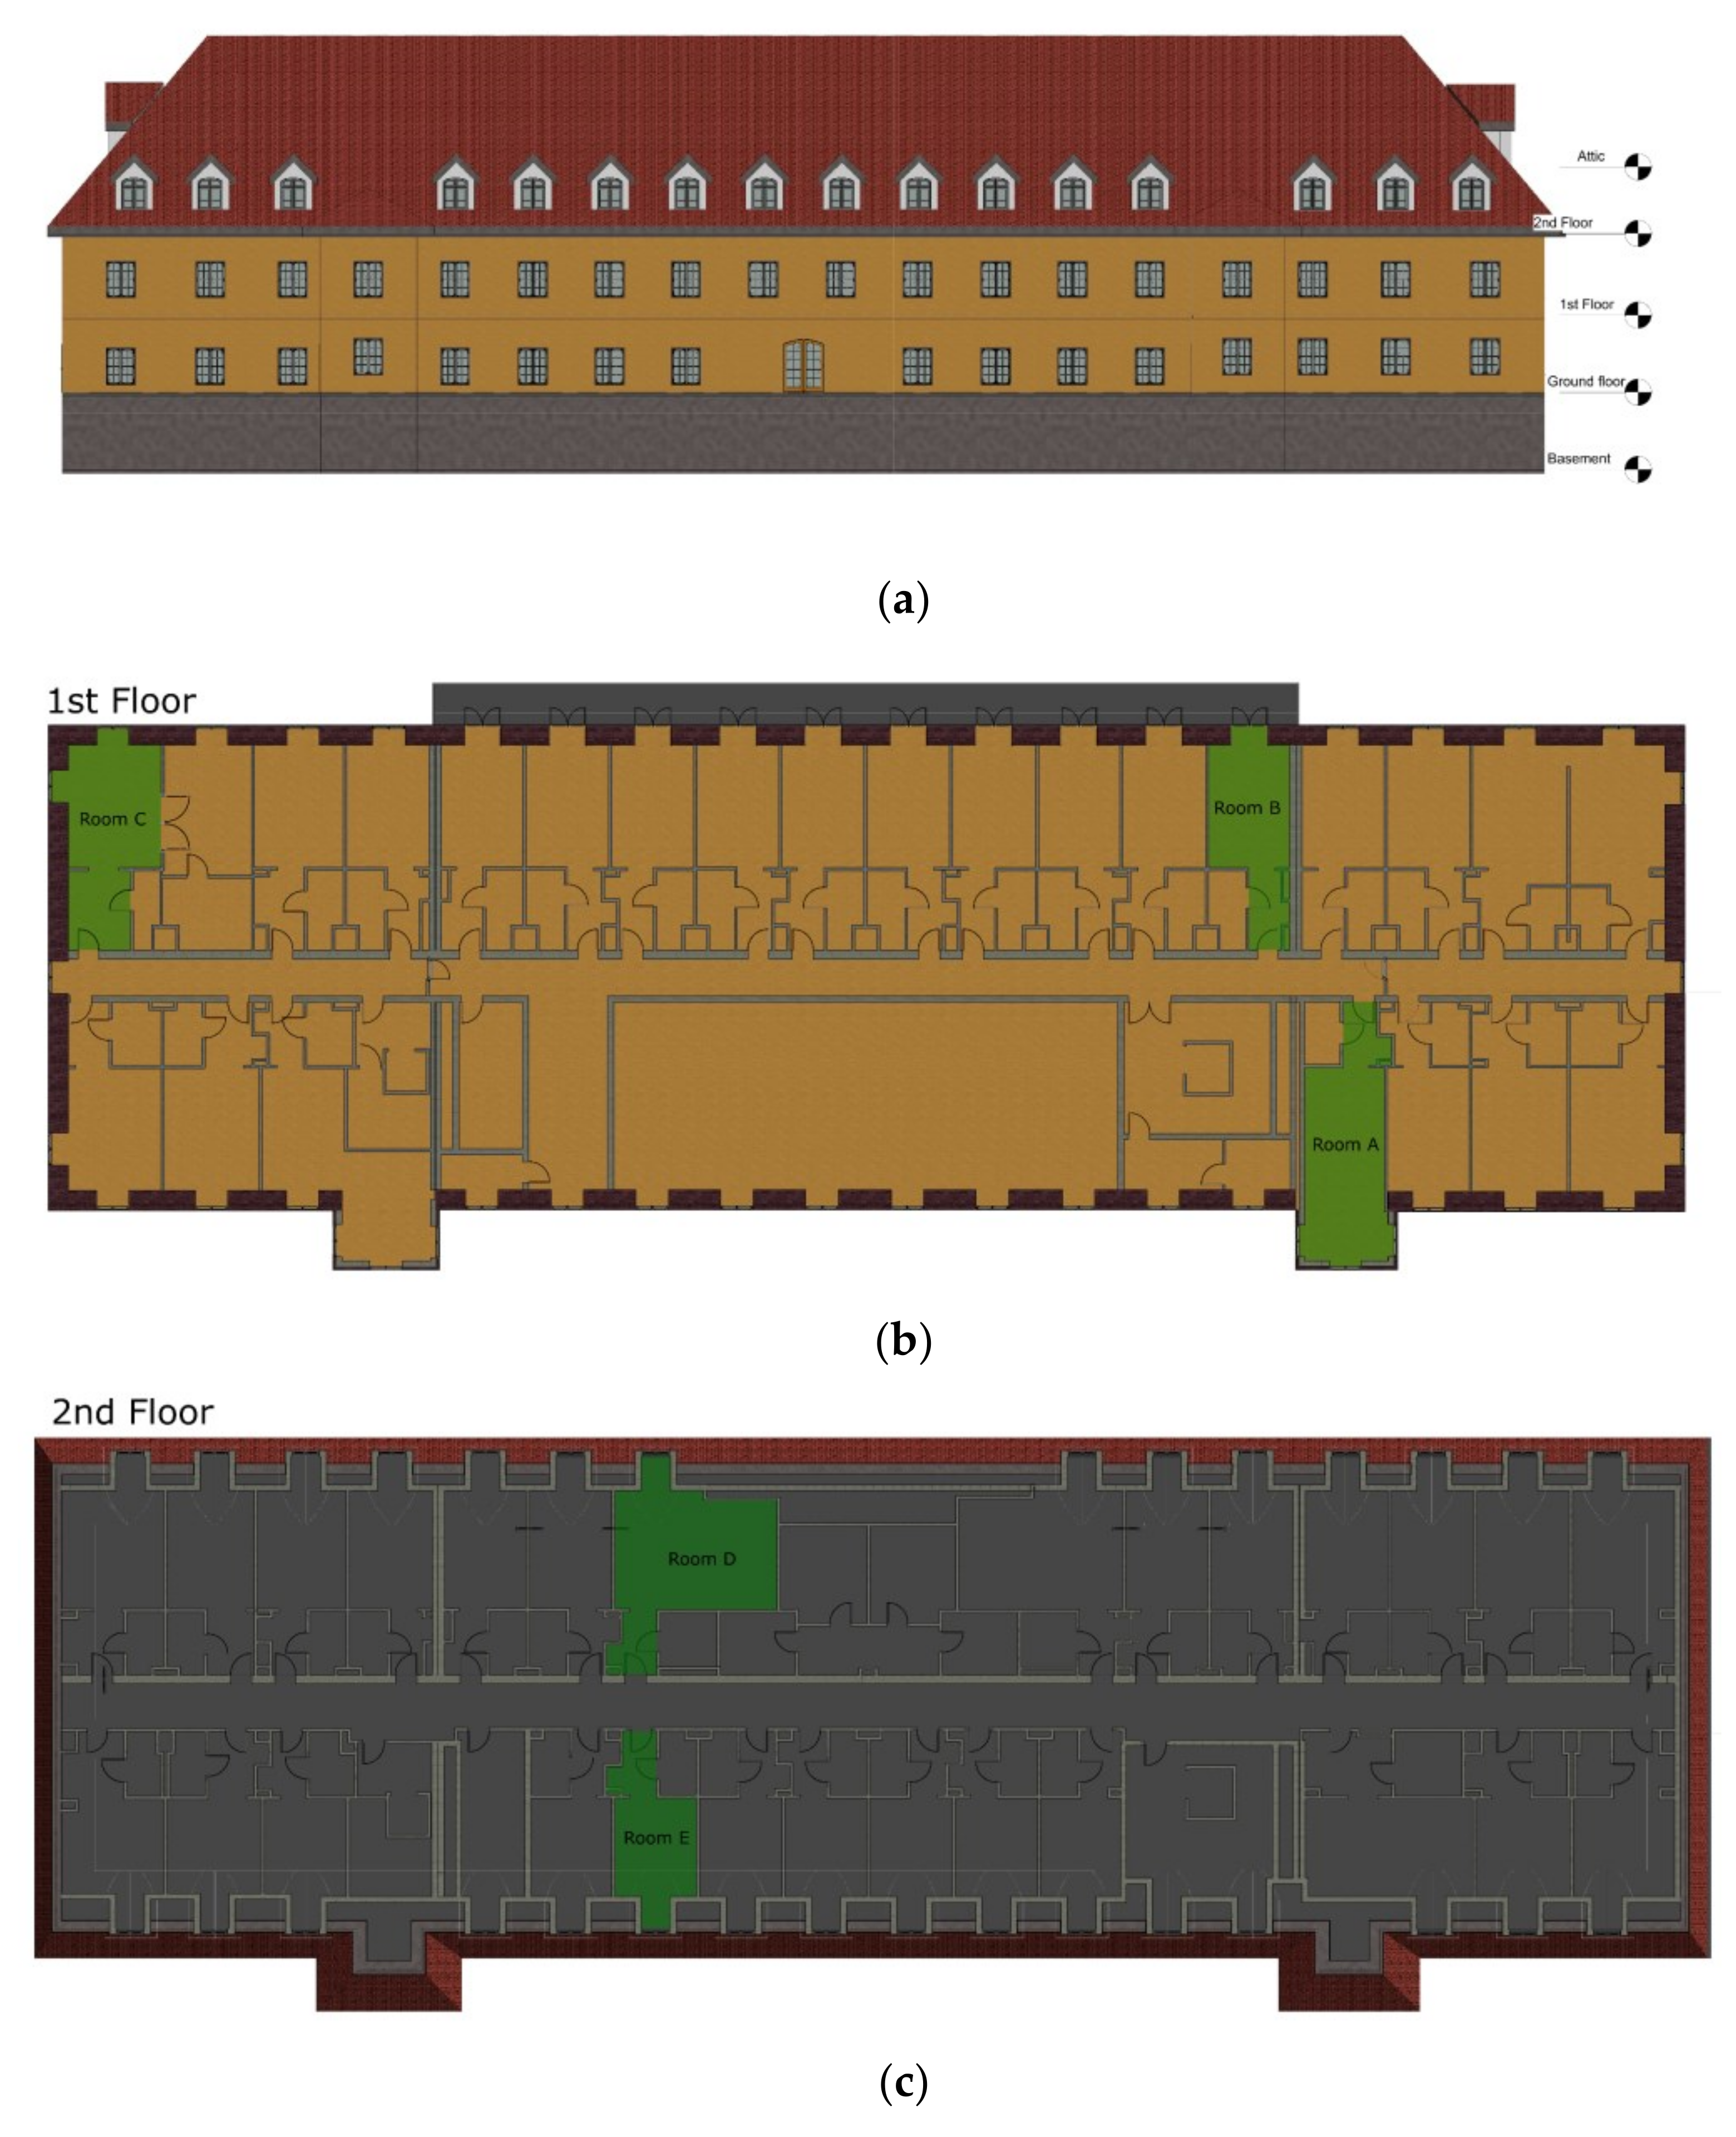
| Room | Area, m2 | Windows | Floor | Comments |
|---|---|---|---|---|
| Room A | 31.32 | 3 | 1st | - |
| Room B | 21.70 | 1 (balcony) | 1st | - |
| Room C | 26.74 | 2 | 1st | living room in a two-room apartment; corner room |
| Room D | 34.00 | 1 | 2nd | - |
| Room E | 18.63 | 1 | 2nd | - |
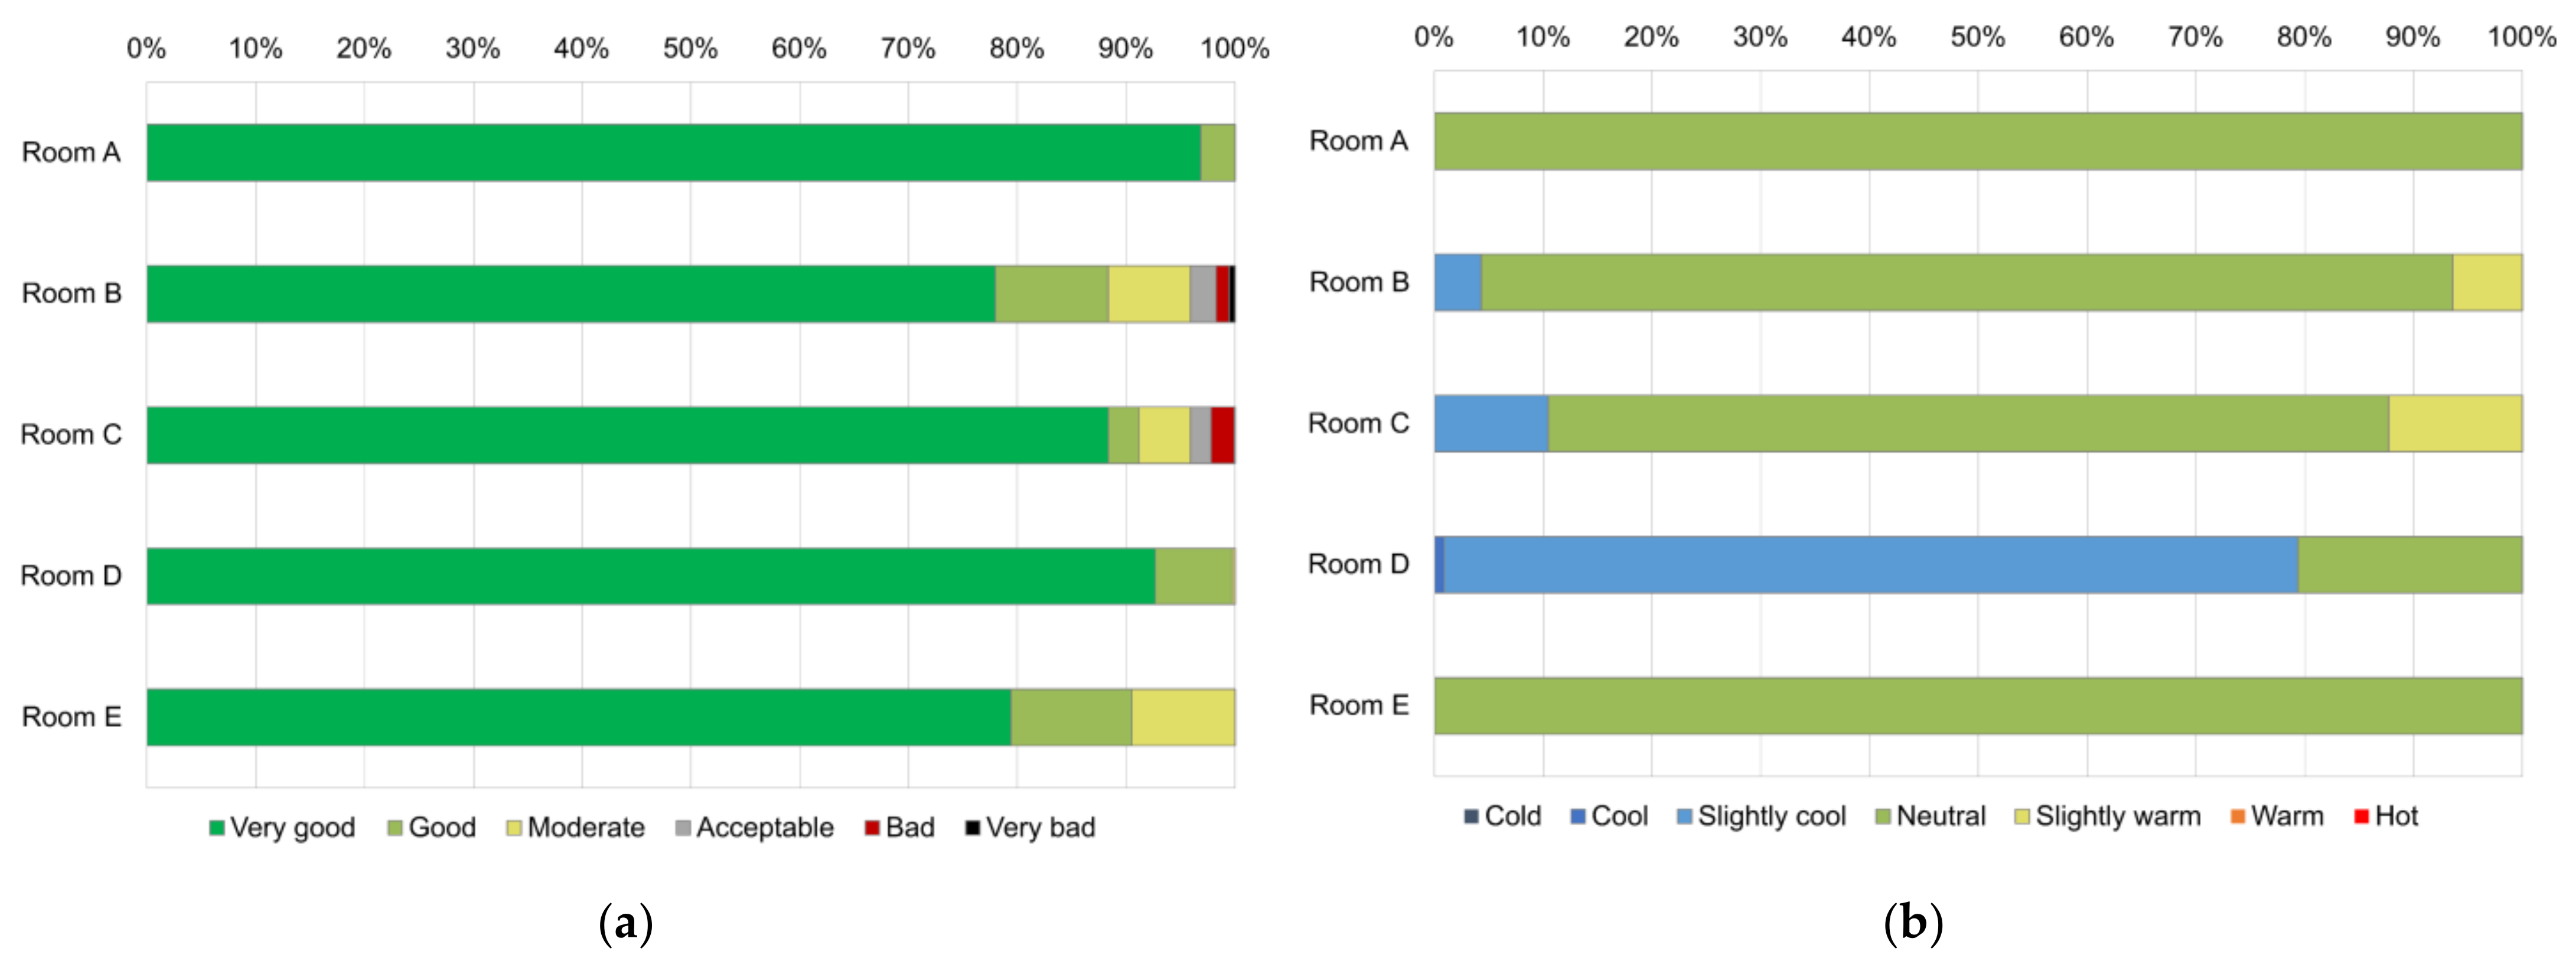
| Air Quality Level | Concentration, ppm |
|---|---|
| Very good | <800 |
| Good | 800–1000 |
| Moderate | 1000–1400 |
| Acceptable | 1400–2000 |
| Bad | 2000–3000 |
| Very bad | >3000 |
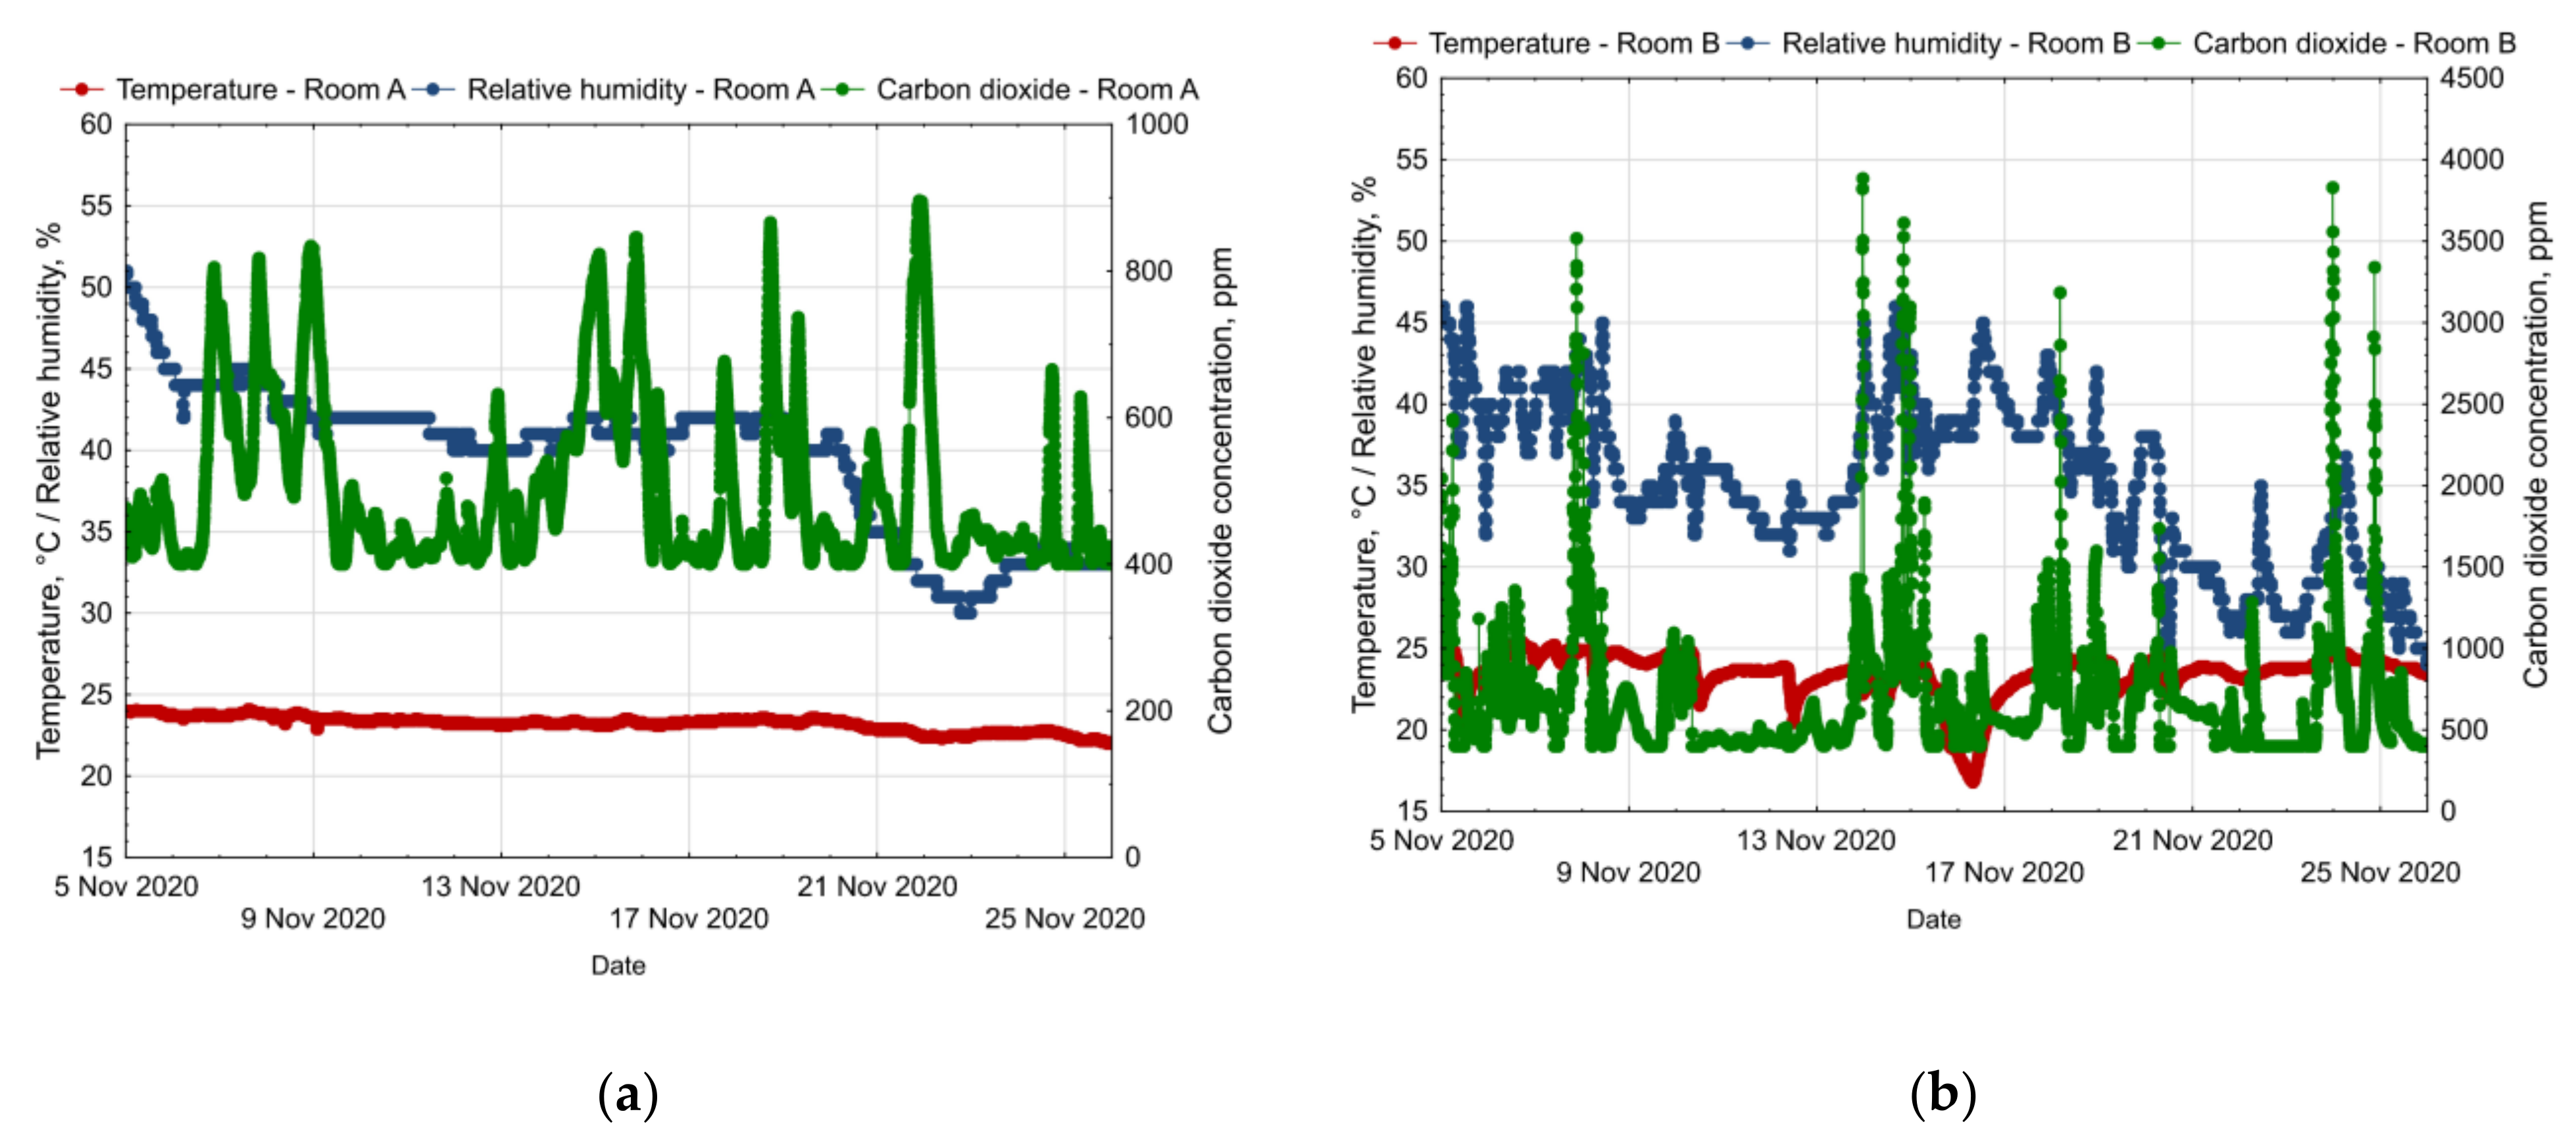
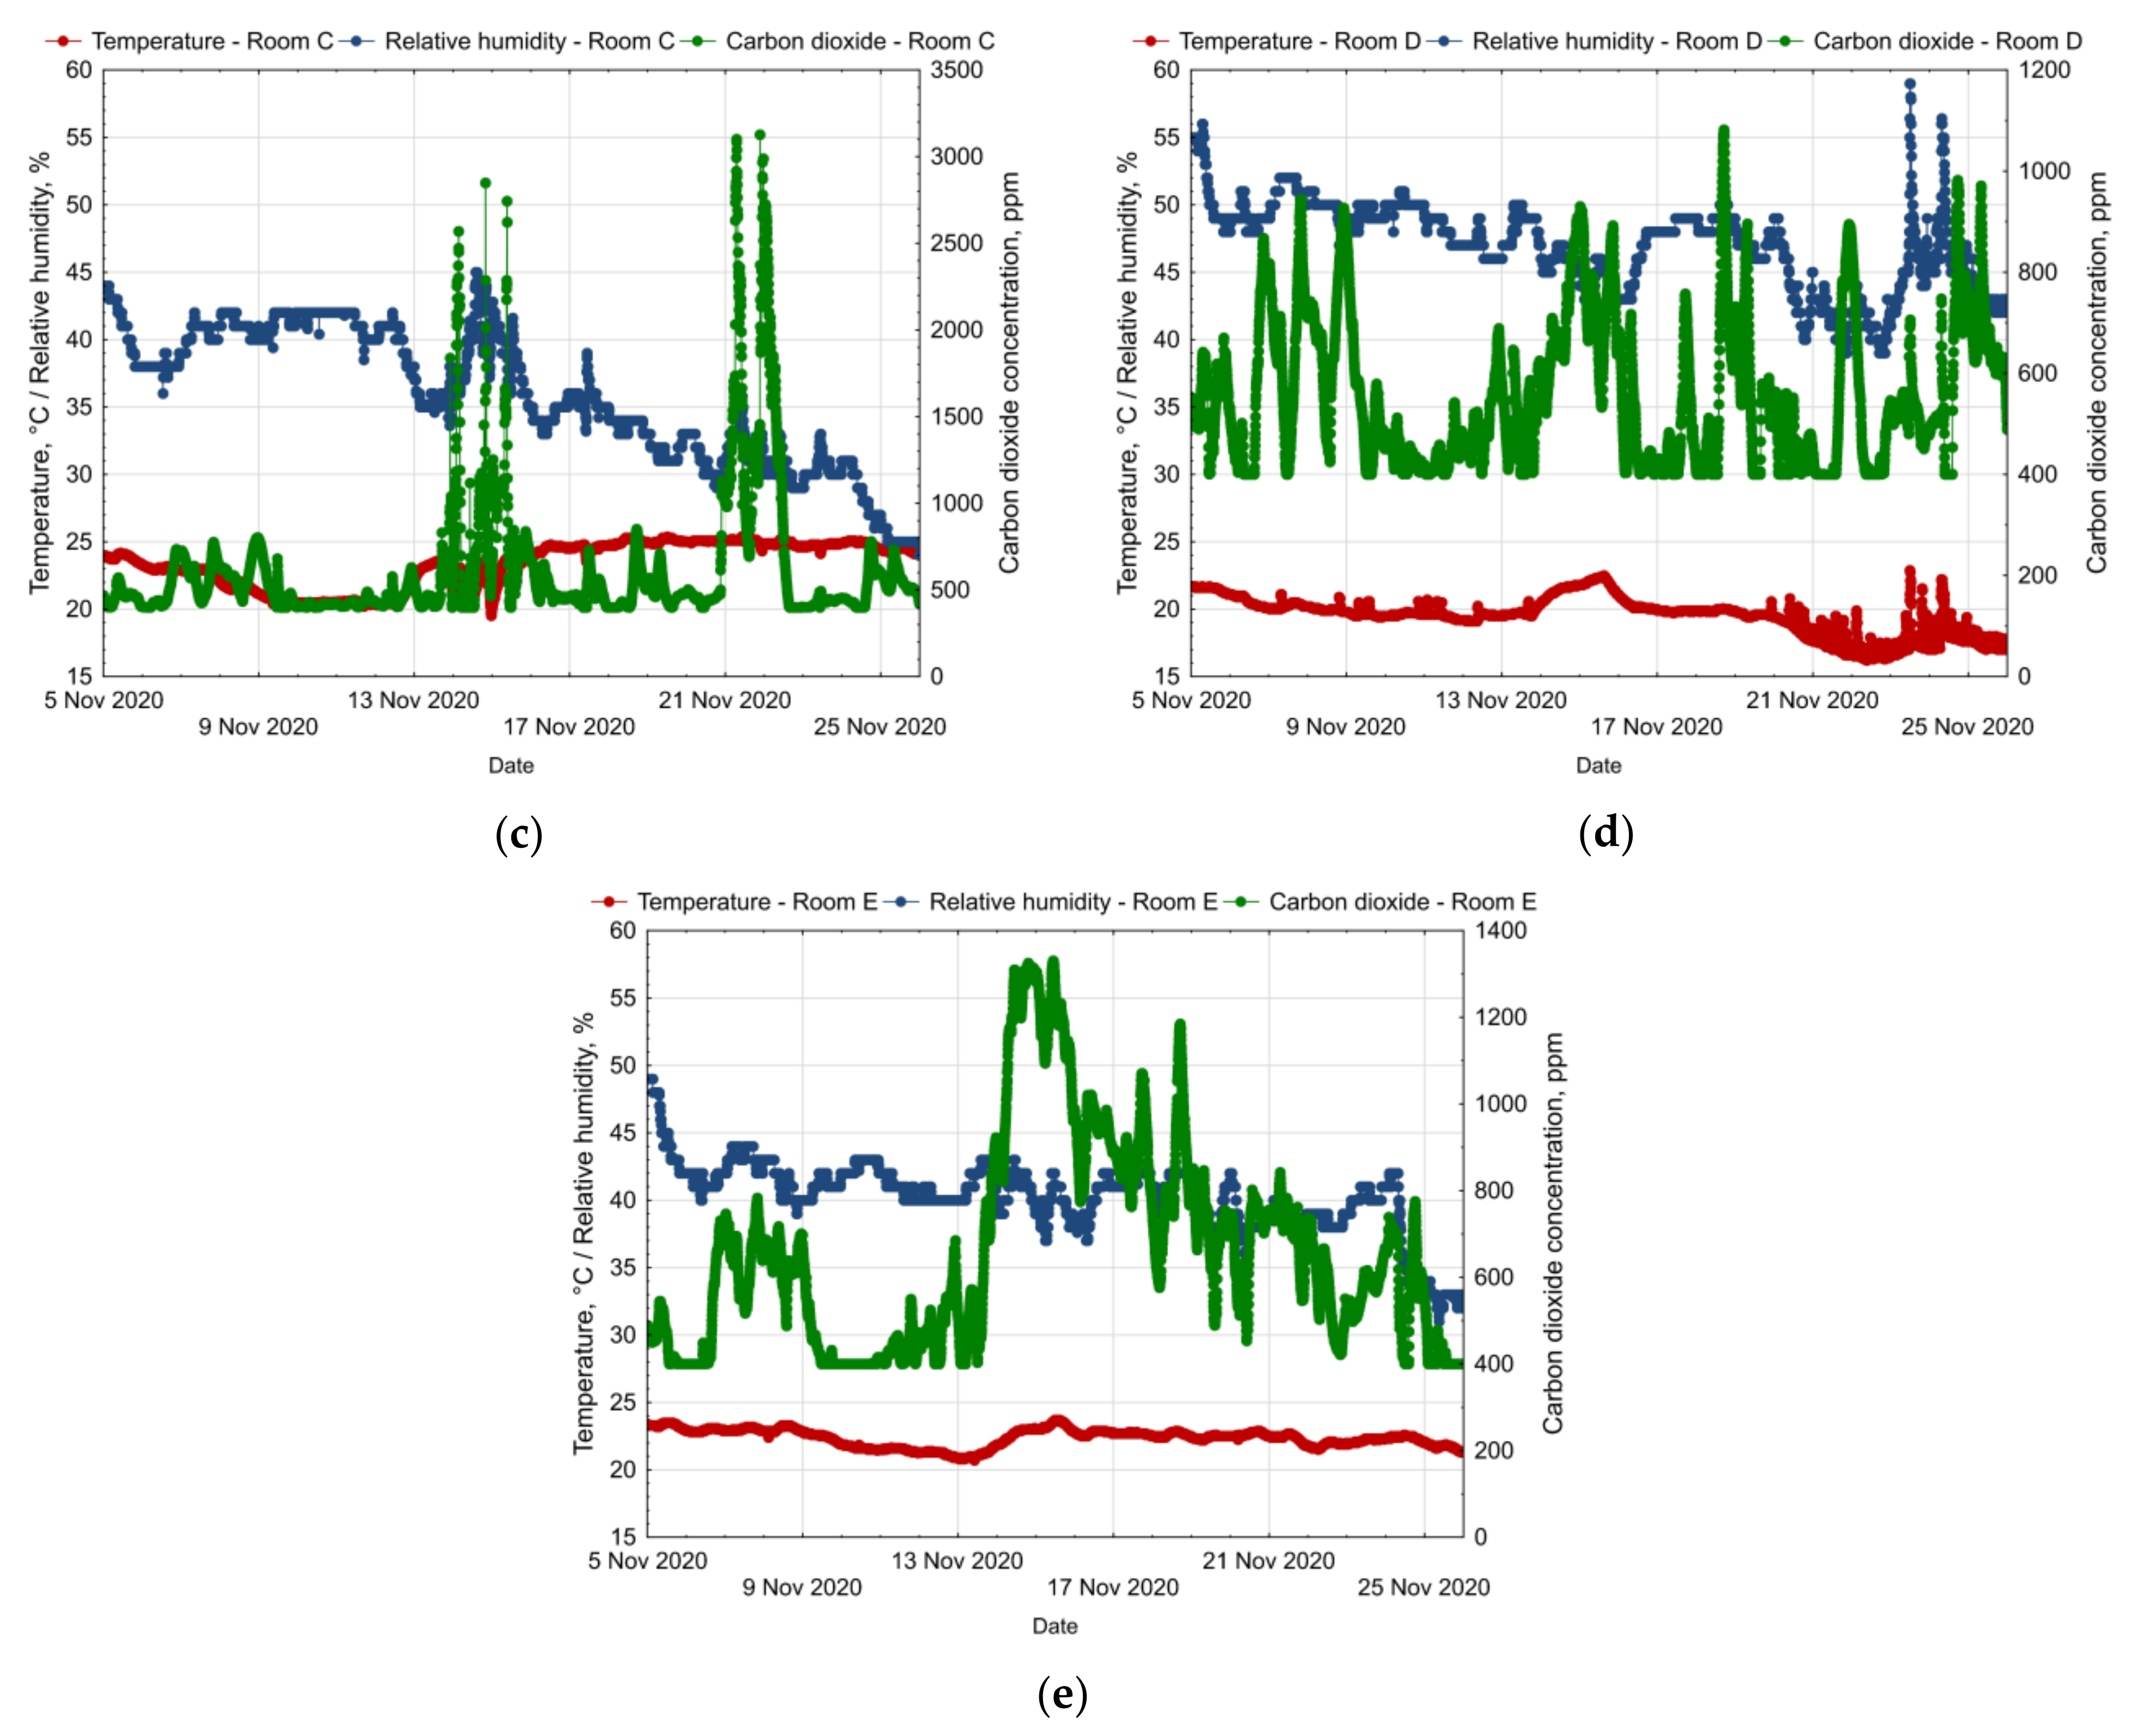
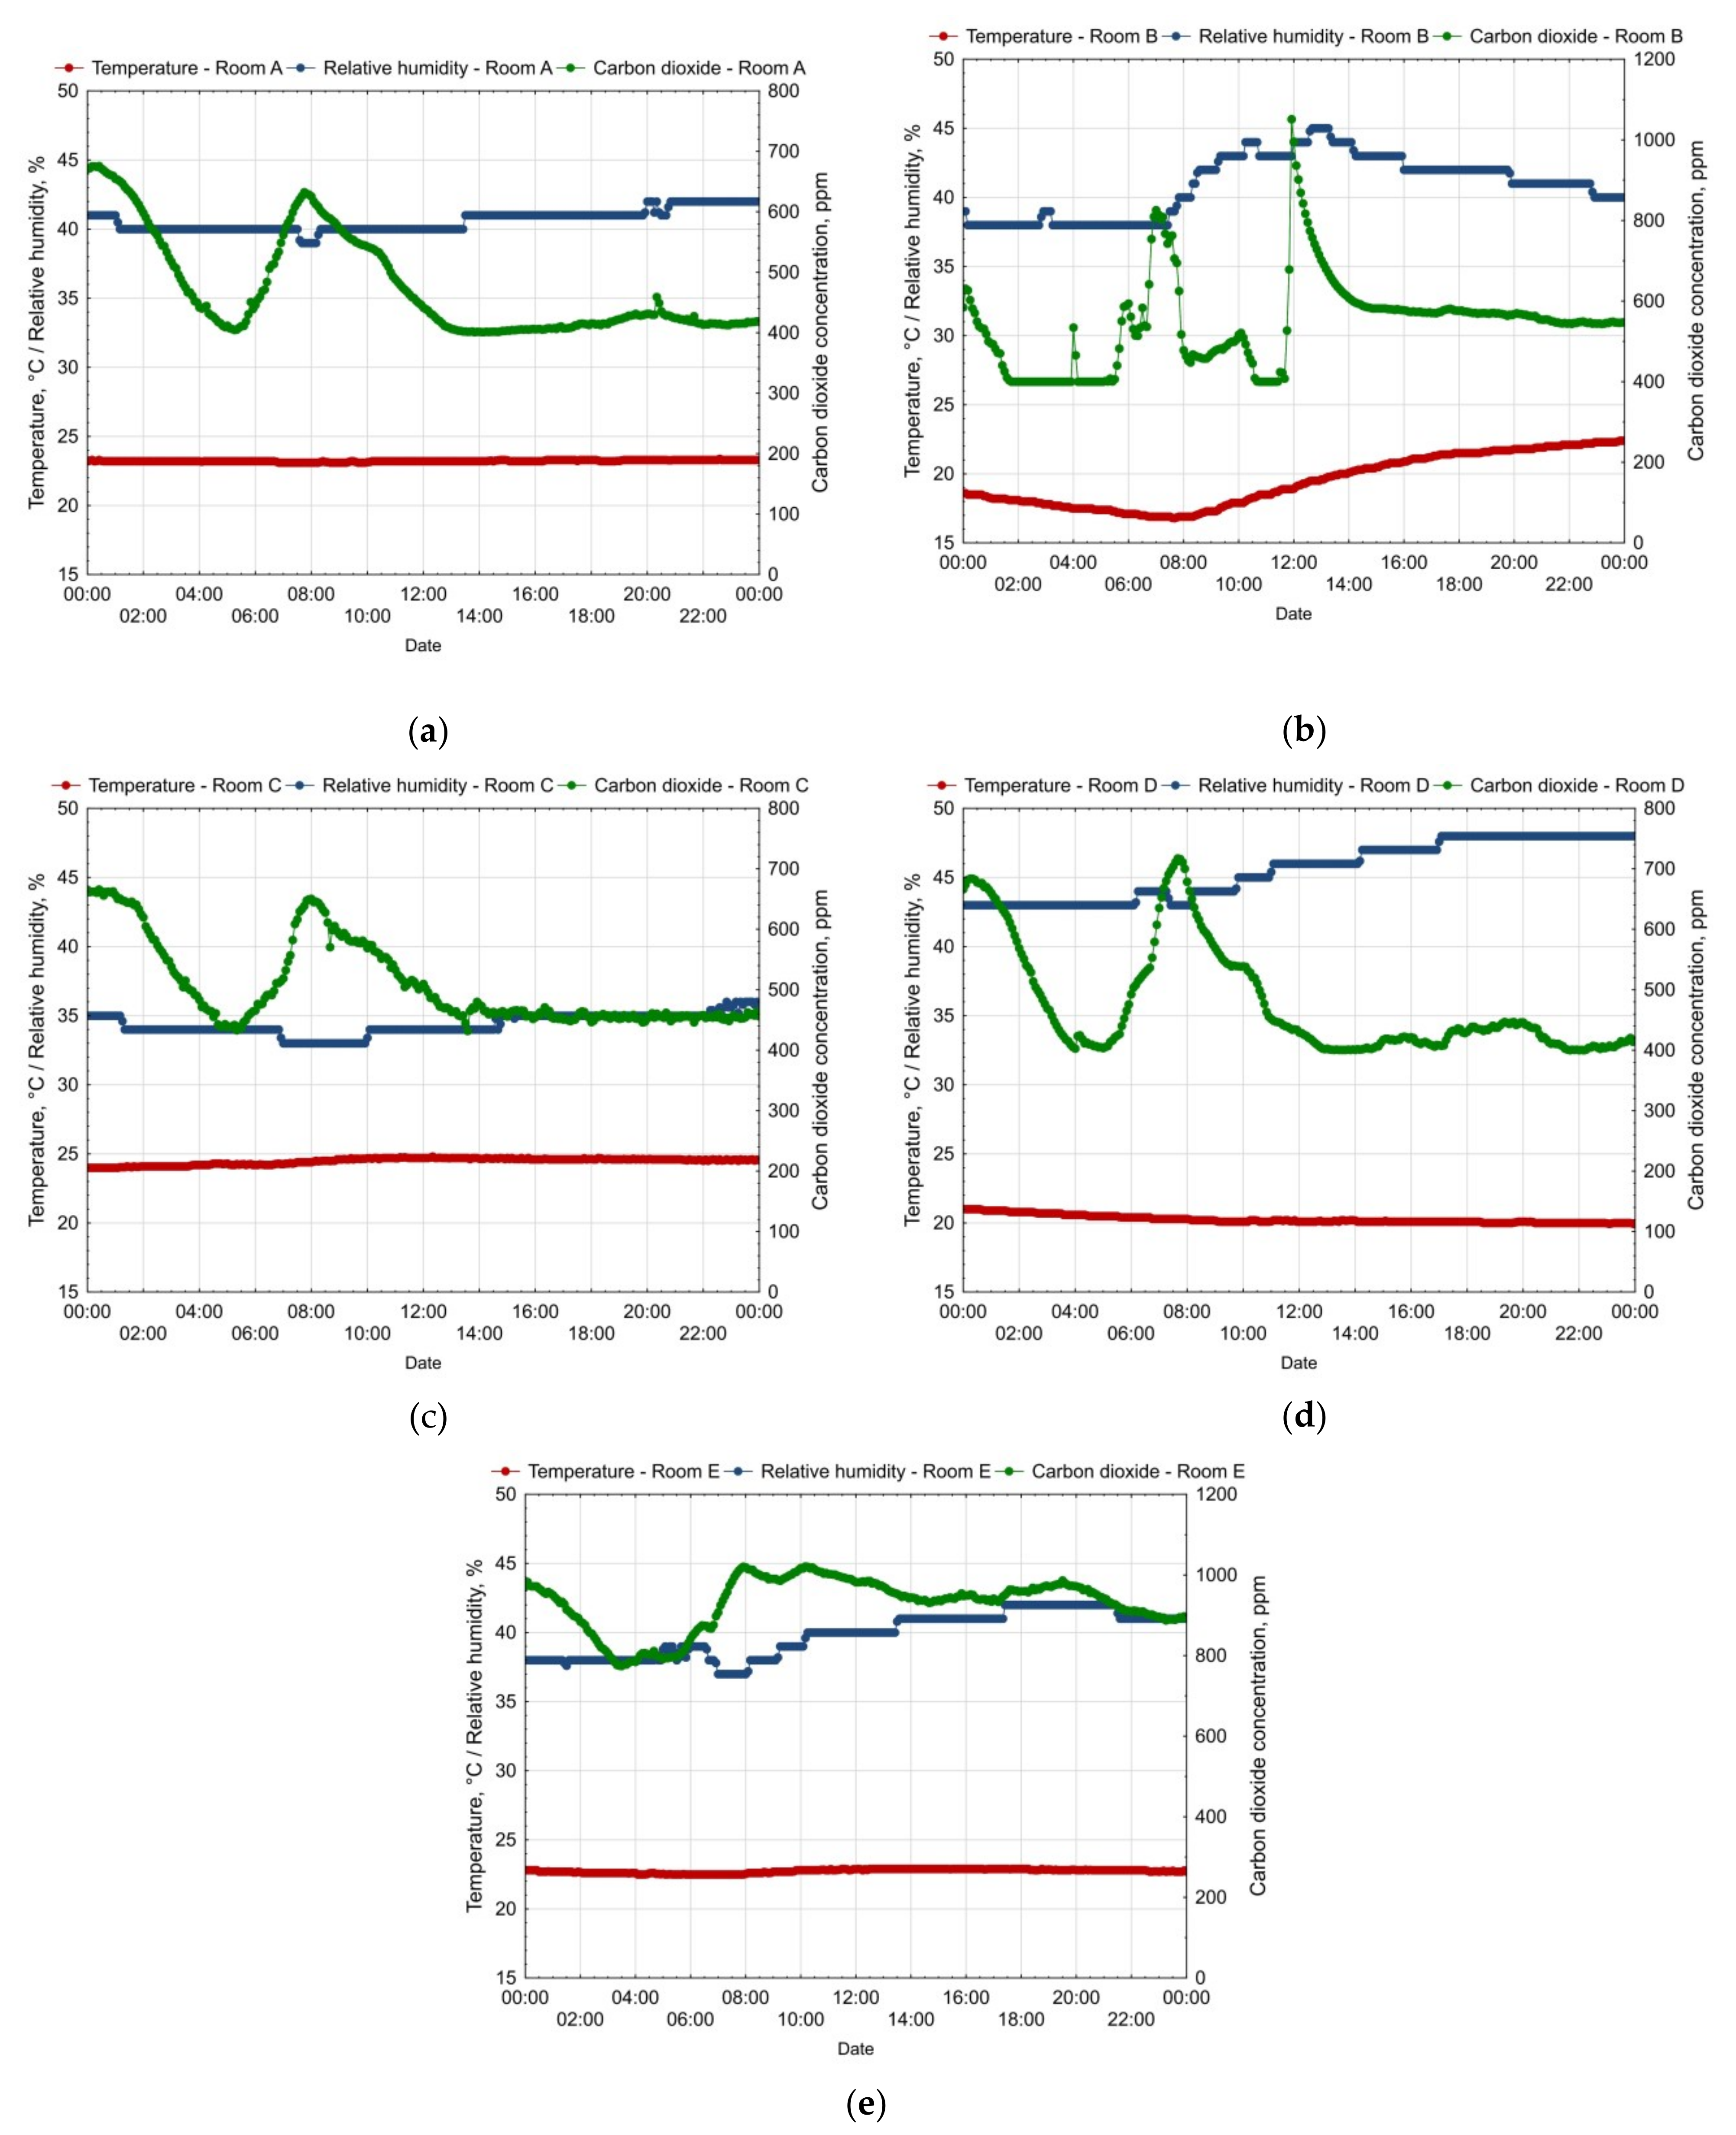
| Room | Temperature, °C | Relative Humidity, % | CO2 Concentration, ppm | ||||||
|---|---|---|---|---|---|---|---|---|---|
| Min. | Max. | Avg. | Min. | Max. | Avg. | Min. | Max. | Avg. | |
| A | 21.7 | 24.1 | 23.2 | 30.0 | 51.0 | 39.4 | 400.0 | 869.0 | 502.0 |
| B | 16.8 | 25.6 | 23.5 | 24.0 | 46.0 | 34.7 | 400.0 | 3884.6 | 669.7 |
| C | 19.5 | 25.4 | 23.4 | 24.0 | 45.0 | 35.3 | 400.0 | 3126.6 | 603.1 |
| D | 16.2 | 22.9 | 19.4 | 39.0 | 59.0 | 46.7 | 400.0 | 1082.0 | 553.8 |
| E | 20.7 | 23.7 | 22.3 | 31.0 | 49.0 | 39.9 | 400.0 | 1330.5 | 646.9 |
Publisher’s Note: MDPI stays neutral with regard to jurisdictional claims in published maps and institutional affiliations. |
© 2022 by the authors. Licensee MDPI, Basel, Switzerland. This article is an open access article distributed under the terms and conditions of the Creative Commons Attribution (CC BY) license (https://creativecommons.org/licenses/by/4.0/).
Share and Cite
Borowski, M.; Zwolińska, K.; Czerwiński, M. An Experimental Study of Thermal Comfort and Indoor Air Quality—A Case Study of a Hotel Building. Energies 2022, 15, 2026. https://doi.org/10.3390/en15062026
Borowski M, Zwolińska K, Czerwiński M. An Experimental Study of Thermal Comfort and Indoor Air Quality—A Case Study of a Hotel Building. Energies. 2022; 15(6):2026. https://doi.org/10.3390/en15062026
Chicago/Turabian StyleBorowski, Marek, Klaudia Zwolińska, and Marcin Czerwiński. 2022. "An Experimental Study of Thermal Comfort and Indoor Air Quality—A Case Study of a Hotel Building" Energies 15, no. 6: 2026. https://doi.org/10.3390/en15062026