Article

Impact of Hybrid Ventilation Strategies in Energy Savings of Buildings: In Regard to Mixed-Humid Climate Regions

1
Department of Architecture and Architectural Engineering, Yonsei University, 50, Yonsei-ro, Seodaemun-gu, Seoul 03722, Korea
2
College of Engineering, Lawrence Technological University, 21000 W 10 Mile Rd., Southfield, MI 48075, USA
3
A.Alfred Taubman College of Architecture and Urban Planning, University of Michigan, 2000 Bonisteel Blvd, Ann Arbor, MI 48109, USA
*
Author to whom correspondence should be addressed.
Energies 2022, 15(6), 1960; https://doi.org/10.3390/en15061960
Submission received: 25 January 2022 / Revised: 25 February 2022 / Accepted: 2 March 2022 / Published: 8 March 2022
(This article belongs to the Topic Building Energy and Environment)

Abstract

:
It has been identified that improving building energy efficiency is an effective method to reduce greenhouse gas (GHG) emissions. Although standards have been established to satisfy a building’s minimum energy demand while ensuring the comfort of its residents, they are difficult to implement in mixed-humid regions. This study proposes a hybrid ventilation strategy that can comprehensively reduce cooling, heating, and ventilation energy in mixed-humid climate regions to significantly decrease the primary energy demand and reduce the impact of buildings on the environment. This study evaluated the changes in energy saving potential and thermal comfort according to the extension of the natural ventilation period and passive strategies, such as decentralized ventilation. Changes in indoor air temperature, operative temperature, and PMV for each strategy were analyzed. As a result, extending the natural ventilation and the decentralized ventilation strategies can save 32% and 34% of the building’s energy, respectively. Considering that electricity is the main energy source for cooling in Korea, the extension of the natural ventilation period was judged to be the best approach from the perspective of primary energy demand. The results can be used to predict changes in building energy demand and thermal comfort and select an appropriate ventilation strategy based on occupant information obtained using Internet of Things.

1. Introduction

Various efforts to reduce greenhouse gas (GHG) emissions in response to the global climate crisis have been made worldwide. South Korea has further declared its target of reducing GHG emissions by 37% compared to business as usual (BAU) by 2030 [1]. Building energy consumption can be reduced by improving building performance, which can lead to a significant reduction in GHG emissions from the building energy sector. Improving building performance is thus an effective method to reduce overall GHG emissions. In this regard, many countries have reinforced building design standards, such as building envelope performance. The European Union (EU) approved EPBD to promote improvements in building energy performance [2,3]. In Korea, a strong building envelope design standard was presented by benchmarking the passive house standards of Germany.
The passive house standard is the most widely used high-performance building standard in the world that satisfies the minimum building energy demand and indoor air quality (IAQ), without impacting the thermal comfort of the occupants [4]. The standard differs slightly depending on the climate zone, but the following requirements must be met universally:
  • The energy demand of the space must be under 15 kWh/m2 of net living space (conditioned floor area) of 10 W/m2year peak energy demand.
  • The renewable primary energy demand (PER, according to PHI method), all of domestic energy, such as heating, hot water, and domestic electricity, must be under 60 kWh/m2year of conditioned floor area for Passive House Classic.
  • In terms of airtightness, only under 0.6 air change per hour (ACH) is allowed at 50 Pa pressure (ACH50), in both pressurized and depressurized states for pressure tests.
  • During winter as well as in summer, thermal comfort in all living areas must be met, with under 10% of the hours being over 25 °C [5,6].
In a mixed-humid climate zone, however, it is difficult to satisfy the passive house standard due to high humidity. High humidity causes discomfort due to various reasons. First, under high-humidity conditions, a lower indoor air temperature is required to satisfy thermal comfort because the latent heat loss from the surface of the human body is relatively small [7]. Second, dampness due to high humidity may give rise to mold, which can cause health problems, such as allergies and respiratory diseases [8]. Third, in terms of energy, a large amount of energy is required for the dehumidification process, as the conventional dehumidification process lowers the temperature of wet air to the dew point and increases it back to the setpoint temperature. As is generally known, the traditional dehumidification process requires a large amount of energy due to the cooling, dehumidification, and reheating processes.
Natural ventilation is one of the best passive strategies to improve IAQ and the thermal comfort level, while avoiding the use of mechanical devices. Natural ventilation, however, is difficult to adopt in a mixed-humid climate zone because it is applicable only when outdoor air conditions fall within comfort ranges. To overcome this limitation, Gail S. Brager et al. proposed an adaptive thermal comfort model that makes it possible to use natural ventilation even in humid climate through an improvement in air velocity [9]. The main concept of the model is to allow comfort under a higher temperature and humidity through an improvement in air velocity. Improving air velocity may slightly increase building energy consumption but can reduce total energy consumption by reducing the use of mechanical dehumidification, which requires a considerable portion of energy consumption.
Several studies used natural ventilation to allow occupants to live comfortably under a wider range of humidity conditions in a humid climate zone [10,11,12,13]. Lee et al. [10] analyzed the effect of natural ventilation using parallel double-windows in Korea. They proved that approximately 60% of cooling energy can be reduced by adopting an appropriate ventilation model. Pingel et al. [11] compared the thermal comfort in six buildings where natural ventilation was applied in a warm and humid climate zone. Several passive strategies were adopted in these buildings, and it was confirmed that exposed cavity wall, night ventilation, and optimized building forms are the most effective strategies. Hesaraki et al. [12] compared IAQ and energy saving according to the natural ventilation level. They found that sufficient air was provided even at low ventilation levels. Schulze et al. [13] calculated the energy saving effect of selecting an appropriate ventilation strategy through energy simulation. They showed that well-designed natural ventilation systems, such as those in Stuttgart, Turin, and Istanbul, could save cooling energy by 13–44 kWh/m2 per year. These studies showed that natural ventilation is effective at reducing building cooling energy. In addition, well-designed ventilation strategies and an increase in air velocity increased the effect of natural ventilation in humid climate zones.
In addition to cooling energy, heating and ventilation loads in winter are one of the factors that make it difficult to satisfy the passive house standard in humid climate zones. Heating and ventilation losses mostly occur through openings and infiltration between conditioned indoor air and unconditioned outdoor air. In this case, however, it is difficult for occupants to control the airflow. Therefore, minimizing the supply air volume is an effective method to save energy.
For the traditional control method, however, the adjustment of the air volume is inefficient because the indoor environment is air conditioned even in the absence of occupants in the same way as when it is occupied [14]. In addition, since the building design standards of Korea already require a sufficiently high insulation envelope performance, residential buildings do not require a large-scale HVAC system. Therefore, IAQ can be satisfied just by adding a small cooling and heating unit to HRV, and energy can be saved through heat exchange between exhaust and returning air through the continuous supply of outdoor air. It was generally difficult, however, to apply HRV to residential buildings because of the high installation cost and operator expertise required. In addition, HRV has been overdesigned due to the conventional operation method of centralized control. Therefore, the installation of a small HRV in each room makes it possible to supply fresh air through DV, simultaneously saving heating and ventilation energy, even in winter.
Therefore, demand-based ventilation was used in several studies to find the optimal air supply volume. Nguyen et al. [15] divided demand-based control into distributed control and decentralized control. They mentioned that the primary difference between the two methods is whether the agents communicate with each other. Decentralized control adjusts local controllers without communication. More specifically, Kim et al. [16] described fan-assisted natural ventilation as one of the DV strategies. Kim compared the energy saving potentials of buildings with decentralized ventilation located in European climate zones. Among various distributed systems, radiant panel distributed ventilation (RPDV) was found to require the lowest initial and operating costs. Silva et al. [17] performed POE through surveys and measurements in residential buildings with centralized and decentralized ventilation systems. A total of 80% of the occupants responded that they were satisfied with the building environment after remodeling to a decentralized ventilation system. Based on these studies, heating and ventilation losses are expected to be reduced through DV, one of the demand control methods.
In recent years, many studies have been conducted on hybrid ventilation, a concept that combines passive ventilation and mechanical ventilation. These studies, however, proposed energy saving and comfort improvement in individual areas, such as cooling energy, heating energy, and ventilation energy, but suggested no specific strategy, protocol, or standard [18]. In addition, the effect of the existing hybrid ventilation strategy was proven in hot and dry climate zones, but a different ventilation strategy is required in climate zones where it is hot and humid in summer and cold and dry in winter as in Korea. Therefore, this study proposes a ventilation strategy that can comprehensively reduce cooling, heating, and ventilation energy in mixed-humid climate regions. Figure 1 shows a concept diagram of the proposed ventilation strategy in this study.
In Korea, most HVAC systems are packaged air conditioners or split-unit systems, and electricity is used as the main energy source. Since electricity undergoes several conversion processes, the proportion of the primary energy demand is larger compared to other energy sources, such as thermal energy. Therefore, in this study, a hybrid ventilation strategy was proposed to significantly decrease the primary energy demand and reduce the impact of buildings on the environment.

2. Simulation Strategies

2.1. Natural Ventilation

Natural ventilation is a passive strategy traditionally used to reduce the cooling loads of buildings and secure IAQ [10]. Natural ventilation, however, is significantly affected by outdoor air conditions, and its effect is insignificant in a humid climate zone because it is applicable only when outdoor air conditions fall within the comfort ranges for temperature and humidity [12]. As a matter of fact, it is difficult to define the comfort ranges of outdoor air due to non-quantitative factors. Nevertheless, many studies have followed the criteria of ASHRAE Standard 55, which considers the PMV model [19]. The natural ventilation criteria of ASHRAE consider the temperature and absolute humidity of the outdoor air. Figure 2 shows the specific natural ventilation criteria suggested by ASHRAE Standard 55. When the period that allows natural ventilation was calculated using the climate data of Seoul, it was found that 2092 h makes up 22.4% of the year. Thus, the effect of natural ventilation is not significant. Therefore, additional energy saving can be achieved by extending the natural ventilation period and reducing the mechanical ventilation period. In this study, the concept of the adaptive thermal comfort model was used to extend the natural ventilation period.

2.2. Increasing Air Velocity

The concept of the adaptive thermal comfort model is based on the supposition that it is possible to expand the comfort ranges of temperature and humidity that people generally feel by increasing indoor air velocity. In many previous studies, a cooling effect and comfort improvement were achieved using this concept [20,21,22,23,24,25]. In this study, ceiling fans were used as devices to increase the indoor air velocity. A ceiling fan can control a larger area than other airflow-generating devices, and can generate various air velocities. As the electric power varies depending on the generated air velocity, the energy demand was calculated in this study based on level 6 electric power (11 W), which generates a velocity of 1.5 m/s, by referring to a study by Zhai et al. [20]. Table 1 shows the fan power depending on air speed. Since the target building had four zones that require air-conditioning, the minimum requirement of four ceiling fans was met.

2.3. Heat Recovery Ventilator

Since it is hot and humid in summer and cold and dry in winter in Korea, HRVs that can exchange both sensible heat and latent heat are required when heat exchangers are to be used. Existing HRVs, however, are large and require high installation costs. In addition, the condensation problem has continuously been raised. Currently, in Korea, the minimum standard for HRV performance is presented by KS B 6879, which is shown in Table 2 [26]. This standard stipulates an air-to-air heat recovery ventilator with heat exchange elements and filter units installed between indoor and outdoor spaces, with under 600 V and 3000 ACH. In this study, energy and thermal comfort were calculated while a small HRV that meets the minimum standard was used. It is possible to operate ventilation systems according to the number of occupants by installing small HRVs in the window of each room. In this process, the ventilation loss can be reduced by adjusting the air supply volume. Based on this, the energy efficiency of the entire building can be improved.

3. Simulation

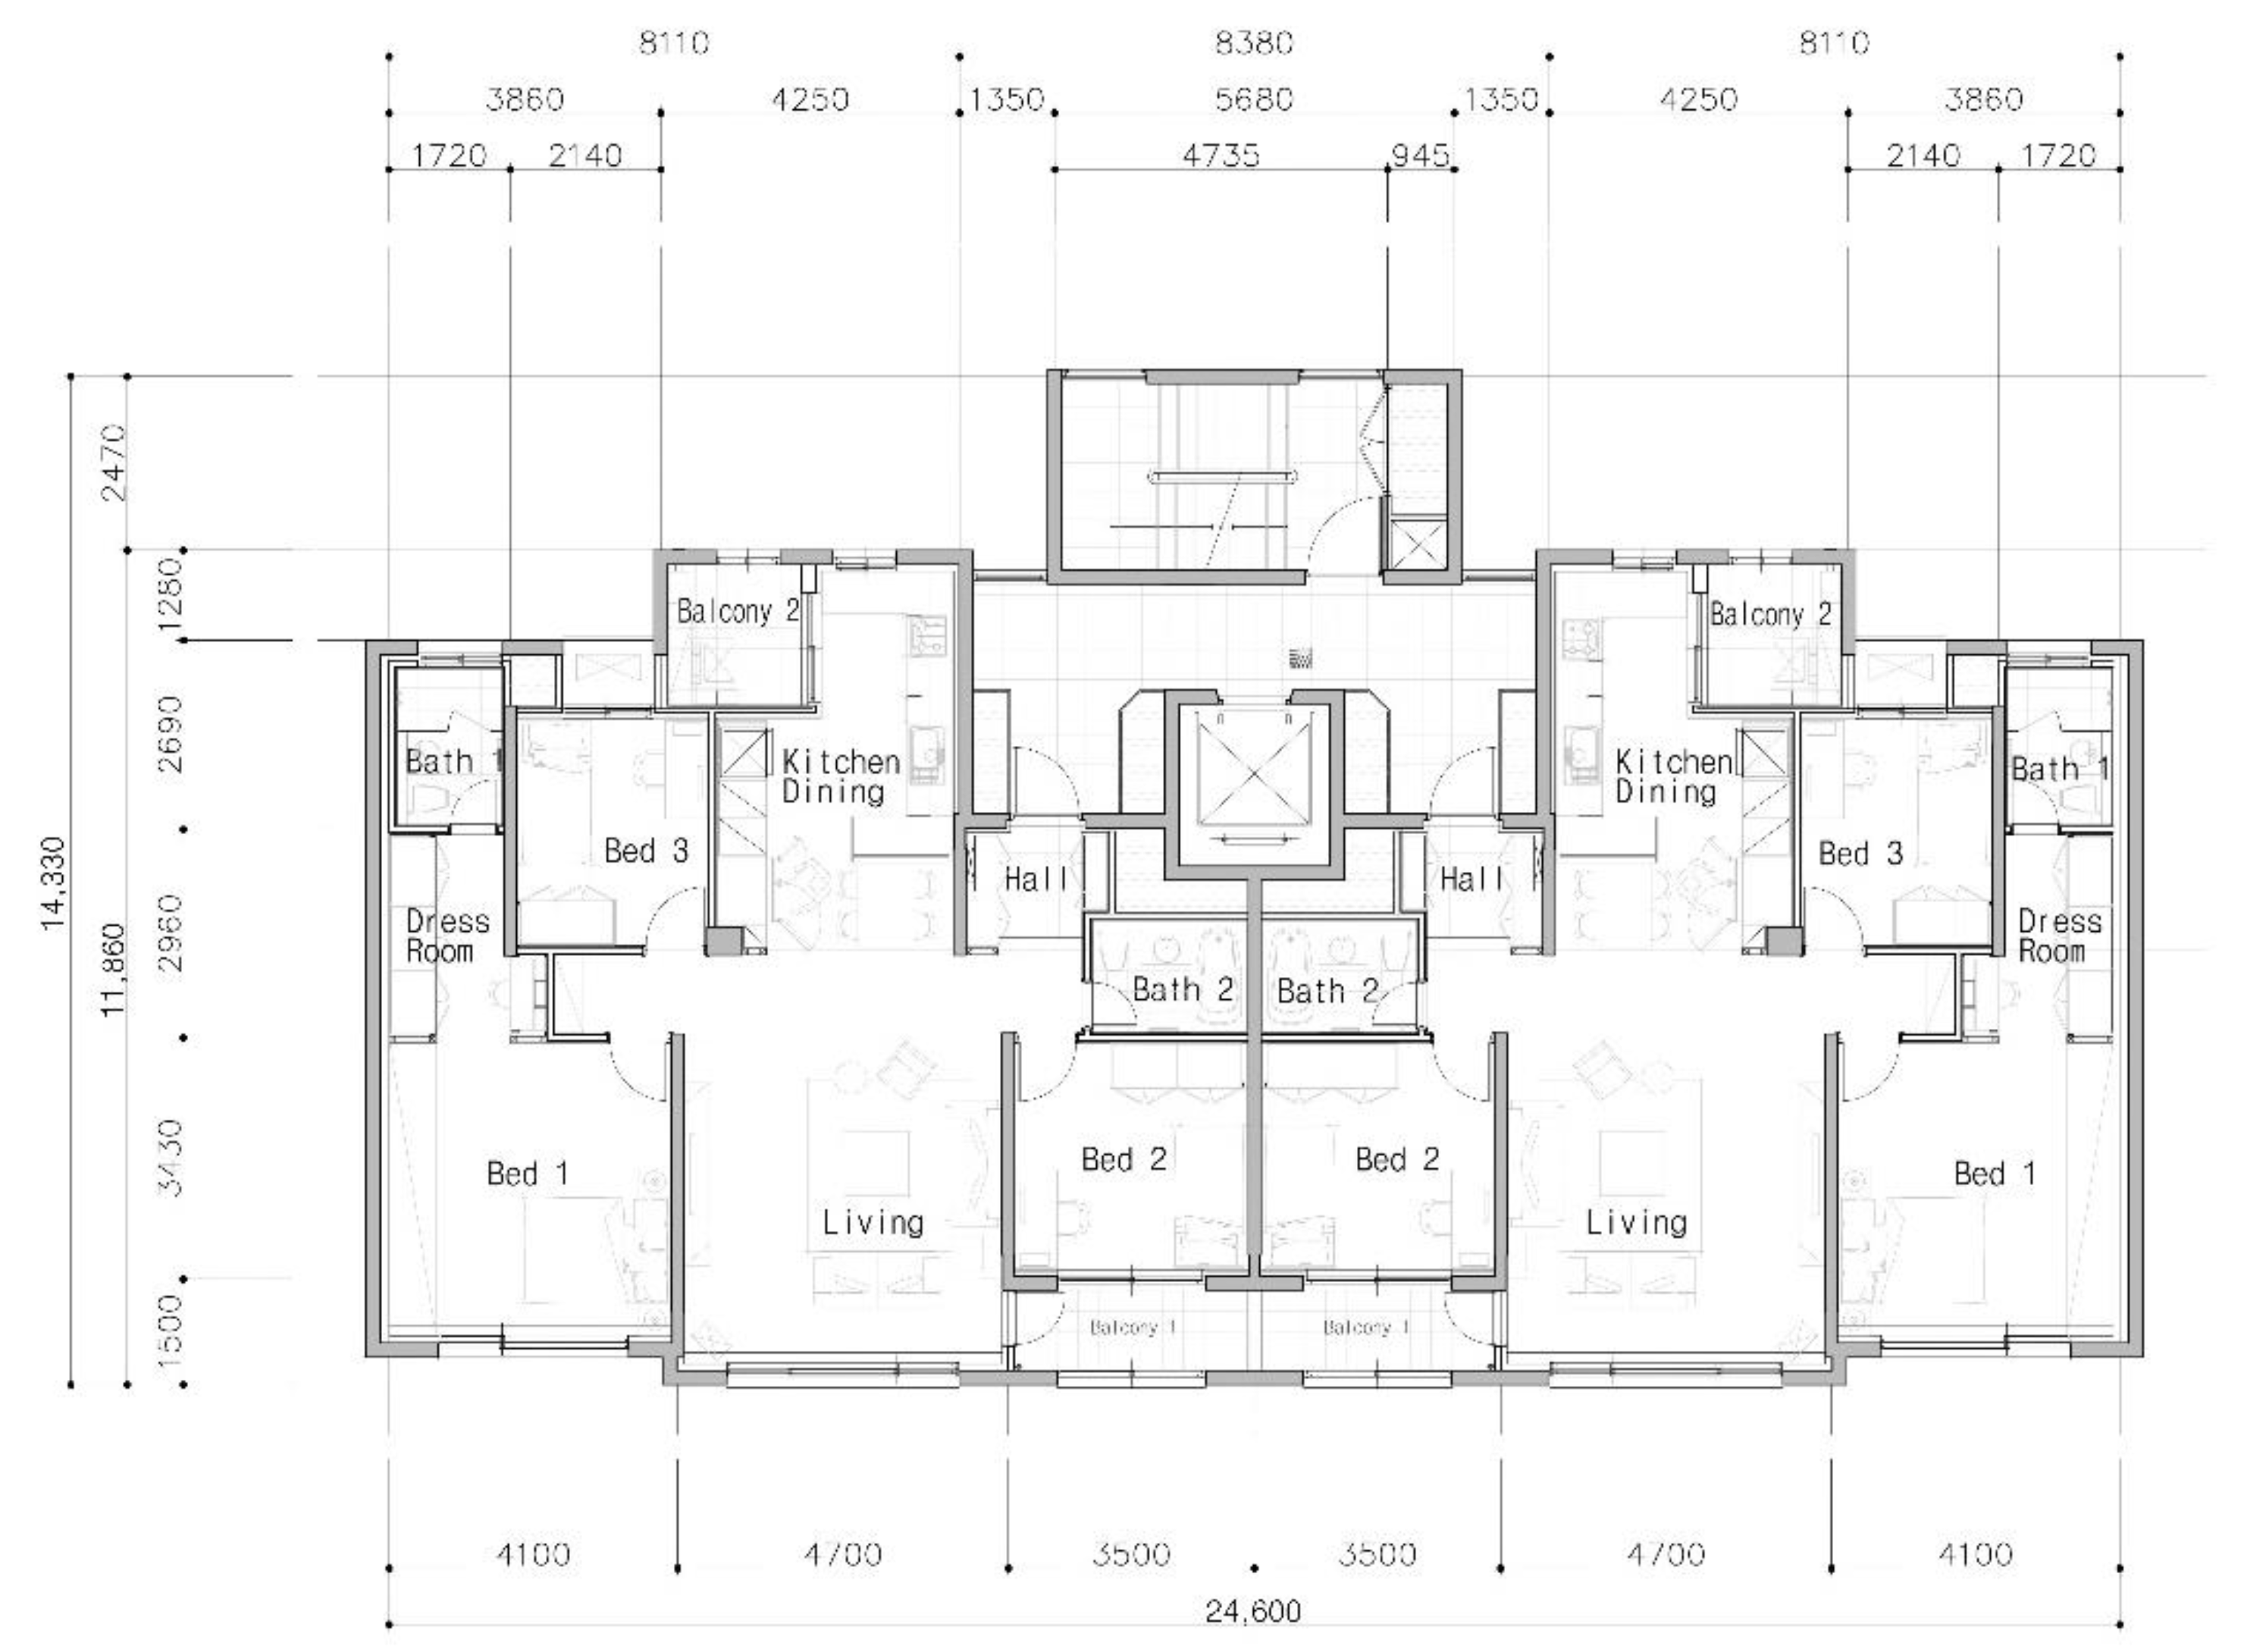
3.1. Simulation Description

In this study, an Energyplus engine was used to calculate the building energy demand. This can reflect the design elements and physical properties of a building through Rhino/Grasshopper. The energy simulation results were calculated on an hourly basis. Recently, Energyplus has been used in various studies because it is able to calculate building energy even in a complex energy model [27].

3.2. Climate Analysis

The climate of Korea is classified as a mixed-humid climate according to the Koppen Geiger classification criteria. In this study, the TMY weather data of Seoul, the capital city of Korea with the largest population, were used. Figure 3 shows the annual temperature and humidity distribution of outdoor air. Based on the criteria of Figure 2 (Bottom), 3055 h per year is available to extend the natural ventilation period in Korean climate.

3.3. Building Statement

Since Seoul has a high population density, most people live in high-rise apartments. The Korean government provides typical apartment drawings, such as floor plans, section plans, and system plans, to provide a high-quality residential environment. Figure 4 is the standard floor plan of apartments given by the Korean government. This suggests that the criteria for insulation performance and airtightness performance by region are used to secure a zero-energy building performance for new buildings. In this study, an energy simulation was performed based on the standard apartment drawings and building performance in Seoul. The input variables for simulation are shown in Table 3 [28].
Residential buildings in Korea mostly adopt hot water pipe floor heating for heating and packaged air conditioners or split-unit systems for cooling. The distribution energy of heating and cooling was calculated considering the characteristics of the media air and water. The pressure loss according to the medium is calculated using the following formula [29]:
P d r o p = 1000 · f · ρ · v 2 2 D   · ( 1.6   +   1.1 L d u c t )
where:
Pdrop = Pressure drop (Pa);
f = Friction factor;
ρ = Density of mass (kg/m3);
v = Velocity (m/s);
D = Hydraulic diameter (m), generally 1.204;
Lduct = Duct length (m).
The designed duct lengths (L) for each room in the unit household are shown in Table 4.

3.4. Occupancy Schedule

In the conventional HVAC control method that involves the introduction of outdoor air, the required air supply volume is calculated based on the maximum number of occupants. Thus, energy can be wasted due to overdesign. The calculation of the number of occupants for energy simulation generally follows the basic occupancy schedules of EN and ISO. In this study, the basic occupancy schedule of Ahmed et al. [30], calculated based on the EN16798-1 and ISO/FDIS 17772-1 standards, was reflected in the energy simulation [31,32]. The occupancy schedule for each zone was calculated by applying the ratio obtained in the study by Ahmed et al. based on four people per household. Figure 5 shows the occupancy schedule for energy simulation with a conventional HVAC system and decentralized ventilation strategy in each room.

4. Results

4.1. Energy Saving Potential

To evaluate the energy saving potential via the two passive strategies presented above, the energy demand, primary energy demand, and CO2 emissions were compared for each strategy. Each strategy was divided into the following four cases and the effects of each strategy were compared: Case 1—baseline; Case 2—extended natural ventilation; Case 3—decentralized ventilation; and Case 4—combined passive strategies (proposed solution). Table 5 shows the description of each simulation case and Figure 6 shows the annual energy demand per unit area for each of the four strategies.
In Case 1, where the existing ventilation strategy is used, 16.03 kWh/m2 of energy is required per year for HVAC. If the natural ventilation period can be extended in Case 1 by improving the air velocity, the energy demand is reduced by approximately 5.18 kWh/m2year. The energy demand of Case 3 in which DV is used is similar to that of Case 2. The annual energy demands of Cases 2 and 3 were calculated to be 10.85 and 10.50 kWh/m2, respectively. Conversely, in Case 4 where all of the proposed strategies are used, the energy demand can be further reduced to 7.19 kWh/m2. Figure 7a–c show the energy consumption patterns of each strategy on a random date.
The primary energy demand was calculated based on the actual energy demand. In the target building, a heat pump is used for heating and a compression chiller is used for cooling. Since the cooling and heating heat sources are different, the primary energy demand is also different from the energy demand calculated above. In Korea, coal gas has been traditionally used as a heating heat source and electricity as a cooling heat source. The Korea Energy Agency suggests 1.1 and 2.75 as the conversion factors of gas and electricity, respectively, for primary energy calculation. Table 6 shows the primary energy factor depending on the energy source in Korea.
For this reason, the primary energy demand for each case was found to be 31.06 kWh/m2 for Case 1, 19.15 kWh/m2 for Case 2, 19.35 kWh/m2 for Case 3, and 12.23 kWh/m2 for Case 4. Figure 8 summarizes the primary energy demand for each strategy.
To examine the impact on the environment, the primary energy demand was converted into CO2 emissions. Despite the same primary energy demand, the impact on the environment may vary depending on the energy production method. The energy production method differs by region. In Korea, which is the target region, energy is produced based on the proportions shown in Table 7. Figure 9 shows the results of calculating CO2 emissions based on these proportions and the primary energy demand. CO2 emissions were calculated to be 12.87 kgCO2/m2year for Case 1, 7.93 kgCO2/m2year for Case 2, 8.09 kgCO2/m2year for Case 3, and 5.06 kgCO2/m2year for Case 4.

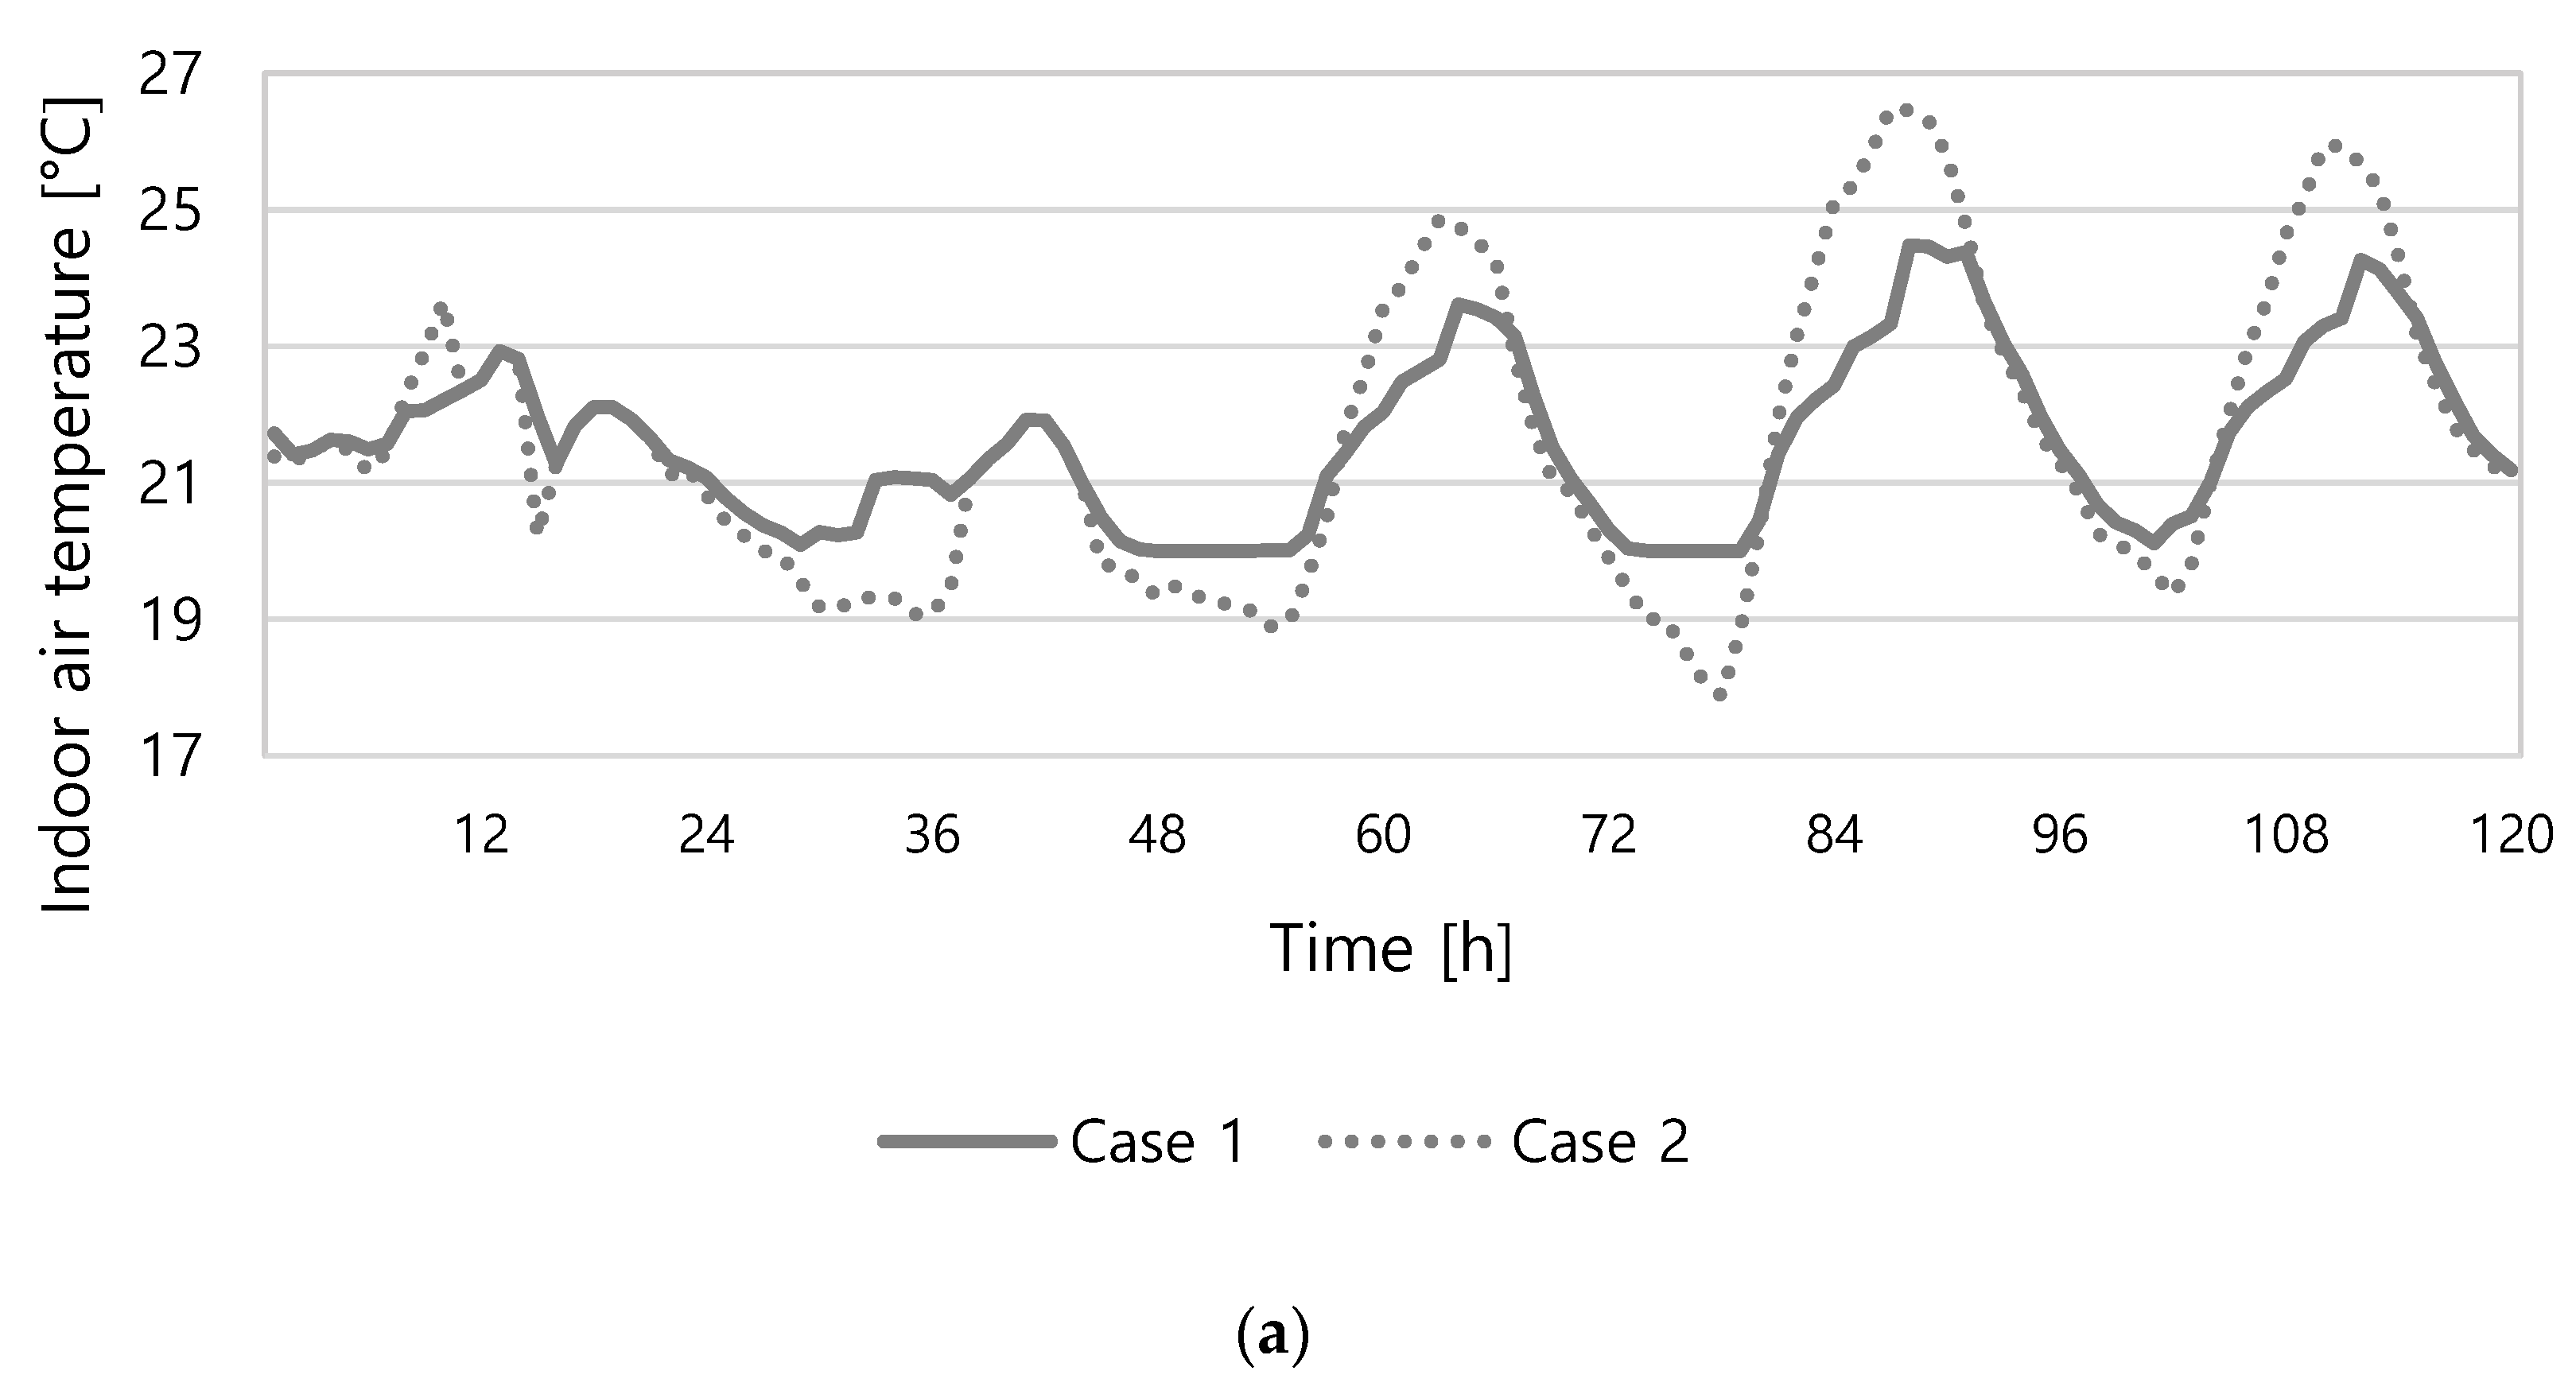
4.2. Thermal Comfort

To examine the comfort of occupants and the energy saving potential under each strategy, the indoor air temperature, operative temperature, and PMV were compared as thermal comfort indices. Thermal comfort was analyzed for Bedroom 01 with the highest density (two out of four occupants) in the household. Figure 10 shows the changes in the indoor air temperature of Bedroom 01 in a sample week.
In Case 1, the air temperature ranged from 20 to 26 °C due to the constant operation of HVAC. In Cases 2 and 3, similar indoor temperature distributions were observed. In Case 4, however, the temperature exceeded 26 °C or dropped below 20 °C in some instances, but the temperature difference was not severe and was found to be acceptable for most people.
Second, the operative temperatures, one of the indicators of the thermal comfort of occupants, were compared and analyzed. When the indoor air velocity is 0.2 m/s or less, the operative temperature is calculated as the average of the indoor air temperature (Ta) and the mean radiant temperature (MRT) [19,33].
T o = T a + T m r t 2
In this study, however, the operative temperature was calculated using Equation (3) because the case of extending the natural ventilation period through an improvement in indoor air velocity was considered [19].
T o = A   T a + ( 1 A )   T m r t
For A, the following values in Table 8 were used according to the average indoor air velocity.
ASHRAE standard 55 suggests acceptable operative temperature ranges as shown in Figure 11. This graph compares the monthly average outdoor air temperature with the indoor operative temperature, showing acceptability limits of 80% and 90%. In this study, the acceptable hours of a year in which the traditional control method falls within the 80% acceptability limits were examined, and their change for each strategy was evaluated to compare the thermal comfort. In Case 1, the acceptable hour limit was found to be 4933 h, at which point the building satisfied thermal comfort using HVAC systems. For other strategies, the acceptable hours slightly decreased due to the mixing of indoor air and outdoor air. Figure 12a,b show 80% acceptable hours for each strategy.
Finally, PMV, which is most widely used as a thermal comfort index, was analyzed. PMV is calculated based on the following six variables: the air temperature, relative humidity, MRT, air velocity, amount of clothing, and metabolic rate. ASHRAE suggests thermal comfort ratings using this index, as shown in Figure 13. PMV is calculated using the following equation.
P M V = ( 0.303 e 0.036 M + 0.28 ) L body
where:
PMV = Predicted Mean Vote;
M = Metabolic rate;
Lbody = Thermal load on the body.
In this study, PMV was calculated every hour to compare the thermal comfort for each strategy. Non-quantitative factors, such as the amount of clothing and metabolic rate, were assumed to be different for summer and winter. The amount of clothing was set to 0.6 for summer and 1.0 for winter. Consequently, the average PMV values were found to be −0.32, −0.62, −0.66, and −0.70 for Cases 1–4, respectively. The average PMV was slightly different for each strategy, although it was generally similar. Figure 14 shows the PMV according to each case.

5. Discussion

5.1. Energy Saving Potential

This study evaluated the energy saving and changes in comfort through the existing passive strategy. Since the main strategy of this study is to extend the natural ventilation period by facilitating an increase in air velocity and to apply DV, cooling energy saving was important. The energy pattern analysis results showed that cooling energy could be saved by extending the natural ventilation period using ceiling fans. Conversely, when the outdoor air conditions were suitable for natural ventilation, the energy demand was the same as that of the existing control method. DV could also save energy by reducing heating and ventilation losses. The overall energy demand was reduced by DV, but the energy demand increased during time periods when occupants were concentrated, such as commuting hours. Total energy demand was significantly reduced by integrating the proposed strategies.
In terms of the primary energy demand, however, the results differed. Although the energy demand of the DV strategy was smaller than that of the ENV strategy, the primary energy demand of the DV strategy was found to be larger. This is because cooling and heating energy sources are different in Korea. Since electricity, which is the main energy source of cooling, goes through many conversion processes, its primary energy conversion factor is higher than that of gas. For this reason, CO2 emissions showed the same pattern as the primary energy demand. Since the cooling load is the main load in a mixed-humid climate zone, the strategy to reduce the cooling load by extending the natural ventilation period is judged to be an appropriate passive strategy that can reduce the impact on the environment as well as the energy demand.

5.2. Thermal Comfort

From a thermal comfort perspective, energy saving sometimes adversely affects thermal comfort. Energy saving, however, can be sufficiently selected as an alternative strategy if changes in thermal comfort are insignificant or negligible. In this study, changes in thermal comfort were examined by analyzing three thermal comfort indices: the indoor air temperature, operative temperature, and PMV. The indoor air temperature of each strategy fluctuated in a wider range than that of the existing ventilation strategy. The temperature, however, always fell within the comfort range as cooling and heating systems were operated when the outdoor air was overly hot or cold. In addition, the acceptable hours in which the operative temperature fell within the 80% acceptability limits suggested by ASHRAE standard 55 were examined to compare the operative temperature for each strategy. The acceptable hours were found to be 4933 h a year for the existing strategy, and they were not significantly different for the strategies of Cases 2 to 4. Case 4 was the most uncomfortable strategy based on the operative temperature, but its acceptable hours were approximately 4300 h a year, which is not significantly different from that of the existing ventilation strategy. Finally, PMV was calculated every hour for each strategy. Since clo and met, which are non-quantitative factors, were assumed for the calculation of PMV, a comparison between the PMV values is not appropriate, but comparing the thermal comfort due to the change in passive strategy is significant. As shown in Figure 13, there was no significant difference in the annual distribution and average value of PMV for each strategy. In addition, the average PMV of Case 4 is somewhat smaller than that of the existing strategy. This appears to be because natural ventilation has a direct cooling effect, while stopping mechanical HVAC.

6. Conclusions

This study focused on reducing the latent heat cooling load for the spread of zero-energy buildings in mixed-humid climate zones without the use of additional machines. It was difficult to apply many existing passive strategies to mixed-humid climate zones, such as Korea, due to high humidity. Although it is impossible to reduce the latent heat load without mechanical dehumidification, an increase in air velocity allows higher humidity and temperature to be accepted. This makes it possible to reduce the use of mechanical cooling and heating and to perform natural ventilation and reduce the overall building energy demand even when outdoor air conditions exceed the comfort ranges. In addition, under existing HVAC systems, air-conditioning is performed before the air is dispersed to each room. To overcome these two limitations, this study evaluated the changes in energy saving potential and thermal comfort according to the extension of the natural ventilation period and passive strategies, such as decentralized ventilation.
Consequently, the extension of the natural ventilation period could save 5.18 kWh/m2year of energy compared to the existing strategy, and cooling energy saving was important. The decentralized ventilation method could save 5.53 kWh/m2year of energy compared to the existing strategy. The total amount of energy saved was larger for the decentralized ventilation method compared to the strategy involving extension of the natural ventilation period. Considering that electricity is the main energy source of cooling in Korea, however, the extension of the natural ventilation period was more efficient than the decentralized ventilation strategy from a perspective of primary energy demand. Therefore, the strategy of extending the natural ventilation period through an improvement in air velocity is judged to be the most effective in mixed-humid climate zones considering the impact on the environment.
In terms of thermal comfort, changes in indoor air temperature, operative temperature, and PMV for each strategy were analyzed in this study. The indoor air temperature fluctuated in a wider range depending on the strategy, but such fluctuations were within the comfort range as mechanical HVAC was operated when the outdoor air was extremely hot or cold. To compare the operative temperature, the acceptable hours in which the operative temperature falls within the 80% acceptability limits suggested by the ASHRAE standard were examined. For the existing control method, the acceptable hours were 4933 h a year. The acceptable hours for other strategies were not significantly different as they were also more than 4000 h. When PMV was compared, there was no significant difference for each strategy. For Case 4, where the proposed strategies were integrated, the PMV value was lower than those of other strategies due to the cooling effect of natural ventilation.
Although this study was limited by the lack of consideration of the combination of increasing the air velocity and mechanical ventilation, this study is significant in that the energy saving potential of typical residential buildings through the adaptive thermal comfort model and passive strategies, such as the decentralized ventilation strategy, in a mixed-humid climate was quantitatively evaluated. To the best of the authors’ knowledge, no literature was found on the energy saving and the impact of thermal comfort by using hybrid ventilation strategy in the humid climate of South Korea. In addition, due to the recent development of measuring instruments, such as IoT sensors, it is now possible to identify the number of indoor occupants and their activities more easily and accurately than in the past. Therefore, the results of this study can be used to predict changes in building energy demand and thermal comfort according to the selection of an appropriate ventilation strategy based on the accurate information on occupants obtained using simple IoT equipment.

Author Contributions

Writing—original draft preparation, K.-Y.P.; writing—review and editing, D.-O.W.; project ad-ministration, S.-B.L.; Conceptualization, L.J. All authors have read and agreed to the published version of the manuscript.

Funding

This work was supported by the “Human Resources Program in Energy Technology” of the Korea Institute of Energy Technology Evaluation and Planning (KETEP), granted financial resource from the Ministry of Trade, Industry & Energy, Republic of Korea (No. 20194010000070).

Institutional Review Board Statement

Not applicable.

Informed Consent Statement

Not applicable.

Conflicts of Interest

The authors declare no conflict of interest.

Nomenclature

ACHAir change per hour
DHydraulic diameter [m]
LbodyThermal load on the body
LductDuct Length [m]
MMetabolic rate
MRTMean radiant temperature
PdropPressure drop [Pa]
PMVPredicted mean vote
TTemperature [°C]
WWRWindow to wall ratio [%]
fFriction factor
ρDensity of mass [kg/m3]
vVelocity [m/s]
Subscripts
aAir
mrtMean radiant temperature
oOperative temperature
Acronym
ASHRAEAmerican society of heating, refrigerating, and air conditioning engineering
BAUBusiness as usual
DVDecentralized ventilation
ENVExtended natural ventilation
EPBDEnergy performance of building directive
GHGGreenhouse gas
HRVHeat recovery ventilator
HVACHeating, ventilation, and air conditioning
IAQIndoor air quality
IoTInternet of things
PERRenewable primary energy demand
PHIPassive house institute
POEPost occupant evaluation
RPDVRadiant panel distributed ventilation
TMYTypical meteorological year

References

  1. Kafle, S.; Parajuli, R.; Bhattarai, S.; Euh, S.H.; Kim, D.H. A review on energy systems and GHG emissions reduction plan and policy of the Republic of Korea: Past, present, and future. Renew. Sustain. Energy Rev. 2017, 73, 1123–1130. [Google Scholar] [CrossRef]
  2. EPBD. Directive 2002/91/EC of the European Parliament and the Council, 16th December 2002, Concerning the Energy Efficiency of the Buildings. Available online: https://hoxe.vigo.org/pdf/valedorcidadan/AO_7ENG.pdf (accessed on 23 January 2022).
  3. Figueiredo, A.; Figueira, J.; Vicente, R.; Maio, R. Thermal comfort and energy performance: Sensitivity analysis to apply the Passive House concept to the Portuguese climate. Build. Environ. 2016, 103, 276–288. [Google Scholar] [CrossRef]
  4. Feist, W.; Schnieders, J.; Dorer, V.; Hass, A. Re-inventing air heating: Convenient and comfortable within the frame of the Passive House concept. Energy Build. 2005, 37, 1186–1203. [Google Scholar] [CrossRef]
  5. Passive House Requirements, Passivhaus Institut (PHI), (Retrieved 11 December 2017). Available online: https://passiv.de/en/02_informations/02_passive-house-requirements/02_passive-house-requirements.htm (accessed on 23 January 2022).
  6. Schnieders, J.; Hermelink, A. CEPHEUS result: Measurements and occupants satisfaction provide evidence for Passive Houses being an option for sustainable building. Energy Policy 2006, 34, 151–171. [Google Scholar] [CrossRef]
  7. Tsutsumi, H.; Tanabe, S.; Harigaya, J.; Iguchi, Y.; Nakamura, G. Effect of humidity on human comfort and productivity after step changes from warm and humid environment. Build. Environ. 2007, 42, 4034–4042. [Google Scholar] [CrossRef]
  8. Tang, S.; Zhi, C.; Fan, Y.; Ye, W.; Su, X.; Zhang, X. Unhealthy indoor humidity levels associated with ventilation rate regulations for high-performance buildings in China. Build. Environ. 2020, 177, 106839. [Google Scholar] [CrossRef]
  9. de Dear, R.; Brager, G.S. Thermal comfort in naturally ventilated buildings: Revisions to ASHRAE Standard 55. Energy Build. 2002, 34, 549–561. [Google Scholar] [CrossRef] [Green Version]
  10. Lee, S.-W.; Leigh, S.-B.; Kim, T.; Cheong, C.H.; Cho, S. Cooling energy reduction effect of parallel double-window system operation in residential buildings in South Korea. Indoor Built Environ. 2019, 28, 636–658. [Google Scholar] [CrossRef]
  11. Doctor-Pingel, M.; Vardhan, V.; Manu, S.; Brager, G.; Rawal, R. A study of indoor thermal parameters for naturally ventilated occupied buildings in the warm-humid climate of southern India. Build. Environ. 2019, 151, 1–14. [Google Scholar] [CrossRef]
  12. Hesaraki, A.; Myhren, J.A.; Holmberg, S. Influence of different ventilation levels on indoor air quality and energy savings: A case study of a single-family house. Sustain. Cities Soc. 2015, 19, 165–172. [Google Scholar] [CrossRef]
  13. Schulze, T.; Eicker, U. Controlled natural ventilation for energy efficient buildings. Energy Build. 2013, 56, 221–232. [Google Scholar] [CrossRef]
  14. Goyal, S.; Barooah, P.; Middelkoop, T. Experimental study of occupancy-based control of HVAC zones. Appl. Energy 2015, 140, 75–84. [Google Scholar] [CrossRef]
  15. Nguyen, D.H.; Funabashi, T. Decentralized Control Design for User Comfort and Energy Saving in Multi-zone Buildings. Energy Procedia 2019, 156, 172–176. [Google Scholar] [CrossRef]
  16. Kim, M.K.; Baldini, L. Energy analysis of a decentralized ventilation system compared with centralized ventilation systems in European climates: Based on review of analyses. Energy Build. 2015, 111, 424–433. [Google Scholar] [CrossRef]
  17. Silva, M.F.; Maas, S.; de Souza, H.A.; Gomes, A.P. Post-occupancy evaluation of residential buildings in Luxembourg with centralized and decentralized ventilation systems, focusing on indoor air quality (IAQ). Assessment by questionnaires and physical measurements. Energy Build. 2017, 148, 119–127. [Google Scholar] [CrossRef]
  18. Salcido, J.C.; Raheem, A.A.; Issa, R.R. From simulation to monitoring: Evaluating the potential of mixed-mode ventilation (MMV) systems for integrating natural ventilation in office buildings through a comprehensive literature review. Energy Build. 2016, 127, 1008–1018. [Google Scholar] [CrossRef]
  19. ANSI/ASHRAE Standard 55; Thermal Environmental Conditions for Human Occupancy. American Society Heating, Refrigerating, and Air Conditioning Engineering: Peachtree Corners, GA, USA, 2017.
  20. Zhai, Y.; Zhang, H.; Zhang, Y.; Pasut, W.; Arens, E.; Meng, Q. Comfort under personally controlled air movement in warm and humid environments. Build. Environ. 2013, 65, 109–117. [Google Scholar] [CrossRef] [Green Version]
  21. Yang, B.; Schiavon, S.; Sekhar, C.; Cheong, D.; Tham, K.W.; Nazaroff, W.W. Cooling efficiency of a brushless direct current stand fan. Build. Environ. 2015, 85, 196–204. [Google Scholar] [CrossRef] [Green Version]
  22. Ashoori, M.; Sheikhzadeh, G.; Sadripour, S. The effects of using ceiling fans on human thermal comfort in a three-dimensional room with centralized heating including an occupant. Int. J. Numer. Methods Heat Fluid Flow 2019, 29, 3976–3993. [Google Scholar] [CrossRef]
  23. Arens, E.; Turner, S.; Zhang, H.; Paliaga, G. Moving Air for Comfort; UC Berkeley: Berkeley, CA, USA, 2009. [Google Scholar]
  24. Schmidt, K.; Patterson, D.J. Performance results for a high efficiency tropical ceiling fan and comparisons with conventional fans: Demand side management via small appliance efficiency. Renew. Energy 2001, 22, 169–176. [Google Scholar] [CrossRef]
  25. Ochiai, T.; Oda, S.; Sakai, M.; Ishiguro, S. Thin Ceiling Circulator to Enhance Thermal Comfort and Cabin Space; WCX SAE World Congress Experience: Detroit, MI, USA, 2019. [Google Scholar] [CrossRef]
  26. KS B 6879. Heat Recovery Ventilators. 2020. Available online: https://www.standard.go.kr (accessed on 23 January 2022).
  27. Li, S.; Liu, L.; Peng, C. A Review of Performance-Oriented Architectural Design and Optimization in the Context of Sustainability: Dividends and Challenges. Sustainability 2020, 12, 1427. [Google Scholar] [CrossRef] [Green Version]
  28. Building Energy Code, Ministry of Land, Infrastructure and Transport. 2021. Available online: https://law.go.kr/LSW/eng/engLsSc.do?menuId=2&query=#liBgcolor11 (accessed on 23 January 2022).
  29. ASHRAE Fundamental, C. 21 Duct Design; American Society of Heating, Refrigerating, and Air conditioning Engineering: Peachtree Corners, GA, USA, 2017. [Google Scholar]
  30. Ahmed, K.; Akhondzada, A.; Kurnitski, J.; Olesen, B. Occupancy schedules for energy simulation in new prEN16798-1 and ISO/FDIS 17772-1 standards. Sustain. Cities Soc. 2017, 35, 134–144. [Google Scholar] [CrossRef] [Green Version]
  31. prEN16798-1; Energy Performance of Buildings—Part 1: Indoor Environmental Input Parameters for Design and Assessment of Energy Performance of Buildings Addressing Indoor Air Quality, Thermal Environment, Lighting and Acoustics—Module M1-6. 2016. Available online: https://global.ihs.com/doc_detail.cfm?document_name=PREN%2016798%2D1&item_s_key=00651620 (accessed on 23 January 2022).
  32. ISO 17772-1; Energy Performance of Buildings—Indoor Environmental Quality—Part 1: Indoor Environmental Input Parameters for the Design and Assessment of Energy Performance of Buildings. 2017. Available online: https://www.iso.org/standard/60498.html (accessed on 23 January 2022).
  33. Woo, D.-O.; Junghans, L. Framework for model predictive control (MPC)-based surface condensation prevention for thermo-active building systems (TABS). Energy Build. 2020, 215, 109898. [Google Scholar] [CrossRef]
Figure 1. Concept diagram of proposed ventilation strategy.
Energies 15 01960 g001
Figure 2. Conventional (Top) and proposed (Bottom) natural ventilation algorithms.
Energies 15 01960 g002
Figure 3. Annual temperature and relative humidity in Seoul, Korea.
Energies 15 01960 g003
Figure 4. Typical floor plan for multi-story apartment in Korea.
Energies 15 01960 g004
Figure 5. (a) Occupancy schedule for conventional HVAC system. (b) Occupancy schedule for decentralized ventilation.
Energies 15 01960 g005
Figure 6. Site energy demand according to each strategy.
Energies 15 01960 g006
Figure 7. (a) Energy pattern comparison of Case 1 with Case 2. (b) Energy pattern comparison of Case 1 with Case 3. (c) Energy pattern comparison of Case 1 with Case 4.
Energies 15 01960 g007
Figure 8. Primary energy demand of each case.
Energies 15 01960 g008
Figure 9. CO2 emission of each case.
Energies 15 01960 g009
Figure 10. (a) The room air temperature comparison in a sample week of Case 1 with Case 2 (Bedroom 01). (b) The room air temperature comparison in a sample week of Case 1 with Case 3 (Bedroom 01). (c) The room air temperature comparison in a sample week of Case 1 with Case 4 (Bedroom 01).
Energies 15 01960 g010aEnergies 15 01960 g010b
Figure 11. Acceptable operative temperature 6(To) ranges for naturally conditioned spaces.
Energies 15 01960 g011
Figure 12. (a) Acceptability limits (80%) of operative temperature for naturally conditioned space in Case 1 (basic ventilation). (b) Acceptable hour (80%) of a year in case 4 (proposed solution).
Energies 15 01960 g012
Figure 13. ASHRAE thermal sensation scale.
Energies 15 01960 g013
Figure 14. PMV variation by each case.
Energies 15 01960 g014
Table 1. Fan power and air speed at each setting.
LevelPower [W]Mean Air Speed [m/s]
01 *0.05
120.44
230.57
340.69
471.27
591.39
6111.59
* Plug load.
Table 2. Minimum standard of heat recovery ventilator based on KS B 6879.
Ventilation VolumeHeat Recovery RateEnergy Coefficient
CoolingHeatingCoolingHeating
StandardOver 90%Over 45%Over 70%Over 8.0Over 15.0
Table 3. Input variable for energy simulation based on Korean building code of multi-stories apartment.
Number of FloorsGross Area
[m2]
Total Height
[m]
Volume
[m3]
WWR
[%]
U-Value
[W/m2K]
ACHNum of Occupants
SNEWRoofWallFloorWin
2059545616,6716010000.150.170.171.000.3240
Table 4. Designed duct length of each room from air handling unit.
Bedroom 1Bedroom 2Bedroom 3KitchenLiving Room
Length (m)11.04.59.47.06.5
Table 5. Simulation cases description.
Operation Scenario Case 1Case 2Case 3Case 4
Name of caseBaseline caseExtended natural ventilation caseDecentralized ventilation caseProposed solution case
DescriptionBasic ventilation strategyExtending natural ventilation period with increasing air velocity using ceiling fanDecentralized control for ventilation based on occupancy demandCombined two strategies (Case 2 and Case 3)
Ventilation typeCentralizedCentralizedDecentralizedDecentralized
Control type2-position ControlFloating Control2-position ControlFloating Control
Table 6. Primary energy factor depending on energy source based on Building Energy Efficiency Certification.
Energy SourcePrimary Energy Factor
Fuel1.1
Electricity2.75
District heating system0.728
District cooling system0.937
Table 7. Energy source accountability to produce electricity in Korea.
Energy SourceRation of Total Energy Production
Coal42%
Liquefied Natural Gas (LNG)27%
Nuclear23%
Renewable6%
Oil1%
Etc.1%
Table 8. A value for calculating operative temperature at more than 0.2 m/s air velocity.
va
(Average Air Speed)
<0.2 m/s0.2–0.6 m/s0.6–1.0 m/s
A0.50.60.7
Publisher’s Note: MDPI stays neutral with regard to jurisdictional claims in published maps and institutional affiliations.

