1. Introduction
1.1. Background
Currently, widespread usage of fossil fuels results in energy shortages, climate system degradation, and global warming, all of which pose a threat to the earth’s biosphere [
1]. Since the development of some Chinese oilfields has progressed to the point of high water cut, oilfield energy consumption has increased, resulting in a huge quantity of carbon emissions [
2]. It is critical to improve the existing oilfield process, reduce carbon emissions, and improve economic benefits and energy utilization to achieve the goal of carbon peak and carbon neutralization [
3] (i.e., strive to achieve the peak of domestic carbon dioxide emissions by 2030 and achieve carbon neutrality by 2060 [
4]).
Wind energy is gaining popularity as a result of its clean, carbon-free, and long-term characteristics [
1]. Wind energy resources are abundant in China, with huge and consistent wind speeds ranging from 300 to 500 W/m
2 [
5]. They are mostly spread in the three northeastern provinces, Xinjiang, and other fairly vast areas. Wind energy deployment on a wide scale, however, is hampered by supply unpredictability and poor utilization. Because wind is intrinsically variable, it is not appropriate for grid power delivery, resulting in energy waste, as the stringent operating regulations of electricity markets have a big impact on wind turbines. Wind energy storage is a viable option for improving energy supply stability. Traditional battery energy storage has a poor storage density and a high cost of ownership, making it unsuitable for large-scale power storage in oilfields. Since the last century, hydrogen energy has been proposed by some experts and scholars at home and abroad as a medium for energy storage. Aziz. M [
6] and A.T. Wijayanta [
7] et al. proposed a new hydrogen energy storage method by combining hydrogen energy with NH
3. Converting renewable energy to hydrogen storage is an efficient and clean energy storage means, and developing hydrogen production from renewable energy is an ideal way to convert wind energy into electricity and store it on a large scale [
8].
Hydrogen is an excellent energy storage medium due to its low toxicity and high density. The hydrogen fuel cell technology used in vehicles produces no pollutants or carbon dioxide, contributing to the mitigation of global energy scarcity and climate change [
9]. At present, the major technical techniques for hydrogen preparation are thermochemical hydrogen synthesis and water electrolysis hydrogen generation [
10]. Two of the most prevalent thermochemical hydrogen generation technologies are hydrogen synthesis from fossil fuels and hydrogen production from chemical raw ingredients [
11]. Due to the high carbon emissions associated with hydrogen generation using fossil fuels, this research focuses only on hydrogen production using renewable energy electrolytic water.
The transformation and optimization of energy systems for high water cut oilfields is currently receiving a lot of attention. According to the foregoing study, there is an urgent need for innovative energy systems suitable for high energy consumption oilfields in the course of oilfield development and aging. To reduce carbon emissions, it must produce enough electricity for the central processing facility and make full use of renewable energy. Motivated by this aim, we offer a novel oilfield energy system with wind hydrogen connection and attempt to tackle the three questions below:
- (1)
How can renewable energy be combined with oilfield energy systems to provide a new set of viable, safe, and low-carbon oilfield distributed energy systems?
- (2)
How can we fully utilize and store renewable energy, enhance the energy efficiency, and provide adequate and steady energy for oilfields?
- (3)
How can we establish an economic evaluation method suitable for most oilfield energy systems and verify the economic and environmental benefits of the system described in this paper?
1.2. Related Works
At present, China’s oilfield development has fallen into the stage of excessive energy consumption and reduced economic benefits. Renewable energy, as a sustainable energy source that is different from fossil energy, can largely solve the problems of oilfield development at this stage due to its cleanness and renewability. The use of renewable energy in combination with the oilfield energy system is the main direction of the next stage. However, in the development and utilization of renewable energy, how to rationally use renewable energy is a big problem. Experts and scholars at home and abroad have also carried out extensive research on this problem. For example, Li, Xu et al. [
9] based their research on the associated geothermal energy in the oilfield and proposed a poly-generation energy system driven by the associated geothermal water during the high water cut period of the oilfield. It solves the problem of high energy consumption in high water cut oilfields. Wang, Yuan et al. [
10] proposed a risk–opportunity assessment management framework based on existing assets, data, technology, and geothermal energy obtained from oil wells, and optimized the utilization of geothermal energy in different oilfields in practice. Li, Liu et al. [
12,
13] studied the utilization of geothermal energy in high water cut oilfields, developed a multi-power generation energy system driven by the relevant mixture of petroleum and geothermal water, evaluated the technical and economic performance, and used geothermal energy to solve the problem of high energy consumption of high water cut oilfields. In addition to geothermal energy being applied to oilfield systems, other forms of renewable energy have also been developed. For example, Spielman, Brey et al. [
14] proposed a sustainable offshore wind farm energy system based on the abundant wind energy resources in offshore oil and gas fields. It fills the blank of the energy system for offshore oil and gas field development. Zou, Qiu et al. [
15] proposed adding hydrogen energy as storage energy based on the sustainable development plan of offshore oil and gas fields, realizing the efficient utilization and storage of renewable energy.
Although there are many kinds of energy systems proposed by domestic and foreign experts and scholars, given the current situation of high energy consumption, high water content, and low income in the development of oilfields in China, there is a need for a system that can not only realize large-scale energy storage but also meet the needs of various oilfield energy sources. Oilfield energy systems that consume high amounts of energy demand renewable solutions. At present, the means of storing renewable energy mainly include electricity storage and thermal storage. For example, Huang, Gu et al. [
16] took Daqing and Shengli oilfields as examples to comprehensively evaluate oil and gas resources, and converted part of the fossil energy in the oilfields into electricity for storage, solving the problem of energy storage. The excessive consumption problem was addressed by Hu Sun et al. [
17], who proposed an energy system for coal mines that converts coal energy into electrical energy storage. F. Monfaredi et al. [
18] developed a hybrid power and natural gas coupled energy system, converting natural gas into electrical energy storage and applying it in oilfields. Amir et al. proposed a thermoelectric generator energy system for recycling waste energy, which converts waste energy into thermal energy for storage and utilization. Huang, Yu et al. [
19] proposed a two-stage energy management system of thermoelectric integration, which can store electrical energy and thermal energy at the same time and convert the two forms of energy into each other. However, thermal storage cannot meet the various forms of energy demand in oilfields, the electric storage model cannot store energy on a large scale, and livestock batteries are expensive to manufacture. Therefore, some experts and scholars have proposed hydrogen energy storage as a new energy storage method. For example, L. Bartolucci et al. [
20] proposed an energy system based on hydrogen, which uses hydrogen as storage energy for the energy consumption of residential buildings. Dong Wu et al. [
21] proposed a hydrogen-based energy integration system combining hydrogen and water storage. Using hydrogen as storage energy can effectively improve storage efficiency. At the same time, it can also realize the mutual conversion of hydrogen energy and other forms of energy through fuel cells and other methods. Under the dual-carbon goal, hydrogen energy, as a clean energy source, can effectively reduce carbon emissions and promote carbon neutrality. Therefore, drawing on this energy system that uses hydrogen as a renewable energy storage method and introducing it into oilfields, this paper proposes a new wind–hydrogen coupled oilfield energy system and conducts economic and reliability analysis.
The system’s primary flow is depicted in
Figure 1. The related gas and crude oil generated by the oilfield can be used to provide heat and electricity for the oilfield system. Simultaneously, when utilized in conjunction with a wind turbine, it can provide electric energy for the oilfield, with the power grid serving as a backup system for the oilfield system. Simultaneously, wind energy’s residual electricity is utilized to produce hydrogen, which is used to store energy and can also be used to power the central processing facility via a fuel cell or combustion [
22,
23]. This system has three major advantages.
- (1)
The system combines renewable energy with gas turbine power generation to meet the electricity and heat requirements of the oilfields while assisting to achieve economic benefits and dual-carbon targets.
- (2)
The system considers converting electric energy to hydrogen, which eliminates the instabilities associated with wind power generation and the original system’s high battery cost, as well as makes energy storage and peak shaving more feasible.
- (3)
The Energy Internet is established to improve system resilience and avoid production and operation problems caused by energy shortages since the new fuel cell and hydrogen storage tank can be used in place of the battery, and the stored hydrogen can be sold to increase the economic benefits.
1.3. Paper Organization
The structure for the remainder of this paper is organized as follows.
Section 2 presents the hybrid energy system that utilizes the wind farm’s electric power to electrolyze water to produce hydrogen, which is then stored in a hydrogen storage tank. The oilfield’s associated gas is burned to generate heat energy for the oilfield’s system. In
Section 3, the mathematical model of the system is given. In
Section 4, a detailed description of the examples and the results are provided.
Section 5 gives the conclusions of the complete manuscript.
2. Problem Statement
As an oilfield enters the middle and late stages of development, its energy consumption increases with the decline of production and the increase of water content. The classic oilfield distributed energy system relies heavily on gas turbines and boilers to provide electricity and heat energy. However, the system has poor energy efficiency and produces significant amounts of carbon dioxide. Therefore, this study presents and compares five novel energy systems based on improved distributed energy systems, as shown in
Table 1. Specifically, scenario one is a standard distributed energy system that is powered by a gas turbine and a crude oil heater. On this basis, wind turbines are erected in scenario two, and the generated electric energy is immediately linked to the grid to provide electricity for the oilfield. In scenario three, the wind energy is not connected to the power grid but is directly connected to the storage battery with peak shaving and valley filling function to meet the electricity demand of the oilfield. Compared to scenario two, scenario three avoids the grid connection of renewable energy, which can reduce the pressure on the power grid system and eliminate other adverse effects. In scenario four, hydrogen generation from residual power is an indirect energy storage method, and it can be powered by fuel cells in case of need, which may bring greater economic benefits. Based on scenario four, scenario five uses crude oil instead of natural gas to provide heat energy for the oilfield joint station. These five schemes cover a variety of practical and feasible hydrogen storage and electricity storage situations and are of practical significance.
The energy flow of the five scenarios is introduced as follows:
- (1)
As the original power supply system of the oilfield, only the electricity purchased from the grid can meet the electricity demand of the oilfield. This scenario is used as a control group to compare the economics of the other four schemes.
Figure 2 shows the energy system framework of scenario one;
- (2)
In the case of grid power supply, wind turbines can be used to provide electricity demand for oilfields. However, it is worth noting that wind power generation is unstable and the grid needs to be used as a backup solution. This solution can compare the economics and feasibility of directly using renewable energy as a means of power supply.
Figure 3 shows the energy system framework of scenario two;
- (3)
When wind turbines are used to provide energy consumption for oilfields, the remaining electricity is used for hydrogen production. The obtained hydrogen can be stored in a hydrogen storage tank. During the peak period of electricity consumption, fuel cell combustion is used to generate electricity to achieve the purpose of energy storage and peak shaving. The program introduces hydrogen based on renewable energy power generation to explore the possibility of hydrogen used in oilfield energy systems.
Figure 4 shows the energy system framework of scenario three;
- (4)
In scenario four, the gas turbine also burns associated gas from the oilfield to generate electricity to meet part of the power demand of the oilfield system. At the same time, the electricity generated by the wind turbines is used in two parts: the first part is used for part of the power needs of the oilfield system, and the second part is used to supply the electrolyzer, which electrolyzes water to produce hydrogen. The produced hydrogen will be stored in a high-pressure liquid hydrogen storage tank. When the power supply of other systems in the oilfield is insufficient, the hydrogen in the output tank will be converted into hydrogen energy and electric energy through a hydrogen fuel cell, thereby reaching the hydrogen energy level.
Secondly, the heat energy consumption of the oilfield comes from the high-temperature steam generated by the gas turbine, and the high-temperature steam generates heat through the heat exchanger (boiler, etc.) to provide heat consumption for the oilfield.
Figure 5 shows the energy system framework for scenario four;
- (5)
Scenario five (
Figure 6) and scenario four are control groups, and the energy system of the oilfield is the same, but considering the non-environmental nature of the crude oil heating furnace, we replaced it with a more environmentally friendly hydrogen combustion furnace as the heating equipment in the oilfield. At the same time, all the hydrogen produced in this scenario is only used for combustion to provide heat for the oilfield, not for electricity generation.
The source of heat energy is not only the high-temperature gas produced by the gas turbine but also the high-quality heat energy provided directly by natural gas combustion. However, because the heat energy consumed to heat crude oil or household heat is insignificant in an oilfield system, the heat generated by traditional gas turbines and heat exchangers is sufficient to compensate for the oilfield’s heat loss.
Apart from being a green, clean, and carbon-free renewable energy source, hydrogen may also help save energy, which is a significant advantage of the hybrid energy system. Hydrogen can be transferred as a gas via pipelines or as a liquid via oil tankers, as well as stored in hydrogen tanks. In terms of peak control, wind energy is favored to supply power to the oilfield system in the event of excess wind energy. The residual energy can be transformed to hydrogen in the electrolyzer via an electrochemical reaction. The hydrogen produced can be retained in the hydrogen storage tank in case of an emergency, or it can be sold commercially via other means such as pipelines. On the other hand, if wind energy is insufficient to power the oilfield, hydrogen in the hydrogen storage tank will be used, as would the proton exchange membrane fuel cell, and hydrogen will be used to generate electricity to meet the oilfield’s power needs.
To determine the system’s practicality, the following work is required:
- (1)
Existing data indicate that energy, heat energy, economic benefits, and carbon emissions can be reduced;
- (2)
A comprehensive evaluation model of the hybrid energy system’s technology and economics is established, including the quantification of the project’s net present value and investment recovery period;
- (3)
A sensitivity analysis was conducted to determine the effect of variables such as hydrogen, power price, and wind speed on the economic performance of all energy systems.
3. Methodology
This section introduces each component of the system to evaluate its technical and economic performance.
Section 3.1 discusses the operation costs, as well as the technical details of electricity and hydrogen production technology.
Section 3.2 describes the design and operation costs, as well as the technical details of the gas turbine heating and power supply system. Finally,
Section 3.3 proposes a method for computing the NPV and LCOE of the entire energy system based on its composition.
3.1. Electricity and Hydrogen Production Technology
3.1.1. Wind Turbine
The mechanical system, the electrical system, the control system, and the auxiliary system all comprise the wind turbine system. Wind turbines are usually divided according to their spin orientation into horizontal axis and vertical axis wind turbines. Wind energy generation is a technique that converts the kinetic energy of the wind to mechanical energy, which is subsequently turned into electric energy. Wind energy is generated by utilizing the wind to drive the blades of a windmill to rotate, and then increasing the speed of the blades via a speed-boosting mechanism to encourage the generator to create electricity. To generate power, windmill technology requires a wind speed (degree of breeze) of around three meters per second [
24]. In this paper, wind turbines are mainly used in scenarios 2, 3, 4, and 5 to convert the wind resources of the oilfield into electrical energy. The formula for calculating the annual wind energy of the oilfield and the cost of wind turbines is as follows.
- (1)
Annual electricity production (AEP)
Wind resources are seasonal and unevenly distributed, which adds complexity to the computation. Wind speed, on the other hand, follows a specific random distribution law. According to statistical analysis, the probability density of the wind speed distribution (wind profile distribution) can be defined by the Weibull distribution function, which provides a general mathematical description for the wind speed distribution [
25]:
where,
c is the proportional parameter (M/s);
k is the shape parameter;
v is the wind speed.
Weibull parameters
k and
c can be calculated according to the mean and variance of local wind speed.
In this way, the theoretical power of wind power generation can be obtained. Then, the correction coefficient CP is introduced. The maximum theoretical power of the turbine is:
where,
is the air density;
A is the swept area of the blade;
v is the wind speed;
CP is the limit of Betz (59.3%).
The annual power generation (
AEP) is calculated by combining the product of the wind profile described by function with the power curve of the selected turbine [
26]:
where,
μ is the total generation loss.
- (2)
Cost of wind turbines
Among various cost models, the cost model developed by NREL is a detailed wind turbine cost model widely used in the research community [
27]. The total wind turbine cost in the NREL wind turbine cost model is:
where,
Cost is the total cost of the wind turbine;
ICC is the initial capital cost of the wind turbine;
FCR is the fixed charge rate;
AOC is the annual operating cost of the wind turbine.
It should be clear that the wind turbine cost calculated here is the average cost over the designed wind turbine’s life.
where,
ICC is the sum of the balance of wind turbine system cost and plant cost; the wind turbine system is a complex system, including multiple subsystems, including mechanical (
), electrical (
) and electronic control systems (
) and some auxiliary systems (
), as well as the cost of infrastructures, such as foundation, road, license, electrical connection, installation, and transportation [
28].
The initial capital cost of the steam turbine is shown in
Table 2. The cost of each component or infrastructure is a function of turbine rotor radius, turbine power rating, and hub height.
The annual operation cost (AOE) of a steam turbine includes land lease fee (
), (USD); leveling operation and maintenance fee (
) and leveling and resetting fee (
), (USD). These costs are incurred when the rated power of the turbine or the annual energy of the turbine is constant. See
Table 3 for details of each cost.
It is worth noting that the original capital cost is divided into five components: the mechanical system, the electrical system, the control system, the auxiliary system, and the infrastructures, as shown in
Table 2. Here, is symbolized the rotor radius, (m), the wind turbine’s rated power, (kW), and the hub height, (m). It is discovered that the cost model for each component of the subsystem is characterized as a function of the wind turbine’s rotor radius, rated power, and hub height. This implies that altering any physical parameter has an effect on the system’s cost, and the effect can be quantified. The yearly running costs are shown in
Table 4, including the Levelized replacement cost, the land leasing cost, and the Levelized operations and maintenance cost.
Table 4 also reflects the wind turbine’s yearly energy output, which can be computed using Equation (4). Similarly, the cost model is expressed as a function of the rotor radius of the turbine and its yearly energy output. The overall cost of the wind turbine may be determined by multiplying the original capital cost by the yearly running cost.
3.1.2. Electrolytic Water Technology
The electrolytic water hydrogen production technique has a long history and can be classified into alkaline water electrolysis, proton exchange membrane water electrolysis, and solid oxide water electrolysis hydrogen production. Among them, the most established and commonly used technology is alkaline water electrolysis hydrogen generation [
29,
30].
Table 5 compares the three electrolytic water technologies. Electrolytic cells can be classified into three types based on their electrolytes: alkaline electrolytic cells (AE) [
31], proton exchange membrane (PEM) electrolytic cells [
32], and solid oxide (SOEC) electrolytic cells [
33]. The characteristics of several electrolytic cells are listed in
Table 6. The electrolyzer is used in scenarios four and five in the energy system, in which the surplus electricity generated by the wind turbine is used to supply the electrolyzer to electrolyze water to produce hydrogen, and the produced hydrogen is stored in the hydrogen storage tank for storage.
A typical water electrolysis hydrogen generation process consists primarily of water electrolytic cells, a gas–liquid separator, a gas scrubber, an electrolyte circulation pump, an electrolyte filter, a pressure regulator, measuring and control equipment, and power supply equipment. The electrolytic cell is the central component that completes the hydrogen generation process by water electrolysis; the generated gas is then sent through a gas–liquid separator and a gas scrubber to achieve pure hydrogen. Hydrogen synthesis via hydro hydrolysis requires tight control of process parameters such as electrolytic current, voltage, and electrolyte density.
The alkaline electrolyzer technique is the most developed and least expensive. It is currently the most extensively used electrolyzer. It is well suited for large-scale hydrogen generation systems based on wind energy. At the moment, the solid oxide electrolyzer technology is in its infancy and has not been widely marketed. Due to its high current density, battery efficiency, hydrogen purity, high working pressure, and adaptability, the PEM electrolyzer has become the most widely used hydrogen generation technique via water electrolysis. However, the cost of a PEM electrolyzer is prohibitively high, and wind power variability reduces the electrolyzer’s service life [
34]. As a result, this work does not use a PEM electrolyzer but rather a more mature alkaline electrolyzer.
Alkaline electrolyzers operate at low temperatures (60–80 °C) and employ aqueous potassium hydroxide or sodium hydroxide solutions as electrolytes with a concentration of approximately 20–30% [
38]. The septum of alkaline electrolyzers is made of asbestos, while the electrodes are made of nickel materials. The created hydrogen is around 99 percent pure, alkaline electrolyte’s maximum operating current density is less than 400 mA/cm
2, and the power consumption for H
2 generation is approximately 4.5–5.5 k [
39].
The efficiency is approximately 60%. To estimate the cost of an electrolytic cell, we frequently utilize a cost per kilowatt-hour of hydrogen output based on a lower heating value (LHV). The cost of the electrolytic cell is calculated as a function of the hydrogen generation capacity and current density. The following equation provides an estimate of the cost of an electrolytic cell [
40]:
where, α and β all are coefficients, α = 0.79, β = −0.32;
is the cost of water electrolier, (USD);
hydrogen generation capacity, (m
3);
is rating current density, (A·m
3).
3.1.3. Hydrogen Storage Technology
There are numerous methods for storing hydrogen, which can be classified into physical and chemical hydrogen storage based on the storage principle. Physical hydrogen storage mostly consists of liquefaction, high-pressure storage, and low-temperature compression. Chemical hydrogen storage methods include metal hydride storage, activated carbon adsorption storage, carbon fiber and carbon nanotube storage, organic liquid hydride storage, and inorganic hydrogen storage, among others. Due to the technical constraints and current state of development, high-pressure hydrogen storage, liquefaction storage, and transportation, as well as metal hydride hydrogen storage, are the most suitable modes of hydrogen storage for oilfield energy storage.
Table 7 provides an overview of the various hydrogen storage modes.
Liquefied hydrogen storage is a rather mature form of hydrogen storage. At normal temperature and pressure, the density of liquid hydrogen is 845 times that of gaseous hydrogen, and the volume energy density is several times that of compressed storage [
42]. Compressing hydrogen and cooling it to temperatures below 21 k liquefies it into liquid hydrogen, which is then stored in a special insulated vacuum container. The term “high-pressure gaseous hydrogen storage” refers to the process of storing gaseous hydrogen at a pressure greater than the hydrogen’s critical temperature. At the moment, it is a frequently utilized method of hydrogen storage.
In general, the gas tank is employed as a container, which is convenient and straightforward. Its advantages include low energy consumption during storage, low cost (when the pressure is not too high), rapid charging and venting, the ability to release hydrogen at room temperature, and the ability to operate normally at temperatures tens of degrees below zero. Additionally, the hydrogen release can be managed via the pressure-reducing valve. Due to the advantages outlined above, high-pressure gaseous hydrogen storage has developed into a more mature hydrogen storage technology.
Metal hydride hydrogen storage is a novel type of hydrogen storage that stores and releases hydrogen using metal hydride hydrogen storage materials. It makes use of certain metals or alloys to absorb hydrogen in the form of metal hydride after interacting with hydrogen to create metal hydride. Following that, hydrogen is released. Metal hydride hydrogen storage tanks have a hydrogen storage density of 1000 times that of hydrogen in its standard state, which is comparable to or even greater than that of liquid hydrogen [
43]. They can be used not only to collect and store hydrogen but also to provide hydrogen to devices that require hydrogen. Metal hydride hydrogen storage tanks have a high hydrogen storage mass density ratio, a high hydrogen storage volume ratio (more than high-pressure compression and liquid hydrogen storage), a high level of safety, and a high level of hydrogen purity [
44]. In comparison to liquid hydrogen storage and gaseous high-pressure hydrogen storage, hydrogen in metal hydride is a safer fuel. However, this technology is still in its infancy and can be used exclusively in new cars and laboratory research.
High-pressure gaseous hydrogen storage is used in this system. The high-pressure gaseous hydrogen storage tank in this paper is used in conjunction with the electrolyzer and is applied in scenarios four and five. The capacity of the hydrogen storage tank is 5000 kg, and the two hydrogen storage tanks can store 10 t of hydrogen from the electrolyzer. The investment cost of a hydrogen storage tank generally depends on the volume of the hydrogen tank and the quality of stored hydrogen. At the same time, another part of the cost comes from the operation and maintenance cost of the storage tank:
where,
represents the cost of a hydrogen storage tank, (USD);
represents the weight of storage tank, (kg);
represents operation and maintenance cost, (USD);
is the unit capital and operation and maintenance cost of the tank, (USD/kg);
is constant,
.
3.1.4. Fuel Cell
Hydrogen produced by electrolysis of water is mixed with oxygen in the fuel cell, and the chemical energy of hydrogen and oxygen is converted into electrical energy under the action of a catalyst, and the reaction product is only water, realizing the conversion of energy. The fuel cell is mainly composed of motor, electrolyte diaphragm, and electrolyte, which is mainly divided into the high-temperature fuel cell and low-temperature fuel cell [
45]. Among them, the high-temperature fuel cell is divided into solid oxide type and molten carbonate type, and the low-temperature fuel cell is alkaline type proton exchange membrane type and carbonic acid type. Due to its high cost, the fuel cell used in this paper is only used as a hydrogen-to-electricity conversion tool in scenario four to convert hydrogen energy into more useful electricity to provide electricity for oilfields. The characteristic parameters of these five fuel cells are shown in
Table 8.
At present, an alkaline fuel cell has the fastest development, but it is mainly used in the field of aerospace. The phosphoric acid battery has been put into commercial use, but its efficiency is low. Solid oxide fuel cell has wide adaptability and high energy conversion efficiency, so solid oxide fuel cell is used as an electric hydrogen conversion tool in this system. The cost calculation of fuel cells is related to the cell capacity [
46]:
where,
is the cost of fuel cell, (USD);
is fuel cell capacity, (USD);
is the unit construction cost of the fuel cell, (USD/kWh);
is the operating cost of the fuel cell, (USD);
is fuel cell capacity, (kWh);
3.2. Gas Turbine Heating and Power Supply System
3.2.1. Gas Turbine
A compressor is the primary component of a gas turbine. The combustion chamber and gas turbine components of a gas turbine cycle are generally referred to as simple cycles [
47]. The majority of gas turbines operate on a basic cycle. Compressors function on the premise of sucking air from the external atmospheric environment, pressurizing it after multistage compression, and increasing the air temperature correspondingly. Compressed air is drawn into the combustion chamber and combined with the injected fuel to produce high-temperature, high-pressure gas. Following expansion, the high-temperature, high-pressure gas performs external work, completing the process of chemical energy conversion to electrical energy. As an important piece energy equipment in the traditional oilfield energy system, the gas turbine also plays an indispensable role in the energy system of this paper. Therefore, gas turbines are used in all scenarios, and the associated gas produced by burning oilfields provides energy for the combined station. Simultaneously, the waste heat gas is routed through a heat exchanger for heat exchange, and the resulting heat is sent to the central processing facility.
For the cost of gas turbine, we use the cost of gas turbine per unit power to estimate the cost of gas turbine:
where,
is represent a cost of a gas turbine, (USD);
is represents unit capital cost, (USD/kW);
is represent rated power, (kW);
is represents the efficiency of a gas turbine,
.
3.2.2. Heat Exchanger
A heat exchanger is a piece of energy-efficient equipment used to transfer heat between two or more fluids of varying temperatures. Heat exchangers, as important pieces of energy conversion equipment in traditional energy systems, are usually used in conjunction with gas turbines to receive high-temperature and high-pressure steam from gas turbines to store thermal energy through heat exchange media. They are used to transfer heat from a fluid with a higher temperature to a fluid with a lower temperature for the fluid temperature to reach the process-specified indications to fulfill process requirements. Simultaneously, a heat exchanger is a critical piece of equipment for optimizing energy utilization exchange because it is able to operate with a variety of media, operating circumstances, temperatures, and pressures. Additionally, the structural kinds and exchange types of heat exchangers vary, including interval heat exchangers, regenerative heat exchangers, and direct contact heat exchangers.
The shell and tube (also known as tubular) heat exchanger is employed in this arrangement, which is primarily formed of four components: the shells, the tube bundle, the tube plate, and the head. The shell is generally circular and contains a parallel tube bundle or spiral tube, with both ends of the tube bundle secured to the tube plate. In shell and tube heat exchangers, two types of fluids are used for heat exchange. One runs within the tube, and its stroke is referred to as tube side; the other flows externally to the tube. The heat exchanger’s cost estimate is identical to that of the gas turbine:
where, the unit power cost of the heat exchanger is 1235 USD/kW;
represents cost of a heat exchanger, (USD);
represents unit capital cost;
is represents rated power, (kW);
has represented the efficiency of a heat exchanger,
.
3.2.3. Oil Heating Furnace
The crude oil combustion furnace burns crude oil as fuel to generate heat energy. When the gas turbine cannot provide a heat supply for the combined station system, burning crude oil provides thermal energy for the combined station, which is applied in scenarios one, two, three and four in this paper. Its main structure includes a furnace shell, heat exchanger, flue pipe, flue, and combustion device. Cost calculation of crude oil combustion furnace is as follows:
where,
COHF is the investment cost of crude oil combustion furnace, (USD);
is the unit investment cost of crude oil combustion furnace, (USD/kW);
is the operation and maintenance crude oil combustion furnace, (USD);
is the operation and maintenance cost of crude oil combustion furnace;
is the unit operation and maintenance cost, (USD/kW);
is the power of combustion furnace, (kW).
3.2.4. Gas Burner
The gas combustion furnace burns combustible gas to generate high-temperature flue gas, and the high-temperature flue gas is discharged from the furnace and out of the furnace through the smoke exhaust system. Heat is exchanged in heat exchangers to provide thermal energy for oilfield energy systems. The whole system includes a heating furnace, heating system, smoke exhaust system, and cooling system. Since the combustion products of different combustible gases are also different, to compare the environmental impacts, especially the carbon emissions, of the combustion of associated gas (mainly combustion of CH
4) and hydrogen (H
2) in oilfields, this paper uses a gas-fired combustion furnace for comparison in scenario 5. The economic and environmental benefits of burning associated gas and hydrogen are compared. The cost of a gas burner is calculated as follows:
where,
is the investment cost of hydrogen heating furnace, (USD);
is the unit investment cost of hydrogen heating furnace, (USD/kW);
is the operation and maintenance cost of hydrogen heating furnace, (USD);
is the unit operation and maintenance cost, (USD/kW);
is the power of hydrogen heating furnace, (kW).
3.2.5. Battery
The energy storage battery used in the system is a lead-acid battery. The lead-acid battery has the following characteristics: it has a wide temperature range and can operate normally under a temperature environment of −30~60 °C. The low-temperature performance of the battery is good. It can be used even in areas with relatively low temperatures. The capacity consistency is good, and the consistency is maintained in the series and parallel use of the battery. In the unstable charging environment, it has stronger charging acceptance ability, long service life, reduces repair and maintenance costs, and reduces the overall investment of the system. The battery used in this paper can store 4500 kW of power from wind turbines and fuel cells, but it is only used in scenarios three and four due to its high cost.
where,
is the cost of battery, (USD);
is the unit capacity cost of battery, (USD/kWh);
is the battery capacity, (kWh);
is the maintenance operation cost of battery, (USD);
is the maintenance and operation cost per unit capacity of battery, (USD/kWh).
3.3. NPV and LCOE Model
After the introduction of equipment, it is necessary to evaluate the economic and environmental performance of the whole oilfield energy system. The system uses payback period, net present value (NPV) (an index indicating the difference between future cash inflow and cash flow), and the Levelized cost of energy (LCOE) (a more accurate horizontal power cost index for cost estimation) to describe the economic performance of the system. It should be noted that LCOH refers to the Levelized cost of hydrogen:
where,
represents the payback period, [a];
represents initial investment, (USD);
represents cash inflows, (USD);
represents net cash flow in year
, (USD);
represents the discount rate,
r = 0.12;
is MWh of electricity deposited on the grid in the year
;
is the mass of hydrogen produced in year
, (kg);
is the energy cost of the system, (USD/MWh);
is the total annual cost of hydrogen, (USD);
is unit hydrogen cost, (USD/kg);
is net income in year
;
is net expenditure in year
.
In addition to measuring the economic benefits of the system, it is also necessary to calculate the environmental benefits that the system can produce, which is measured by reducing carbon dioxide emissions when fossil fuels are replaced by hydrogen with equivalent calorific value:
where,
is the environmental benefit of the system, kg carbon dioxide;
and
are the low calorific value of hydrogen fuel and fossil fuel, respectively;
is the annual hydrogen output, kg;
is the emission coefficient of fossil fuels.
4. Results and Discussions
4.1. Input Parameters
Taking an oilfield central processing facility located in Northwest China as an example,
Figure 7 shows the specific location of the central processing facility. The central processing facility’s annual gas production is 1.1 × 10
7 m
3. According to statistics, China’s oilfield central processing facility production ranges from 0.56 × 10
7 m
3~2.8 × 10
8 m
3 [
20]. As previously stated, the system’s electric energy powers gas turbines and hydrogen synthesis utilizing renewable energy. In addition, the yearly electricity generation is split into two sections. The first is combustion-related gas power production using gas turbines. For example, a 50 MW gas turbine can create 420 GWh of electricity each day from combustion-related gases. Then, we need to figure out how much electricity the wind turbine generates every year. Considering that the central processing facility is situated in Northwest China, we collected wind speed data from the northwest wind tower between 1 January 2019 and 31 December 2019, as shown in
Figure 8 below.
4.1.1. Energy Demand
The power consumption of the central processing facility includes compressor, dehydration pump, electric dehydrator, export pump, sewage pump unit, and domestic power. The total annual power demand of the central processing facility in 2019 was 238 GWh, and the proportion of electric energy consumption of each system is shown in
Figure 9a. The thermal energy consumption includes crude oil heating and dehydration, crude oil export, and domestic heat. In 2019, the total thermal demand of the central processing facility was 776 GWh, and the proportion of heat energy consumption of each system is shown in
Figure 9b.
4.1.2. Technical and Cost Information on Equipment
In this case study, since there is no economic and technical information on the facilities recommended by the market or the government, the project parameters are estimated based on field surveys, industry statistics, and academic literature, as shown in
Table 9. Specifically, the lifetime and the linear capacity-dependent cost and O&M cost are collected from HOMER Pro’s website. The expenditure of each scheme is calculated in turn according to the formula mentioned above through the collected data, and the income mainly comes from the cost of energy produced by the system.
4.2. Economic Performance of Five Scenarios
The NPV of the five scenarios is positive, indicating that they are economically feasible and can yield advantages over the system’s 20-year life, as shown in
Figure 10. It is worth mentioning that the NPV for the five scenarios varies according to the equipment utilized in each scenario and the corresponding basic investment cost. We address solely the power supply in this section. To begin, consider scenario one, with the lowest profit margin, only gas turbines, and the power infrastructures employed to generate electricity. In this scenario, the gas turbine is unable to meet the central processing facility’s power consumption, and thus power must be purchased from the power grid. Although scenario one requires less equipment and lower initial investment, the income generated by scenario one is low due to the expense of power grid power purchase. In contrast, the profit of scenario three with the highest profit is USD 46.21 million during its service life.
Since the design principles are the same, the advantages of the five scenarios are comparable when the central processing facility’s scale is known. We find that the economics of the five scenarios are mostly determined by annual spending and equipment operation and maintenance costs. Scenario three, which employs wind turbines and gas turbines for power generation, eliminates the requirement for the central processing facility to purchase electricity from the power grid, significantly decreasing the annual cost of power in comparison to the traditional technology. Second, unlike scenarios four and five, scenario three delivers the entire amount of electricity created by the wind turbine generator to the battery. Due to the elimination of the electrolytic cell, hydrogen storage tank, fuel cell, and other equipment in scenario three, the basic investment cost is relatively low, resulting in the highest net present value. Scenarios four and five have hydrogen production and energy conversion equipment with extremely high investment and operating costs, thus the net present value is slightly less than in scenario three. However, hydrogen has the potential to store energy on a large scale, and is more capable of shaving peaks and filling valleys than batteries.
The terms LCOE and LCOH are developed to facilitate the analysis of the unit cost of oilfield system capacity. As shown in
Figure 11, the chart depicts the unit capacity costs for five different situations. In scenarios four and five, where hydrogen and wind energy are combined, LCOH is used to calculate the cost of hydrogen produced per unit mass by the system. As can be seen, the system’s unit capacity cost is positively correlated with its net present value. Scenario four has the lowest unit capacity cost, and the cost of producing hydrogen per kilogram is USD 7.23, whereas it is USD 6.20 in scenario five. The reason for this is that scenario four employs large-capacity energy storage batteries to store hydrogen energy. Due to the exponential growth in the cost of energy storage batteries as capacity increases, the unit hydrogen production cost in scenario four is high.
4.3. Analysis of Associated Gas Production
The generation of associated gas in the oilfield has a direct effect on the heat and power generated by gas turbines, which is a critical link in the oilfield’s operation. Due to the central processing facility’s reliance on gas turbines, it is a significant component impacting system economics. Therefore, sensitivity analysis of natural gas production to system economic cost is carried out in this section.
As shown in
Figure 12, the chart illustrates the NPV performance of five scenarios in which the oil and gas field’s associated gas production ranges between 0.5 × 10
7 m
3 and 1.0 × 10
7 m
3. As can be observed, the oilfield’s associated gas production has a bigger impact on scenarios one, two, and three, but has a lesser impact on scenarios four and five. Because the entire oilfield system is solely reliant on gas turbines and the power grid for power purchase in the first scenarios, the output of oilfield-associated gas has a significant impact on the system’s economy. When associated gas production falls below 1.0 × 10
7 m
3 the oilfield energy system that is solely based on the combustion and generation of associated gas can no longer provide economic benefits to the oilfield, indicating that the investment cost of the entire system, including the cost of power purchased from the power grid, is significantly greater than the cost of the associated gas-produced power.
In addition to depending on gas turbines for power generation, scenarios three, four, and five combine wind and solar energy, resulting in a negligible impact on the net present value of scenarios three, four, and five. As the oilfield development progresses to the later stages, the annual output of the oilfield becomes more unstable, and the risk resistance of the system to associated gas production increases, which has a beneficial effect on the application of high water cut oilfields in the later stages of development, and which is also one of the contributions of the scenarios proposed in this study to engineering practice.
4.4. Analysis of Electricity Price
Due to the project’s sole income stream being the sale of electricity and hydrogen, it is vital to examine the influence of energy prices on the project’s NPV. Both scenarios one and two introduce the power grid as a backup energy source for the oilfield. Due to the oilfield’s lengthy water cut development phase, the energy consumption associated with oilfield development is considerable. Thus, in both scenarios one and two, electricity must be purchased from the power grid, and the cost of power purchase will climb in lockstep with the increase in the cost of electricity. The electric energy generated by the five energy systems is used to create money for the system. The influence of power prices ranging from USD 0.05 to 0.64 cents per kilowatt-hour is examined. As illustrated in the
Figure 13, when electricity prices increase from USD 0.05 to 0.64 per kilowatt-hour, the NPV of the five scenarios increases, and the increase in electricity price is linear with the increase in net present value, but the increased range of net present value is different. In scenario one, for every 0.01 cent increase in the price of electricity, the NPV of the system increases by USD 3560, while in scenarios three, four, and five, the NPV of the system increases, even more, reaching USD 2 million.
In addition, we explore the factors that contribute to the disparate growth rates. The first reason is that in scenarios one and two, power from the power grid is utilized. This portion of power must be obtained from the power grid at market rates. While an increase in electricity prices increases the oilfield’s revenue, it also raises the oilfield’s cost. As a result, the low rate of rising net present value can be validated. In practice, China’s electricity rates vary by region. Northwest, northeast, and other regions have cheaper electricity prices, while Southeast and South China have higher electricity prices. As a result, it is more profitable to establish scenarios four and five in Southeast China coastal cities with higher electricity rates.
4.5. Analysis of Wind Speed
In scenarios two, three, four, and five, wind energy is introduced to the standard oilfield energy system as a source of energy for the oilfield, and the electric energy generated by the wind turbine is directly proportional to the wind speed in the region. Thus, based on the NPV performance of the system at 50%, 70%, 90%, and 110% of the wind speed in this region, as shown in
Figure 14, wind speed is linear with the NPV, and increasing wind speed can enhance the NPV of the system. Among these, the NPV of scenario three is the most wind-speed-dependent. The analytical reasons might be attributed to three situations. The system’s primary source of revenue is the electric energy provided by the wind turbine. In comparison to scenarios four and five, wind energy is not converted to hydrogen for storage, implying that the system’s peak shaving storage capacity will be relatively low.
China’s oilfields are primarily dispersed in the northwest, northeast, and southwest, according to the current circumstances. The wind power density of the area where the oilfields are located is 300 W/m2 in this article. In comparison to these data, average wind power in the northeast, such as the Daqing Oilfield, is more than 200–300 W/m2, and average wind power in coastal and island areas, such as Zhoushan and Huangdao, is more than 500 W/m2. The available hours range from 7000 to 8000 h. As a result, when the system proposed in this research is implemented in the oilfields in the above areas, the economic gains could exceed USD 6 × 10⁷ in scenarios three, four, and five presented in this study.
4.6. Analysis of Carbon Emissions
Along with examining the economics of five scenarios, it is critical to examine the oilfield energy system’s carbon footprint. Natural gas, crude oil, and the electricity grid all have emission factors of 0.19 kg/(kWh), 0.24 kg/(kWh), and 0.89 kg/(kWh). It is worth noting that because grid power generation is treated as coal-fired generation in this article, the carbon emission coefficient is high, and so the carbon emissions of the five scenarios are calculated. As illustrated in the picture, scenario one’s typical oilfield energy model generates the maximum carbon dioxide, 45,874 t/year. In the standard oilfield distributed energy system, a considerable amount of crude oil and electricity from the power grid are used to power the central processing facility, which results in a significant increase in carbon emissions due to the vast area of power purchased from the power grid. This is not consistent with national policy in this instance.
As shown in
Figure 15, although wind turbines are used to generate electricity in scenario two, the oilfield’s primary energy sources remain the power grid and natural gas, resulting in slightly lower annual carbon emissions than scenario one, at 39,813 tons, but still quite significant. Wind energy generation is the primary source of energy in scenarios three, four, and five, and the only source of carbon emissions is the combustion of oilfield-associated gas. Due to the clean renewable energy and the low carbon emissions associated with natural gas combustion, the carbon dioxide emissions are much lower than in scenarios one and two. Additionally, scenario four may produce 46,200 tons more carbon dioxide than scenario one during 20 years, and the system improves the environment.
4.7. Discussion
Following the preceding discussion, it is evident that we may examine the five systems’ merits and disadvantages. To begin, scenario one features the shortcomings of a traditional distributed energy system, including high carbon emissions, high energy consumption, and a low rate of return. It is destined to be eliminated once oilfields are developed. While renewable energy generation is combined in scenario two, the mechanical application of renewable energy does not boost the system’s benefits. Simultaneously, because of the unpredictability of wind resources, the system’s carbon emission performance is sub-optimal in places with limited wind resources. The third, fourth, and fifth scenarios combine wind and hydrogen to generate electricity for the oilfield, which has a low carbon footprint and economic benefits. Finally, it is determined that scenario four is the best, taking into account its relevance to the oilfield, the difficulty of construction, and the support of national policies. In comparison to the traditional method, it generates USD 46.21 million more revenue and cuts carbon emissions by 44,096 t/a. It applies to areas with abundant wind resources and low electricity rates, such as South China’s coastal and northwest regions, which are defined as the WGHN system.
5. Conclusions
To address the fact that oilfield development has entered a period of high water scarcity, energy consumption in the oilfield is increasing, and the oilfield system is losing money, this paper discusses four different types of wind–hydrogen coupling energy systems based on traditional distributed energy. The economics and dependability of the four scenarios are examined using data from an oilfield in Northwest China. Finally, a new form of oilfield energy system is developed that is suited for the majority of existing onshore oilfields. In comparison to a conventional energy system, this concept can increase USD 46.21 million throughout the system’s 20-year life, with a payback period of less than one year. It is a low-risk, high-return investment strategy. The system is capable of utilizing renewable energy successfully and reducing carbon emissions by 44,096 t/a. It not only provides significant economic benefits but also significant environmental benefits. Wind speed, power price, and oilfield-related gas output all affect the field economics. The following conclusions are made:
- (1)
In comparison to other oilfield renewable energy systems, the system fully utilizes excess power, which not only provides economic and environmental benefits but also significantly alleviates the problem of wind waste;
- (2)
Through sensitivity analysis, it is found that the WGHN system is most sensitive to wind speed. When the wind speed is increased by 10%, the net present value of the system will increase by USD 1270,334. Secondly, the electricity price will also affect the system revenue. Each increase in the unit price of electricity is 0.017 USD/kWh, and system revenue increased by USD 877,500;
- (3)
Based on a comprehensive analysis of several regions in China, it is concluded that China’s northeast oilfields (such as Daqing), North China coastal areas (such as Huangdao Oilfield and Bohai offshore platform), northwest oilfields (such as Karamay and Tarim Oilfields), and southeast coastal areas (such as Zhoushan and Ningbo) can all benefit from the WGHN system due to their abundant wind resources.
Overall, this study offers a trustworthy new oilfield energy system, which has complete reference value for tackling the problems of excessive energy consumption, low energy efficiency, and poor economy caused by the development of some old oilfields. At the same time, amid today’s global warming and energy scarcity, limiting carbon emissions is the key. To achieve a carbon peak in 2030 and carbon neutralization in 2060, the reform of the oilfield energy system is significantly important. The wind energy detailed in this study, as well as the connection between hydrogen and other renewable energy sources and the oilfield energy system, will become the driving trend of future development. The hydrogen produced from the residual power of wind energy suggested in this study is also a major innovation; that is, it boosts the utilization rate of energy and locally consumes the electric energy generated by renewable energy, which has substantial theoretical reference significance in the later combination of renewable energy and hydrogen energy. At the same time, scenario four of this article can examine a range of characteristics, including oilfield location, yearly wind speed distribution, oilfield-related gas output, market demand, hydrogen and power pricing. Through the technical and economic evaluation of the oilfield wind–hydrogen linked power supply system, we can better grasp the investment value of the system under various regions and scenarios.
However, the research in this article has certain flaws. First, where wind resources are limited, the economic benefits of the system are minimal. Second, because hydrogen storage technology is still in its infancy, hydrogen storage is a challenge. Finally, some infrastructure constraints need further study. Therefore, we propose the following policy recommendations.
First, an examination of cost sensitivity shows that the main cost driver is energy prices, and self-sufficiency in electricity contributes most of the revenue. Therefore, the focus should be on reducing the cost of energy infrastructure, such as fuel cells. In addition, the government should provide investors with incentives to reduce entry barriers for hydrogen projects, thereby increasing the penetration rate of renewable energy across the country, and helping the country achieve its carbon neutral goal as soon as possible. Secondly, scenario four proposed in this article is more likely to bring significant economic benefits in coastal areas rich in northwest wind resources. The main reason is that most of the project’s revenue comes from wind energy. When the wind speed doubles, the output power of the wind turbine will increase eight times. Therefore, the windy location may help to further increase expected revenue. Finally, after renewable energy is connected to the grid, it is vital to ensure the stability of the power market and grid system. Currently, many wind farms are inefficiently connected to the grid. The government should formulate appropriate rules and evaluation indicators to promote the private sector to enter the renewable energy market, improve market competitiveness, stabilize energy costs, and solve the problem of mismatch between supply and demand.
Author Contributions
Conceptualization, F.Y.; data curation, Q.C.; formal analysis, F.Y., Y.Y. and Q.L.; funding acquisition, Y.L.; methodology, X.H. and Q.L.; writing—original draft, X.H.; writing—review & editing, Q.C.; investigation, X.H.; validation, Y.Y. All authors have read and agreed to the published version of the manuscript.
Funding
This work was partially supported by the National Natural Science Foundation of China (51874325) and the Grant-in-Aid for Early-Career Scientists (19K15260) from the Japan Ministry of Education, Culture, Sports, Science and Technology.
Institutional Review Board Statement
Not applicable.
Informed Consent Statement
Not applicable.
Acknowledgments
This work was partially supported by the National Natural Science Foundation of China (51874325) from the National Key Research and Development Program of China (2018YFE0196000).
Conflicts of Interest
The authors declare no conflict of interest.
Nomenclature
| AEP | Annual electricity production |
| ICC | Initial capital cost |
| FCR | Fixed charge rate |
| AOC | Annual operating cost |
| WT | Wind turbine |
| MS | Mechanical system |
| ES | Electronic system |
| AE | Alkaline electrolytic |
| PEM | Proton exchange membrane |
| SOEC | Solid oxide electrologist cell |
| GT | Gas turbine |
| HE | Heat exchange |
| OHF | Oil heating furnace |
| HHF | Hydrogen heating furnace |
| BT | Battery |
| PP | Payback period |
| LCOE | Levelized cost of energy |
| LCOH | Levelized cost of hydrogen |
| FF | Fossil fuel |
| NPV | Net present value |
| IN | Initial investment |
| ED | Energy deposited |
| NI | Net income |
| NE | Net expenditure |
| WGHNl | Wind–gas turbine–hydrogen nexus |
References
- Zhang, X.; Liao, Q.; Wang, Q.; Wang, L.; Qiu, R.; Liang, Y.; Zhang, H. How to promote zero-carbon oilfield target? A technical-economic model to analyze the economic and environmental benefits of the Recycle-CCS-EOR project. Energy 2021, 225, 120297. [Google Scholar] [CrossRef]
- Wei, X.; Qiu, R.; Liang, Y.; Liao, Q.; Klemeš, J.J.; Xue, J.; Zhang, H. Roadmap to carbon emissions neutral industrial parks: Energy, economic and environmental analysis. Energy 2022, 238, 121732. [Google Scholar] [CrossRef]
- Yan, W.; Meng, Z.; Zou, M.; Miao, H.; Ma, F.; Yu, R.; Qiu, W.; Liu, X.Y.; Lin, N. Neutralization reaction in the synthesis of carbon materials for supercapacitors. Chem. Eng. J. 2020, 381, 122547. [Google Scholar] [CrossRef]
- Huang, L.; Liao, Q.; Yan, J.; Liang, Y.; Zhang, H. Carbon footprint of oil products pipeline transportation. Sci. Total Environ. 2021, 783, 146906. [Google Scholar] [CrossRef] [PubMed]
- Xing, X.; Yan, Y.; Zhang, H.; Long, Y.; Wang, Y.; Liang, Y. Optimal design of distributed energy systems for industrial parks under gas shortage based on augmented ε-constraint method. J. Clean. Prod. 2019, 218, 782–795. [Google Scholar] [CrossRef]
- Aziz, M.; Putranto, A.; Biddinika, M.K.; Wijayanta, A.T. Energy-saving combination of N2 production, NH3 synthesis, and power generation. Int. J. Hydrogen Energy 2017, 42, 27174–27183. [Google Scholar] [CrossRef]
- Aziz, M.; Wijayanta, A.T.; Nandiyanto, A.B.D. Ammonia as Effective Hydrogen Storage: A Review on Production, Storage and Utilization. Energies 2020, 13, 3062. [Google Scholar] [CrossRef]
- Wijayanta, A.T.; Aziz, M. Ammonia production from algae via integrated hydrothermal gasification, chemical looping, N2 production, and NH3 synthesis. Energy 2019, 174, 331–338. [Google Scholar] [CrossRef]
- Li, T.; Xu, Y.; Wang, J.; Kong, X.; Zhu, J. Poly-generation energy system driven by associated geothermal water for oilfield in high water cut stage: A theoretical study. Geothermics 2018, 76, 242–252. [Google Scholar] [CrossRef]
- Wang, K.; Yuan, B.; Ji, G.; Wu, X. A comprehensive review of geothermal energy extraction and utilization in oilfields. J. Pet. Sci. Eng. 2018, 168, 465–477. [Google Scholar] [CrossRef]
- Huang, C.; Gu, B.; Chen, Y.; Tan, X.; Feng, L. Energy return on energy, carbon, and water investment in oil and gas resource extraction: Methods and applications to the Daqing and Shengli oilfields. Energy Policy 2019, 134, 110979. [Google Scholar] [CrossRef]
- Guo, T.; Zhang, Y.; He, J.; Gong, F.; Chen, M.; Liu, X. Research on geothermal development model of abandoned high temperature oil reservoir in North China oilfield. Renew. Energy 2021, 177, 1–12. [Google Scholar] [CrossRef]
- Li, T.; Liu, Q.; Xu, Y.; Dong, Z.; Meng, N.; Jia, Y.; Qin, H. Techno-economic performance of multi-generation energy system driven by associated mixture of oil and geothermal water for oilfield in high water cut. Geothermics 2021, 89, 101991. [Google Scholar] [CrossRef]
- Spielmann, V.; Brey, T.; Dannheim, J.; Vajhøj, J.; Ebojie, M.; Klein, J.; Eckardt, S. Integration of sustainability, stakeholder and process approaches for sustainable offshore wind farm decommissioning. Renew. Sustain. Energy Rev. 2021, 147, 111222. [Google Scholar] [CrossRef]
- Zhang, Q.; Zhang, H.; Yan, Y.; Yan, J.; He, J.; Li, Z.; Shang, W.; Liang, Y. Sustainable and clean oilfield development: How access to wind power can make offshore platforms more sustainable with production stability. J. Clean. Prod. 2021, 294, 126225. [Google Scholar] [CrossRef]
- Zou, X.; Qiu, R.; Yuan, M.; Liao, Q.; Yan, Y.; Liang, Y.; Zhang, H. Sustainable offshore oil and gas fields development: Techno-economic feasibility analysis of wind-hydrogen-natural gas nexus. Energy Rep. 2021, 7, 4470–4482. [Google Scholar] [CrossRef]
- Hu, H.; Sun, X.; Zeng, B.; Gong, D.; Zhang, Y. Enhanced evolutionary multi-objective optimization-based dispatch of coal mine integrated energy system with flexible load. Appl. Energy 2022, 307, 118130. [Google Scholar] [CrossRef]
- Monfaredi, F.; Shayeghi, H.; Bizon, N. Developing optimal energy management of integrated energy systems in the hybrid electricity and gas networks. J. Energy Storage 2022, 48, 103984. [Google Scholar] [CrossRef]
- Huang, Y.; Wang, Y.; Liu, N. A two-stage energy management for heat-electricity integrated energy system considering dynamic pricing of Stackelberg game and operation strategy optimization. Energy 2021, 244, 122576. [Google Scholar] [CrossRef]
- Bartolucci, L.; Cordiner, S.; Mulone, V.; Pasquale, S. Hydrogen based Multi Energy Systems: Assessment of the marginal utility of increasing hydrogen penetration on system performances. Int. J. Hydrogen Energy 2021, 46, 38588–38602. [Google Scholar] [CrossRef]
- Dong, X.; Wu, J.; Xu, Z.; Liu, K.; Guan, X. Optimal coordination of hydrogen-based integrated energy systems with combination of hydrogen and water storage. Appl. Energy 2022, 308, 118274. [Google Scholar] [CrossRef]
- Yan, Y.; Zhang, H.; Long, Y.; Wang, Y.; Liang, Y.; Song, X.; Yu, J.J. Multi-objective design optimization of combined cooling, heating and power system for cruise ship application. J. Clean. Prod. 2019, 233, 264–279. [Google Scholar] [CrossRef]
- Song, D.; Liu, J.; Yang, J.; Su, M.; Yang, S.; Yang, X.; Joo, Y.H. Multi-objective energy-cost design optimization for the variable-speed wind turbine at high-altitude sites. Energy Convers. Manag. 2019, 196, 513–524. [Google Scholar] [CrossRef]
- Maienza, C.; Avossa, A.; Ricciardelli, F.; Coiro, D.; Troise, G.; Georgakis, C. A life cycle cost model for floating offshore wind farms. Appl. Energy 2020, 266, 114716. [Google Scholar] [CrossRef]
- Chen, L.; Liu, Y. Research on Main Constraints in Sustainable Development of China Oil-Gas Upstream Industry. Energy Procedia 2012, 14, 325–330. [Google Scholar] [CrossRef] [Green Version]
- Huskey, A.; Forsyth, T. NREL Small Wind Turbine Test Project: Mariah Power’s Wind Spire Wind Turbine Test Chronology; Technical Report NREL/TP-500-45552; National Renewable Energy Laboratory: Golden, CO, USA, 2009.
- Chen, J.; Wang, F.; Stelson, K.A. A mathematical approach to minimizing the cost of energy for large utility wind turbines. Appl. Energy 2018, 228, 1413–1422. [Google Scholar] [CrossRef]
- Abobkr, A.H.; El-Hawary, M.E. Evaluation of wind turbine characteristics built-in model in Matlab Simulink. In Proceedings of the 2016 IEEE Electrical Power and Energy Conference (EPEC), Ottawa, ON, Canada, 12–14 October 2016; pp. 1–4. [Google Scholar]
- Burton, N.A.; Padilla, R.V.; Rose, A.; Habibullah, H. Increasing the efficiency of hydrogen production from solar powered water electrolysis. Renew. Sustain. Energy Rev. 2021, 135, 110255. [Google Scholar] [CrossRef]
- Mohammadi, A.; Mehrpooya, M. A comprehensive review on coupling different types of electrolyzer to renewable energy sources. Energy 2018, 158, 632–655. [Google Scholar] [CrossRef]
- D’Amore-Domenech, R.; Santiago, Ó.; Leo, T.J. Multicriteria analysis of seawater electrolysis technologies for green hydrogen production at sea. Renew. Sustain. Energy Rev. 2020, 133, 110166. [Google Scholar] [CrossRef]
- Amikam, G.; Nativ, P.; Gendel, Y. Chlorine-free alkaline seawater electrolysis for hydrogen production. Int. J. Hydrogen Energy 2018, 43, 6504–6514. [Google Scholar] [CrossRef]
- Timmerberg, S.; Kaltschmitt, M. Hydrogen from renewables: Supply from North Africa to Central Europe as blend in existing pipelines—Potentials and costs. Appl. Energy 2019, 237, 795–809. [Google Scholar] [CrossRef]
- Nuttall, L.J.; Fickett, A.P.; Titterington, W.A. Hydrogen Generation by Solid Polymer Electrolyte Water Electrolysis. In Hydrogen Energy: Part A; Veziroğlu, T.N., Ed.; Springer: Boston, MA, USA, 1975; pp. 441–455. [Google Scholar]
- Millet, P.; Ngameni, R.; Grigoriev, S.A.; Mbemba, N.; Brisset, F.; Ranjbari, A.; Etiévant, C. PEM water electrolyzers: From electrocatalysis to stack development. Int. J. Hydrogen Energy 2010, 35, 5043–5052. [Google Scholar] [CrossRef]
- Schmidt, O.; Gambhir, A.; Staffell, I.; Hawkes, A.; Nelson, J.; Few, S. Future cost and performance of water electrolysis: An expert elicitation study. Int. J. Hydrogen Energy 2017, 42, 30470–30492. [Google Scholar] [CrossRef]
- Grigoriev, S.A.; Fateev, V.N.; Bessarabov, D.G.; Millet, P. Current status, research trends, and challenges in water electrolysis science and technology. Int. J. Hydrogen Energy 2020, 45, 26036–26058. [Google Scholar] [CrossRef]
- Laguna-Bercero, M.A. Recent advances in high temperature electrolysis using solid oxide fuel cells: A review. J. Power Sources 2012, 203, 4–16. [Google Scholar] [CrossRef] [Green Version]
- Seyedmatin, P.; Karimian, S.; Rostamzadeh, H.; Amidpour, M. Electricity and hydrogen co-production via scramjet multi-expansion open cooling cycle coupled with a PEM electrolyzer. Energy 2020, 199, 117364. [Google Scholar] [CrossRef]
- Oi, T.; Wada, K. Feasibility study on hydrogen refueling infrastructure for fuel cell vehicles using the off-peak power in Japan. Int. J. Hydrogen Energy 2004, 29, 347–354. [Google Scholar] [CrossRef]
- Lümmen, N.; Karouach, A.; Tveitan, S. Thermo-economic study of waste heat recovery from condensing steam for hydrogen production by PEM electrolysis. Energy Convers. Manag. 2019, 185, 21–34. [Google Scholar] [CrossRef]
- Miao, B.; Giordano, L.; Chan, S.H. Long-distance renewable hydrogen transmission via cables and pipelines. Int. J. Hydrogen Energy 2021, 46, 18699–18718. [Google Scholar] [CrossRef]
- Kaiser, M.J. Offshore pipeline construction cost in the U.S. Gulf of Mexico. Mar. Policy 2017, 82, 147–166. [Google Scholar] [CrossRef]
- Parker, N.C.; Ogden, J.M.; Fan, Y. The role of biomass in California’s hydrogen economy. Energy Policy 2008, 36, 3925–3939. [Google Scholar] [CrossRef] [Green Version]
- Han, J.-H.; Ryu, J.-H.; Lee, I.-B. Modeling the operation of hydrogen supply networks considering facility location. Int. J. Hydrogen Energy 2012, 37, 5328–5346. [Google Scholar] [CrossRef]
- Holagh, S.G.; Haghghi, M.A.; Chitsaz, A. Which methane-fueled fuel cell is of superior performance in CCHP applications; solid oxide or molten carbonate? Fuel 2022, 312, 122936. [Google Scholar] [CrossRef]
- Hosseinimaab, S.M.; Tousi, A.M. A new approach to off-design performance analysis of gas turbine engines and its application. Energy Convers. Manag. 2021, 243, 114411. [Google Scholar] [CrossRef]
Figure 1.
Oilfield hybrid energy system.
Figure 1.
Oilfield hybrid energy system.
Figure 2.
The oilfield energy system framework of scenario 1.
Figure 2.
The oilfield energy system framework of scenario 1.
Figure 3.
The oilfield energy system framework of scenario 2.
Figure 3.
The oilfield energy system framework of scenario 2.
Figure 4.
The oilfield energy system framework of scenario 3.
Figure 4.
The oilfield energy system framework of scenario 3.
Figure 5.
The oilfield energy system framework of scenario 4.
Figure 5.
The oilfield energy system framework of scenario 4.
Figure 6.
The oilfield energy system framework of scenario 5.
Figure 6.
The oilfield energy system framework of scenario 5.
Figure 7.
The geographic locations of an oilfield in China.
Figure 7.
The geographic locations of an oilfield in China.
Figure 8.
(a) Wind speed data and (b) output power production in one year.
Figure 8.
(a) Wind speed data and (b) output power production in one year.
Figure 9.
(a) Proportion of system electric energy consumption and (b) proportion of system heat energy consumption.
Figure 9.
(a) Proportion of system electric energy consumption and (b) proportion of system heat energy consumption.
Figure 10.
NPV and initial investment cost of five scenarios.
Figure 10.
NPV and initial investment cost of five scenarios.
Figure 11.
LCOE and LCOH of five scenarios.
Figure 11.
LCOE and LCOH of five scenarios.
Figure 12.
NPV of associated gas production under different scenarios.
Figure 12.
NPV of associated gas production under different scenarios.
Figure 13.
NPV of the model under different electricity prices.
Figure 13.
NPV of the model under different electricity prices.
Figure 14.
NPV of the model under different wind speed.
Figure 14.
NPV of the model under different wind speed.
Figure 15.
Carbon emissions in five scenarios.
Figure 15.
Carbon emissions in five scenarios.
Table 1.
Literature summary of the oilfield energy system.
Table 1.
Literature summary of the oilfield energy system.
| Oilfield Energy System | Author | Input Energy | Output Energy | Document Number |
|---|
| Associated geothermal drive | Li, Xu et al. | Geothermal energy, electric energy | Thermal energy, electric energy | 6 |
| Oilfield geothermal energy system | Wang, Yuan et al. | Geothermal energy, electric energy | Thermal energy, electric energy | 7 |
| The energy system of abandoned oilfields in North China | Guo, T. et al. | Geothermal energy | Thermal energy, electric energy | 9 |
| Multipower generation energy system in high water cut oilfield | Li, Liu et al. | Fossil energy, geothermal energy, electric energy | Thermal energy, electric energy | 10 |
| Sustainable offshore wind farm energy system | Spielman, Brey et al. | Wind energy and electric energy | Electric energy, hydrogen energy | 11 |
| Sustainable development of oilfield energy system | Zou, Qiu et al. | Renewable energy | Thermal energy, electric energy | 12 |
| Daqing Oilfield sustainable energy system | Huang gu et al. | Electric energy | Thermal energy, electric energy | 13 |
| Sustainable offshore oil and gas field development system | Hu Sun et al. | Wind energy and electric energy | Thermal energy, electric energy, hydrogen energy | 14 |
Table 2.
Scenarios for production, transportation, and storage of energy.
Table 2.
Scenarios for production, transportation, and storage of energy.
| Equipment | Scenario I | Scenario II | Scenario III | Scenario IV | Scenario V |
|---|
| Grid-GT | Grid-GT-WT | WT-GT | WT-GT-H2 | WT-GT-Fur |
|---|
| Wind Turbine | - | √ | √ | √ | √ |
| Electrolyzer | - | - | - | √ | √ |
| Furnace (Crude oil) | √ | √ | √ | √ | - |
| France (H2) | - | - | - | - | √ |
| Heat exchanger | √ | √ | √ | √ | √ |
| Gas Turbine | √ | √ | √ | √ | √ |
| H2 tank | - | - | - | √ | √ |
| Fuel cell | - | - | - | √ | √ |
| Battery | - | - | √ | √ | √ |
| Power grid | √ | √ | - | - | - |
Table 3.
The initial capital cost of the wind turbine [
18,
19].
Table 3.
The initial capital cost of the wind turbine [
18,
19].
| Subsystem | Components | Cost Model (USD) |
|---|
| Mechanical system | Blade | |
| Gearbox | |
| Low-speed shaft | |
| Main bearings | |
| Mechanical brake | |
| Electrical system | Generator | |
| Power converter | |
| Electrical connection | |
| Control system | Pitch system | |
| Yaw system | |
| Control safety system | 35,000 |
| Auxiliary system | Hydraulic, cooling system | |
| Hub | |
| Nose cone | |
| Mainframe | |
| Nacelle cover | |
| Tower | |
| Infrastructures | Foundation | |
| Roads civil work | |
| Interface connections | |
| Engineering permits | |
| Transportation | |
| Installation | |
Table 4.
Annual operating cost of a wind turbine [
18,
19].
Table 4.
Annual operating cost of a wind turbine [
18,
19].
| Type | Cost Model (USD) |
|---|
| Levelized replacement cost | |
| Land lease costs | |
| O&M | |
Table 5.
Comparison of three typical hydrogen production technologies from electrolytic water [
34,
35].
Table 5.
Comparison of three typical hydrogen production technologies from electrolytic water [
34,
35].
| Project | Hydrogen Production from
Alkaline Electrolytic Water | Hydrogen Production by
Electrolysis of Water with Proton Exchange Membrane | Hydrogen Production by
Electrolysis of Water with Solid Oxide |
|---|
| Energy efficiency/% | 60~75 | 70~90 | 85~95 |
| Operating temperature/°C | 70~90 | 70~80 | 700~1000 |
| Current density/(A·cm2) | 0.2~0.4 | 1.0~2.0 | 1.0~10.0 |
| Power consumption/(kWh·m3) | 4.5~5.5 | 3.8~5.0 | 2.6~3.6 |
| Response speed | Faster | Fast | Low |
| Power quality requirements | Steady point power supply | Steady point or fluctuation | Steady point power supply |
| System operation and maintenance | Corrosive liquid, later stage complex operation, and maintenance and high cost | Complex operation and maintenance and high cost | No corrosive liquid, simple operation, and maintenance, low cost, the project is still in the laboratory stage, and the operation and maintenance demand is not clear for the time being |
| Cell life/(h) | 12,000 | 10,000 | - |
| Equipment cost/(USD·kWh) | 300 | 1200 | - |
| Characteristic | The technology is mature and has realized large-scale industrial application with low cost | It has good renewable energy adaptability, no pollution, high cost at this stage, has not been commercialized in China, high PEM replacement cost, and the catalyst is a precious metal | Some electric energy can be replaced by thermal energy, with high conversion efficiency, difficult material selection under high-temperature conditions, and has not been commercialized |
Table 6.
Characteristic parameters of electrolyzers [
36,
37].
Table 6.
Characteristic parameters of electrolyzers [
36,
37].
| Electrolyte Type | Current
Density/A∙cm−2 | Voltage Range/V | Oxygen
Production/m3∙h−1 | Power
Consumption/(kW∙h)∙m−3 | Operating
Temperature/°C | Operating Pressure/Mpa | Efficiency/% |
|---|
| Basylous | Single-stage | 0.1~0.2 | 2.0~2.4 | ≤8 × 10⁴ | 5.0 | 60~80 | <3 | 75~90 |
| Multistage | 0.2~0.4 | 1.8~2.0 | ≤2 × 10⁵ | 4.3~4.6 | 60~80 | <3 | 75~90 |
| PME | 0.6~2.0 | 1.8~2.2 | ≤2.5 × 10⁴ | 4.5 | 50~80 | <20 | 80~90 |
| High-temperature solid-state oxidation | 0.3~2.0 | 0.7~1.5 | ≤2.5 × 10⁴ | 3.9~4.0 | 650~1000 | <2.5 | 80~90 |
Table 7.
Comparison of several hydrogen storage methods [
41].
Table 7.
Comparison of several hydrogen storage methods [
41].
| Hydrogen Storage Technologies | Hydrogen Storage Capacity | Cost | Ease of Operation | Security | Ease of Transport | Technology Maturity | Ooperating Pressure/Mpa | Domestic Applications |
|---|
| High-pressure gaseous hydrogen storage | Small | Low | Easy | Poor | Convenient | Maturity | 15.2~70.9 | Extensive |
| Low-temperature liquid hydrogen storage | large | Very high | Difficult | Poor | Normal | Immaturity | 5~10 | For aerospace only |
| Metal hydride hydrogen storage | large | High | Easy | Security | Convenient | General | 1~6 | Very little |
| Organic liquid hydrogen storage | large | High | Easy | Security | Convenient | Immaturity | 10~14.2 | Very little |
Table 8.
The characteristic parameters of these five fuel cells.
Table 8.
The characteristic parameters of these five fuel cells.
| FC Type | Current
Density/(A∙cm−2) | End Voltage/V | Power Density/(W∙cm−2) | H2 Consumption/(cm3∙(min∙A)−1) | O2 Consumption/(cm3∙(min∙A)−1) | Pressure/Mpa | Temperature/°C | Efficiency |
|---|
| Battery | System |
|---|
| Proton Exchange Membrane | 0.1~0.9 | 0.6~0.8 | 0.35~0.70 | 7.0 | 3.5 | 0.1~0.2 | 30~100 | 50~70 | 30~50 |
| Alkali | 0.1~0.9 | 0.6~0.8 | 0.10~0.30 | 7.0 | 3.5 | 0.1 | 80 | 60~70 | 62 |
| Phosphoric acid | 0.1~0.9 | 0.6~0.8 | 0.12~0.14 | 7.0 | 3.5 | 0.1 | 150~200 | 55 | 40 |
| Fused carbonates | 0.1~0.9 | 0.6~0.8 | 0.10~0.12 | 7.0 | 3.5 | 0.1~1.0 | 600~700 | 55 | 47 |
| Solid Oxide | 0.1~0.9 | 0.6~0.8 | 0.15~0.70 | 7.0 | 3.5 | 0.1 | 850~1100 | 60~65 | 55~60 |
Table 9.
Parameter of some equipment.
Table 9.
Parameter of some equipment.
| Facility | Linear Capacity-Dependent
Cost (USD/kW, MWh, kg) | O&M
(USD/op.Hour, Year) | Lifetime (Year) | Rated Power (%) |
|---|
| Wind Turbine | 550 | 20 | 20 | 45 |
| Electrolyzer | 145 | 140 | 15 | 80 |
| Furnace (Crude oil) | 250 | 30 | 25 | 80 |
| France (H2) | 250 | 30 | 25 | 80 |
| Heat exchanger | 350 | 10 | 25 | 55 |
| Gas Turbine | 300 | 6 | 25 | 45 |
| H2 tank | 380 | 1800 | 25 | 80 |
| Fuel cell | 1000 | 120 | 18 | 80 |
| Battery | 210,000 | 1400 | 20 | 80 |
| Publisher’s Note: MDPI stays neutral with regard to jurisdictional claims in published maps and institutional affiliations. |
© 2022 by the authors. Licensee MDPI, Basel, Switzerland. This article is an open access article distributed under the terms and conditions of the Creative Commons Attribution (CC BY) license (https://creativecommons.org/licenses/by/4.0/).


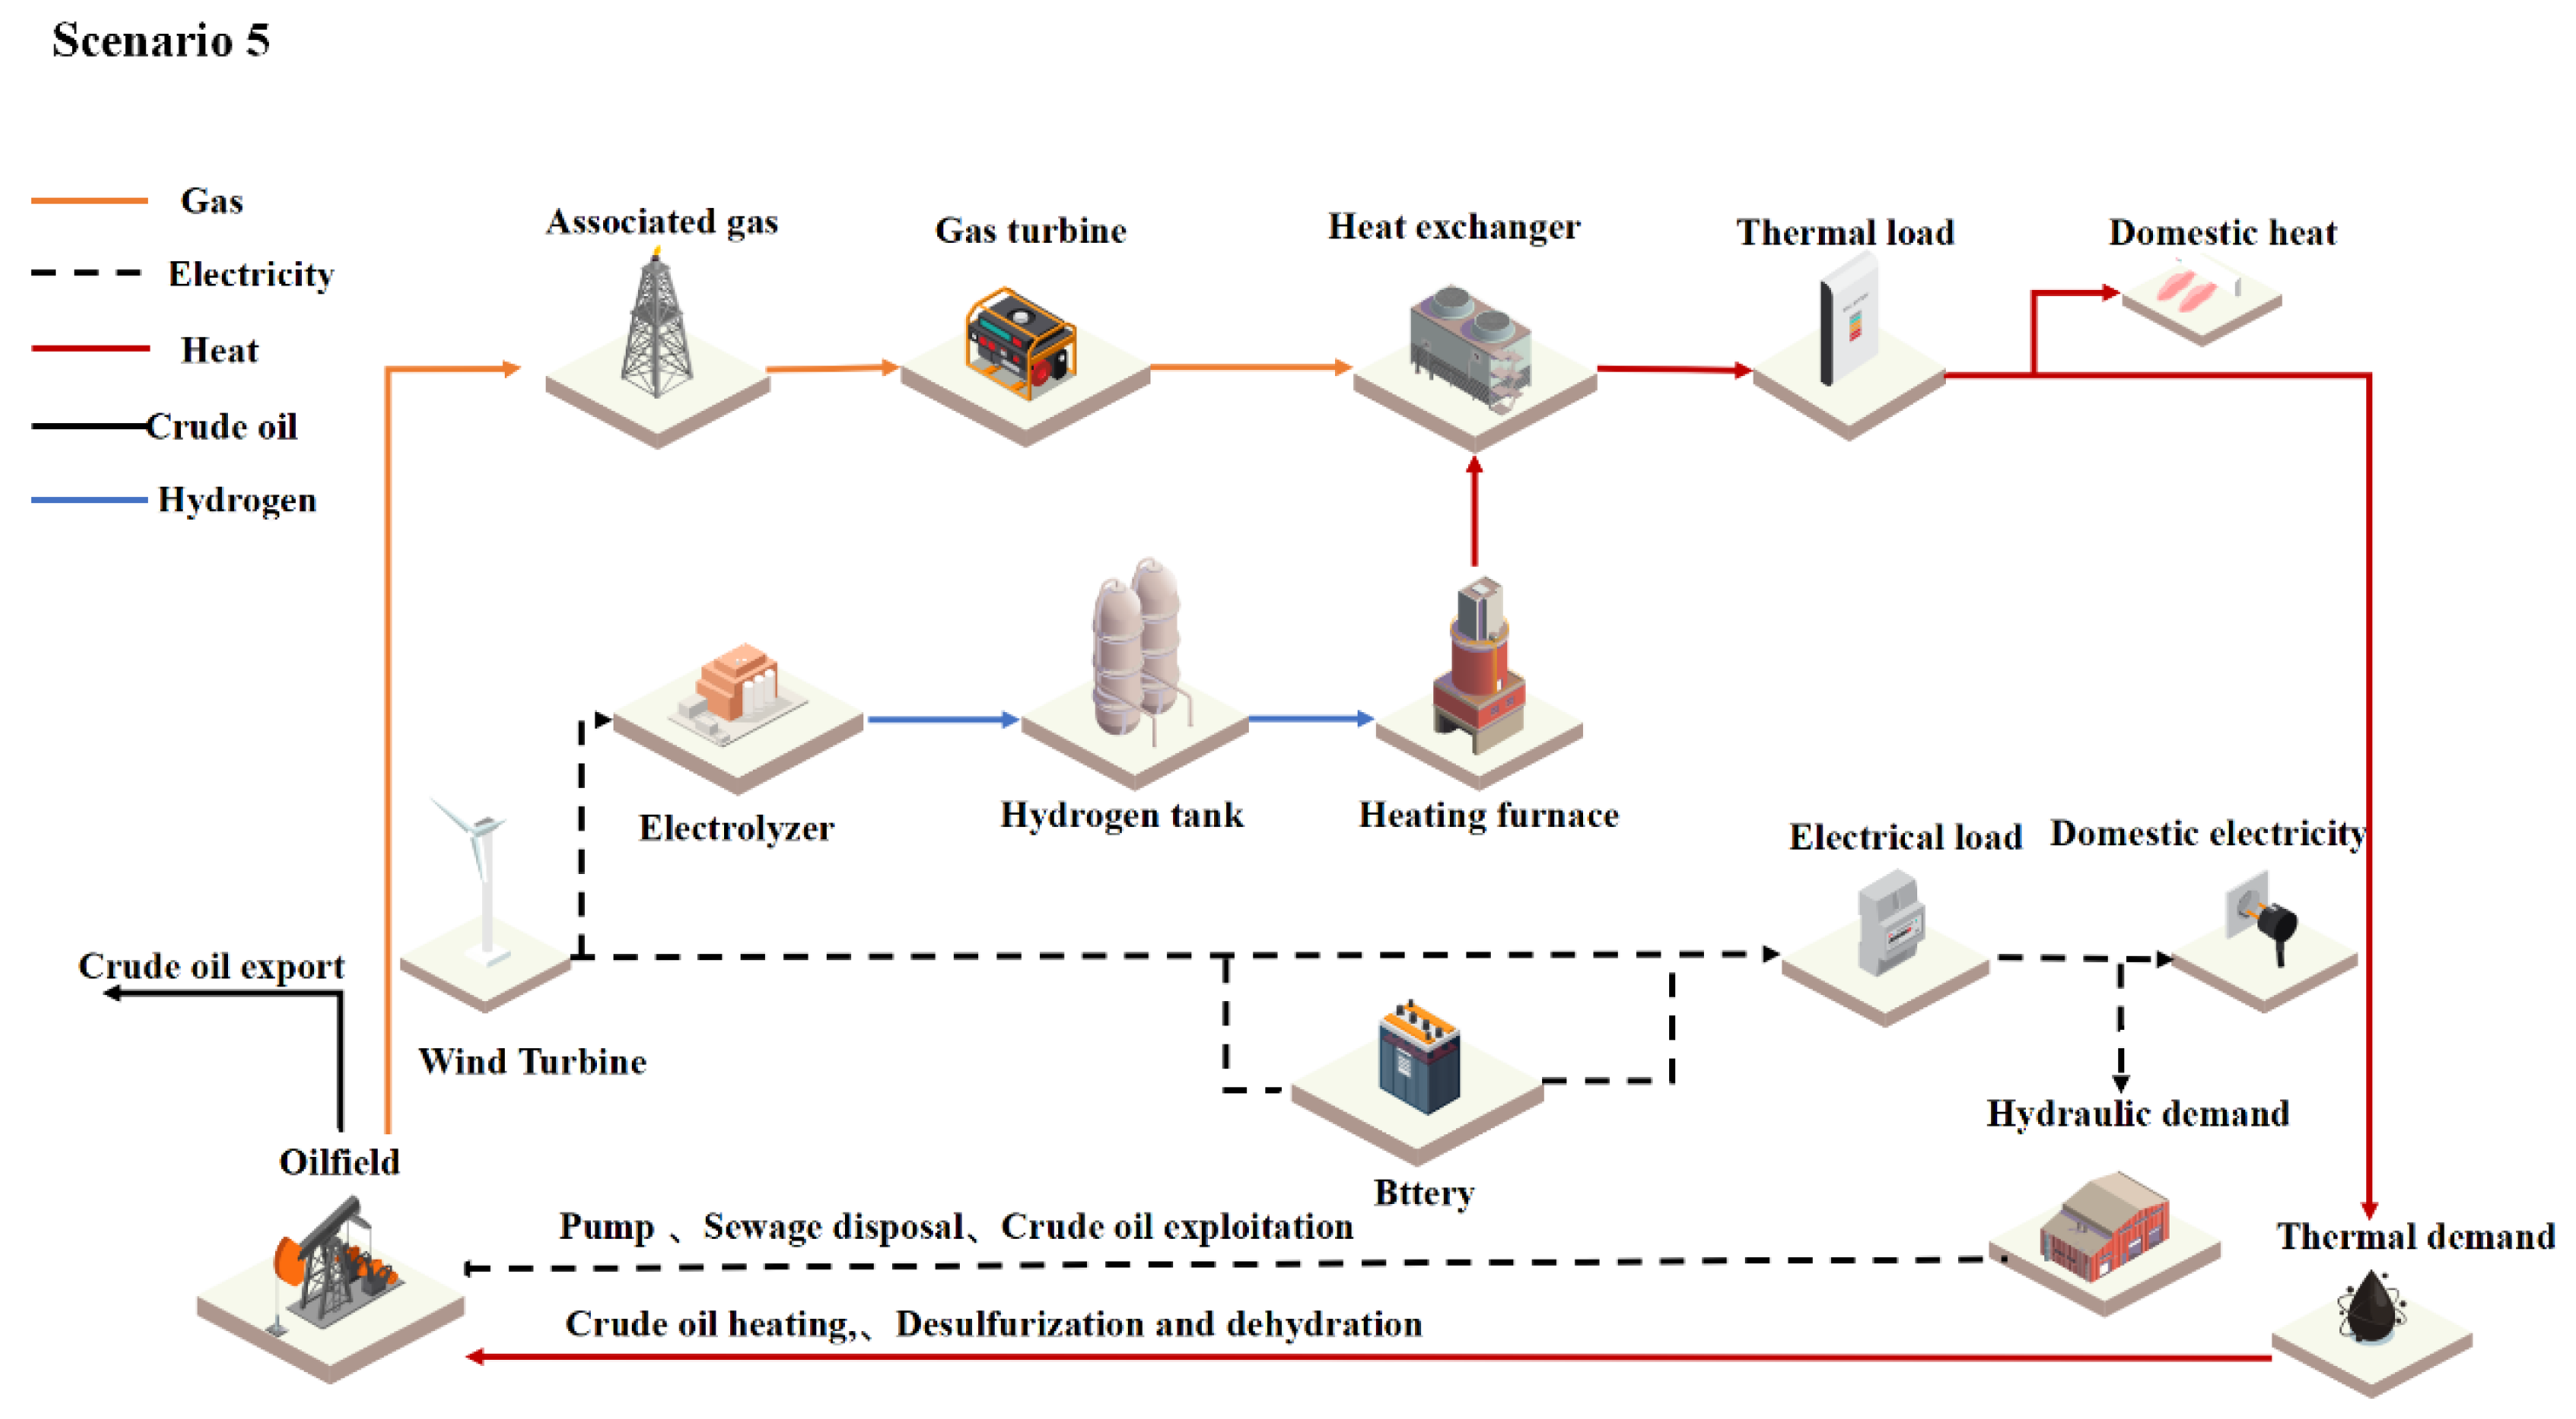