
Comparison of Environmental Impact Assessment Methods in the Assembly and Operation of Photovoltaic Power Plants: A Systematic Review in the Castilla—La Mancha Region

 ,
,  ,
,  and
and
Abstract
:1. Introduction
- -
- 2008–2012 Action Plan of the Energy Saving and Efficiency Strategy in Spain (PAE4+): it avoids emissions of approximately 238 million tons of CO2 into the atmosphere through savings in the country’s primary energy.
- -
- Spanish National Action Plan for Renewable Energies (PANER) 2011–2020: Considers as its main objective a gross final energy consumption of 20% of the fraction coming from clean energies by 2020.
- -
- Renewable Energy Plan (PER) 2011–2020: Contemplates the different perspectives considered in the expected development of costs and technologies from a sectoral analysis of the factors involved.
- -
- Energy Action Plan “20-20-20” of the European Union: It includes the general objectives of the 27 member nations to reduce by 20% the emissions produced in 2020 in relation to the figures obtained in 1990; as well as that 20% of the energy consumption within the European Union by this year comes from renewable sources.
- -
- Paris Climate Agreement: It is based on establishing as a final objective to be able to maintain below two degrees Celsius the increase of temperatures on the planet, restricting 195 signatory countries not to increase their temperatures to 1.5 degrees Celsius. This will be possible by setting national targets every five years to reduce greenhouse gas emissions [5].
- (a)
- Indicators
- (b)
- Life Cycle Assessment (LCA)
- (c)
- Geographical Information System (GIS)
- (d)
- Environmental Impact Assessment (EIA)
- -
- The loss of visual amenity;
- -
- The loss of arable land and other economically valuable land uses;
- -
- The impact on ecosystems; The accidental release of chemicals into the local environment; and occupational hazards during construction and operation.
- -
- Reduction in greenhouse gas emissions (mainly CO2, NOx) and prevention of toxic gas emissions (SO2, particulate matter).
- -
- Recovery of degraded land;
- -
- Reduction in necessary transmission lines of electrical grids;
- -
- Increased regional/national energy independence;
- -
- Provision of job opportunities;
- -
- Diversification and security of energy supply;
- -
- Support for deregulation of energy markets;
- -
- Acceleration of rural electrification in developing countries.
2. Methodology
2.1. Addressed Concepts
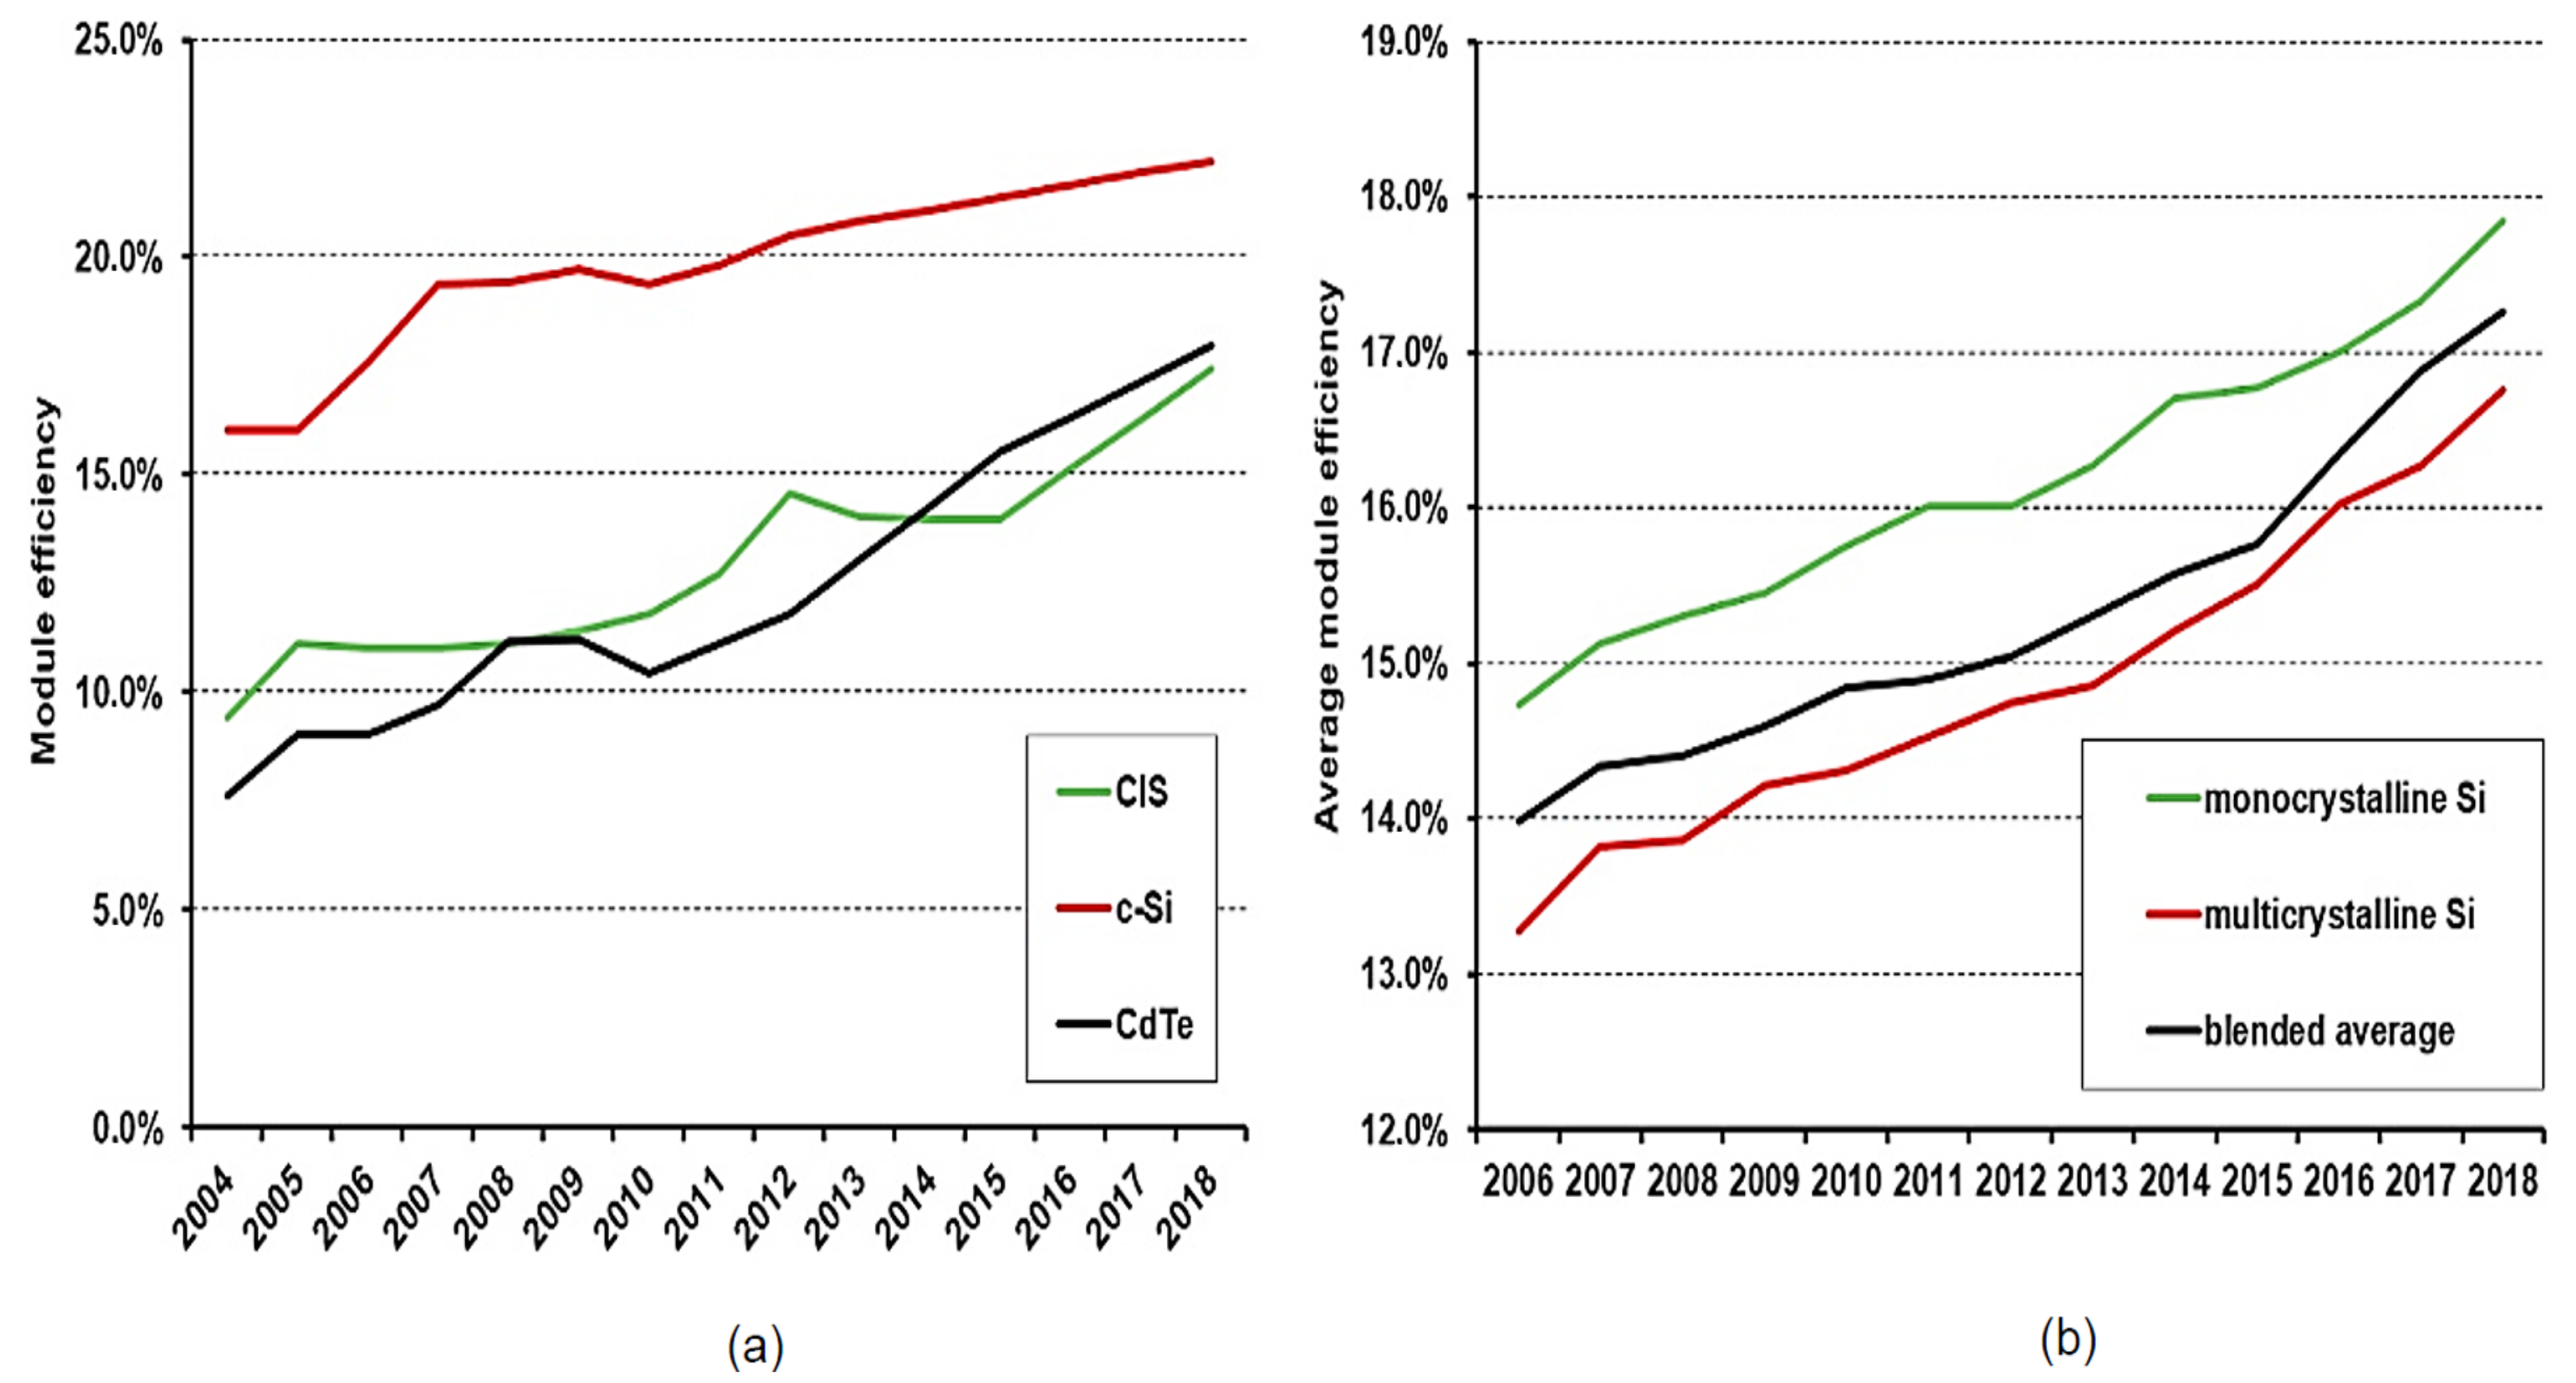
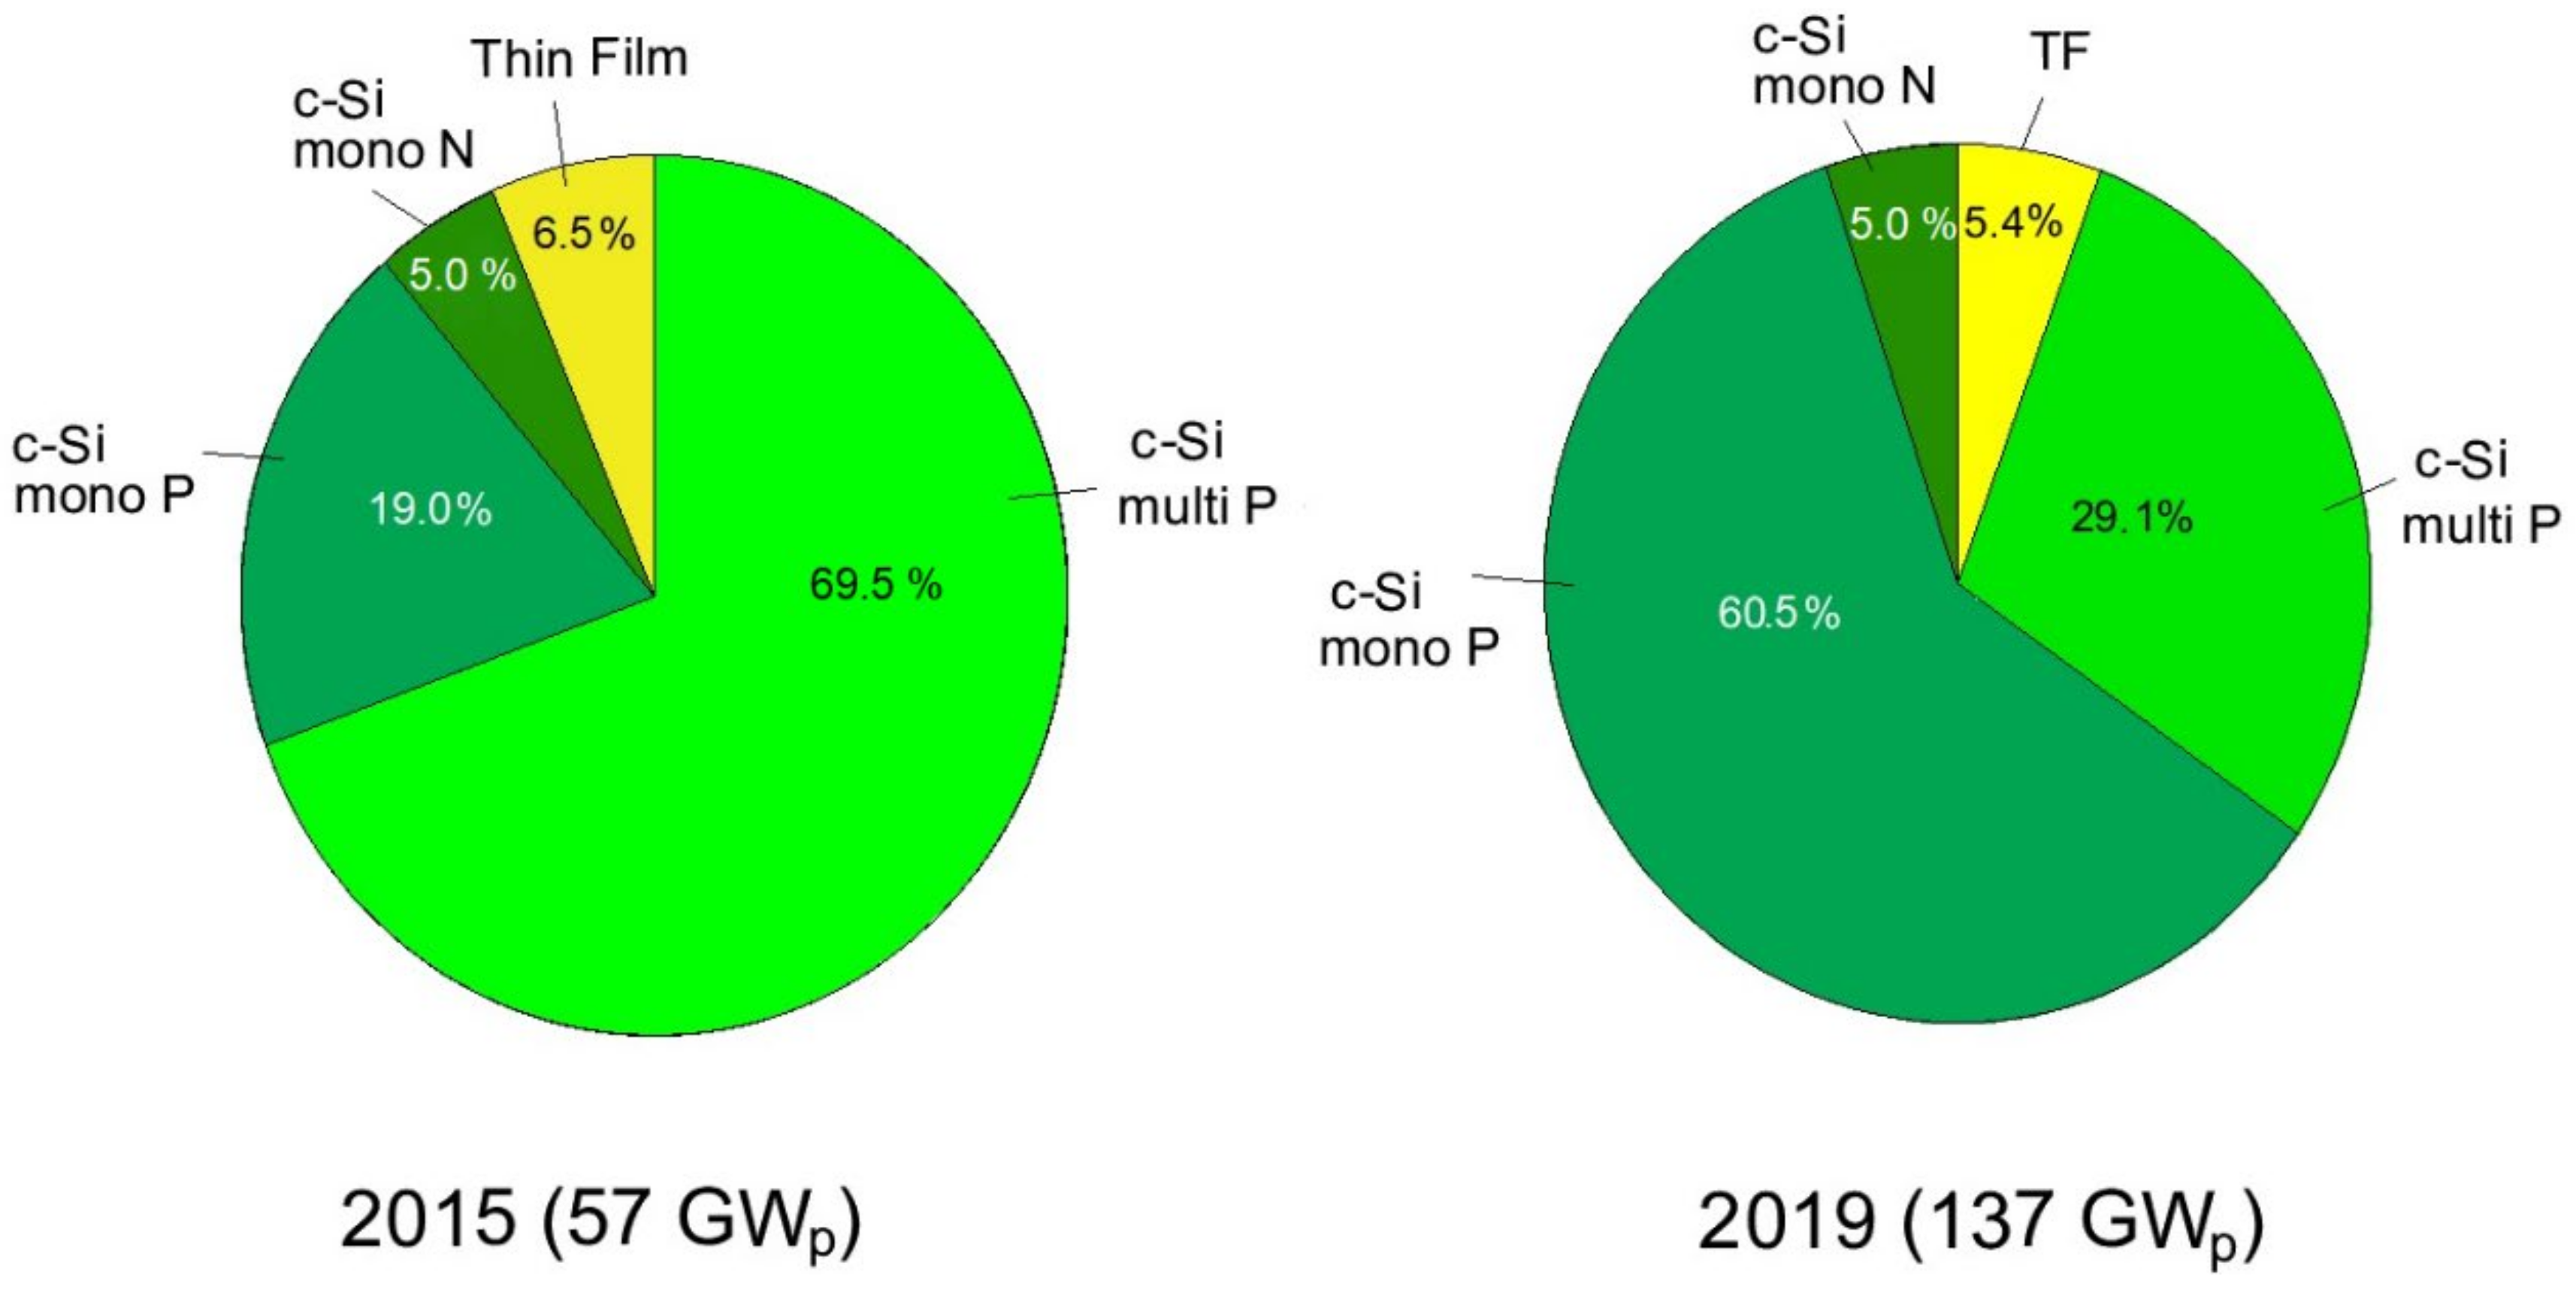
2.1.1. PV Modules Production
- -
- Monocrystalline silicon (mono c-Si): The cells used to manufacture the c-Si module consist of porous p-n junction sheets. Mono c-Si is homogeneous, which means its composition is a continuous crystal without a grain boundary, and the orientation of silicon atoms and lattice parameters remain constant throughout the material [17,18]. Further, in a warm environment, monocrystalline solar modules can deliver higher efficiency than Poly c-Si because of their high-temperature coefficient.
- -
- Polycrystalline silicon (poly c-Si): This type of module has a lower market share than mono c-Si, and it is produced by melting multiple silicon fragments together to produce the wafers. They also have an additional layer to reduce light reflection. Poly c-Si has the advantage of a lower price; however, their efficiency is also lower (14–16%) due to their reduced silicon purity (the electrons in each cell have less space to move because of the many crystals) [19].
2.1.2. Emissions from the PV Industry
2.1.3. Ecological Principles
- -
- Environmental factor: Any element or aspect of the environment susceptible to interact with the actions associated with the project to be executed, whose change in quality generates an environmental impact.
- -
- Environmental impact: Alteration introduced by human activity in the environment; this last concept identifies the part of the environment that interacts with it.
2.2. Study Scenario
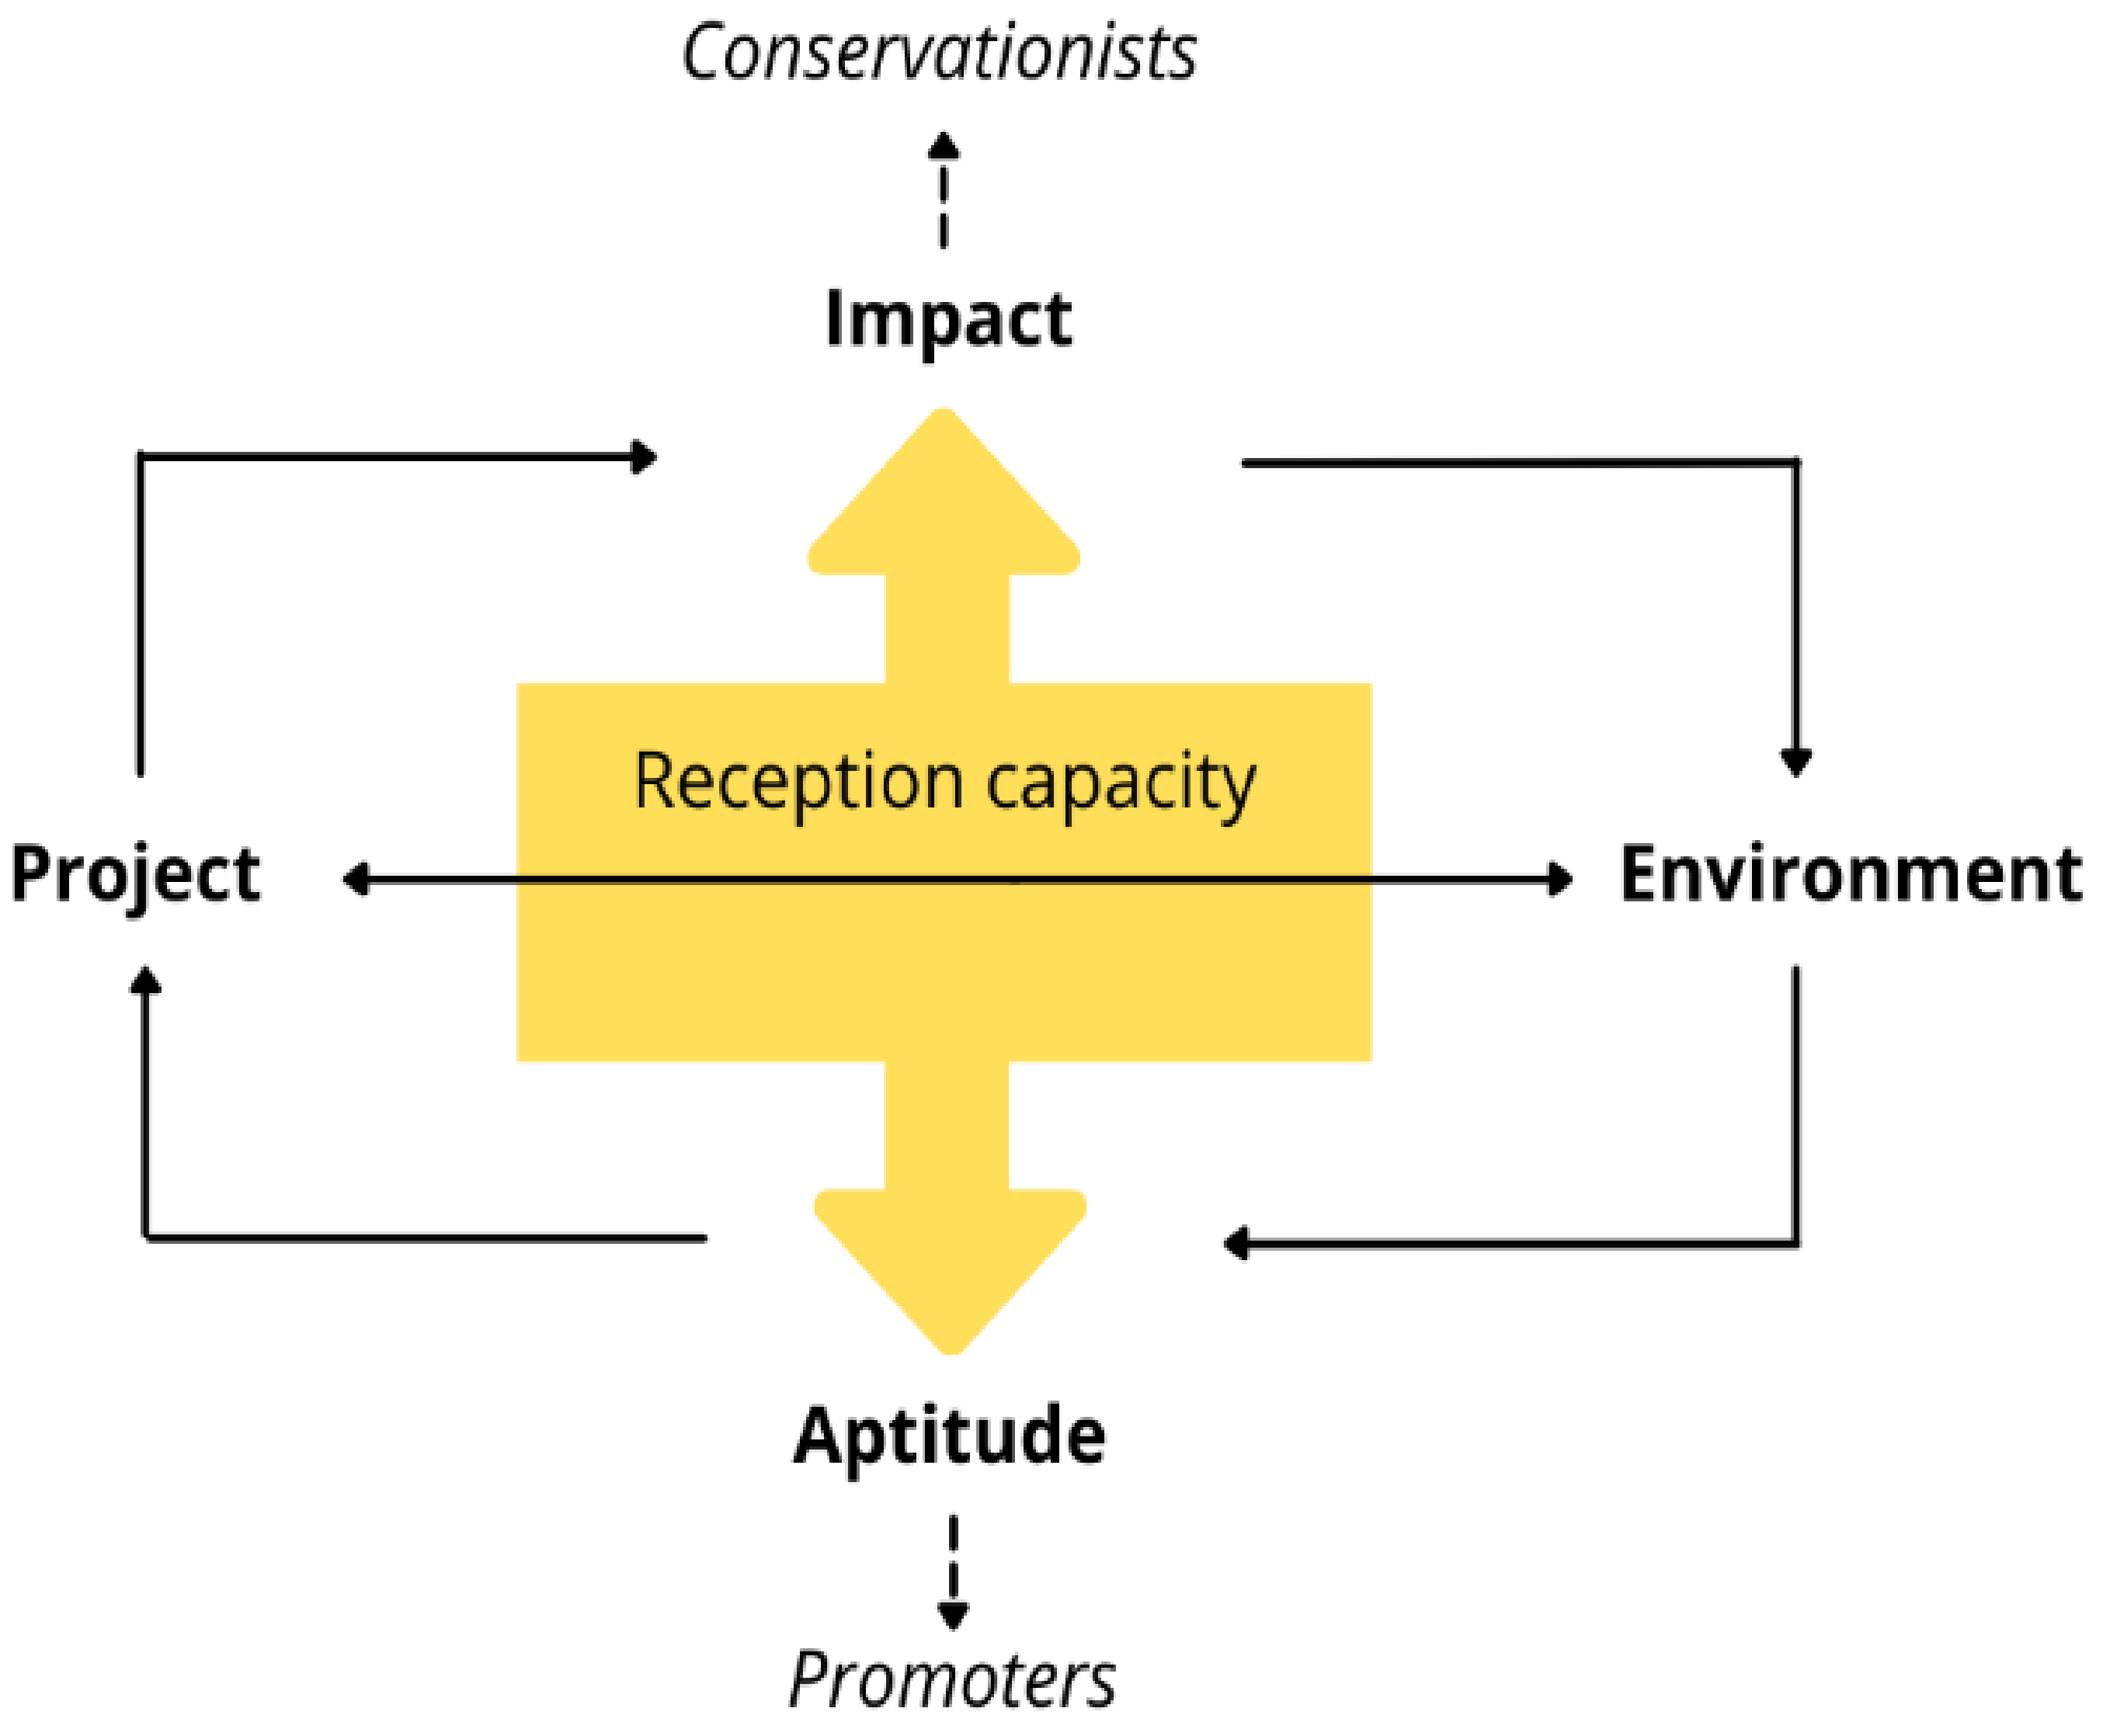
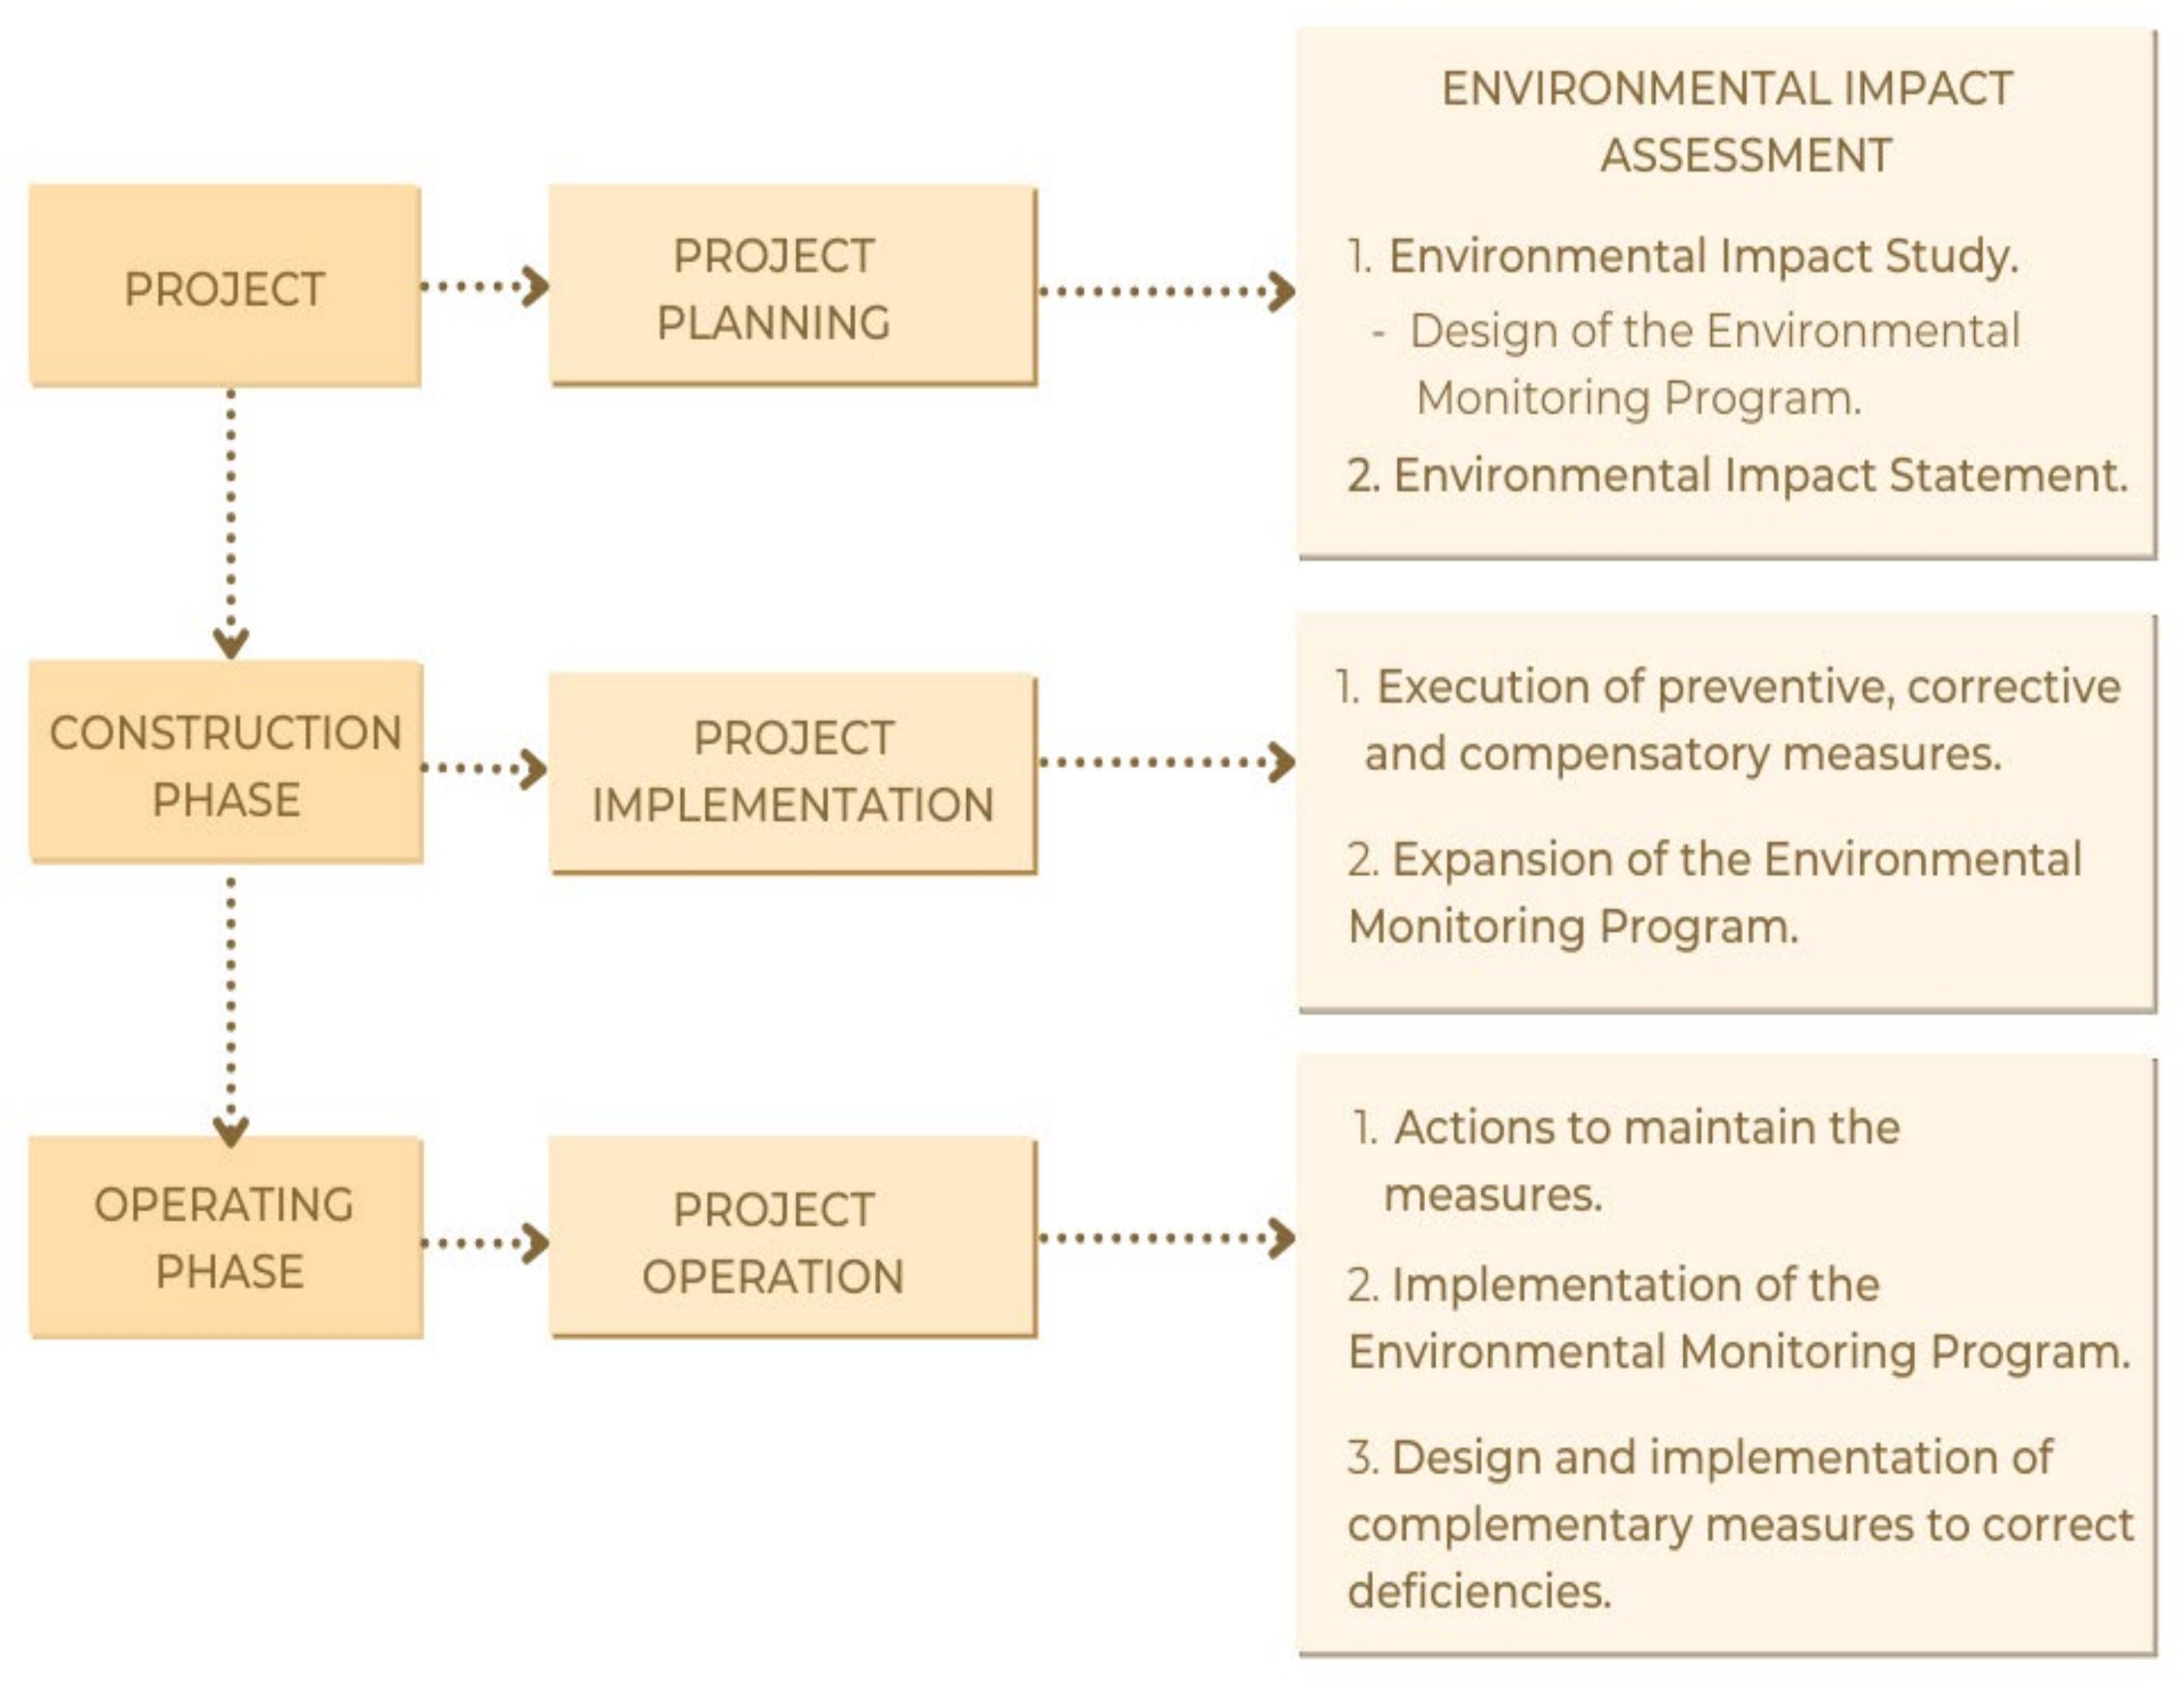
2.3. E.I.A framework in Castilla—La Mancha
3. Results Analysis and Discussion
3.1. CPBT and EROI Calculation
3.2. E.I.A Findings and Analysis
- Effects on the atmosphere: Within the construction phase (earthmoving, dust raising, removal of vegetation cover) it is noted that a PV plant is “compatible and moderate” where these effects are immediate, direct, and continuous during the initial phase, but are reversible, recoverable, and not very persistent.
- Effects on soil and subsoil: Due to earthworks and contamination by pile-driving or foundations, a high rating was observed in different reports, especially for occupation and compaction, including incorporating of exterior materials, soil mixing, etc. The average importance of the erosion factor was tolerable and moderate, derived from temporary actions. However, this is susceptible to the initial state of the soil for the project, where 0–12 tha/yr is a low value, 12–25 tha/yr is medium, and >25 tha/yr is considered high.
- Effects on water: In terms of possible contamination of surface and groundwater, PV power plants that include preventive measures do not have a predominant impact, since this contamination can only occur due to construction actions, such as: earth movements (possible dragging of material) and the presence of machinery (accidental spills), and not due to any polluting compound related to energy generation and necessary for its operation, as occurs in fossil fuel power plants.
- Effects on fauna: The temporary absence of vegetation on some plants means a loss of space that provides shelter and food for numerous fauna species, which leads to the displacement or reduction of species in that space. In terms of disturbances caused by noise, there is an immediate flight reaction in vertebrates, and certain birds move away.
- During the operation phase, due to the plant’s operability and the reduced availability of space due to the intrusion of foreign elements (fencing and photovoltaic solar panels), a barrier effect and habitat alteration maybe be created, impacting the fauna. This matter should be studied in detail to verify its real scope. These impacts can be contained if prior environmental monitoring of the populations is carried out to avoid affecting them and consider carrying out the work outside the breeding, nesting, and rearing seasons (March–July). During the operation stage, the risk of collision presented by the solar panels for birds and bats is low, although not impossible.
- Effects on the landscape: In the construction phase, the previous analysis in the environmental inventory is considered, i.e., concerning the previous state of the landscape unit where the project is installed, a minor or major effect on the different landscapes will be obtained. In this phase, this effect was considered compatible or not significant. However, in the operation phase, with the view of the solar panels, inverters, roads, and enclosures, the visual impact will be greater according to the surface area of the photovoltaic projects and the larger it is, and is considered permanent for the 25–30 years of its life cycle. It is concluded that there may be an accumulation with other nearby solar plants or other existing power lines, and in general, there is a moderate impact.
- Effects or nuisances on the population: They are considered compatible or not significant.
- Effects on the economy: There is a contribution of the project works and its operation or maintenance to economic development, where there is a great impact on the rural economy and a significant positive impact of this value. On the other hand, the loss of soil productivity can be related to the paralysis or hindrance of the normal development of agricultural activities on land near the PV plant. This effect can be moderate in certain facilities. The section of new energy resource is also considered, where its installation means using an autochthonous and inexhaustible resource, thus avoiding the burning of fossil fuels.
- Effects on the territory: In the case of property, hunting, or agricultural areas, it is considered that since the land is not used due to the occupation of the solar plant, there is a moderate impact due to the permanent, irreversible, and continuous effects.
- Effects on cultural heritage: Due to possible architectural findings during earthworks, this effect is considered; however, it is considered insignificant in most studies and is not predominant in the impacts of PV power plants.
4. Conclusions
Author Contributions
Funding
Data Availability Statement
Acknowledgments
Conflicts of Interest
Appendix A

| Province | Name of Project | Project ID | Installed Power (MW) | Project Area (hectare) | Location | Modules Quantity | Module Type | Power (Wp) | Dimensions Lenght × Width (mm) | |
|---|---|---|---|---|---|---|---|---|---|---|
| Albacete | Planta solar Fotovoltaica Los crespos | ALB 1 | 20.00 | 50.2 | Almansa, Albacete | 51.298 | Monocrystalline | 340 | 1956 | 992 |
| Planta solar fotovoltaica “Virgen de Belén” | ALB 2 | 4.90 | 15.27 | Almansa, Albacete | 13,338 | Monocrystalline | 450 | 2205 | 1032 | |
| Planta solar fotovoltaica Almansol i | ALB 3 | 49.99 | 99.31 | Bonete, Albacete | 147,030 | Polycrystalline | 450 | 1956 | 992 | |
| Ciudad Real | Planta solar Fotovoltaica de 19.99 MW | CR 1 | 19.99 | 41.78 | Ciudad Real, Ciudad Real | 57,120 | Polycrystalline | 350 | 1956 | 992 |
| Planta solar Fotovoltaica “Perseo fotón III” | CR 2 | 36.10 | 80.79 | Manzanares, Ciudad Real | 91,408 | Monocrystalline | 395 | 2015 | 996 | |
| Planta solar Fotovoltaica 50 MW Antilia Solar | CR 3 | 49.90 | 26.51 | Puertollano, Ciudad Real | 133,272 | Monocrystalline | 375 | 1755 | 1038 | |
| Cuenca | Planta fotovoltaica Bañuela 49.98 MWp | CU 1 | 49.98 | 85.00 | Altarejos, Cuenca | 135,090 | Monocrystalline | 370 | 1977 | 996 |
| Planta fotovoltaica Escuderos I | CU 2 | 49.99 | 98.50 | Torrejoncillo del Rey, Cuenca | 131,544 | Monocrystalline | 380 | 2010 | 992 | |
| Planta solar Fotovoltaica “Romeral” | CU 3 | 50.00 | 76.64 | Alarcón, Cuenca | 149,234 | Monocrystalline | 335 | 1960 | 992 | |
| Guadalajara | Planta solar Fotovoltaica Canredondo | GJ 1 | 22.00 | 64.60 | Canredondo, Guadalajara | 66,640 | Polycrystalline | 330 | 1956 | 992 |
| Planta solar Fotovoltaica Cañamares | GJ 2 | 5.00 | 11.80 | Fontanar, Guadalajara | 15,150 | Polycrystalline | 330 | 1960 | 990 | |
| Planta solar Fotovoltaica Puerta del sol | GJ 3 | 49.98 | 78.73 | Galapagos, Guadalajara | 142,800 | Monocrystalline | 350 | 1956 | 992 | |
| Toledo | Planta solar Fotovoltaica El Pensamiento | TD 1 | 5.00 | 9.44 | Cebolla, Toledo | 10,846 | Monocrystalline | 460 | 2182 | 1029 |
| Parque solar “Escalonilla este” | TD 2 | 3.63 | 21.96 | Escalonilla, Toledo | 12,330 | Polycrystalline | 340 | 2000 | 992 | |
| Planta FV AR Recas Solar 2 MW | TD 3 | 2.20 | 5.04 | Recas, Toledo | 6400 | Polycrystalline | 345 | 1300 | 790 | |
| Province | Project ID | PV Panels Ocuppied Area (m2) | Emissions from Panels Production (ktCO2eq) | Emissions from Panels Recycling (kgCO2eq) | Inverters Quantity | Inverters Power (kW) | Inverters Emissions (kgCO2e) | Energy Generated (MWh/Year) | Emissions Avoided (ktCO2e/Year) | Carbon Dioxide Payback Time (Years) |
|---|---|---|---|---|---|---|---|---|---|---|
| Albacete | ALB 1 | 99,739 | 21.24 | 455,526 | 112 | 19,600 | 580,160 | 33,480 | 13.20 | 1.69 |
| ALB 2 | 30,351 | 6.46 | 118,441 | 28 | 5180 | 153,328 | 11,280 | 4.45 | 1.51 | |
| ALB 3 | 285,289 | 60.77 | 1,305,626 | 30 | 3672 | 108,691 | 107,000 | 42.19 | 1.47 | |
| Ciudad Real | CR 1 | 114,300 | 24.35 | 507,225 | 7 | 17,200 | 509,120 | 34,834 | 13.74 | 1.85 |
| CR 2 | 183,450 | 39.07 | 811,703 | 12 | 24,240 | 717,504 | 73,078 | 28.81 | 1.41 | |
| CR 3 | 242,780 | 51.71 | 1,183,455 | 8 | 22,760 | 673,696 | 81,441 | 32.11 | 1.67 | |
| Cuenca | CU 1 | 266,004 | 56.66 | 1,199,599 | 30 | 1351 | 39,995 | 98,807 | 38.96 | 1.49 |
| CU 2 | 262,288 | 55.87 | 1,168,110 | 14 | 46,200 | 1,367,520 | 95,000 | 37.46 | 1.56 | |
| CU 3 | 290,158 | 61.80 | 1,325,197 | 12 | 42,000 | 1,243,200 | 81,312 | 32.06 | 2.01 | |
| Guadalajara | GJ 1 | 129,305 | 27.54 | 591,763 | 12 | 14,746 | 436,469 | 36,866 | 14.54 | 1.97 |
| GJ 2 | 29,397 | 6.26 | 134,532 | 2 | 5000 | 148,000 | 8101 | 3.19 | 2.05 | |
| GJ 3 | 277,082 | 59.02 | 1,268,064 | 20 | 27,006 | 799,377 | 96,380 | 38.00 | 1.61 | |
| Toledo | TD 1 | 24,352 | 5.19 | 96,312 | 4 | 5332 | 157,827 | 10,301 | 4.11 | 1.32 |
| TD 2 | 24,462 | 5.21 | 109,490 | 25 | 3300 | 97,680 | 8753 | 3.45 | 1.57 | |
| TD 3 | 6572 | 1.40 | 56,832 | 20 | 2200 | 65,120 | 2244 | 0.86 | 1.77 |
| Province | Name of Project | Energy from Panels Production (MJ) | Energy from Panels Recycling (MJ) | Inverters Power (kW) | Energy from Inverters (MJ) | Generated Energy in MWh/Year | Generated Energy for 25 Years (MWh) | MJ of Energy Produced from PV Systems (25 Years) | MJ from Craddle to Grave | EROI |
|---|---|---|---|---|---|---|---|---|---|---|
| Albacete | ALB 1 | 3.63 × 10⁸ | 3.42 × 10⁶ | 1.96 × 10⁴ | 9.64 × 10⁶ | 3.35 × 10⁴ | 7.90 × 10⁵ | 2.84 × 10⁹ | 1.53 × 10⁹ | 7.56 |
| ALB 2 | 1.10 × 10⁸ | 8.90 × 10⁵ | 5.18 × 10³ | 2.55 × 10⁶ | 1.13 × 10⁴ | 2.66 × 10⁵ | 9.58 × 10⁸ | 1.14 × 10⁸ | 8.41 | |
| ALB 3 | 1.04 × 10⁹ | 9.81 × 10⁶ | 3.67 × 10³ | 1.81 × 10⁶ | 1.07 × 10⁵ | 2.52 × 10⁶ | 9.08 × 10⁹ | 1.05 × 10⁹ | 8.65 | |
| Ciudad Real | CR 1 | 4.16 × 10⁸ | 3.81 × 10⁶ | 1.72 × 10⁴ | 8.46 × 10⁶ | 3.48 × 10⁴ | 8.22 × 10⁵ | 2.96 × 10⁹ | 4.28 × 10⁸ | 6.9 |
| CR 2 | 6.68 × 10⁸ | 6.10 × 10⁶ | 2.42 × 10⁴ | 1.19 × 10⁷ | 7.31 × 10⁴ | 1.72 × 10⁶ | 6.20 × 10⁹ | 6.86 × 10⁸ | 9.05 | |
| CR 3 | 8.84 × 10⁸ | 8.89 × 10⁶ | 2.28 × 10⁴ | 1.12 × 10⁷ | 8.14 × 10⁴ | 1.92 × 10⁶ | 6.91 × 10⁹ | 9.04 × 10⁸ | 7.65 | |
| Cuenca | CU 1 | 9.68 × 10⁸ | 9.01 × 10⁶ | 1.35 × 10³ | 6.65 × 10⁵ | 9.88 × 10⁴ | 2.33 × 10⁶ | 8.39 × 10⁹ | 9.78 × 10⁸ | 8.58 |
| CU 2 | 9.55 × 10⁸ | 8.78 × 10⁶ | 4.62 × 10⁴ | 2.27 × 10⁷ | 9.50 × 10⁴ | 2.24 × 10⁶ | 8.07 × 10⁹ | 9.86 × 10⁸ | 8.18 | |
| CU 3 | 1.06 × 10⁹ | 9.96 × 10⁶ | 4.20 × 10⁴ | 2.07 × 10⁷ | 8.13 × 10⁴ | 1.92 × 10⁶ | 6.90 × 10⁹ | 1.09 × 10⁹ | 6.35 | |
| Guadalajara | GJ 1 | 4.71 × 10⁸ | 4.45 × 10⁶ | 1.47 × 10⁴ | 7.25 × 10⁶ | 3.69 × 10⁴ | 8.69 × 10⁵ | 3.13 × 10⁹ | 4.82 × 10⁸ | 6.49 |
| GJ 2 | 1.07 × 10⁸ | 1.01 × 10⁶ | 5.00 × 10³ | 2.46 × 10⁶ | 8.10 × 10³ | 1.91 × 10⁵ | 6.88 × 10⁸ | 1.10 × 10⁸ | 6.23 | |
| GJ 3 | 1.01 × 10⁹ | 9.53 × 10⁶ | 2.70 × 10⁴ | 1.33 × 10⁷ | 9.64 × 10⁴ | 2.27 × 10⁶ | 8.18 × 10⁹ | 1.03 × 10⁹ | 7.93 | |
| Toledo | TD 1 | 8.86 × 10⁷ | 7.24 × 10⁵ | 5.33 × 10³ | 2.62 × 10⁶ | 1.03 × 10⁴ | 2.43 × 10⁵ | 8.75 × 10⁸ | 9.20 × 10⁷ | 9.51 |
| TD 2 | 8.90 × 10⁷ | 8.23 × 10⁵ | 3.30 × 10³ | 1.62 × 10⁶ | 8.75 × 10³ | 2.06 × 10⁵ | 7.43 × 10⁸ | 9.15 × 10⁷ | 8.12 | |
| TD 3 | 3.63 × 10⁸ | 3.42 × 10⁶ | 1.96 × 10⁴ | 9.64 × 10⁶ | 3.35 × 10⁴ | 7.90 × 10⁵ | 2.84 × 10⁹ | 1.53 × 10⁹ | 7.56 |
| Environmental Factors | Actions | Planta Solar Fotovoltaica Los Crespos (ALB1) [35] | Planta Solar Fotovoltaica PF Virgen de Belén (ALB2) [36] | Planta Solar Fotovoltaica Almansol I (ALB3) [37] | Planta de Energía Solar Perseo Fotón (CR2) [38] | Planta FV Bañuela (CU1) [39] | Planta FV Escuderos I (CU2) [40] | Planta Solar Romeral (CU3 ) [41] | Planta Puerta del Sol (GJ3) [42] | Planta FV AR Recas Solar (TD3) [43] | Average Importance (I) | |
|---|---|---|---|---|---|---|---|---|---|---|---|---|
| Natural environment | Effects on the atmosphere | Air quality and climate change | −74 | −74 | −79 | −205 | −24 | −87 | −78 | −75 | −49 | −82.78 |
| Noise | −19 | −19 | −53 | −77 | −31 | −57 | −22 | −22 | −22 | −35.78 | ||
| Effects on soil | Occupation and compaction | −126 | −126 | −138 | −68 | −138 | −135 | −132 | −132 | −124 | −124.33 | |
| Soil and subsoil contamination | −48 | −48 | −64 | −150 | −40 | −70 | −55 | −55 | −54 | −64.89 | ||
| Geomorphological and relief alteration | −65 | −65 | −61 | −40 | −36 | −67 | −69 | −63 | −61 | −58.56 | ||
| Erosion and loss of fertile soil | −98 | −98 | −118 | - | −39 | −133 | −115 | −112 | −111 | −91.56 | ||
| Effects on water | Surface and groundwater quality | −43 | −43 | −40 | −137 | −40 | −46 | −40 | −40 | - | −53.63 | |
| Change of use and consumption | 0 | 0 | - | - | - | - | 0 | 0 | - | 0.00 | ||
| Effects on vegetation | Elimination of vegetation cover | −95 | −95 | −93 | −123 | −29 | −102 | −97 | −94 | −88 | −90.67 | |
| Impact on habitats of community interest | 0 | 0 | 0 | - | 0 | −120 | 0 | 0 | 0 | −15.00 | ||
| Effects on fauna | Alteration and elimination of wildlife habitats | − 31 | −31 | 0 | −108 | −38 | −80 | −40 | −37 | −34 | −44.33 | |
| Disturbance | −32 | −32 | −38 | - | - | −38 | −38 | −35 | −24 | −33.86 | ||
| Mortality | −26 | −26 | 0 | - | - | −23 | −23 | −23 | −29 | −21.43 | ||
| Effects on the landscape | Visual intrusion and effects on landscape quality | −62 | −62 | −67 | −33 | 0 | −73 | −66 | −63 | −69 | −55.00 | |
| Economic environment | Effects on the population | Increased traffic | −24 | −24 | −24 | −44 | - | −24 | −24 | −24 | −24 | −26.50 |
| Disturbance to the population | −18 | −18 | −21 | 0 | - | −24 | −21 | −21 | −22 | −18.13 | ||
| Effects on the economy | Economic development | 28 | 28 | 40 | 147 | 40 | 40 | 52 | 49 | 37 | 51.22 | |
| Soil productivity | −32 | −32 | −35 | - | - | 0 | −35 | −32 | 0 | −23.71 | ||
| Energy resources | 0 | 0 | 0 | 0 | - | 0 | 0 | 0 | 0 | 0.00 | ||
| Effects on the territory | Impact on property | −31 | −31 | −31 | - | - | −34 | −31 | −31 | −32 | −31.57 | |
| Impact on hunting resources | −24 | −24 | −31 | - | - | −34 | −27 | −27 | −26 | −27.57 | ||
| Impact on protected areas | −31 | 0 | 0 | - | - | 0 | 0 | 0 | 0 | −4.43 | ||
| Effects on cultural heritage | Impact on B.I.C. and archaeological remains | 0 | 0 | −22 | −49 | 0 | 0 | −22 | −22 | 0 | −12.78 | |
| Vulnerability | Risks | Flood risk | 0 | 0 | - | - | 0 | - | - | - | - | 0.00 |
| Seismic risk | 0 | 0 | - | - | 0 | - | - | - | - | 0.00 | ||
| Meteorological risks | 0 | 0 | - | - | 0 | - | - | - | - | 0.00 | ||
| Forest fire risk | 0 | 0 | - | - | 0 | - | - | - | - | 0.00 | ||
| Absolute value of importance | −851 | −820 | −875 | −887 | −375 | −1107 | −883 | −859 | −732 | −821 | ||
| Environmental Factors | Actions | Planta Solar Fotovoltaica Los Crespos (ALB1) [35] | Planta Solar Fotovoltaica PF Virgen de Belén (ALB2) [36] | Planta Solar Fotovoltaica Almansol I (ALB3) [37] | Planta de Energía Solar Perseo Fotón (CR2) [38] | Planta FV Bañuela (CU1) [39] | Planta FV Escuderos I (CU2) [40] | Planta Solar Romeral (CU3) [41] | Planta Puerta del Sol (GJ3) [42] | Planta FV AR Recas Solar (TD3) [43] | Average Importance (I) | |
|---|---|---|---|---|---|---|---|---|---|---|---|---|
| Natural environment | Effects on the atmosphere | Air quality and climate change | 35 | 35 | 32 | 0 | 32 | 35 | 35 | 35 | 33 | 34.00 |
| Noise | −18 | −18 | −23 | 0 | - | −20 | −23 | −23 | −21 | −18.25 | ||
| Effects on soil | Occupation and compaction | −22 | −22 | −23 | −48 | −23 | −26 | −24 | −24 | −22 | −26.00 | |
| Soil and subsoil contamination | −21 | −21 | −21 | −26 | −21 | −24 | −21 | −21 | −22 | −22.00 | ||
| Geomorphological and relief alteration | 0 | 0 | 0 | 0 | - | 0 | 0 | 0 | 0 | 0.00 | ||
| Erosion and loss of fertile soil | 0 | 0 | 0 | - | - | 0 | 0 | 0 | 23 | 3.83 | ||
| Effects on water | Surface and groundwater quality | 0 | 0 | 0 | −24 | - | 42 | 0 | 0 | - | 2.57 | |
| Change of use and consumption | 0 | 0 | - | - | - | - | 42 | 42 | - | 21.00 | ||
| Effects on vegetation | Elimination of vegetation cover | 0 | 0 | 0 | 0 | - | 0 | 0 | 0 | 0 | 0.00 | |
| Impact on habitats of community interest | 0 | 0 | 0 | - | - | 0 | 0 | 0 | 0 | 0.00 | ||
| Effects on fauna | Alteration and elimination of wildlife habitats | −46 | −40 | −47 | −24 | −48 | −44 | −44 | −44 | −32 | −41.00 | |
| Disturbance | −21 | −21 | −21 | - | −21 | −21 | −21 | −21 | −21 | −21.00 | ||
| Mortality | −34 | −34 | −62 | - | −45 | −68 | −36 | −36 | −35 | −38.89 | ||
| Effects on the landscape | Visual intrusion and effects on landscape | −40 | −40 | −46 | −35 | −58 | −44 | −40 | −40 | −40 | −42.56 | |
| Economic environment | Effects on the population | Increased traffic | 0 | 0 | 0 | −17 | - | 0 | 0 | 0 | 0 | −2.13 |
| Disturbance to the population | 0 | 0 | 0 | −50 | - | 0 | 0 | 0 | 0 | −5.56 | ||
| Effects on the economy | Economic development | 34 | 34 | 40 | 0 | 40 | 43 | 43 | 43 | 44 | 35.67 | |
| Soil productivity | −21 | −21 | −22 | - | −22 | −25 | −22 | −22 | −24 | −22.38 | ||
| Energy resources | 38 | 38 | 35 | 27 | 35 | 38 | 38 | 38 | 38 | 36.11 | ||
| Effects on the territory | Impact on property | −32 | −32 | 0 | - | - | 0 | −32 | −32 | −32 | −22.86 | |
| Impact on hunting resources | 0 | 0 | 0 | - | - | 0 | 0 | 0 | 0 | 0.00 | ||
| Impact on protected areas | 0 | 0 | 0 | - | 0 | 0 | 0 | 0 | 0 | 0.00 | ||
| Effects on cultural heritage | Impact on B.I.C. and archaeological remains | 0 | −22 | 0 | 0 | - | 0 | 0 | 0 | 0 | −2.75 | |
| Vulnerability | Risks | Flood risk | −22 | −22 | - | - | - | - | - | - | −19 | −21.00 |
| Seismic risk | −19 | −19 | - | - | - | - | - | - | −22 | −20.00 | ||
| Meteorological risks | −20 | −20 | - | - | - | - | - | - | −20 | −20.00 | ||
| Forest fire risk | −24 | −24 | - | - | - | - | - | - | −24 | −24.00 | ||
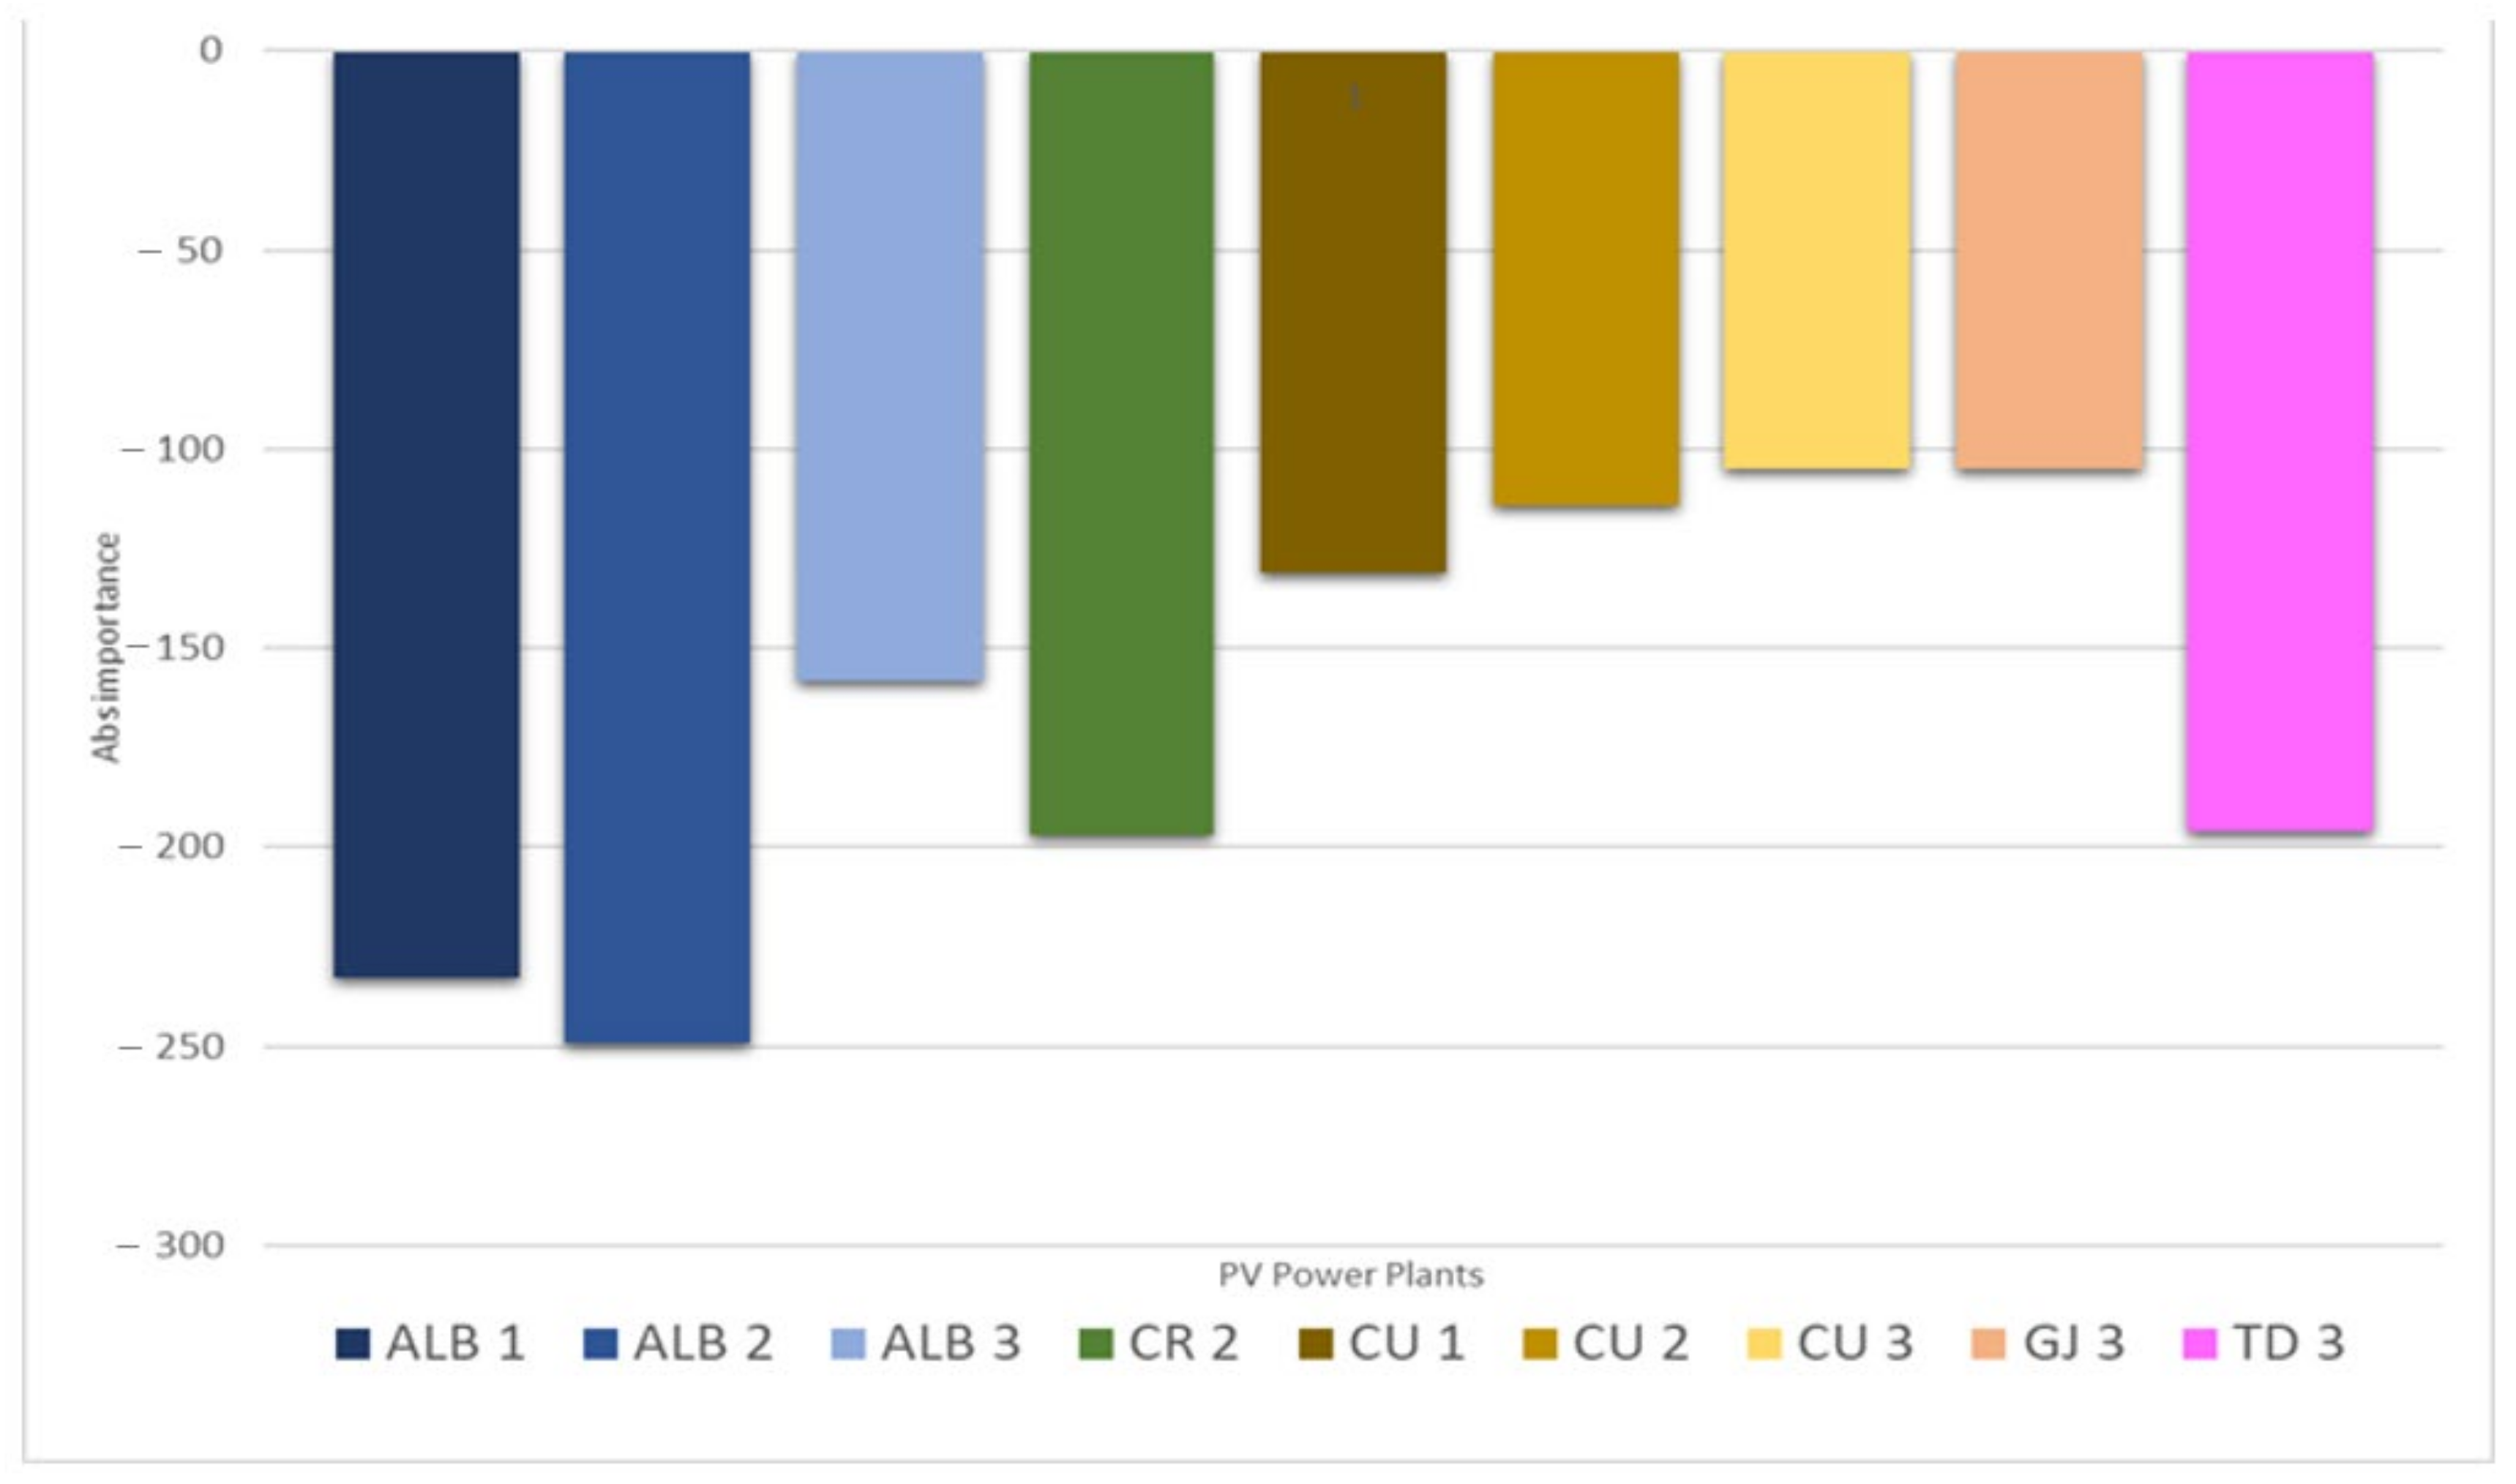
| Absolute value of importance | −233 | −249 | −158 | −197 | −131 | −114 | −105 | −105 | −196 | −165.33 | ||
References
- Touza, L.L. Cambio climático 2020: Ciencia, tras el maratón COP 25, el Pacto Verde Europeo y legislación climática en España. Real Inst. Elcano 2020, 1, 17. [Google Scholar]
- Snapshot. 2020. Available online: https://iea-pvps.org/snapshot-reports/snapshot-2020/ (accessed on 23 November 2021).
- International Energy Agency. National Survey Report of PV Power Applications in Spain; International Energy Agency: Paris, France, 2019; p. 23. [Google Scholar]
- Martínez Maturana, M.C. Análisis de Ciclo de Vida de la Generación de Energía Eléctrica con Carbón y Paneles Fotovoltaicos. Undergraduate Thesis, Universidad Politécnica de Madrid, Madrid, Spain, 2018. Available online: https://oa.upm.es/52766/1/PFG_Maria_Cristina_Martinez_Maturana.pdf (accessed on 28 September 2021).
- Impactos del Cambio Climático en Castilla-La Mancha|Gobierno de Castilla-La Mancha. Available online: https://www.castillalamancha.es/gobierno/desarrollosostenible/estructura/dgecocir/actuaciones/impactos-del-cambio-clim%C3%A1tico-en-castilla-la-mancha (accessed on 26 October 2021).
- Espejo-Marín, C.; Aparicio-Guerrero, A.E. La Producción de Electricidad con Energía Solar Fotovoltaica en España en el Siglo XXI. Rev. Estud. Andal. 2020, 39, 66–93. [Google Scholar] [CrossRef]
- Raptis, F.; Sachau, J.; Kaspar, F. Assessment of the External Costs of the Photovoltaic and Wind Energy Life Cycle—National Implementation in Germany; DG XII, JOULE, ISET: Kassel, Germany, 1995. [Google Scholar]
- Tsoutsos, T.; Frantzeskaki, N.; Gekas, V. Environmental impacts from the solar energy technologies. Energy Policy 2005, 33, 289–296. [Google Scholar] [CrossRef]
- Castilla-La Mancha Logró Aumentar un 56% su Generación de Energía Fotovoltaica en 2020. 2021. Available online: https://energiacastillalamancha.net/2021/09/20/castilla-la-mancha-logro-aumentar-un-56-su-generacion-de-energia-fotovoltaica-en-2020/ (accessed on 26 October 2021).
- Bachiller, C. Así es el Nuevo Modelo Energético de Castilla-La Mancha para Reducir Más del 35% el Consumo y las Emisiones en 2030. Available online: https://www.eldiario.es/castilla-la-mancha/nuevo-modelo-energetico-castilla-mancha-reducir-35-consumo-emisiones-2030_1_8181604.html (accessed on 23 November 2021).
- Departamento de Ciencia y Tecnología Agroforestal y Genética, Escuela Técnica Superior de Ingenieros Agrónomos de Albacete; Sección de Medio Ambiente, Instituto de Investigación en Energías Renovables, Universidad de Castilla-La Mancha, Consejería de Agricultura y Medio Ambiente, Junta de Comunidades de Castilla-La Mancha. Guía Orientativa sobre Evaluación, Seguimiento y Vigilancia de Impacto Ambiental en Castilla-La Mancha; Departamento de Ciencia y Tecnología Agroforestal y Genética, Escuela Técnica Superior de Ingenieros Agrónomos de Albacete; Sección de Medio Ambiente, Instituto de Investigación en Energías Renovables, Universidad de Castilla-La Mancha, Consejería de Agricultura y Medio Ambiente, Junta de Comunidades de Castilla-La Mancha: Albacete, Spain, 2011. [Google Scholar]
- Todde, G.; Murgia, L.; Carrelo, I.; Hogan, R.; Pazzona, A.; Ledda, L.; Narvarte, L. Embodied Energy and Environmental Impact of Large-Power Stand-Alone Photovoltaic Irrigation Systems. Energies 2018, 11, 2110. [Google Scholar] [CrossRef] [Green Version]
- National Renewable Energy Laboratory Life Cycle Greenhouse Gas Emissions from Solar Photovoltaics. 2012. Available online: https://www.nrel.gov/docs/fy13osti/56487.pdf (accessed on 29 September 2021).
- Andrés Abellán, M.; García Morote, F.A. La Evaluación del Impacto Ambiental de Proyectos y Actividades Agroforestales; Ediciones de la Universidad de Castilla—La Mancha: Cuenca, Spain, 2006. [Google Scholar]
- Kumar, N.M.; Chopra, S.S.; de Oliveira, A.K.V.; Ahmed, H.; Vaezi, S.; Madukanya, U.E.; Castañón, J.M. Chapter 3—Solar PV module technologies. In Photovoltaic Solar Energy Conversion; Gorjian, S., Shukla, A., Eds.; Academic Press: Cambridge, MA, USA, 2020; pp. 51–78. ISBN 978-012-819-610-6. [Google Scholar]
- Benda, V.; Černá, L. PV cells and modules—State of the art, limits and trends. Heliyon 2020, 6, e05666. [Google Scholar] [CrossRef] [PubMed]
- Kang, H. Crystalline Silicon vs. Amorphous Silicon: The Significance of Structural Differences in Photovoltaic Applications. IOP Conf. Ser. Earth Environ. Sci. 2021, 726, 012001. [Google Scholar] [CrossRef]
- Parida, B.; Iniyan, S.; Goic, R. A review of solar photovoltaic technologies. Renew. Sustain. Energy Rev. 2011, 15, 1625–1636. [Google Scholar] [CrossRef]
- [Comparison] Monocrystalline vs Polycrystalline Solar Panels. Available online: https://solarmagazine.com/solar-panels/monocrystalline-vs-polycrystalline-solar-panels/ (accessed on 11 February 2022).
- Shockley, W.; Queisser, H.J. Detailed Balance Limit of Efficiency of p-n Junction Solar Cells. J. Appl. Phys. 1961, 32, 510–519. [Google Scholar] [CrossRef]
- Langner, A. Photovoltaics Report; Fraunhofer Institute for Solar Energy Systems: Freiburg, Germany, 2021; p. 50. [Google Scholar]
- IEA. Global Energy Review: CO2 Emissions in 2020—Analysis. Available online: https://www.iea.org/articles/global-energy-review-co2-emissions-in-2020 (accessed on 18 November 2021).
- Richardson, H. Lifecycle and Avoided Emissions of Solar Technologies. WattTime. 2020. Available online: https://www.watttime.org/app/uploads/dlm_uploads/2020/02/WattTime-SolarPVAvoidedAndEmbodiedEmissionsAnalysis-Report-202002-FINAL.pdf (accessed on 5 October 2021).
- Bhandari, K.P.; Collier, J.M.; Ellingson, R.J.; Apul, D.S. Energy payback time (EPBT) and energy return on energy invested (EROI) of solar photovoltaic systems: A systematic review and meta-analysis. Renew. Sustain. Energy Rev. 2015, 47, 133–141. [Google Scholar] [CrossRef]
- Instituto Nacional de Estadística, España. Anuarios Estadísticos de España; Instituto Nacional de Estadística, España: Madrid, Spain, 2021; Available online: https://www.ine.es/prodyser/pubweb/anuarios_mnu.htm (accessed on 23 November 2021).
- El “Boom” de la Energía Fotovoltaica en Castilla-La Mancha. Available online: https://www.abc.es/espana/castilla-la-mancha/abci-boom-energia-fotovoltaica-castilla-la-mancha-202103072044_noticia.html (accessed on 23 November 2021).
- REData—No Renovables Detalle Emisiones CO2|Red Eléctrica de España. Available online: https://www.ree.es/es/datos/generacion/no-renovables-detalle-emisiones-CO2 (accessed on 23 November 2021).
- Solar Reviews. How long Do Solar Panels Actually Last? Available online: https://www.solarreviews.com/content/blog/how-long-do-solar-panels-last (accessed on 23 November 2021).
- Energy Return on Investment—World Nuclear Association. Available online: https://world-nuclear.org/information-library/energy-and-the-environment/energy-return-on-investment.aspx (accessed on 23 November 2021).
- Alsema, E.A. Energy Pay-Back Time and CO2 Emissions of Photovoltaic Systems; Markvart, T., Castaner, L., Eds.; Elsevier: Amsterdam, The Netherlands, 2003; pp. 869–887. [Google Scholar]
- Weißbach, D.; Ruprecht, G.; Huke, A.; Czerski, K.; Gottlieb, S.; Hussein, A. Energy intensities, EROIs (energy returned on invested), and energy payback times of electricity generating power plants. Energy 2013, 52, 210–221. [Google Scholar] [CrossRef]
- Kivisto, A. Energy payback period & CO2 emissions in different power generation methods in Finland. In Proceedings of the International Association of Energy Economics Conference, Washington, DC, USA, 31 December 1995. [Google Scholar]
- Información de Proyectos. Available online: https://neva.jccm.es/nevia/forms/nevif101.php (accessed on 29 November 2021).
- Metodología para el Calculo de las Matrices Ambientales.pdf. Available online: http://www.ambiente.chubut.gov.ar/wp-content/uploads/2015/01/Metodolog%C3%ADa-para-el-Calculo-de-las-Matrices-Ambientales.pdf (accessed on 3 February 2022).
- Navarro, A. Estudio de Impacto Ambiental. Planta Solar Fotovoltaica De 20 Mw “Pf Los Crespos”; Proyecta 79 S.L.: Albacete, Spain, 2020; p. 740. [Google Scholar]
- Roldán Arroyo, J.M.; Manjabacas Arroyo, E.; Serna García, V. Documento Ambiental para Actividades del Anexo II. Planta Solar Fotovoltaica “Pf Virgen De Belén” DE 4,9 MW; IdeasMedioambientales: Albacete, Spain, 2021; p. 160. [Google Scholar]
- Monteagudo Martínez, L.A. Información Complementaria al Documento de EIA. Planta Solar Fotovoltaica Almansol I 49,995 Mw; IdeasMedioambientales: Albacete, Spain, 2018; p. 252. [Google Scholar]
- Castroviejo, R. Estudio De Impacto Ambiental Planta De Energía Solar Fotovoltaica “Perseo Fotón III”, DE 36,1 MW, En Manzanares; ICMA: Ciudad Real, Spain, 2020; p. 377. [Google Scholar]
- Ortega Cifuentes, J. Estudio de Impacto Ambiental de “Planta Fotovoltaica Bañuela 49,98 MWp”; IdeasMedioambientales: Altarejos, Spain, 2018; p. 237. [Google Scholar]
- Hernández Murat, R.; Monteagudo Martínez, L.A. Estudio de Impacto Ambiental de Planta Fotovoltaica Escuderos I 49,99 MWp, Linea De Evacuación Y Subestación 132/30 kV; IdeasMedioambientales: Cuenca, Spain, 2019; p. 424. [Google Scholar]
- Ortega Cifuentes, J.; Monteagudo Martínez, L.A. Estudio de Impacto Ambiental de Planta Solar Fotovoltaica “Romeral” 50 MW E Infraestructuras De Evacuación; IdeasMedioambientales: Cuenca, Spain, 2018; p. 294. [Google Scholar]
- Monteagudo Martínez, L.A.; Ortega Cifuentes, J. Estudio de Impacto Ambiental de Planta Solar Fotovoltaica “Puerta Del Sol” 49,98 MW e Infraestructuras de Evacuación; IdeasMedioambientales: Guadalajara, Spain, 2018; p. 304. [Google Scholar]
- Peñarrubia Descalzo, M. Estudio de Impacto Ambiental de Planta Solar Fotovoltaica Ac “Ar Recas Solar” E Infraestructuras de Evacuación; IdeasMedioambientales: Toledo, Spain, 2020; p. 239. [Google Scholar]


| Parameters | Monocrystalline | Polycrystalline |
|---|---|---|
| Cost | High | Low |
| Efficiency | High | Low |
| Appearance | Black color panels | Bluish color panels |
| Temperature Coeff. | High | Low |
| Key Manufacturers | SunPower, LG | SolarWorld, Trina |
| Panel Average Weight | PV Modules Production | PV Modules Recycling | Inverter |
|---|---|---|---|
| 24 kg | 213 kgCO2e/m2 | 370 kgCO2e/ton | 29.6 kgCO2e/kW |
| Item | PV Modules Production | PV Modules Recycling | Inverter Large |
|---|---|---|---|
| Energy | 3640 MJ/m2 | 2780 MJ/t | 492 MJ/kW |
| Aspects | Nomenclature | Description | Weighting |
|---|---|---|---|
| Sign | +/− | Indicates the nature of the impact. | Beneficial: + Detrimental: − |
| Intensity | IN | Refers to the degree of incidence of the action. | Low: 1; Medium: 2 High: 4; Very high: 8 Total: 12 |
| Extension | EX | It is the area of influence of the impact on the project environment. | Punctual: 1 Partial: 2 Extensive: 4 Total: 8 |
| Moment | MO | It is the time that elapses between the occurrence of the action and the onset of the effect. | Long: 1 Medium: 2 Immediate: 4 |
| Persistence | PE | It refers to the time that the effect would remain from its appearance until the environment returns to the initial conditions. | Fleeting: 1 Temporary: 2 Permanent: 4 |
| Reversibility | RV | It refers to the possibility of reconstruction of the affected environmental factor. | Short-term: 1 Medium: 2 Irreversible: 4 |
| Synergy | SI | It indicates that the manifestation of the single effects acting simultaneously is greater than that of both effects separately. | No synergy: 1 If there is synergy: 2 Very synergistic: 4 |
| Accumulation | AC | It gives an idea of the progressive increase in the manifestation of the effect when the action that generates it persists continuously. | Simple: 1 Cumulative: 4 |
| Effect | EF | It refers to the form of manifestation of the effect on the factor. | Indirect: 1 Direct: 4 |
| Periodicity | PR | Given by the regularity of the manifestation of the effect. | Unpredictable or irregular: 1 Regular or periodic: 2 Continuous: 4 |
| Recoverability | MC | Possibility of total or partial reconstruction of the affected factor as a consequence of the project. | Immediate: 1 Medium-term: 2 Mitigable: 4 Irrecoverable: 8 |
| Solar PV | Rooftop (crystalline Si) | Alsema 2003 [30] | 10–12 |
| Ground (crystalline Si) | Alsema 2003 [30] | 7.50 | |
| Polycrystalline Si (field) | Weissbach 2013 [31] | 3.80 | |
| Amorphous Si (field) | Weissbach 2013 [31] | 2.10 | |
| Amorphous silicon (field) | Kivisto 2000 [32] | 3.70 |
| Environmental Factors | Actions | Average Importance (Construction) | Average Importance (Operation) | |
|---|---|---|---|---|
| Natural environment | Effects on the atmosphere | Air quality and climate change | −82.78 | 34.00 |
| Noise | −35.78 | −18.25 | ||
| Effects on soil | Occupation and compaction | −124.33 | −26.00 | |
| Soil and subsoil contamination | −64.89 | −22.00 | ||
| Geomorphological and relief alteration | −58.56 | 0.00 | ||
| Erosion and loss of fertile soil | −91.56 | 3.83 | ||
| Effects on water | Surface and groundwater quality | −53.63 | 2.57 | |
| Change of use and consumption | 0.00 | 21.00 | ||
| Effects on vegetation | Elimination of vegetation cover | −90.67 | 0.00 | |
| Impact on habitats of community interest | −15.00 | 0.00 | ||
| Effects on fauna | Alteration and elimination of wildlife habitats | −44.33 | −41.00 | |
| Disturbance | −33.86 | −21.00 | ||
| Mortality | −21.43 | −38.89 | ||
| Effects on the landscape | Visual intrusion and effects on landscape quality | −55.00 | −42.56 | |
| Economic environment | Effects on the population | Increased traffic | −26.50 | −2.13 |
| Disturbance to the population | −18.13 | −5.56 | ||
| Effects on the economy | Economic development | 51.22 | 35.67 | |
| Soil productivity | −23.71 | −22.38 | ||
| Energy resources | 0.00 | 36.11 | ||
| Effects on the territory | Impact on property | −31.57 | −22.86 | |
| Impact on hunting resources | −27.57 | 0.00 | ||
| Impact on protected areas | −4.43 | 0.00 | ||
| Effects on cultural heritage | Impact on B.I.C. and archaeological remains | −12.78 | −2.75 | |
| Vulnerability | Risks | Flood risk | 0.00 | −21.00 |
| Seismic risk | 0.00 | −20.00 | ||
| Meteorological risks | 0.00 | −20.00 | ||
| Forest fire risk | 0.00 | −24.00 |
Publisher’s Note: MDPI stays neutral with regard to jurisdictional claims in published maps and institutional affiliations. |
© 2022 by the authors. Licensee MDPI, Basel, Switzerland. This article is an open access article distributed under the terms and conditions of the Creative Commons Attribution (CC BY) license (https://creativecommons.org/licenses/by/4.0/).
Share and Cite
Zarzavilla, M.; Quintero, A.; Abellán, M.A.; Serrano, F.L.; Austin, M.C.; Tejedor-Flores, N. Comparison of Environmental Impact Assessment Methods in the Assembly and Operation of Photovoltaic Power Plants: A Systematic Review in the Castilla—La Mancha Region. Energies 2022, 15, 1926. https://doi.org/10.3390/en15051926
Zarzavilla M, Quintero A, Abellán MA, Serrano FL, Austin MC, Tejedor-Flores N. Comparison of Environmental Impact Assessment Methods in the Assembly and Operation of Photovoltaic Power Plants: A Systematic Review in the Castilla—La Mancha Region. Energies. 2022; 15(5):1926. https://doi.org/10.3390/en15051926
Chicago/Turabian StyleZarzavilla, Marichell, Andrea Quintero, Manuela Andrés Abellán, Francisco López Serrano, Miguel Chen Austin, and Nathalia Tejedor-Flores. 2022. "Comparison of Environmental Impact Assessment Methods in the Assembly and Operation of Photovoltaic Power Plants: A Systematic Review in the Castilla—La Mancha Region" Energies 15, no. 5: 1926. https://doi.org/10.3390/en15051926