Article

Orderly Charging Strategy Based on Optimal Time of Use Price Demand Response of Electric Vehicles in Distribution Network

1
School of Electrical Engineering, Guangxi University, Nanning 530004, China
2
Department of Electrical and Electronic Engineering, Xi’an Jiaotong-Liverpool University, 111 Ren’ai Road Suzhou Industrial Park, Suzhou 215123, China
3
College of Environment and Ecology, Xiamen University, Xiamen 361102, China
4
Department of Technology Management, Faculty of Construction Management and Business, University Tun Hussein Onn Malaysia, Johor Bahru 86400, Johor, Malaysia
*
Author to whom correspondence should be addressed.
Energies 2022, 15(5), 1869; https://doi.org/10.3390/en15051869
Submission received: 6 February 2022 / Revised: 23 February 2022 / Accepted: 1 March 2022 / Published: 3 March 2022
(This article belongs to the Topic Electricity Demand-Side Management)

Abstract

:
In order to manage electric vehicles (EVs) connected to charging grids, this paper presents an orderly charging approach based on the EVs’ optimal time-of-use pricing (OTOUP) demand response. Firstly, the Monte Carlo approach is employed to anticipate charging power by developing a probability distribution model of the charging behavior of EVs. Secondly, a scientific classification of the load period is performed using the fuzzy clustering approach. Then, a matrix of demand price elasticity is developed to measure the link between EV charging demand and charging price. Finally, the charging scheme is optimized by an adaptive genetic algorithm from the distribution network and EV user viewpoints. This paper describes how to implement the method presented in this paper in an IEEE-33-bus distribution network. The simulation results reveal that, when compared to fixed price and common time-of-use pricing (CTOUP), the OTOUP charging strategy bears a stronger impact on reducing peak–valley disparities, boosting operating voltage, and decreasing charging cost. Additionally, this paper studies the effect of varied degrees of responsiveness on charging strategies for EVs. The data imply that increased responsiveness enhances the likelihood of new load peak, and that additional countermeasures are required.

1. Introduction

1.1. Background and Motivation

Climate change, environmental pollution, and energy depletion have increasingly grown as global concerns in recent years. As a result, it is critical for us to discover feasible solutions to these ongoing problems. Transportation accounts for a sizable portion of energy consumption, and electrification of transportation will prove critical in reducing reliance on fossil fuels and carbon emissions. Since EVs exhibit zero-emission and high-energy efficiency characteristics that conventional gasoline vehicles do not, they are widely recognized as an effective means of achieving green and sustainable transportation development. Governments worldwide have enacted corresponding policies, such as economic subsidies and tax exemptions, to encourage the promotion and development of EVs. For instance, the Chinese government recently released China’s Energy-Saving and New Energy Automobile Industry Development Plan (2012–2020) with the goal of increasing EV penetration [1]. In China, EV adoption is accelerating due to strong government support, evolving charging technology, and improved charging infrastructure. By the end of 2019, China had surpassed 3 million EVs, rendering it the world’s largest EV market [2]. According to the Ministry of Industry and Information Technology’s Development Strategy research report, China will have 60 million EVs on its roads by 2030 [3,4]. In order to promote sustainable development, the Chinese government recently proposed the innovative 3060 dual carbon target. In 2050, it is estimated that EVs will account for more than 85% of passenger vehicles in China. Thus, EVs will become an unavoidable development trend in the automobile industry’s future transformation and upgrading.
The popularity of EVs will also cause a surge in power consumption, placing additional strain on grid operations. The occurrence of EV charging events is related to the driving law of users, and the charging load is subject to random uncertainty [5]. If large numbers of EVs are gathered for charging during peak electricity consumption, the stability of the grid will be compromised, resulting in increased line losses, lower power quality and lower transformer life. Models of EV charging load under various distribution network scenarios are established and analyzed, and the results indicate that increasing EV permeability will raise the peak load level [6]. The influence of EV charging stations on power quality is simulated and analyzed by MATLAB Simulink, including harmonic, voltage curve, and transformer power loss [7]. According to research on uncontrolled charging of EVs, this strategy results in the coexistence of charging and conventional loads, increasing peak load and network loss while decreasing distribution network voltage [8]. By examining the effect of various EV charging curves on the power grid, it was discovered that when the permeability of the EV exceeds a specific value, the voltage deviation increased, impairing the power grid’s stable operation [9].

1.2. Literature Review

EVs’ disorderly charging behavior jeopardizes the power grid’s safety, and additionally jeopardizes the EVs’ healthy development. Therefore, it is necessary to develop appropriate measures to manage EV charging behavior. In order to ensure the reliability and efficiency of the system, the concept of demand response is being advanced in the fiercely competitive power market demand-side management. The purpose of demand response is to incentivize users to adjust their energy consumption appropriately through a variety of economic incentives. As a flexible resource, EV participation in demand side response will prove a critical component of future smart grid management [10]. Presently, relevant scholars are examining the charging and discharging strategies of EVs that participate in demand response. A model is developed to reduce the distribution network’s voltage deviation, and the optimal charging price is generated based on the EV user reaction. When compared to the fixed charging electricity price, a more favorable voltage curve may be obtained [11]. A system for optimizing charging coordination is developed that fulfills both the energy requirement of EVs and the load profile. According to the framework, which is based on mixed integer linear programming, demand response charging exhibits a larger effect on boosting voltage, lowering peak load, and minimizing network loss when compared to alternative charging schemes [12]. An incentive demand response mechanism is designed that balances the interests of power grid providers, EV aggregators, and EV customers on the distribution network. According to studies, by modifying the user response ratio, the adjustable benchmark compensatory electricity price can prevent the issue of insufficient response and lower economic expenses while lowering the peak [13]. By combining price and incentive-based demand responses, an EV scheduling technique is developed that maximizes aggregator profits while minimizing load swings, effectively enhancing the scheduling potential of EVs [14]. To regulate EV charging behavior, a stochastic two-level optimization model of EV participation in demand response was presented. The upper layer was intended for maximizing EV aggregator profit, while the lower layer was optimized for minimizing EV charging costs [15]. A real-time charging price method is proposed for controlling the charging of plug-in hybrid electric vehicles. The authors evaluate the effects of energy price and charging willingness on charging load. Load transfer and energy management can be performed by utilizing a distributed algorithm to calculate the appropriate real-time charge price [16]. Demand response strategies also benefit the increasing development of renewable energy by enabling the coordinated operation of renewable energy and EVs. In the instance of renewable energy and EV access, a sophisticated dynamic simulation model was developed that incorporated two common demand response mechanisms based on price and incentive in order to examine and analyze the benefits associated with each subject engaging in the demand response [17]. Taking into account the uncertainties associated with solar renewable energy, market electricity pricing, and EVs, an energy management strategy is proposed for optimizing the profits of a smart industrial power grid via demand response projects and EVs [18]. EVs are viewed as demand-side response resources under dynamic electricity pricing, and charging methods are created to minimize the unpredictability of renewable energy output. The genetic algorithm-optimized charging approach can greatly reduce the variability of renewable energy generation and the cost of EV charging [19]. Price-based demand response entails scientifically segmenting load periods and establishing an electricity price for each segment [20]. Existing studies have provided significant contributions to optimizing EV charging load based on price incentives, but few have conducted a detailed study on load period division, which is typically based on application experience, which may result in an arbitrary load period division. Second, the majority of literature prioritize peak–valley differences and charging cost as optimization objectives, while ignoring grid voltage.

1.3. Paper Contributions and Organizations

This paper proposes an orderly charging strategy for EVs based on optimal time of use (TOU) demand in order to improve the above two aspects of work. To begin, power demand is calculated by the Monte Carlo method based on an analysis of EV charging behavior. The load period is then arbitrarily divided using fuzzy clustering. Then, using the price elasticity theory of demand, the response relationship between charging load and price change is established. Finally, the charging scheme is solved by an improved genetic algorithm. The main contributions of this paper are as follows:
  • The fuzzy clustering algorithm introduces a novel method for dividing load time scientifically;
  • We propose an orderly charging strategy for EVs based on OTOUP demand response, which has been shown to be effective in improving power grid stability and lowering charging costs for users;
  • We propose an adaptive genetic algorithm to solve the EV charging scheduling that considers the benefits of power grids and consumers;
  • The sensitivity analysis of an EV’s response to the charging effect is extended, discovering a high level of responsiveness results in an overresponse problem.
The rest of the paper is organized as follows. Section 2 proposes a framework for EV charging that is orderly and based on optimal TOU demand. Section 3 establishes a demand response-based EV charging model. Section 4 completes the formulation of the strategy for optimizing EV charging. Section 5 continues the simulation and analysis process. Section 6 provides concluding remarks of the entire paper.

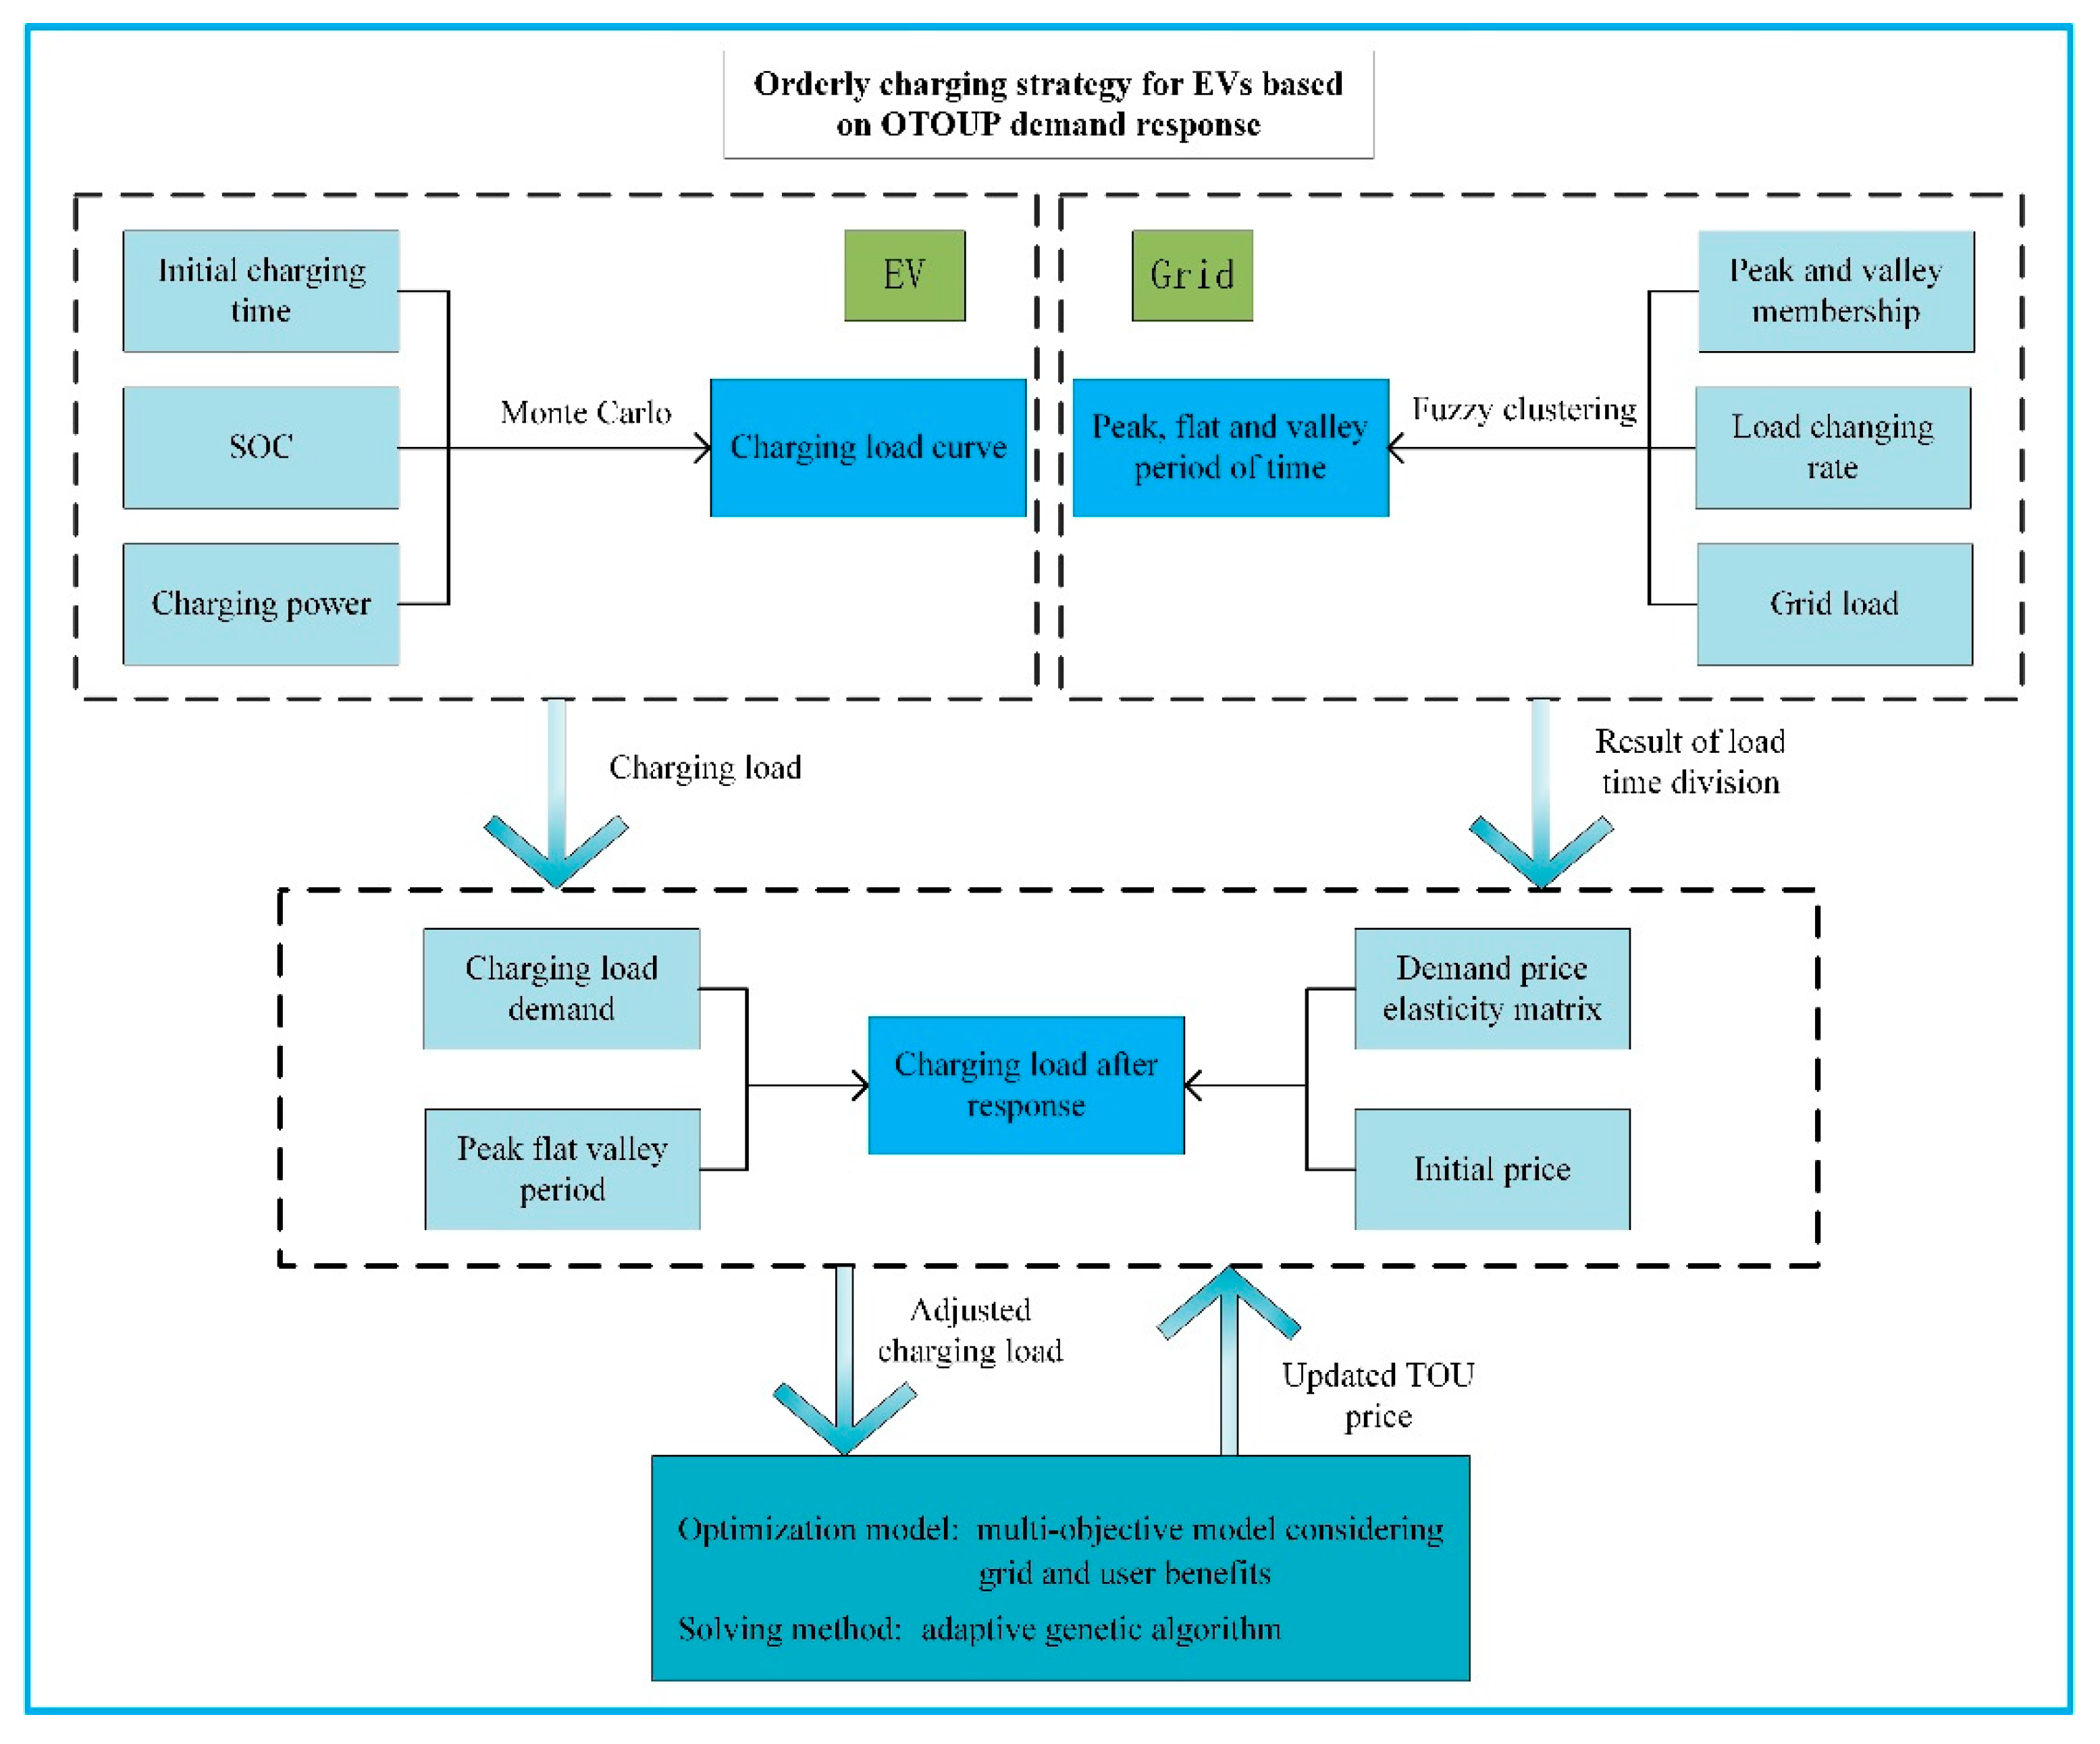
2. Framework for Developing Orderly Charging Strategy for EVs Based on OTOUP Demand Response

The orderly charging strategy for EVs based on OTOUP demand response begins by determining the initial charging time and state of charge (SOC) of EVs using a probability distribution fitted to historical data and then calculating the charging duration by combining the charging power. Finally, the EV charging power is predicted using Monte Carlo simulation. In terms of the distribution network, three load indexes are calculated using the load data, including peak membership degree, valley membership degree, and load change rate (LCR), and the optimal load time division results are determined using the fuzzy clustering method. The charging load of an EV after demand response is then determined by establishing the demand price elasticity matrix reflecting the relationship between load demand and electricity price and combining the EV power demand and load time division obtained previously. Finally, an adaptive genetic algorithm is employed to solve the multi-objective problem of EV charging demand based on demand response adjustment. After optimization, the updated electricity price is returned to the demand response process, and the optimization result is output when the electricity price does not change. Figure 1 illustrates the specific flow diagram.

3. EV Charging Model Based on Demand Response

Moreover, the rapid development of EVs has resulted in a significant increase in charging demand. Without reasonable measures to guide EVs’ random charging behavior, widespread adoption of EVs will bear varying degrees of influence on all aspects of distribution network operation. As a flexible resource, EVs sit idle for the majority of the day, making them ideal for demand response. By developing a reasonable electricity pricing strategy, we can influence how EVs charge, thereby shifting charging demand away from peak load periods and toward off-peak load periods. Demand response, as a critical mode of load management, can be broadly classified into two categories: price-based and incentive-based [21], the former of which represents the subject of this paper. To begin, a probability distribution model describing EV charging behavior is established. Then, the daily charging power of EVs was predicted using the Monte Carlo method [22]. Second, the price-based demand response strategy is primarily composed of two components: load period division and charging electricity price formulation, both of which are modeled and analyzed in this paper. The load period division is the starting point for developing the optimal charging pricing strategy. In this paper, we use fuzzy clustering to divide the load period into segments. As a critical tool for demand management, setting the electricity price has a direct effect on the charging strategy’s effectiveness. If the peak-to-valley tariff difference is too large, it may lead to peak-to-valley time switching and will not effectively improve the peak-to-valley load difference. If the peak–valley tariff difference is too small, it will be insufficient to convince EV owners to change their charging habits. As a result, this paper establishes a demand price matrix to quantify the relationship between EV power demand and electricity price.

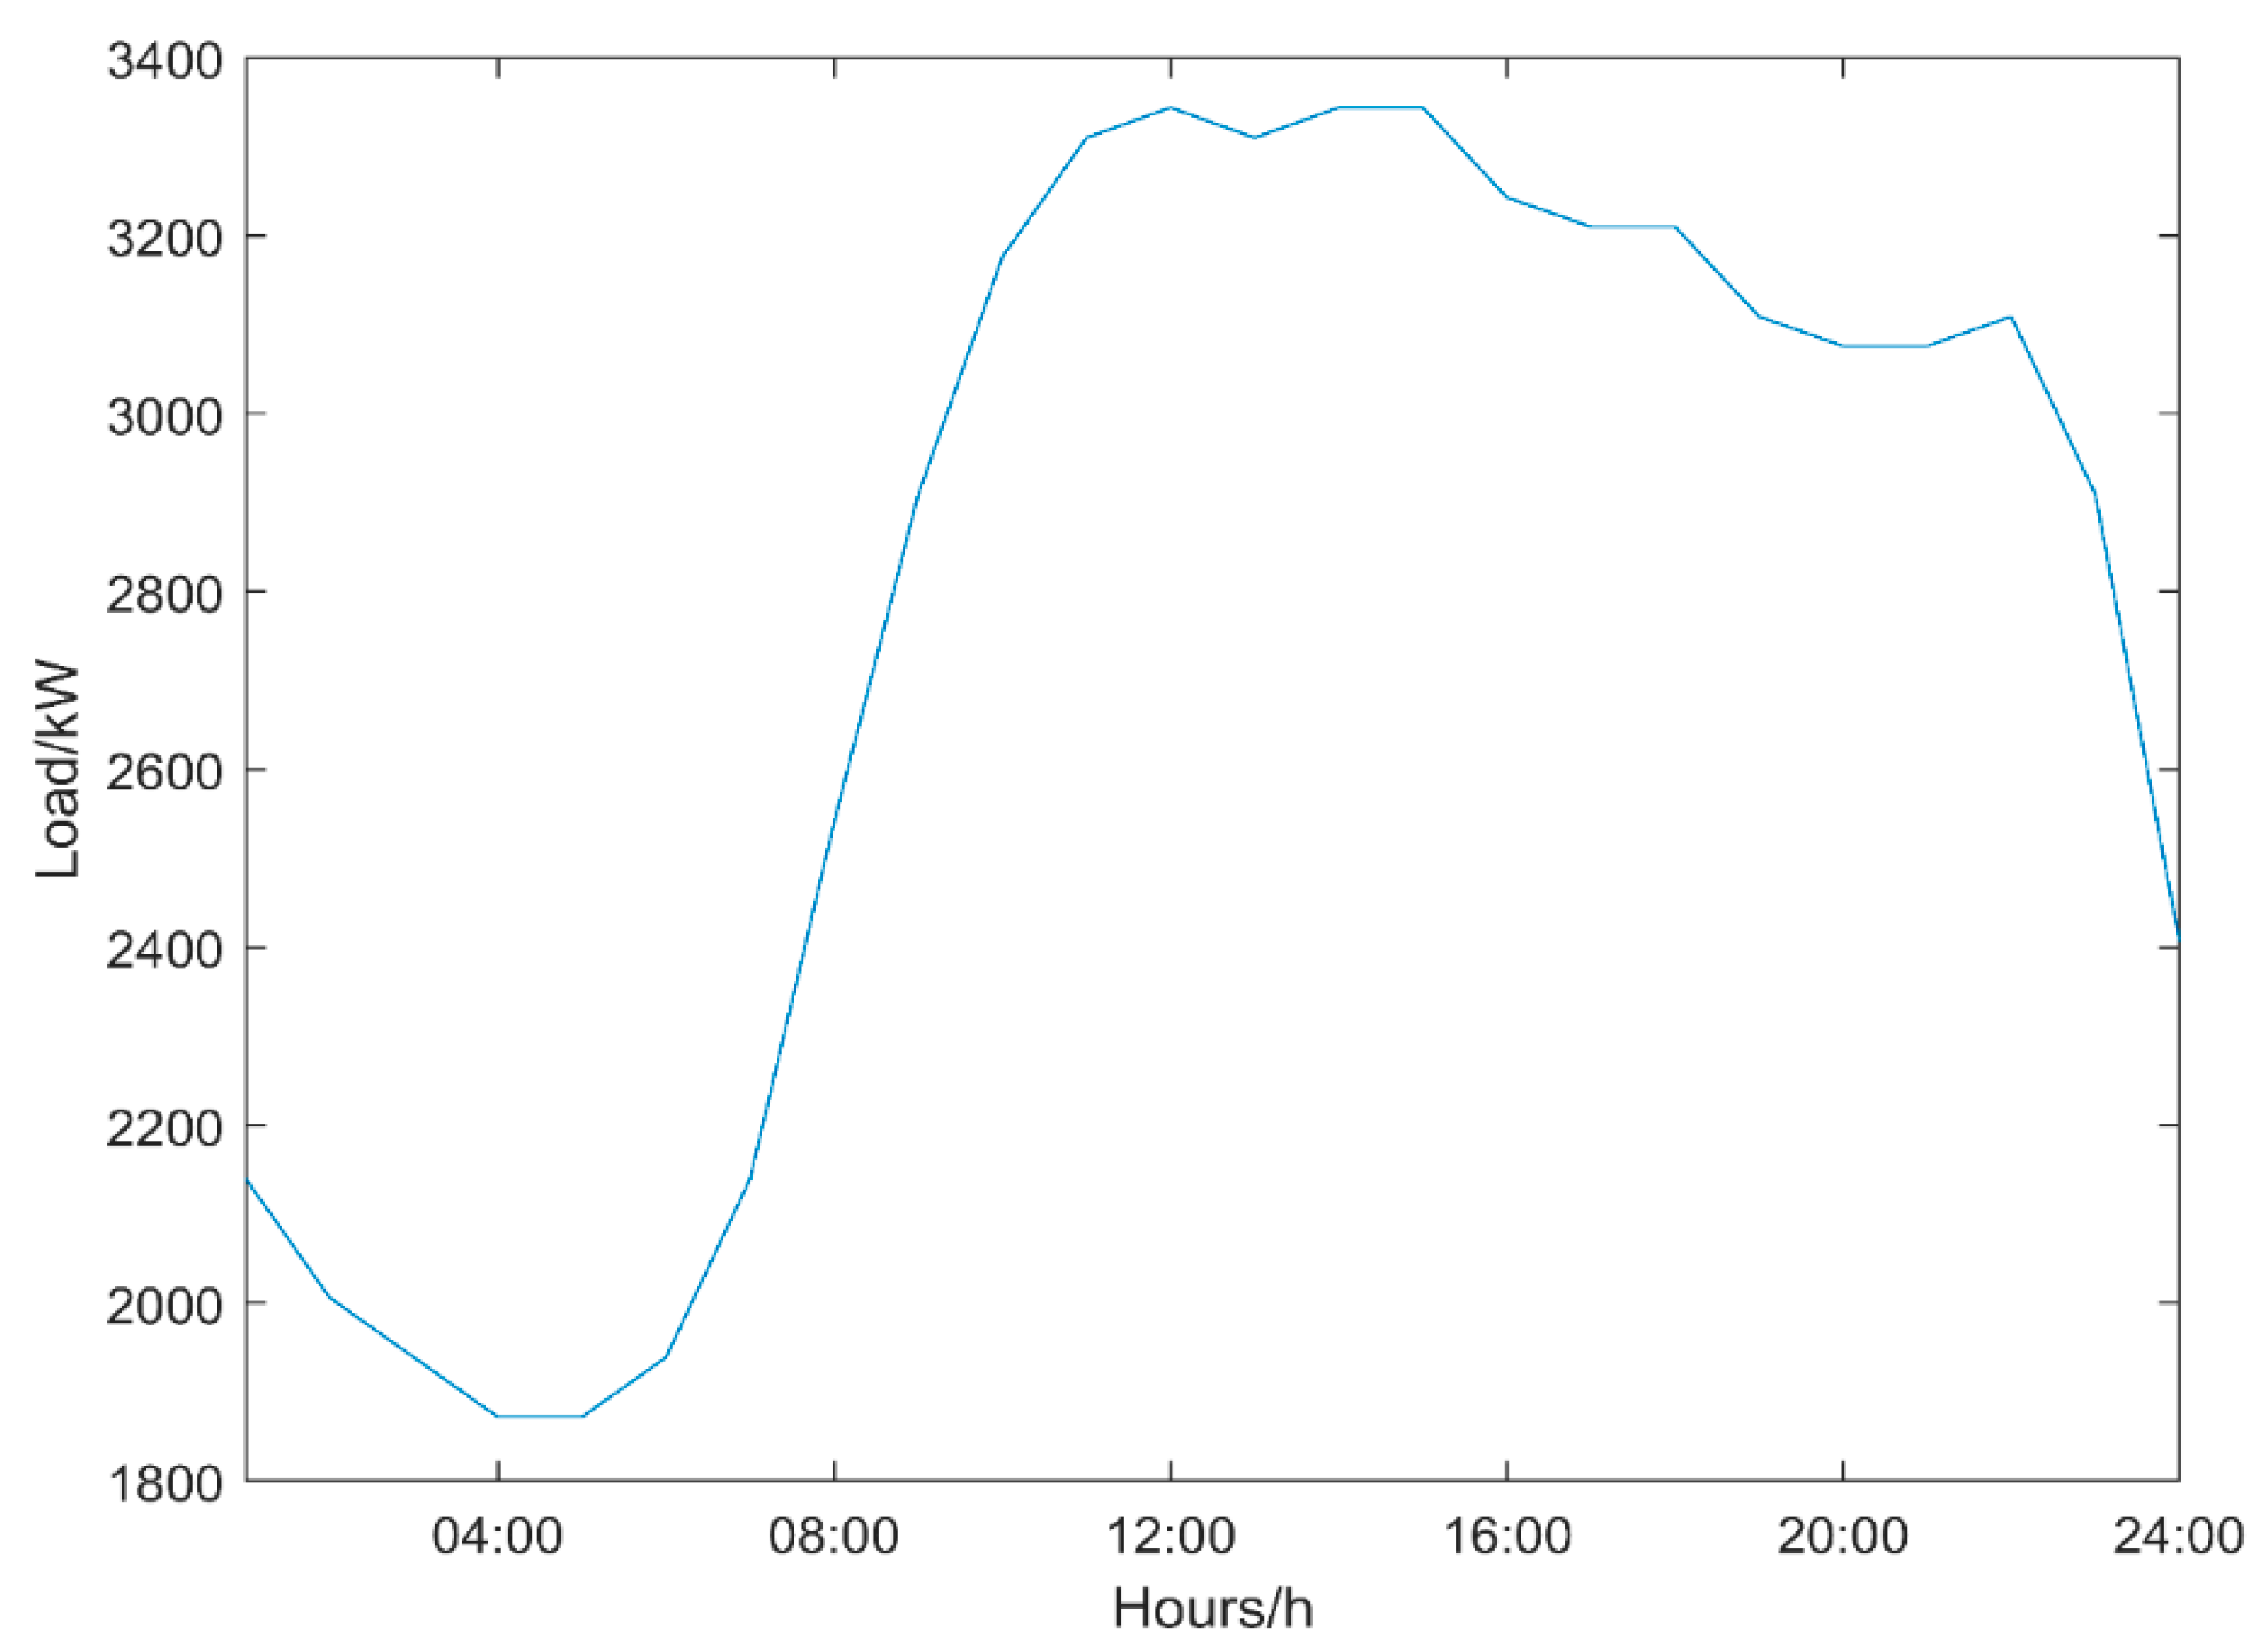
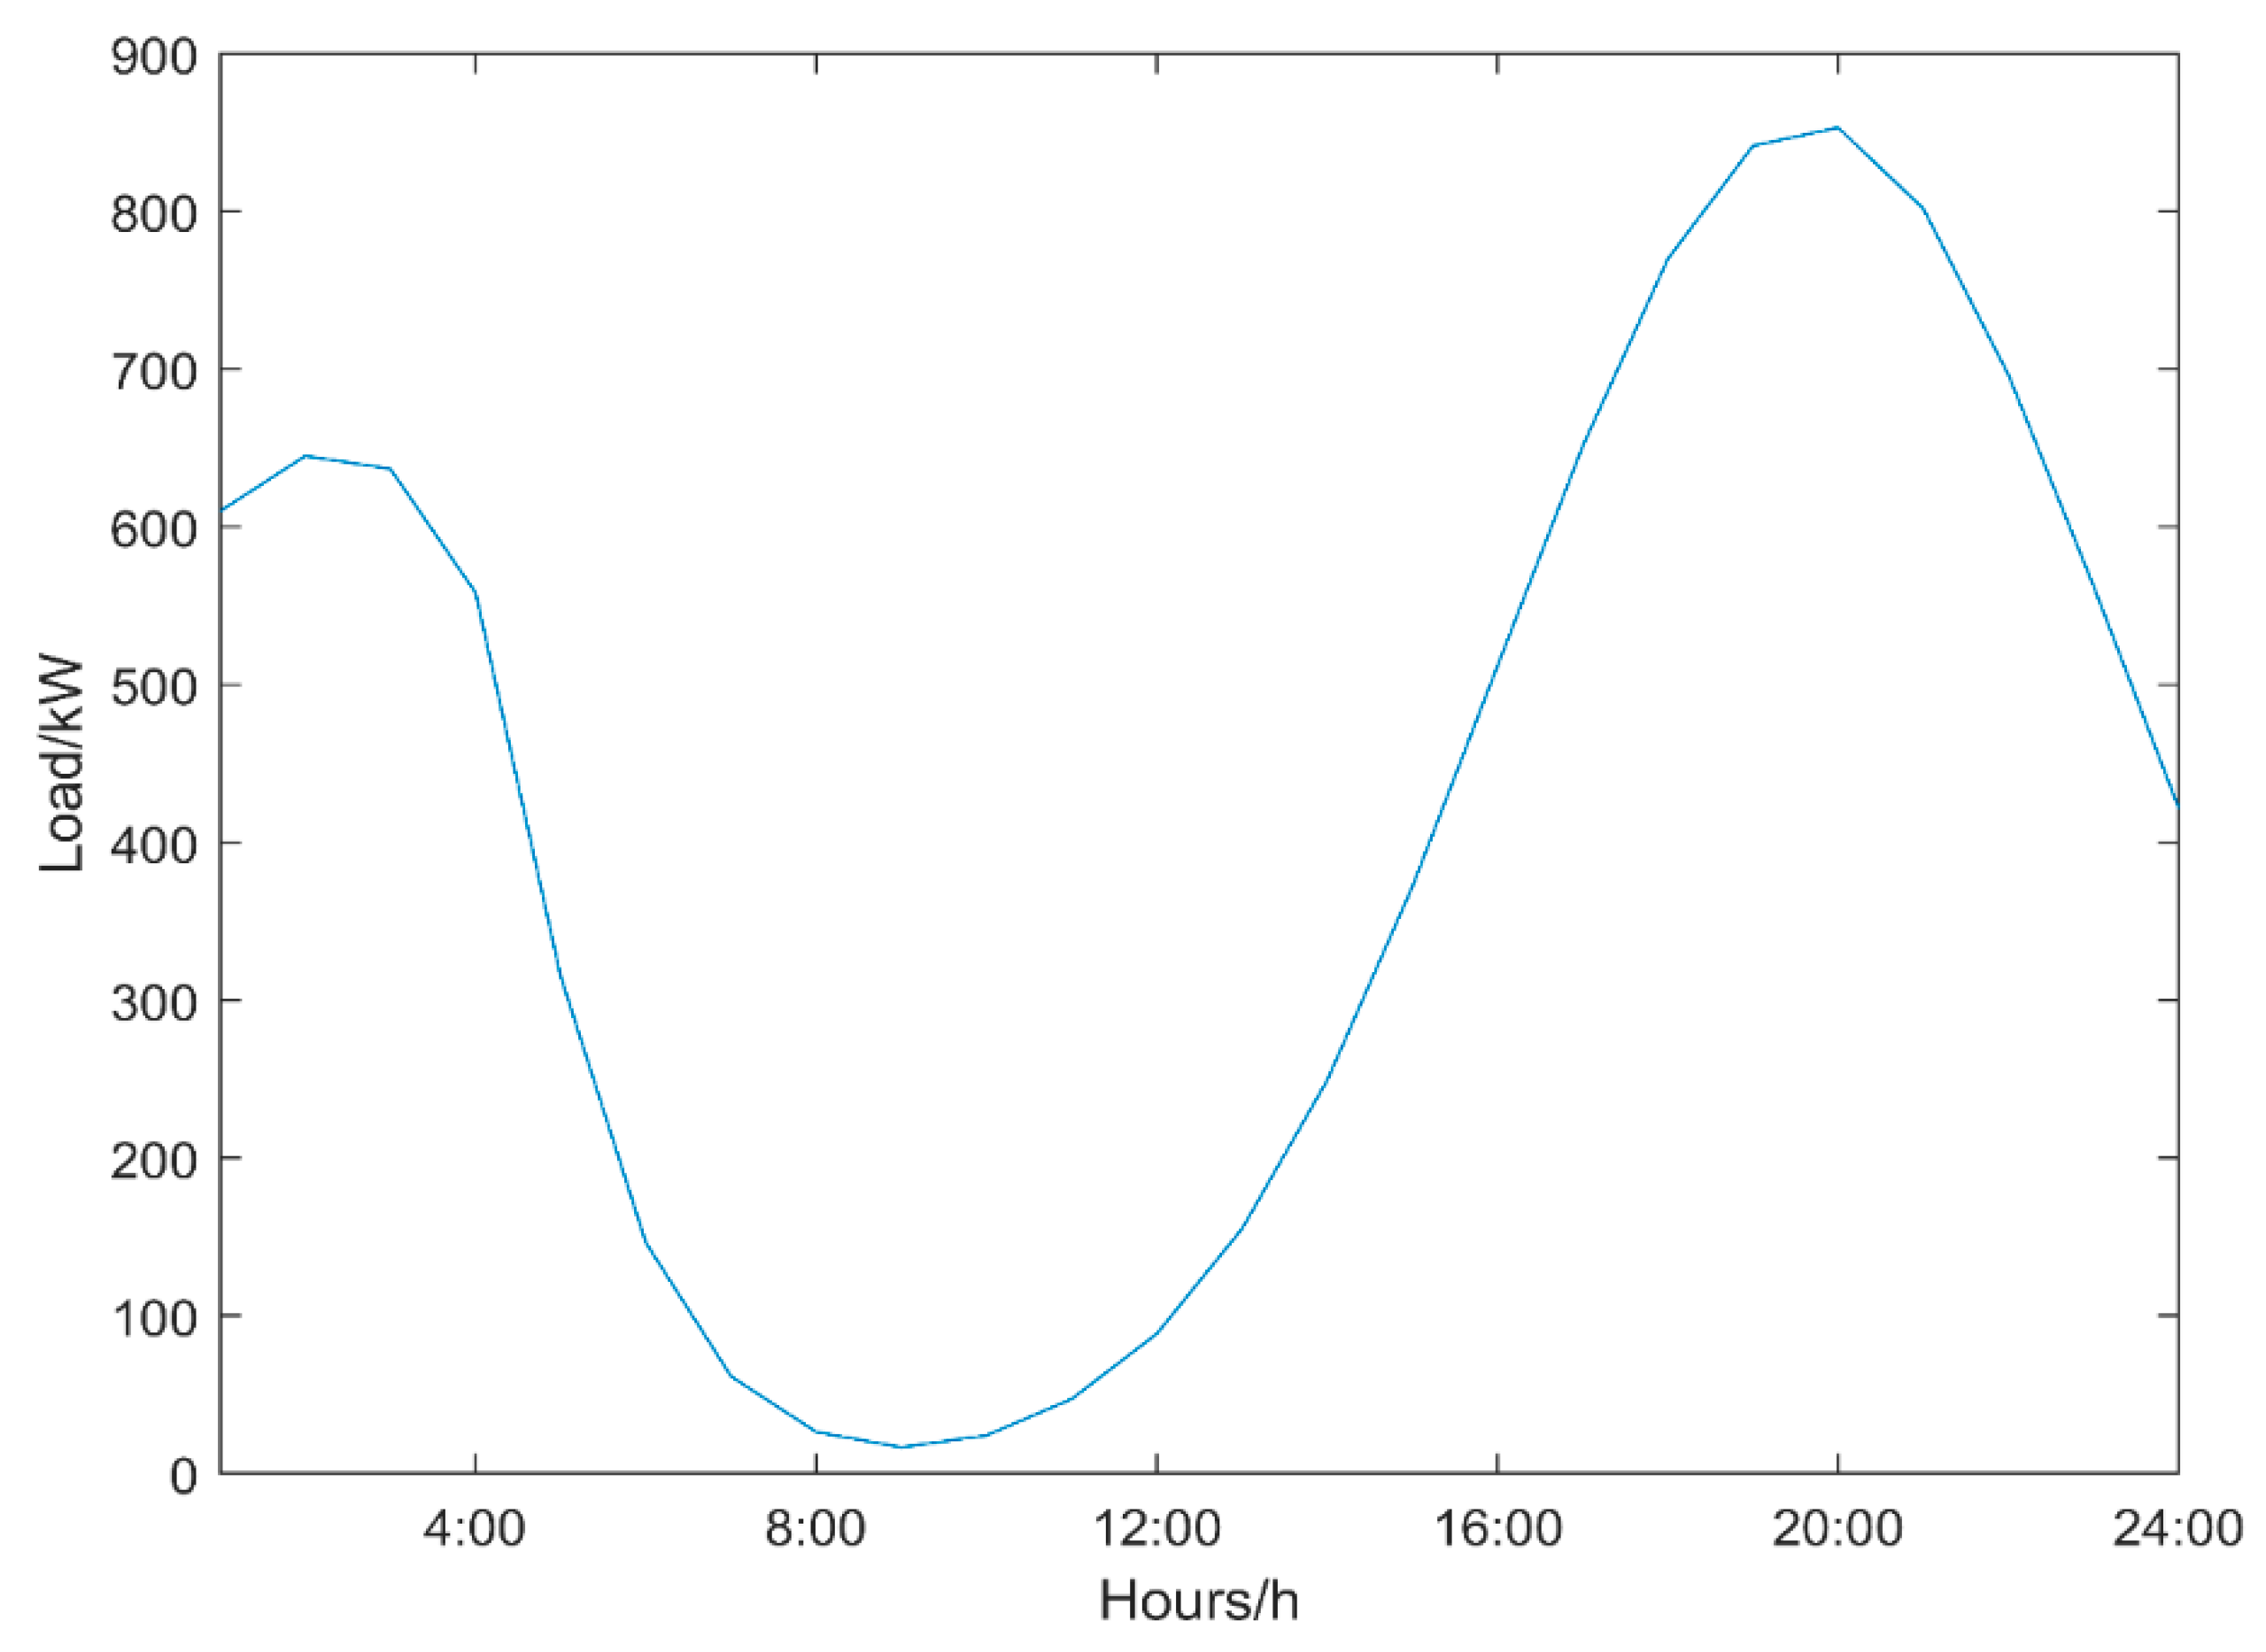
3.1. EV Charging Load Prediction

Modeling the charging load of EVs serves as the foundation for our research on demand response strategies. The Monte Carlo approach can be used to forecast the charging load of an EV [23,24,25]. We build and sample a probability distribution model for the beginning charging time and initial charging state of EV. The charging time is then estimated based on the battery’s projected state of charge, capacity, charging power, and efficiency, and the charging load of EV is determined. When the convergence conditions for all EVs are met [23], the simulation is terminated and the charging load curve for EVs is obtained. The initial charging time of EVs can be represented as Equation (1) [14].
f s ( t ) = { 1 2 π σ s exp ( ( t u s ) 2 2 σ s 2 ) , ( u s 12 ) < t 24 1 2 π σ s exp ( ( t + 24 u s ) 2 2 σ s 2 ) , 0 < t ( u s 12 )
where u s and σ s denote the mean and standard deviation of the charging initiation time, respectively. When the EV is connected to the power grid, the initial state of charge ( S O C i ) of the battery follows a uniform distribution, as illustrated in Equation (2).
f ( S O C i ) = { 1 b a             , a S O C i b   0                           ,         e l s e
where a and b represent the minimum and maximum values of the uniform distribution, respectively.
Charging duration can then be calculated based on the current S O C and expected value of the EV’s charging target, and the power requirements of a single EV can be determined. Equation (3) illustrates the calculation expression for the charging duration of an EV.
T c = ( S O C e S O C i ) × E c P c h η
where E c is battery capacity, S O C e is the S O C of the battery at the end of EV charging, P c h is the charging power, and η is the charging efficiency. Thus, as shown in Equation (4), the charging load of N EVs during the t -th period can be obtained.
P t c = i = 1 N ( P c h × x t i )
where x t i = 1 represents the i -th EV is in charging state at t -th period, and x t i = 0 represents the i -th EV is not in charging state at t -th period.
Calculating the charging load of each EV during each period yields the total charging load curve for N EVs in a day, as illustrated in Equation (5).
P t o t a l = t = 1 1440 P t c

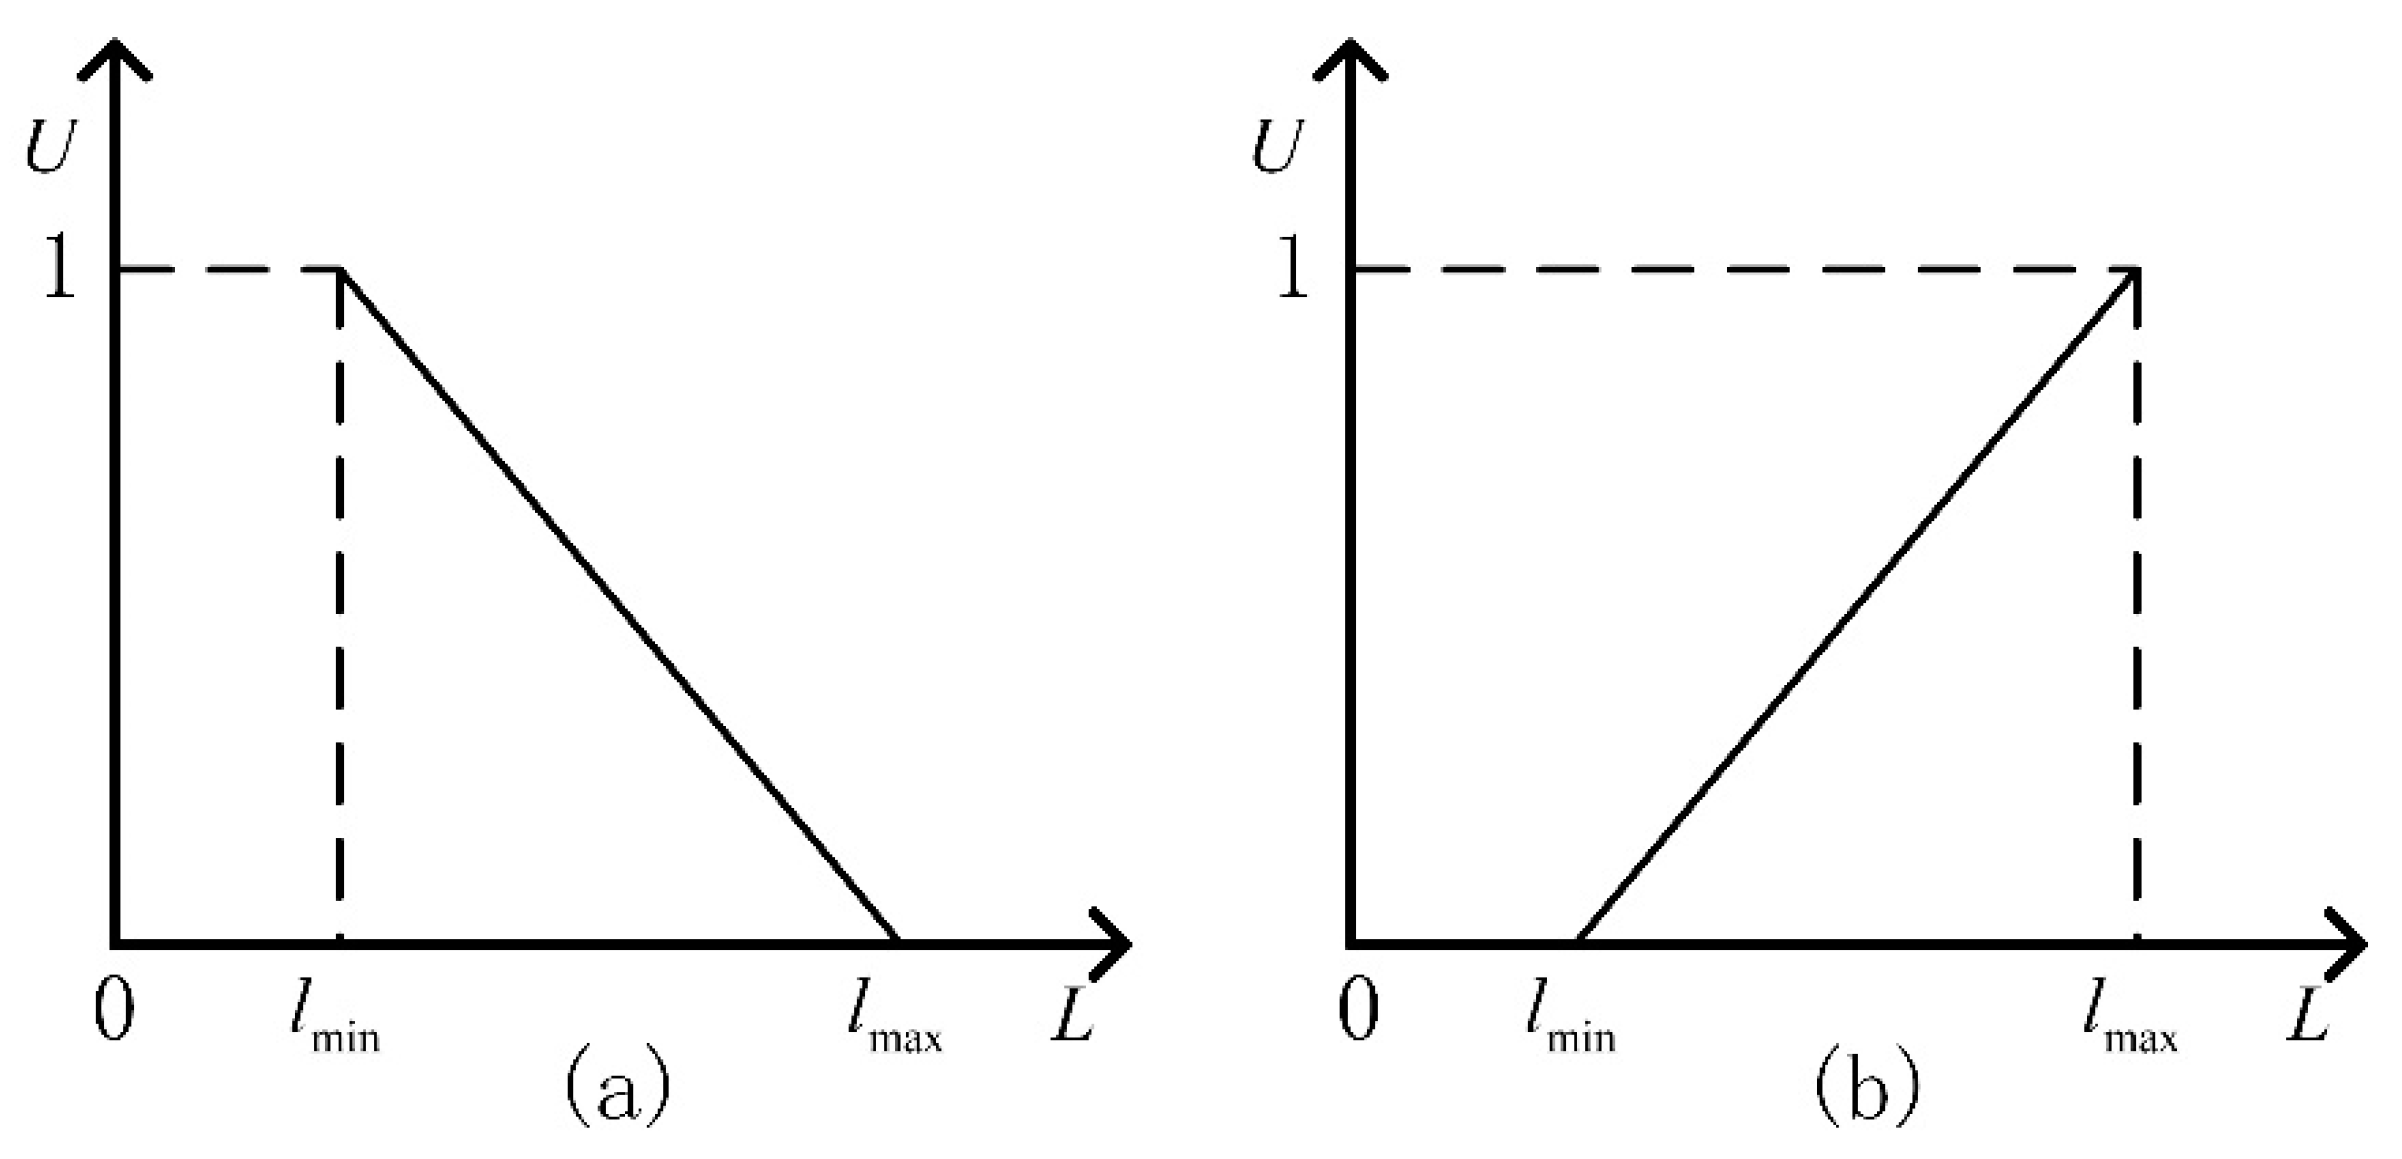
3.2. Load Time Division Based on Fuzzy Clustering

TOU pricing is based on a scientific division of load period. There are currently few studies on load period division, and the division is largely based on accumulated experience. Due to the relative nature of peak and valley periods, it is difficult to categorize them precisely, which may result in subjectivity in the processing of time demarcation points. Fuzzy clustering presents a powerful technique for resolving fuzzy uncertainty problems. According to fuzzy mathematics theory, the peak and valley periods are considered to be two fuzzy sets, and the peak valley membership degree at any point in time is determined by the membership function. Additionally, as the load changes at the peak–valley boundary point are relatively large, the load change rate, which represents the degree of load change, is beneficial in resolving the problem of determining the peak–valley boundary point period. To summarize, the peak membership degree, valley membership degree, and load change rate are employed as indicators to represent each time period, and the fuzzy clustering method is used to divide time periods more scientifically.
Assume that a load curve has T periods, and that the set of corresponding load values is L = { l 1 , l 2 , , l T } . The minimum load is specified as l min , and the maximum load value is l max . The variables, U p and U v denote the peak and valley period sets, respectively. The peak and valley membership degrees are calculated by using the larger and smaller semi trapezoidal membership functions, respectively. Figure 2 illustrates the semi-trapezoidal membership function.
Equations (6) and (7) demonstrate how to calculate the membership degree during the peak and valley periods.
U p ( l t ) = ( l t l min ) ( l max l min )                     ( t = 1 , 2 , , T )
U v ( l t ) = ( l max l t ) ( l max l min )
According to Equations (6) and (7), l min membership degree in the set U p is 0, whereas it is 1 in the set U v . l max has a membership of 1 in U p , and a membership of 0 in U v . Because the LCR’s function is to reflect the magnitude of load change, its absolute value is used as the load indicator, as illustrated in Equation (8).
L C R ( t ) = | l t l t 1 l t | × 100 %
Each characteristic index may contain a different dimension and order of magnitude in practical problems. It is possible that during operation, the importance of some characteristics with a very large order of magnitude will be emphasized, while the importance of some characteristics with a very small order of magnitude will be reduced or even eliminated, which explains why normalizing the data is necessary. The classification object can be represented as L = { l 1 , l 2 , , l T } , and each object is described by m feature index l t = { U p ( l t ) , U v ( l t ) , L C R ( t ) }               ( t = 1 , 2 , , T ) . For the convenience of description, it is represented as l t = { l t 1 , l t 2 , l t 3 }               ( t = 1 , 2 , , T ) , then the initial sample matrix is obtained as shown in Equation (9).
L = [ l 11 l 21 l T 1 l 12 l 22 l T 2 l 13 l 23 l T 3 ]
Data normalization usually includes translation—standard deviation transformation and translation—range transformation, as shown in Equations (10)–(13), respectively.
l t k = l t k l k ¯ S k               ( t = 1 , 2 , , T     ;       k = 1 , 2 , 3 )
l k ¯ = 1 T t = 1 T l t k
S k = 1 T t = 1 T ( l t k l k ¯ ) 2
l t k = l t k min 1 t T ( l t k ) max 1 t T ( l t k ) min 1 t T ( l t k )
Following data normalization, the fuzzy similarity matrix is constructed using the included angle cosine method, as shown in Equation (14).
r t s = k = 1 3 ( l t k × l s k ) k = 1 3 l t k 2 × k = 1 3 x s k 2
where r t s represents the degree of similarity between l t and l s in L , and the value is between 0 and 1.
The fuzzy transitive closure method is used to obtain a fuzzy equivalent matrix to aid in cluster analysis. When R 2 R 2 = R 2 appears for the first time, R 2 is the transitive closure t ( R ) . It is worth noting that represents the synthesis operation of matrix rather than matrix operation. Following the computation of the transitive closure matrix t ( R ) = ( r t s ) T × T , different confidence levels λ [ 0 , 1 ] are selected to obtain corresponding intercept matrix t ( R ) λ , as shown in Equation (15).
t ( R ) λ = ( r t s ˜ ) T × T
where the calculation method of elements in matrix t ( R ) λ is shown in Equation (16).
r t s ˜ = { 1   , r t s λ 0   , r t s < λ
The value of λ directly affects the result of classification. The F test method from statistics is used in this paper to assist in determining the optimal λ . and its calculation method is shown in Equations (17)–(22).
F = j = 1 r T j L ( j ) ¯ L ¯ 2 / ( r 1 ) j = 1 r g = 1 T j l g ( j ) L ( j ) ¯ 2 / ( T r )
L ¯ = ( L 1 ¯ , L 2 ¯ , L 3 ¯ )
L k ¯ = 1 T t = 1 T l t k               ( k = 1 , 2 , 3 )
L ( j ) ¯ = ( L 1 ( j ) ¯ , L 2 ( j ) ¯ , L 3 ( j ) ¯ )
L k ( j ) ¯ = 1 T j g = 1 T j l g k ( j )
L ( j ) ¯ L ¯ = k = 1 3 ( L k ( j ) ¯ L k ¯ ) 2
where r represents the number of classifications and T j represents the number of individuals in class j , L ¯ is the clustering center of the total sample, L ( j ) ¯ is the clustering center of class j , and l g ( j ) is the g -th sample in class j . Equation (17) has a numerator representing the average distance between classes and a denominator representing the average distance between samples within classes. Given that F in Equation (17) is subject to the F distribution of degrees of freedom ( r 1 , T r ) , this paper uses the clustering effectiveness(CE) shown in Equation (23) to determine the optimal λ , and the corresponding classification is the optimal classification r .
C E r = F F a ( r 1 , T r ) F a ( r 1 , T r )
where a is the significance level and F a ( r 1 , T r ) is the test critical value, which can be obtained by referring to the table. The greater the C E r value, the greater the difference between classes and the more accurate the classification effect.

3.3. Modeling Demand Response Based on TOU Price

The premise for the successful development of demand response measures is that power consumers possess the characteristics of an “economic man”, that is, they are capable of altering their consumption patterns in the pursuit of economic gain. Through the implementation of various electricity pricing schemes, price-based demand response aims to encourage power users to actively adjust their consumption time and mode in order to alleviate the pressures associated with tight power supply during peak load periods. The effective interaction of EVs with the power grid requires that the price regulation function of electricity be fully utilized. TOU electricity price has developed relatively slowly and currently holds a dominant position in China’s electricity market. As a result, this paper analyzes the demand response of EVs primarily through the lens of TOU price. According to economic theory, the charging volume of EVs is approximately inversely proportional to the price of power [10,26]. To facilitate the study, a model that accurately reflects the relationship between EV charging demand and TOU electricity price is developed in this paper using price elasticity of demand.
The increase in the price of electricity over time will reduce the amount of charging during this time period. Equation (24) can be used to express this relationship.
ε t t = Δ q t / q t ( 0 ) Δ p t / p t ( 0 )
where ε t t refers to the self-elastic coefficient, which is usually negative. q t ( 0 ) and q t are charge quantity before and after response in time period t , p t ( 0 ) and p t are electricity price before and after response in time period t . Δ q t and Δ p t are charge change and price change in time period t , which are calculated by Equations (25) and (26), respectively.
Δ q t = q t q t ( 0 )
Δ p t = p t p t ( 0 )
In general, the demand in a given period will be influenced by the combination of prices for that and other periods. This relationship can be expressed in Equation (27).
ε t s = Δ q t / q t ( 0 ) Δ p s / p s ( 0 )
where ε t s is called the cross elastic coefficient, which is usually positive. p s ( 0 ) and p s are the electricity price before and after the demand response at time s respectively. Δ p s is the price change in time period s , which can be calculated from Equation (28).
Δ p s = p s p s ( 0 )
If T charging periods are considered in a day, Equation (29) is established.
[ Δ q 1 / q 1 ( 0 ) Δ q 2 / q 2 ( 0 ) Δ q T / q T ( 0 ) ] = [ ε 11 ε 21 ε T 1 ε 12 ε 22 ε T 2 ε 1 T ε 2 T ε T T ] × [ Δ p 1 / p 1 ( 0 ) Δ p 2 / p 2 ( 0 ) Δ p T / p T ( 0 ) ]
After responding to TOU price, the charging load of EV in period t can be further obtained as shown in Equation (30).
q t = q t ( 0 ) ( 1 + ε t t Δ p t p t ( 0 ) + s = 1 , s t T ε t s Δ p s p s ( 0 ) )

4. Formulation of Charging Optimization Strategy for EVs

4.1. Objective Functions

Demand response measures based on TOU price are applied in this study to guide EV users toward a reasonable charging schedule, alleviate pressure on the power supply. Minimizing load fluctuation and narrowing the gap between maximum load and minimum load are critical for EVs to participate in demand response from a grid perspective. Since the voltage level also bears an effect on the grid’s power quality, this paper uses the voltage deviation as an optimization objective. Equations (31)–(34) show the expressions for minimizing load fluctuation standard deviation, peak–valley difference, and voltage deviation, respectively.
F G 1 = min { t = 1 T ( q t + l t P a v e ) 2 T }
where P a v e is the average load of the whole day, which can be calculated from Equation (32).
P a v e = t = 1 T ( q t + l t ) T
F G 2 = min { max 1 t T ( q t + l t ) min 1 t T ( q t + l t ) }
F G 3 = min { t = 1 T ( V t ¯ V t _ ) }
where V t ¯ and V t _ are the highest node voltage and lowest node voltage in time period t , respectively.
When conducting TOU demand response, it is necessary to consider the interests of EV users in addition to those of the grid, in order to maximize their participation in the demand response. As a result, the charging cost of an EV is used as the optimization objective, as illustrated in Equation (35).
F C = min { t = 1 T ( q t × P t ) }
where P t is the charging price in time period t . Since the objective functions F G 1 , F G 2 and F G 3 are all concerned with distribution network benefits, they are integrated into an optimization goal by assigning weight values to different objective functions, as shown in Equations (36) and (37).
F G = g 1 F G 1 + g 2 F G 2 + g 3 F G 3
g 1 + g 2 + g 3 = 1
where g 1 , g 2 and g 3 are is non-negative. Finally, the single-objective optimization model is obtained using the linear weighting method, as shown in Equations (38) and (39).
F G C = w 1 F G + w 2 F C
w 1 + w 2 = 1
where the weight coefficients w 1 and w 2 are non-negative.

4.2. Constraint Condition

In order to enable EV users to actively participate in a charging strategy based on TOU price demand response, it is necessary to ensure that the cost of charging EVs following demand response does not exceed the cost of charging under disorderly charging. Equation (40) can be used to express this cost constraint.
t = 1 T ( q t × P t ) t = 1 T ( P t c × P t 0 )
where P t c is the charging load in t period during disordered charging, P t is the electricity price in t period after optimization, and P t 0 is the disordered charging price in period t .
Taking into account the combined effect of TOU tariff optimization strategies in improving load profiles and reducing economic costs, the TOU price optimization strategy should adhere to the constraints of Equation (41).
P t _ P t P t ¯
where P t _ and P t ¯ are the minimum and maximum of TOU price in t period, respectively.
Before and after demand response, the energy required by EVs should be conserved, which can be expressed by Equation (42).
t = 1 T q t = t = 1 T P t c
After the implementation of orderly charging, the new load peak larger than the original peak should be avoided due to the transfer of charging load. The constraint can be expressed by Equation (43).
max 1 t T ( q t + l t ) max 1 t T ( P t c + l t )

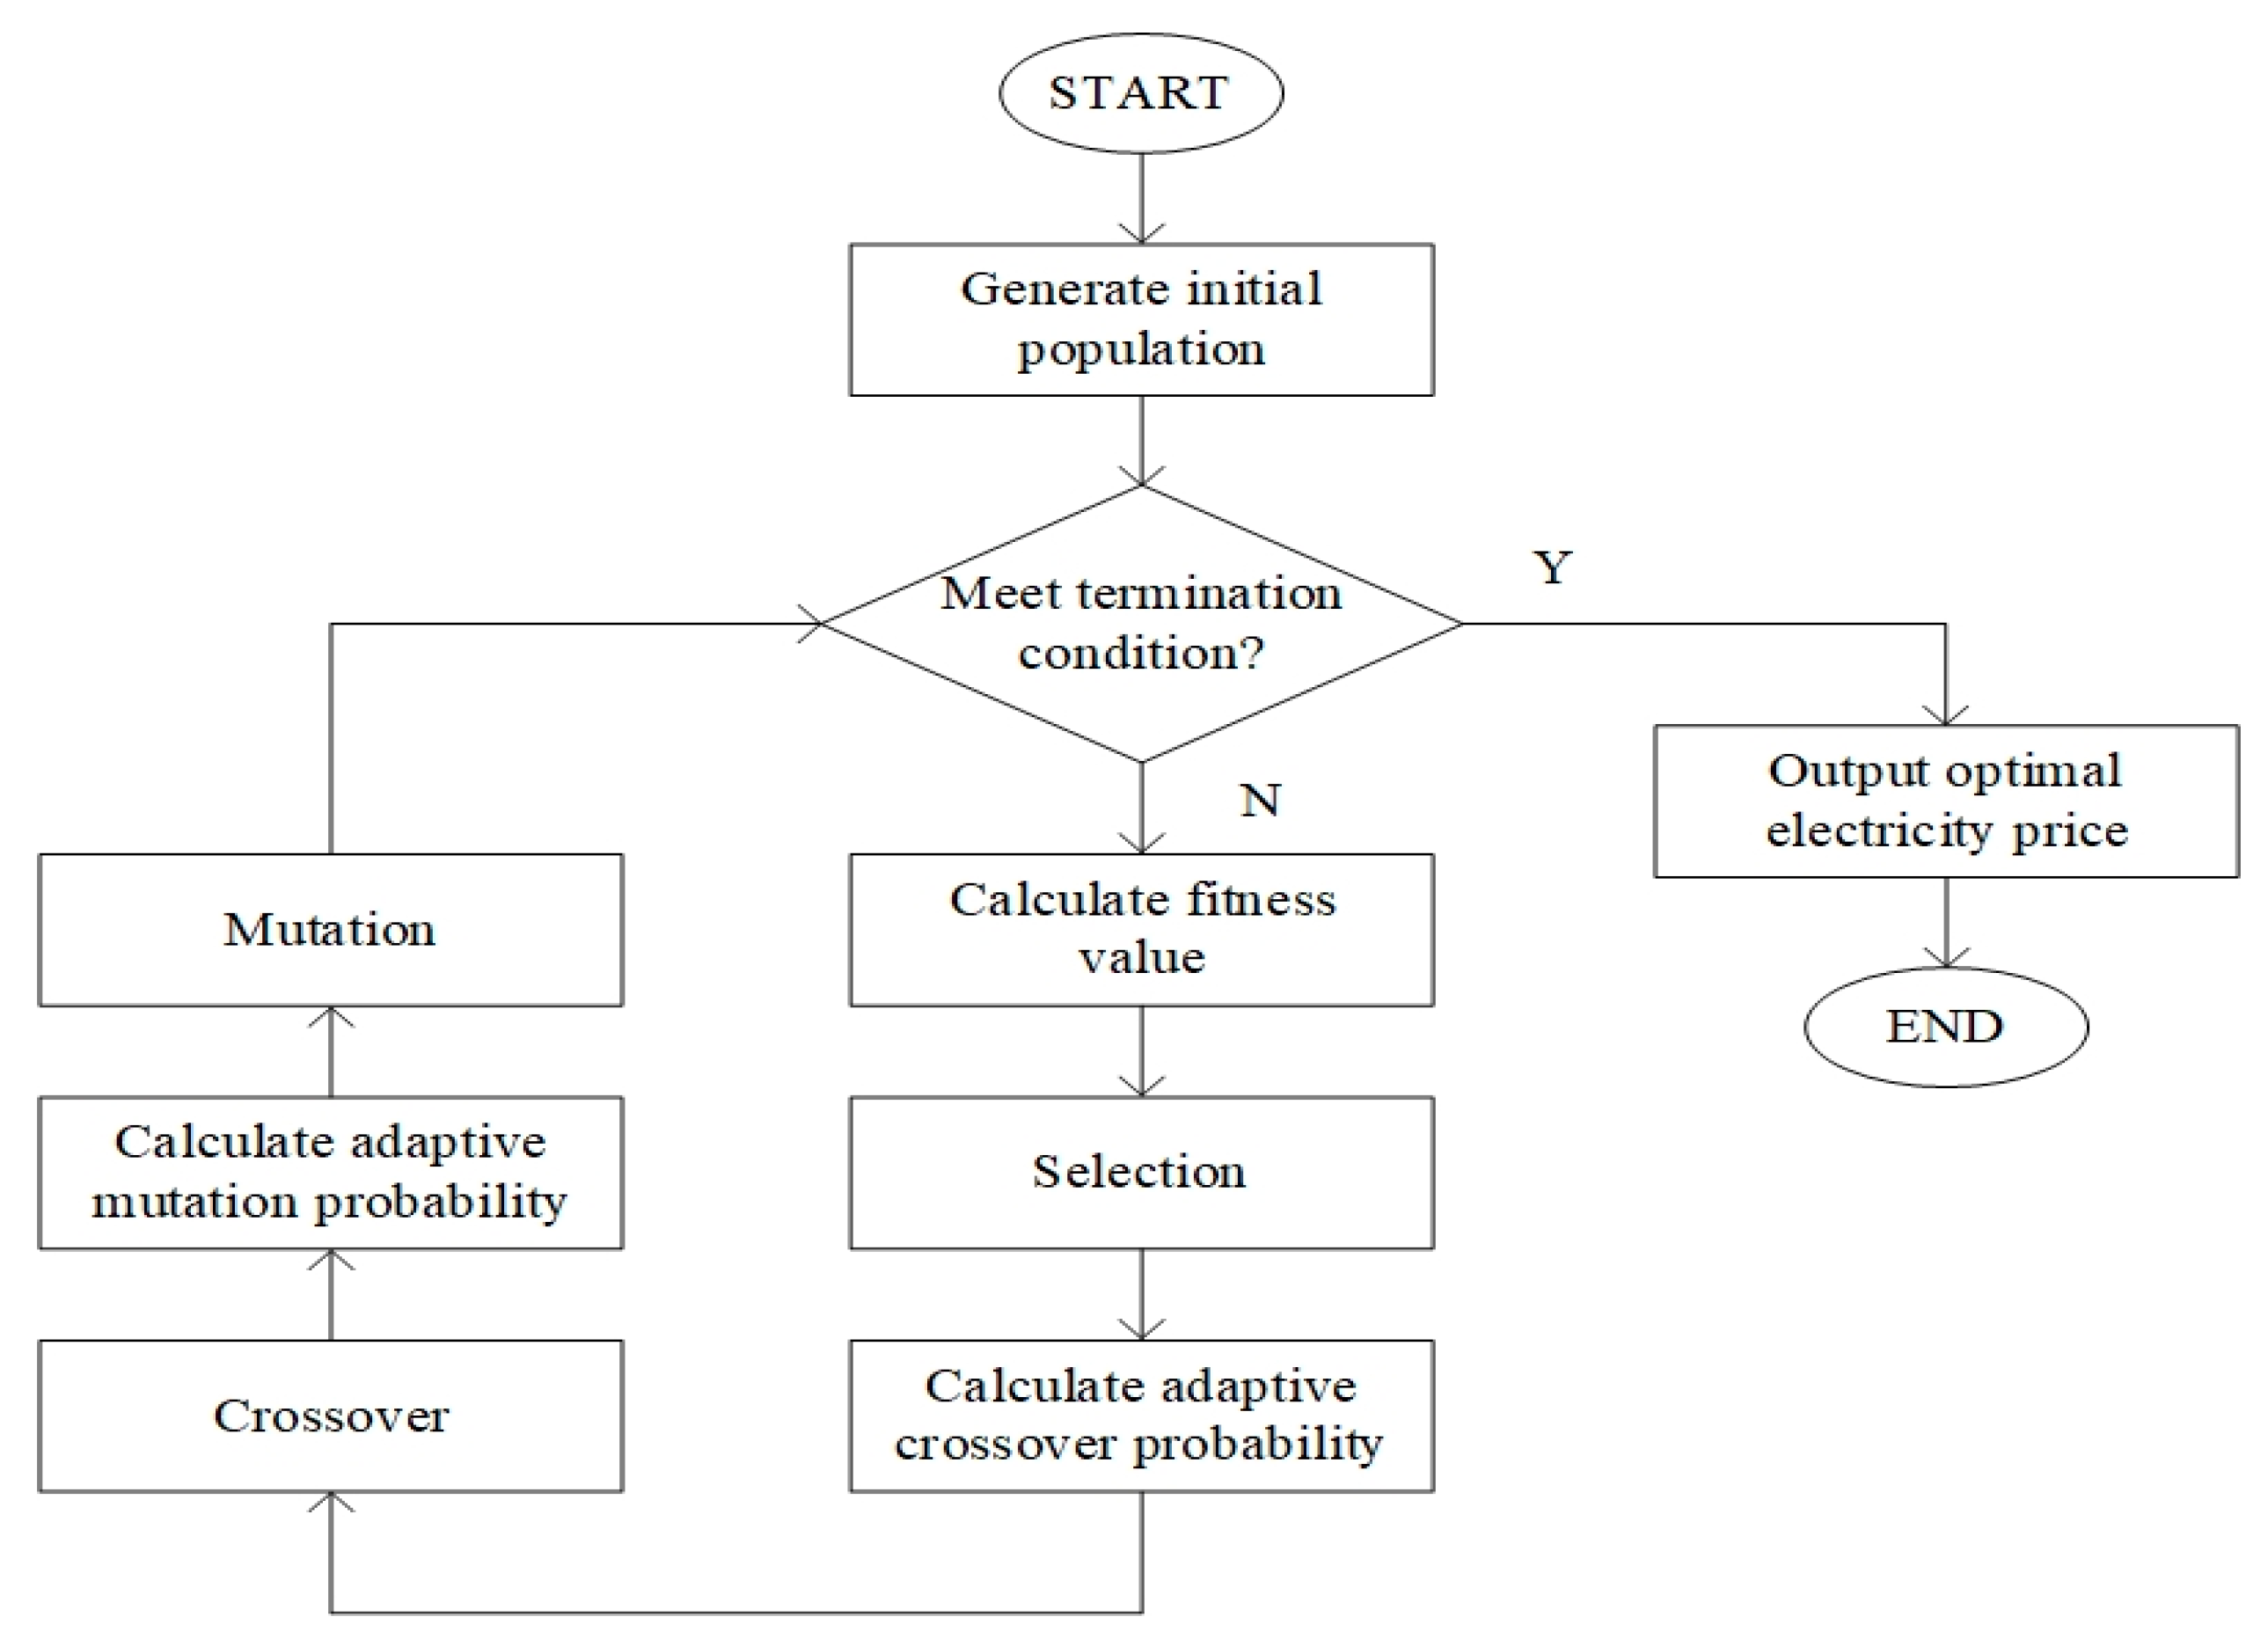
4.3. Solving Algorithm

However, the conventional genetic algorithm suffers from the following drawbacks. First, it is easy for “premature” phenomena to manifest, particularly when the population’s diversity is destroyed during the middle and late stages of the algorithm’s evolution, when the algorithm’s search stops and settles on a local optimal. Second, the crossover and mutation probabilities bear a significant effect on the optimization results. For instance, as the crossover probability increases, the genetic structure may be destroyed, resulting in the extinction of individuals with high-quality solutions; conversely, as the crossover probability decreases, it becomes easy to cause low search efficiency and even stagnation. When the mutation probability is set to a value that is excessively high, the genetic algorithm degrades into a pure random search algorithm. However, the low mutation probability renders it difficult to generate new individuals, which is detrimental to population diversity. As a result, an adaptive genetic algorithm to improve the calculation of crossover and mutation probabilities is proposed, in which the crossover and mutation probabilities are calculated as shown in Equations (44) and (45).
P c = { P c 1 × 1 ( P c 1 P c 2 ) + exp ( f a v e f f a v e f min )       , f f a v e                                 k 1 × P c 1                                 , f > f a v e
P m = { P m 1 × 1 ( P m 1 P m 2 ) + exp ( f a v e f f a v e f min )       , f f a v e                                 k 2 × P m 1                                 , f > f a v e
where f min and f a v e are the minimum and mean values of population fitness respectively, f is the smaller fitness value of the two crossover individuals, f is the fitness value of the mutated individual, and k 1 , k 2 , P c 1 , P c 2 , P m 1 and P m 2 are other parameters required in the algorithm.
As shown in Equations (44) and (45), individuals whose fitness is greater than the average value of fitness perform poorly, and thus are assigned a high crossover and mutation probability and are eliminated. Individuals with a fitness level lower than the average fitness level exhibit superior performance and should be retained to the maximum extent possible. Individuals with a lower fitness value exhibit a lower probability of crossover and mutation, and a higher probability of the dominant individual remaining in the population. Additionally, as the TOU price is frequently expressed in decimal form, binary coding is simple and intuitive, but may require a lengthy coding length. Along with expanding the algorithm’s search space and increasing the difficulty of decoding, there may be mapping errors. As a result, real number coding is used in this paper, and the adaptive genetic algorithm’s flow chart is shown in Figure 3.

5. Results and Analysis

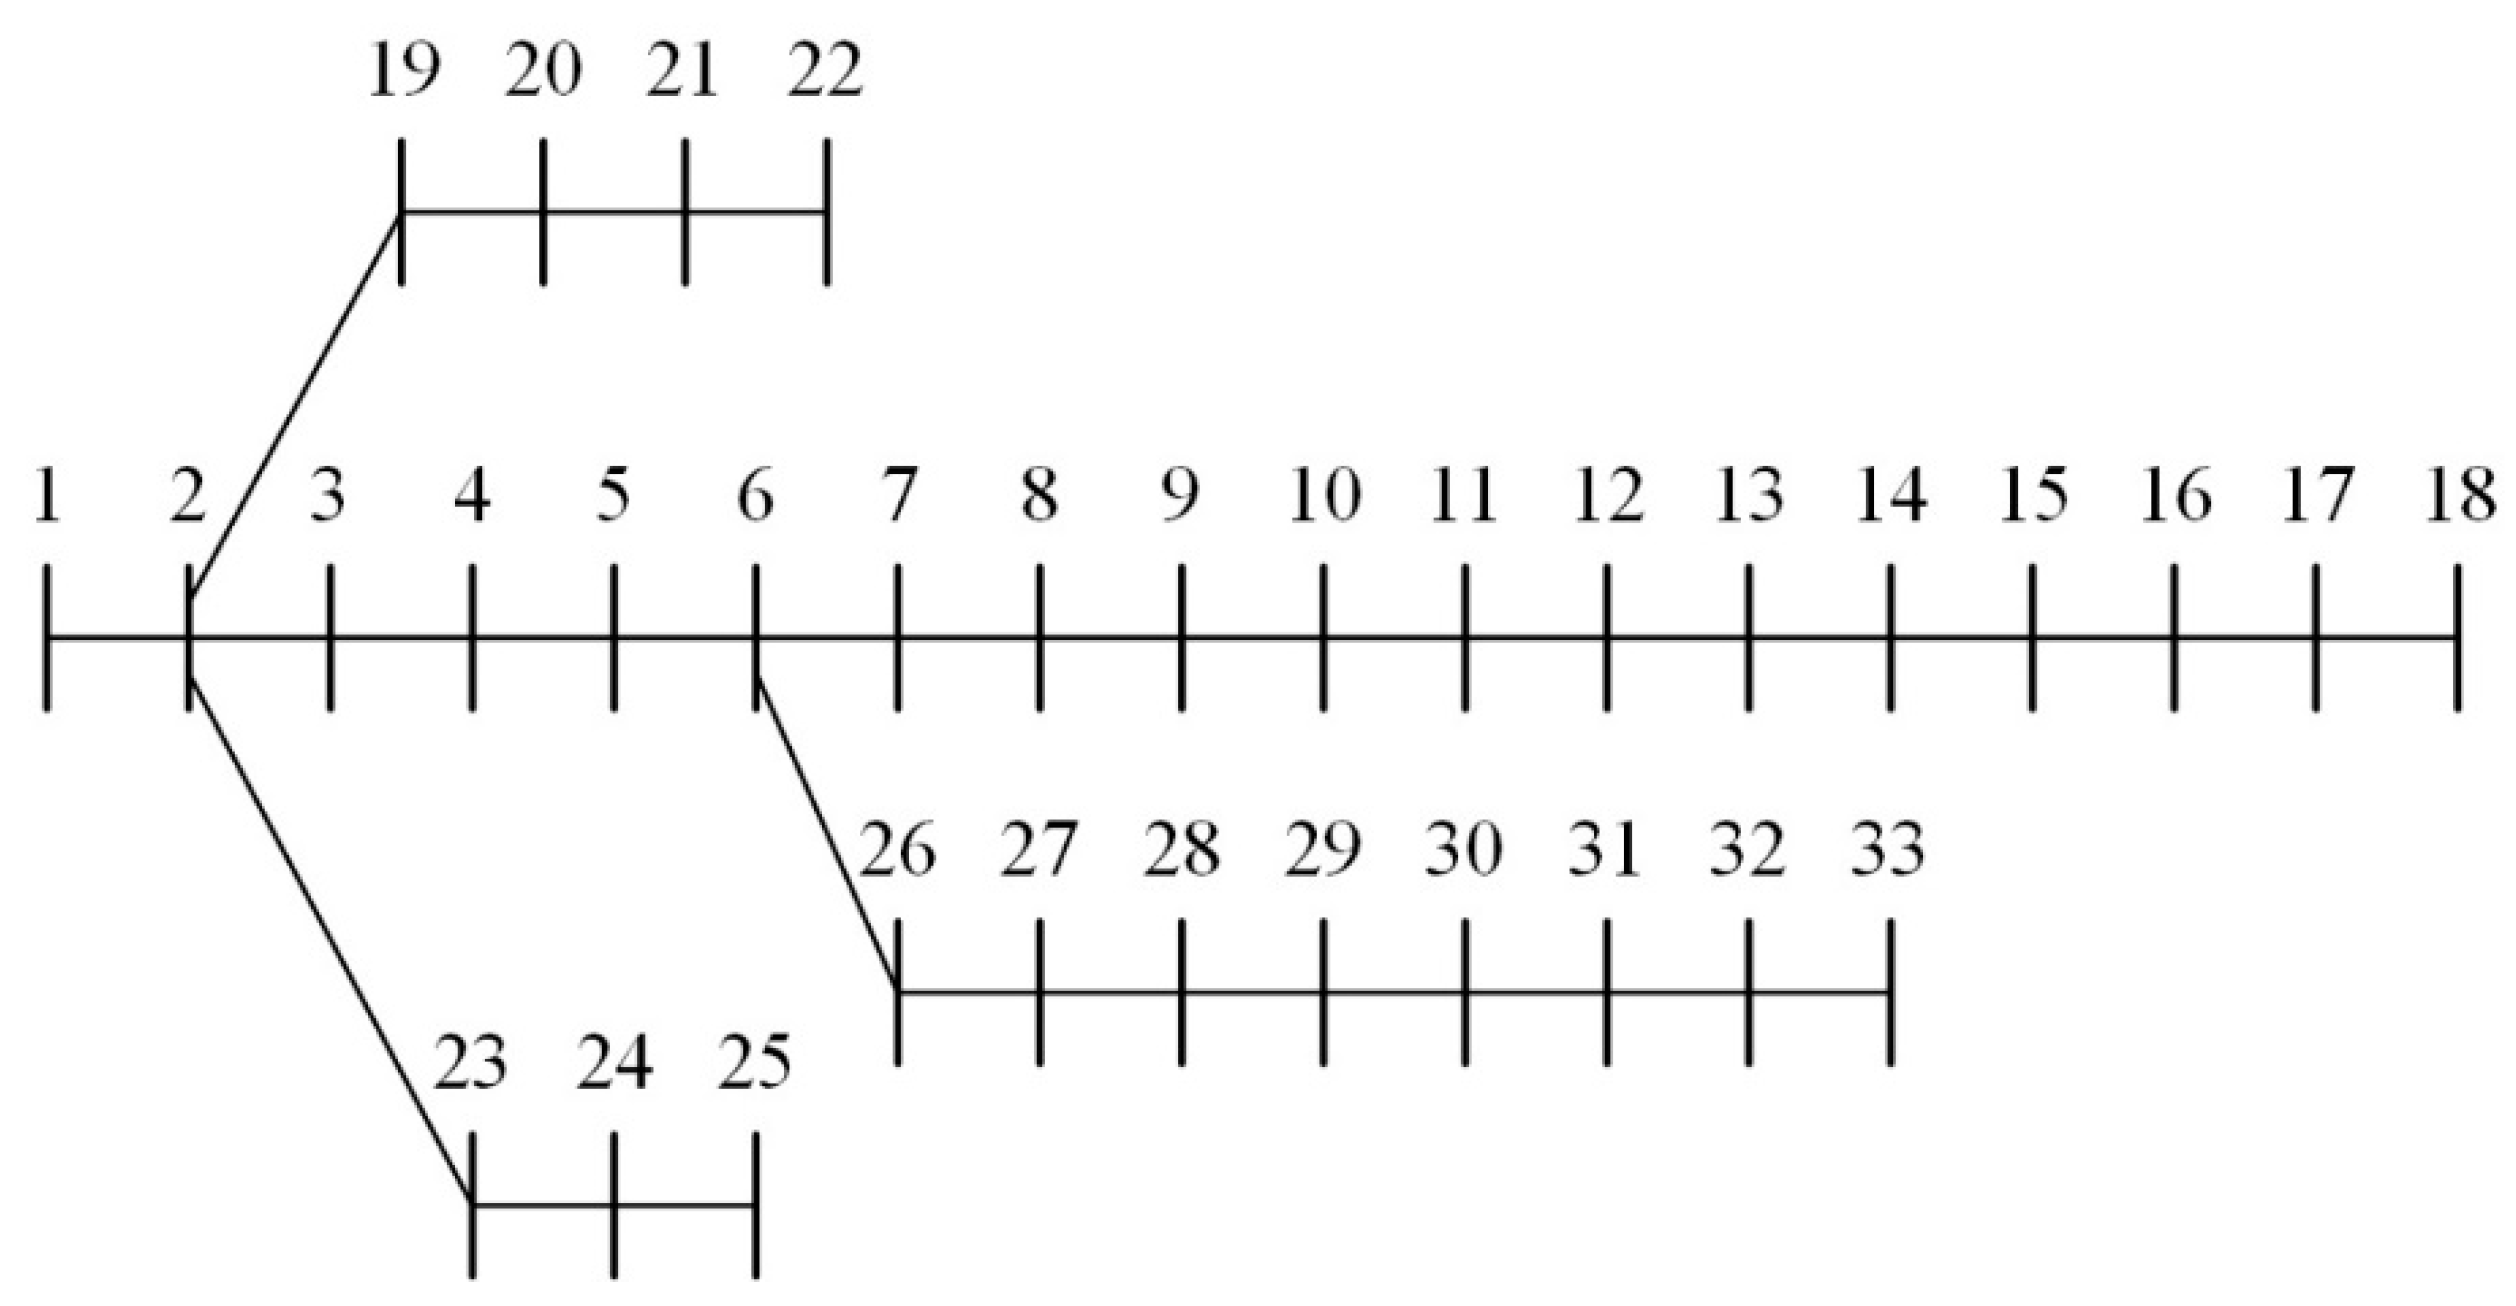
5.1. Parameter Setting

The expected value u s and standard deviation σ s of EV initial charging time are set to 17.6 and 3.4, respectively, in this paper [14]. The initial charge state is determined by the uniform distribution U (0.3, 0.5), while the expected battery charge state is set to 1. The EV’s battery capacity is 48 kWh. Since this paper assumes that the EV uses the slow charging mode and the 7 kW charger was shown to be effective in earlier literature [19], the charging power in this paper is set to 7 kW. Given the power loss when charging, a charging efficiency of 0.9 is chosen.
The proposed method is demonstrated using a 32-branch IEEE-33 node standard distribution network. The system voltage is 12.66 kV, and the network topology is shown in Figure 4. The parameters of the distribution network are presented in Table 1 [27], and the daily load curve for the distribution network is depicted in Figure 5 [28].

5.2. Analysis

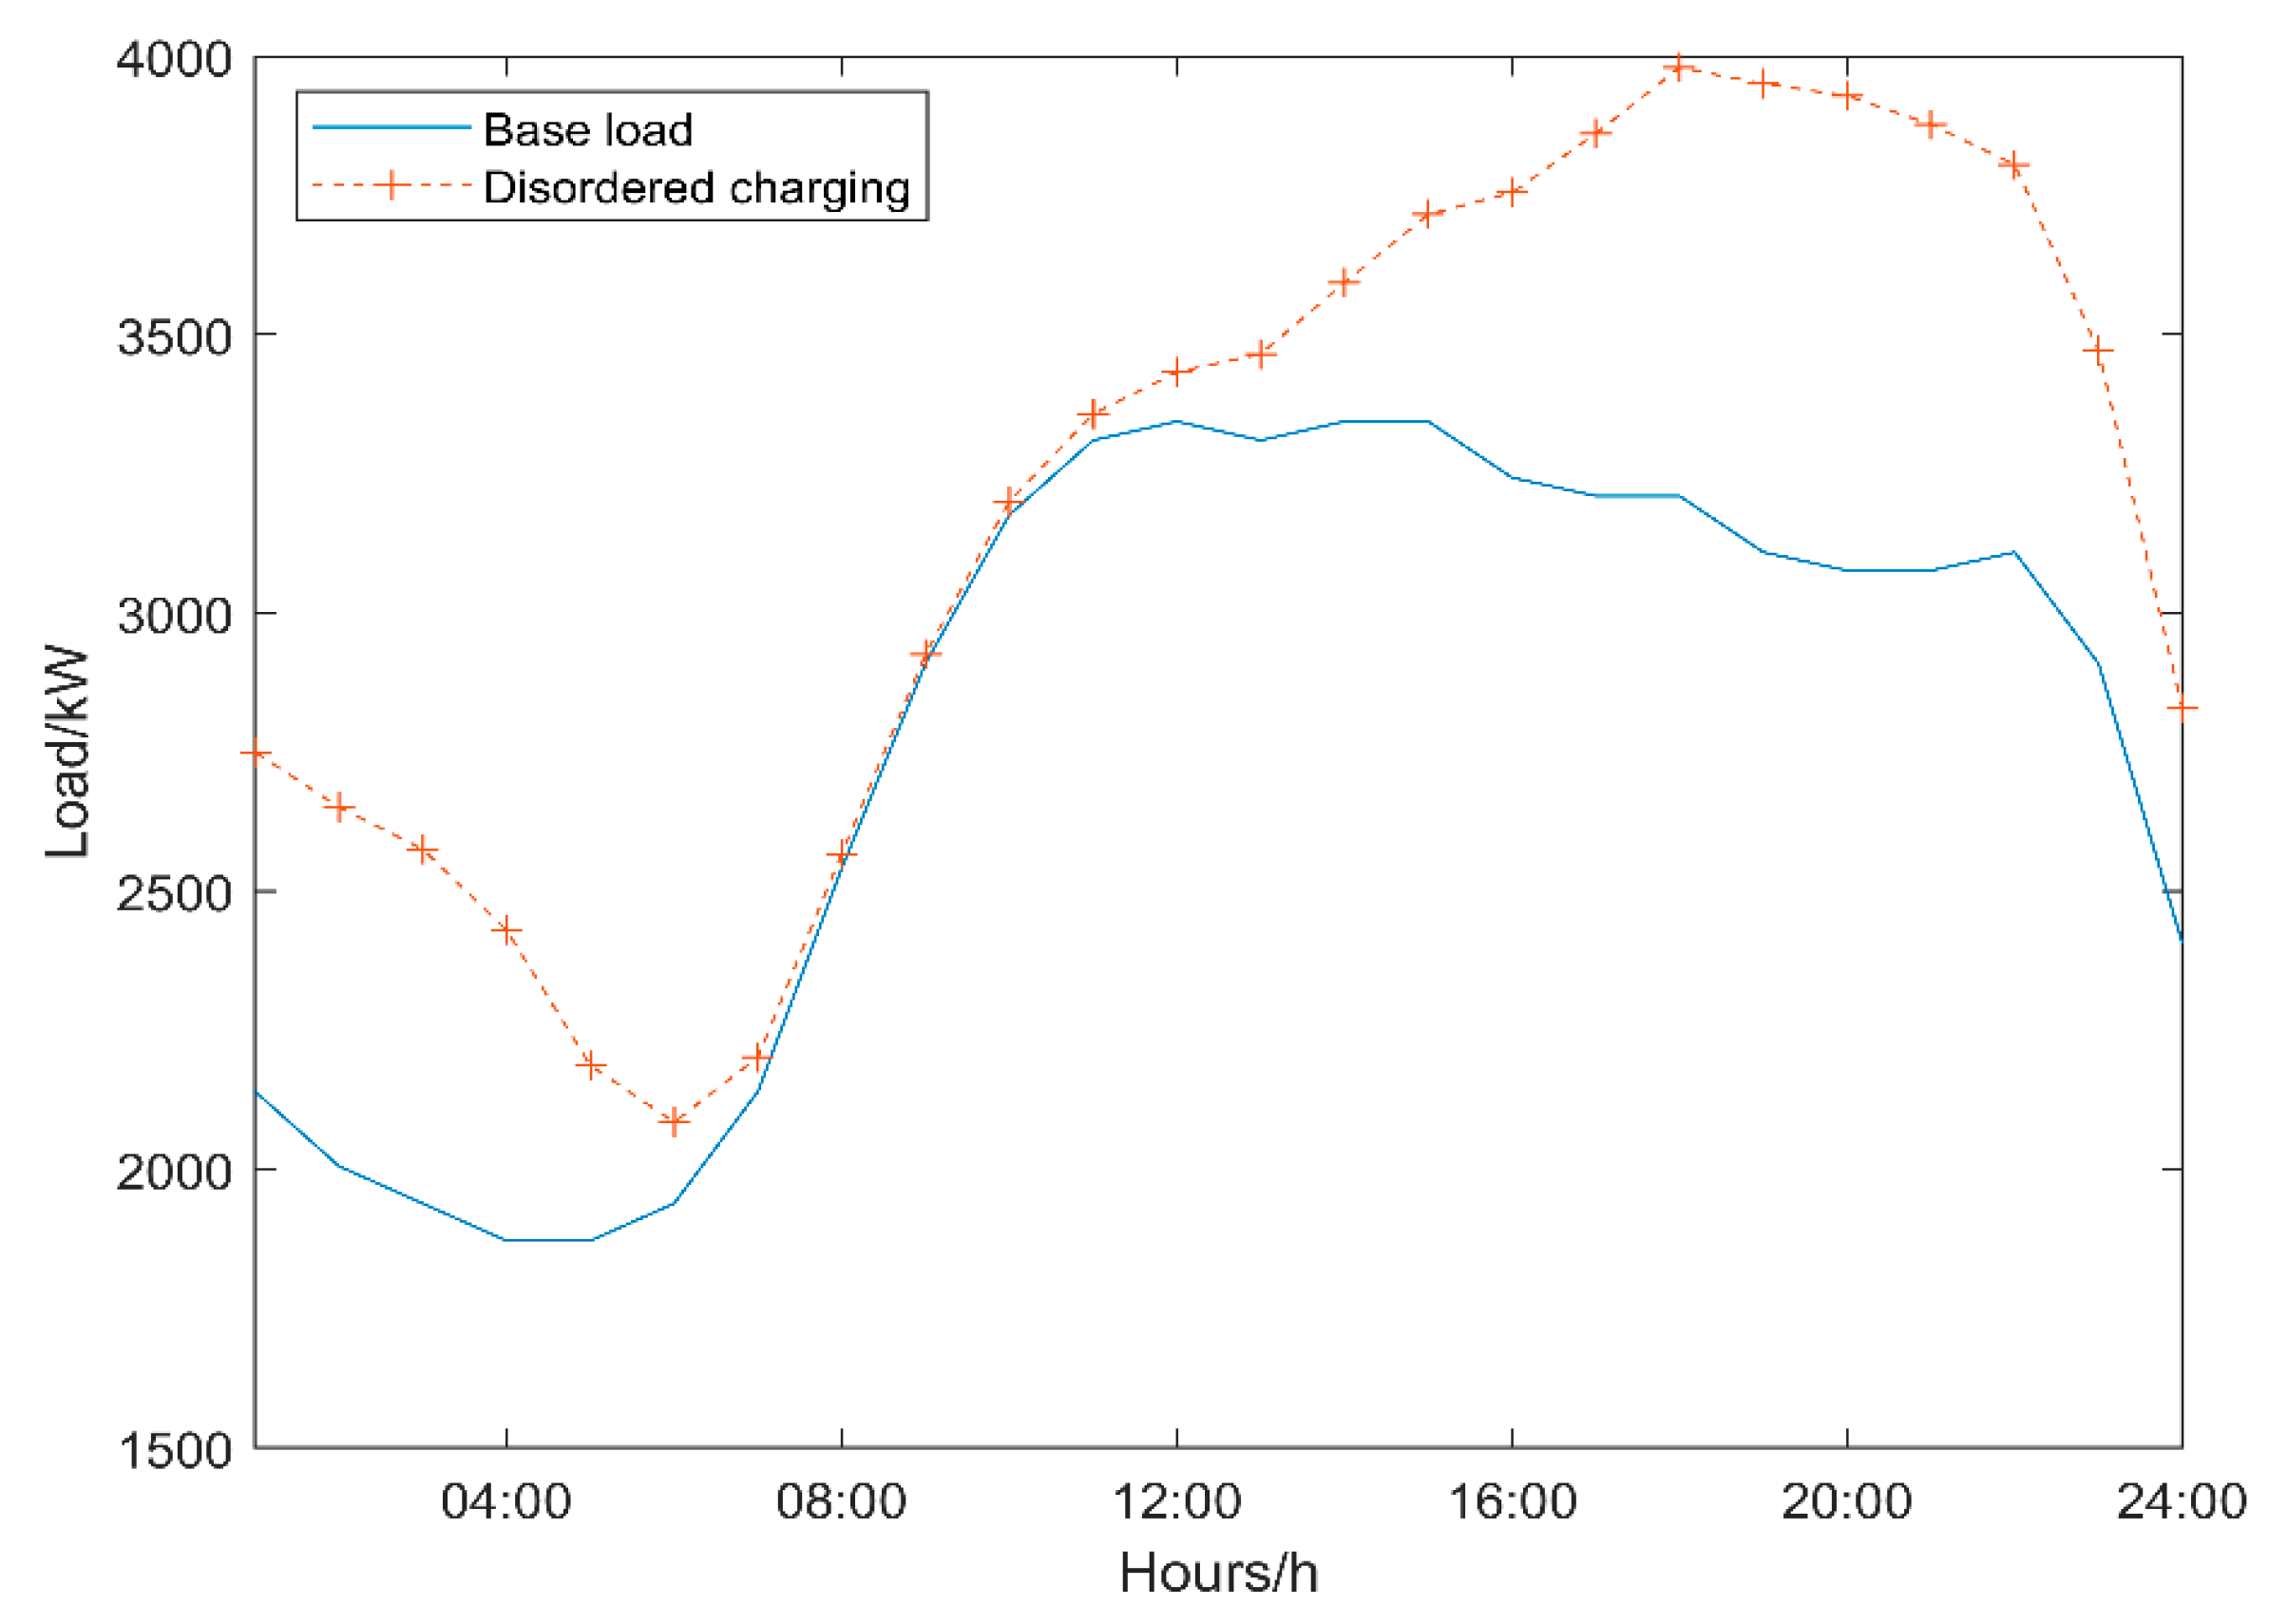
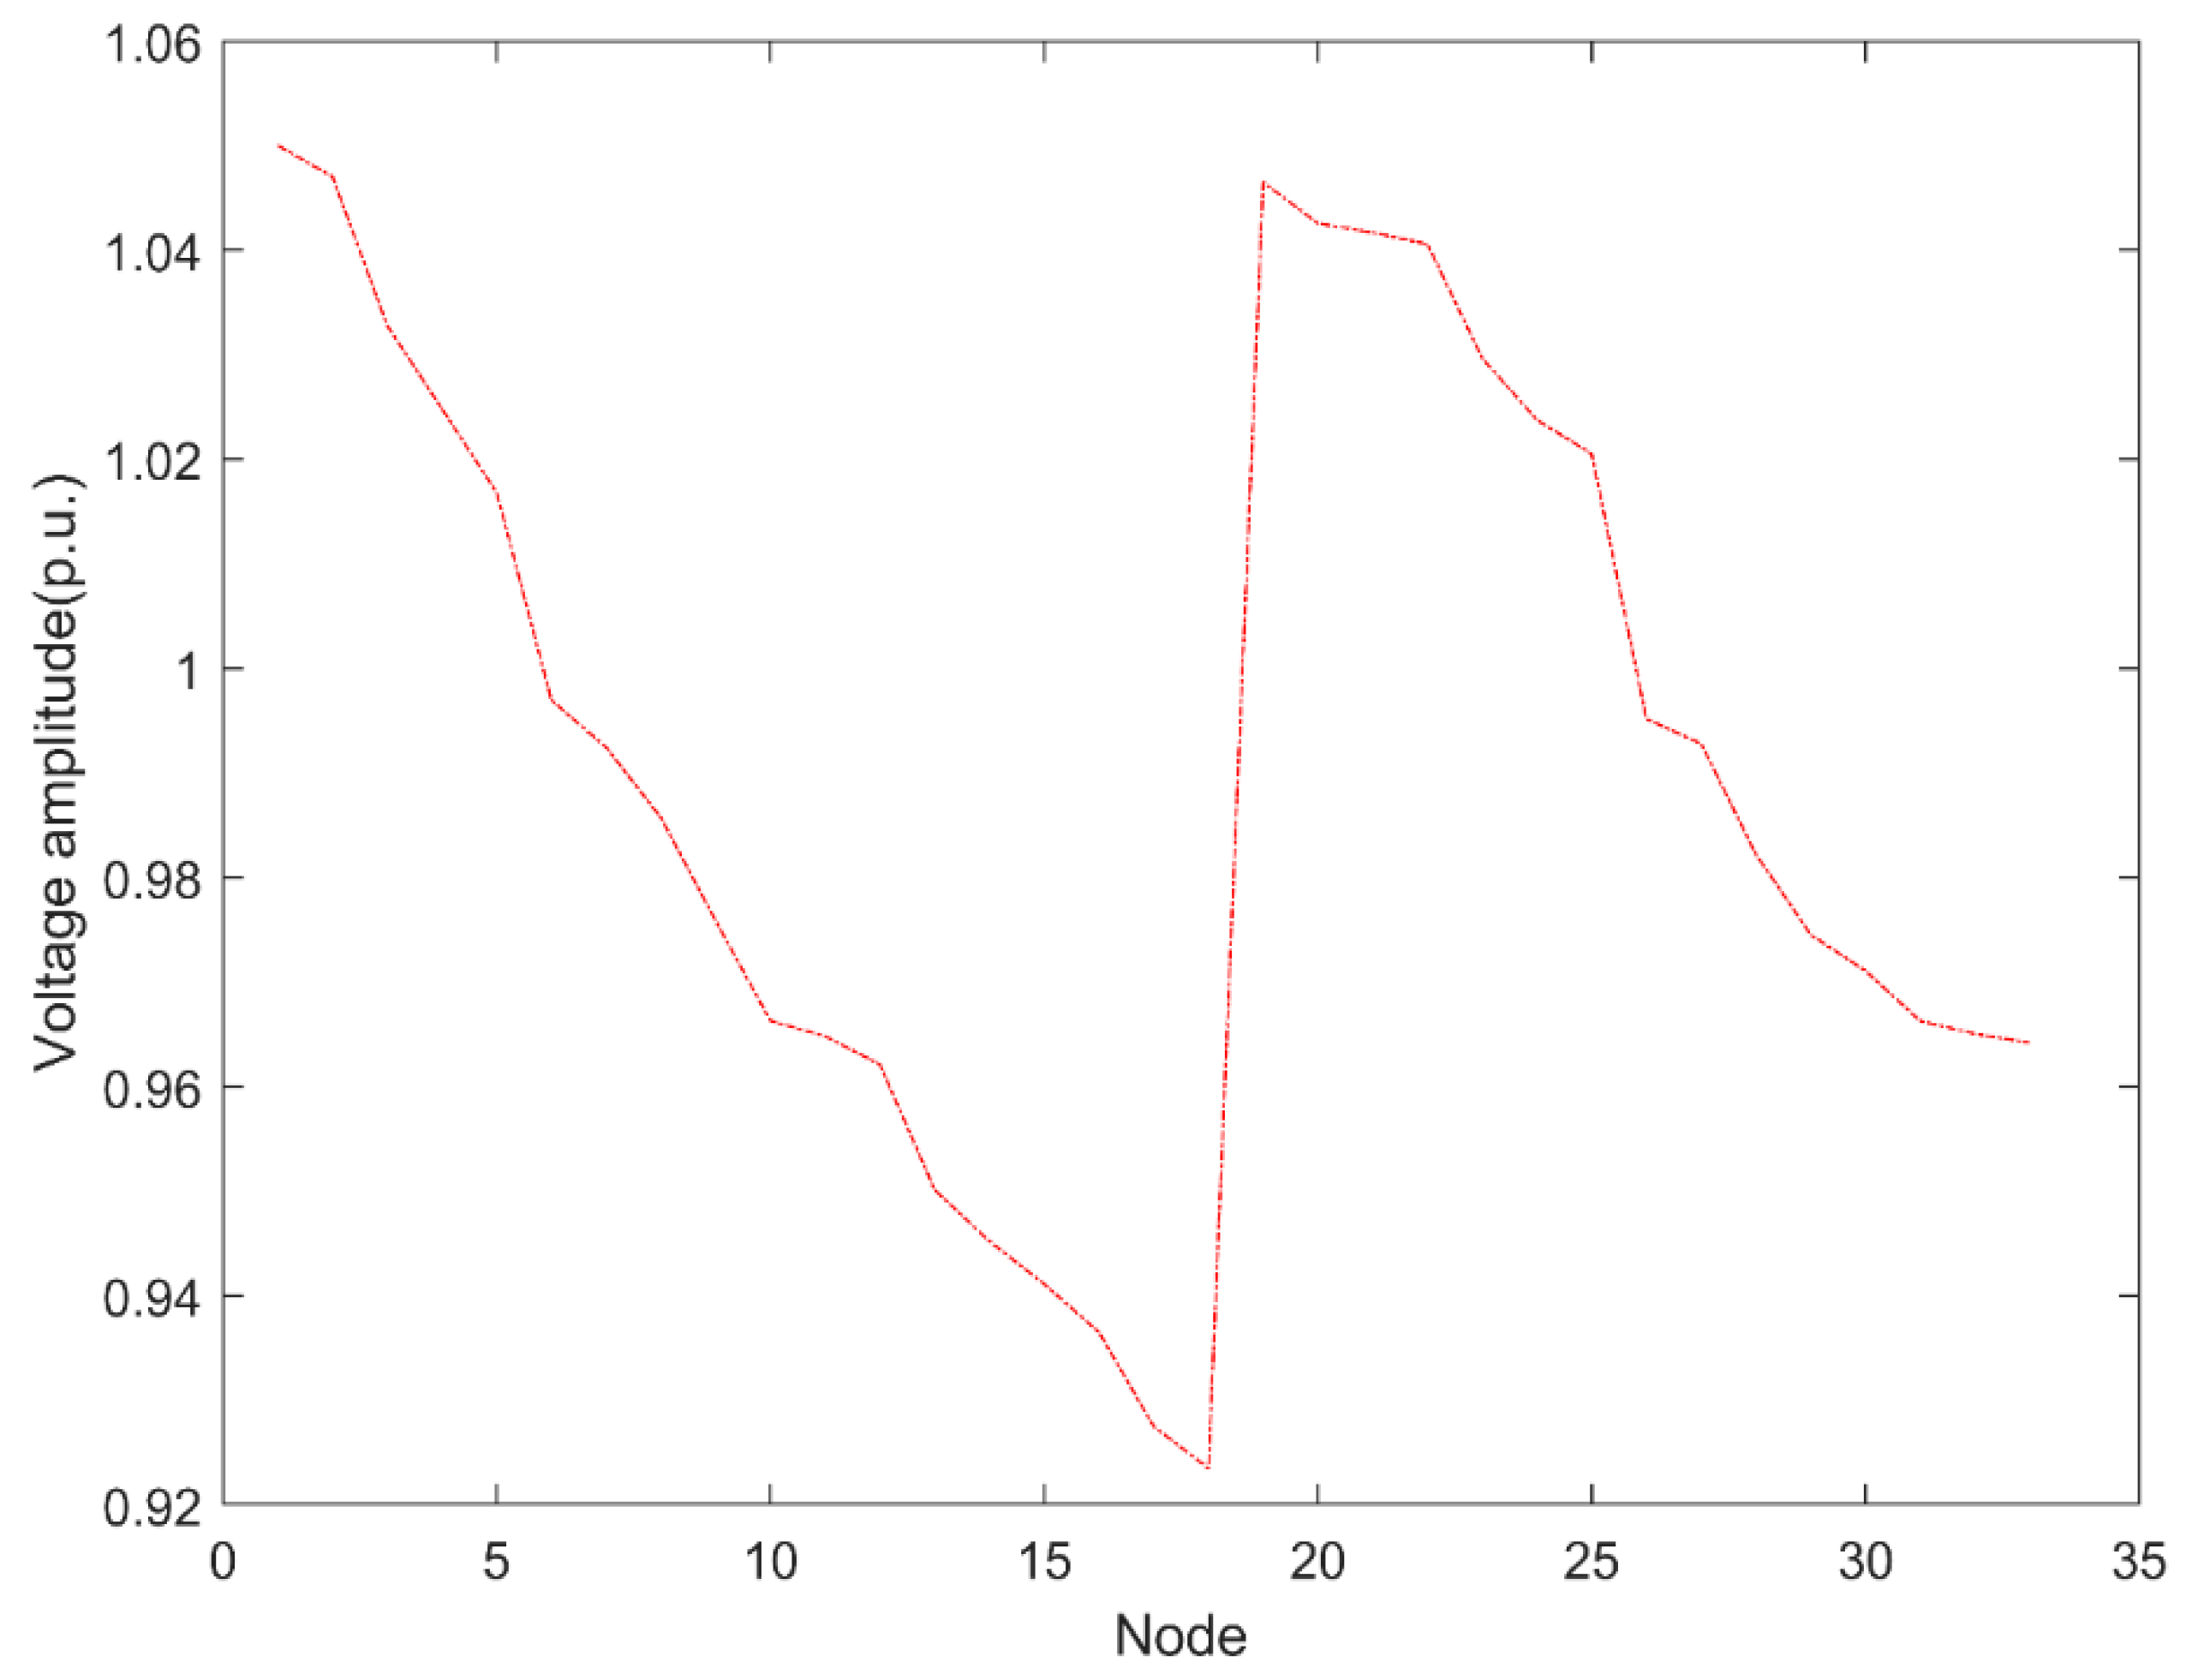
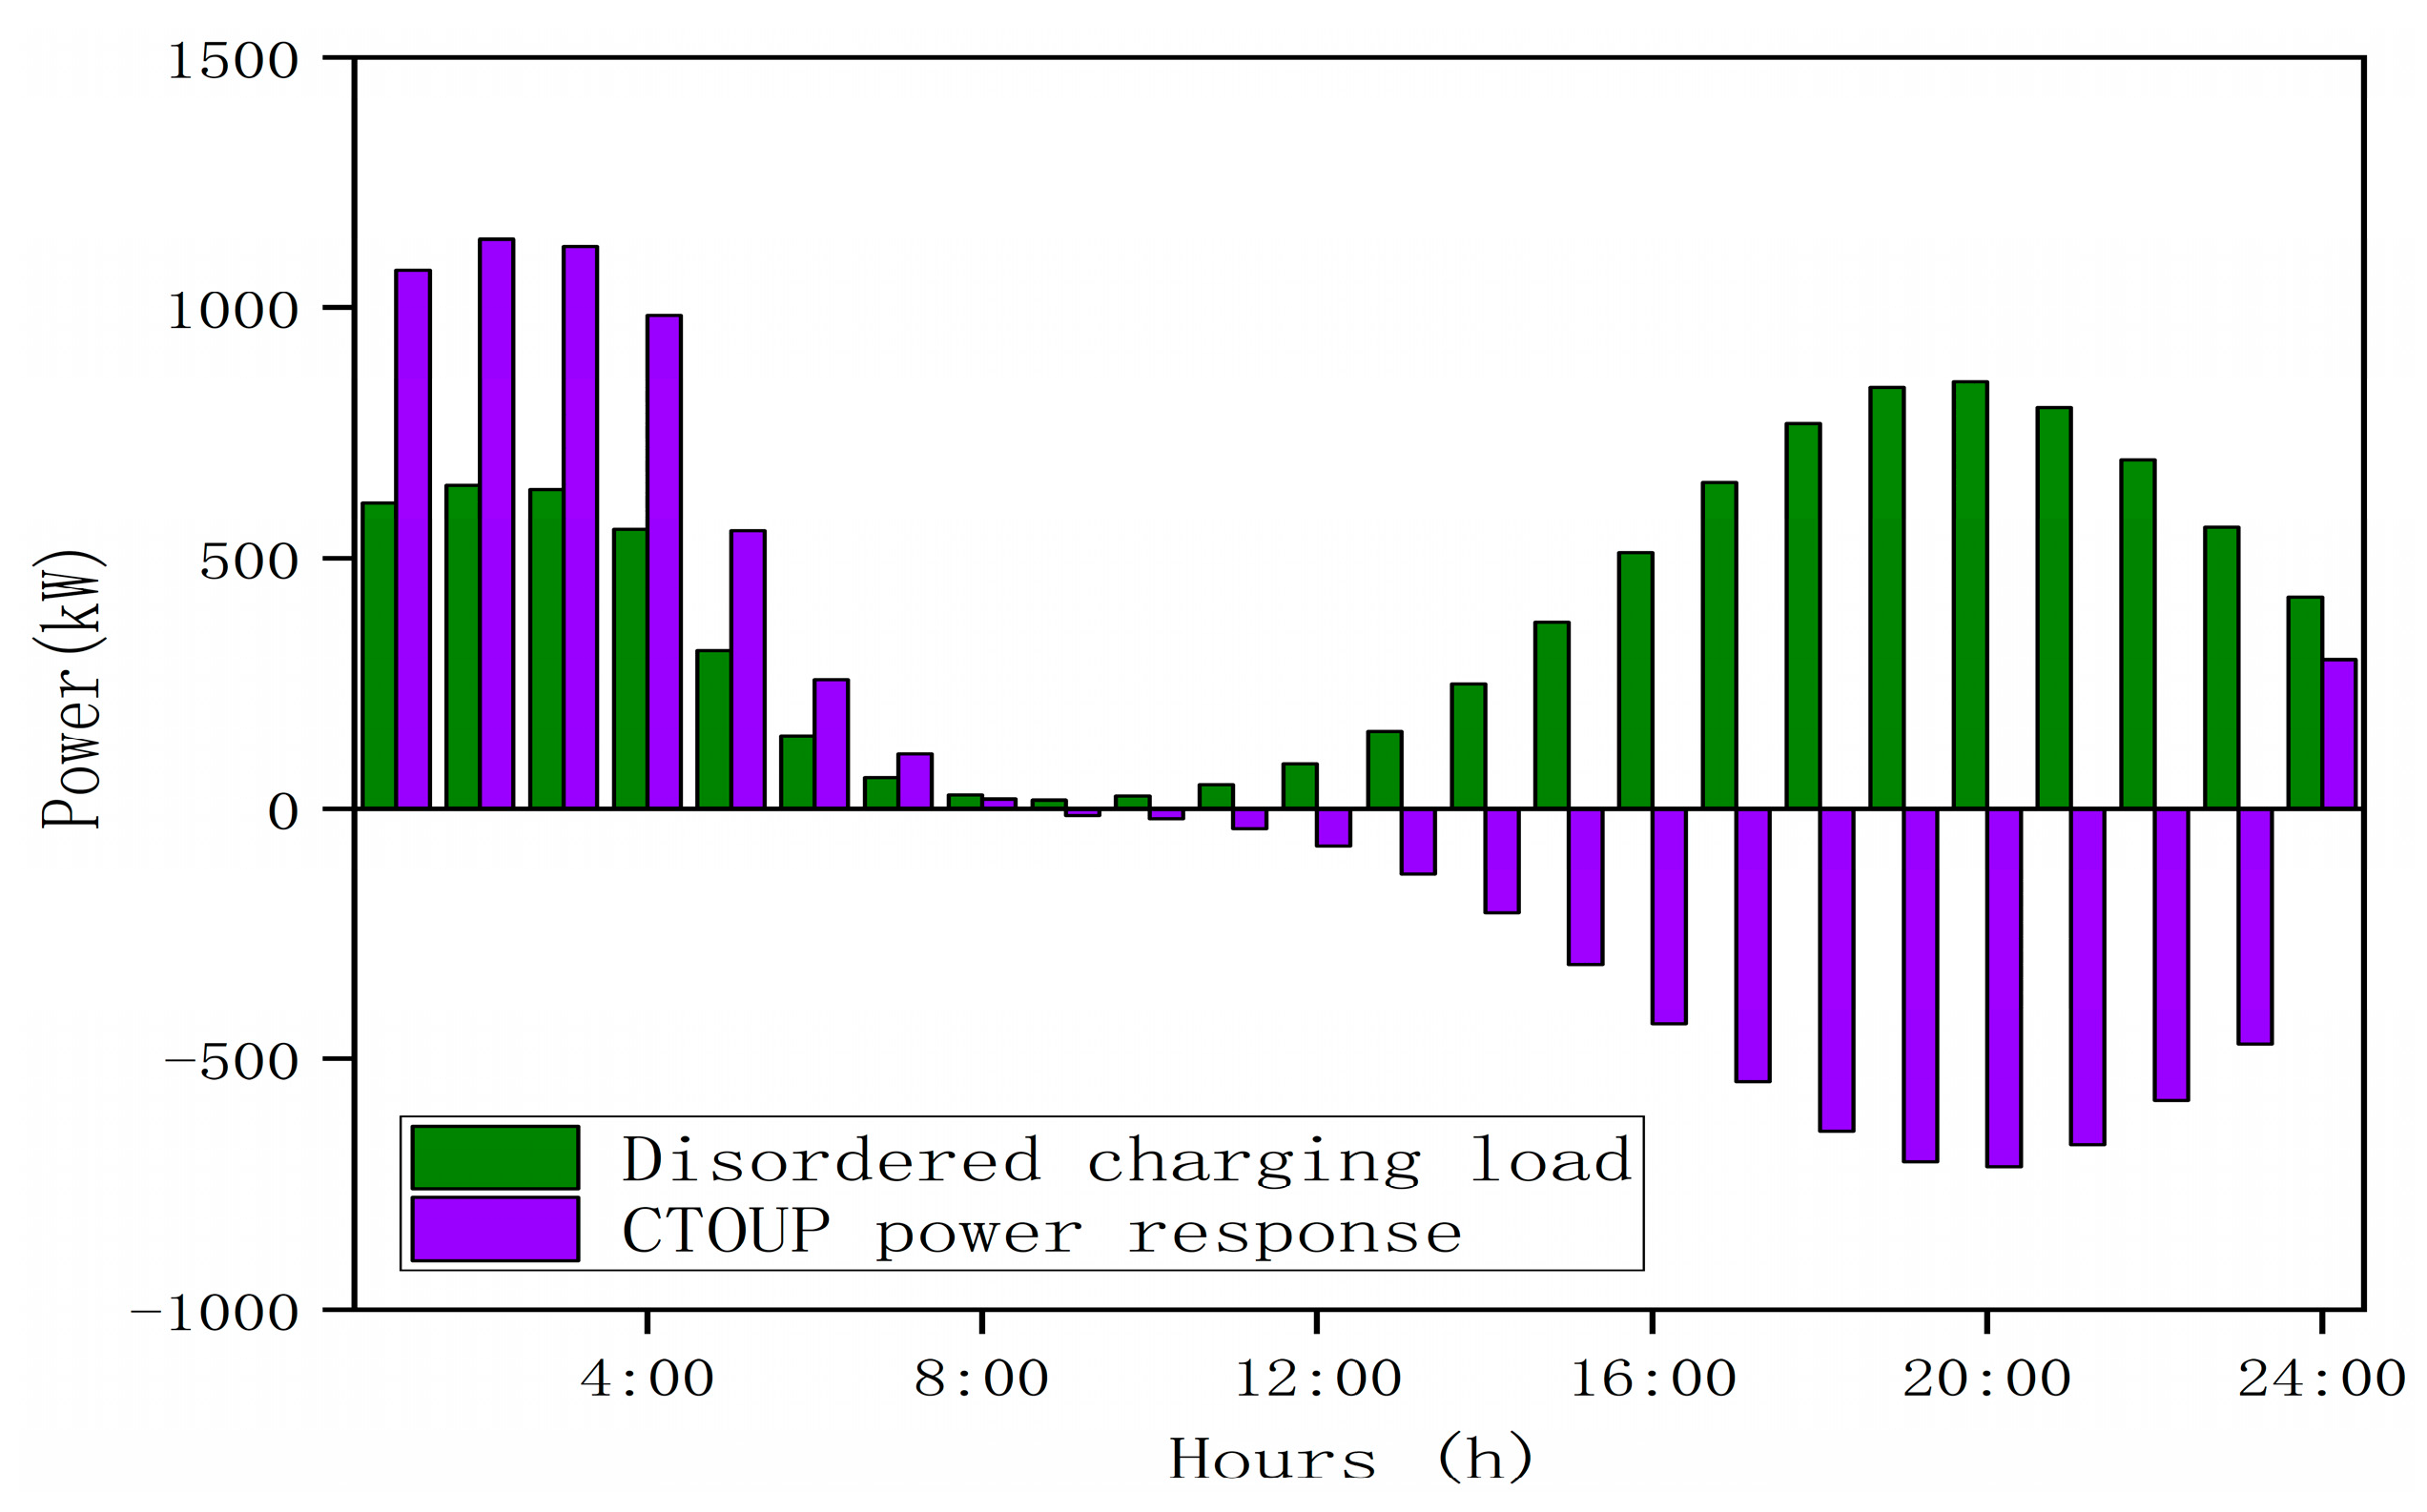
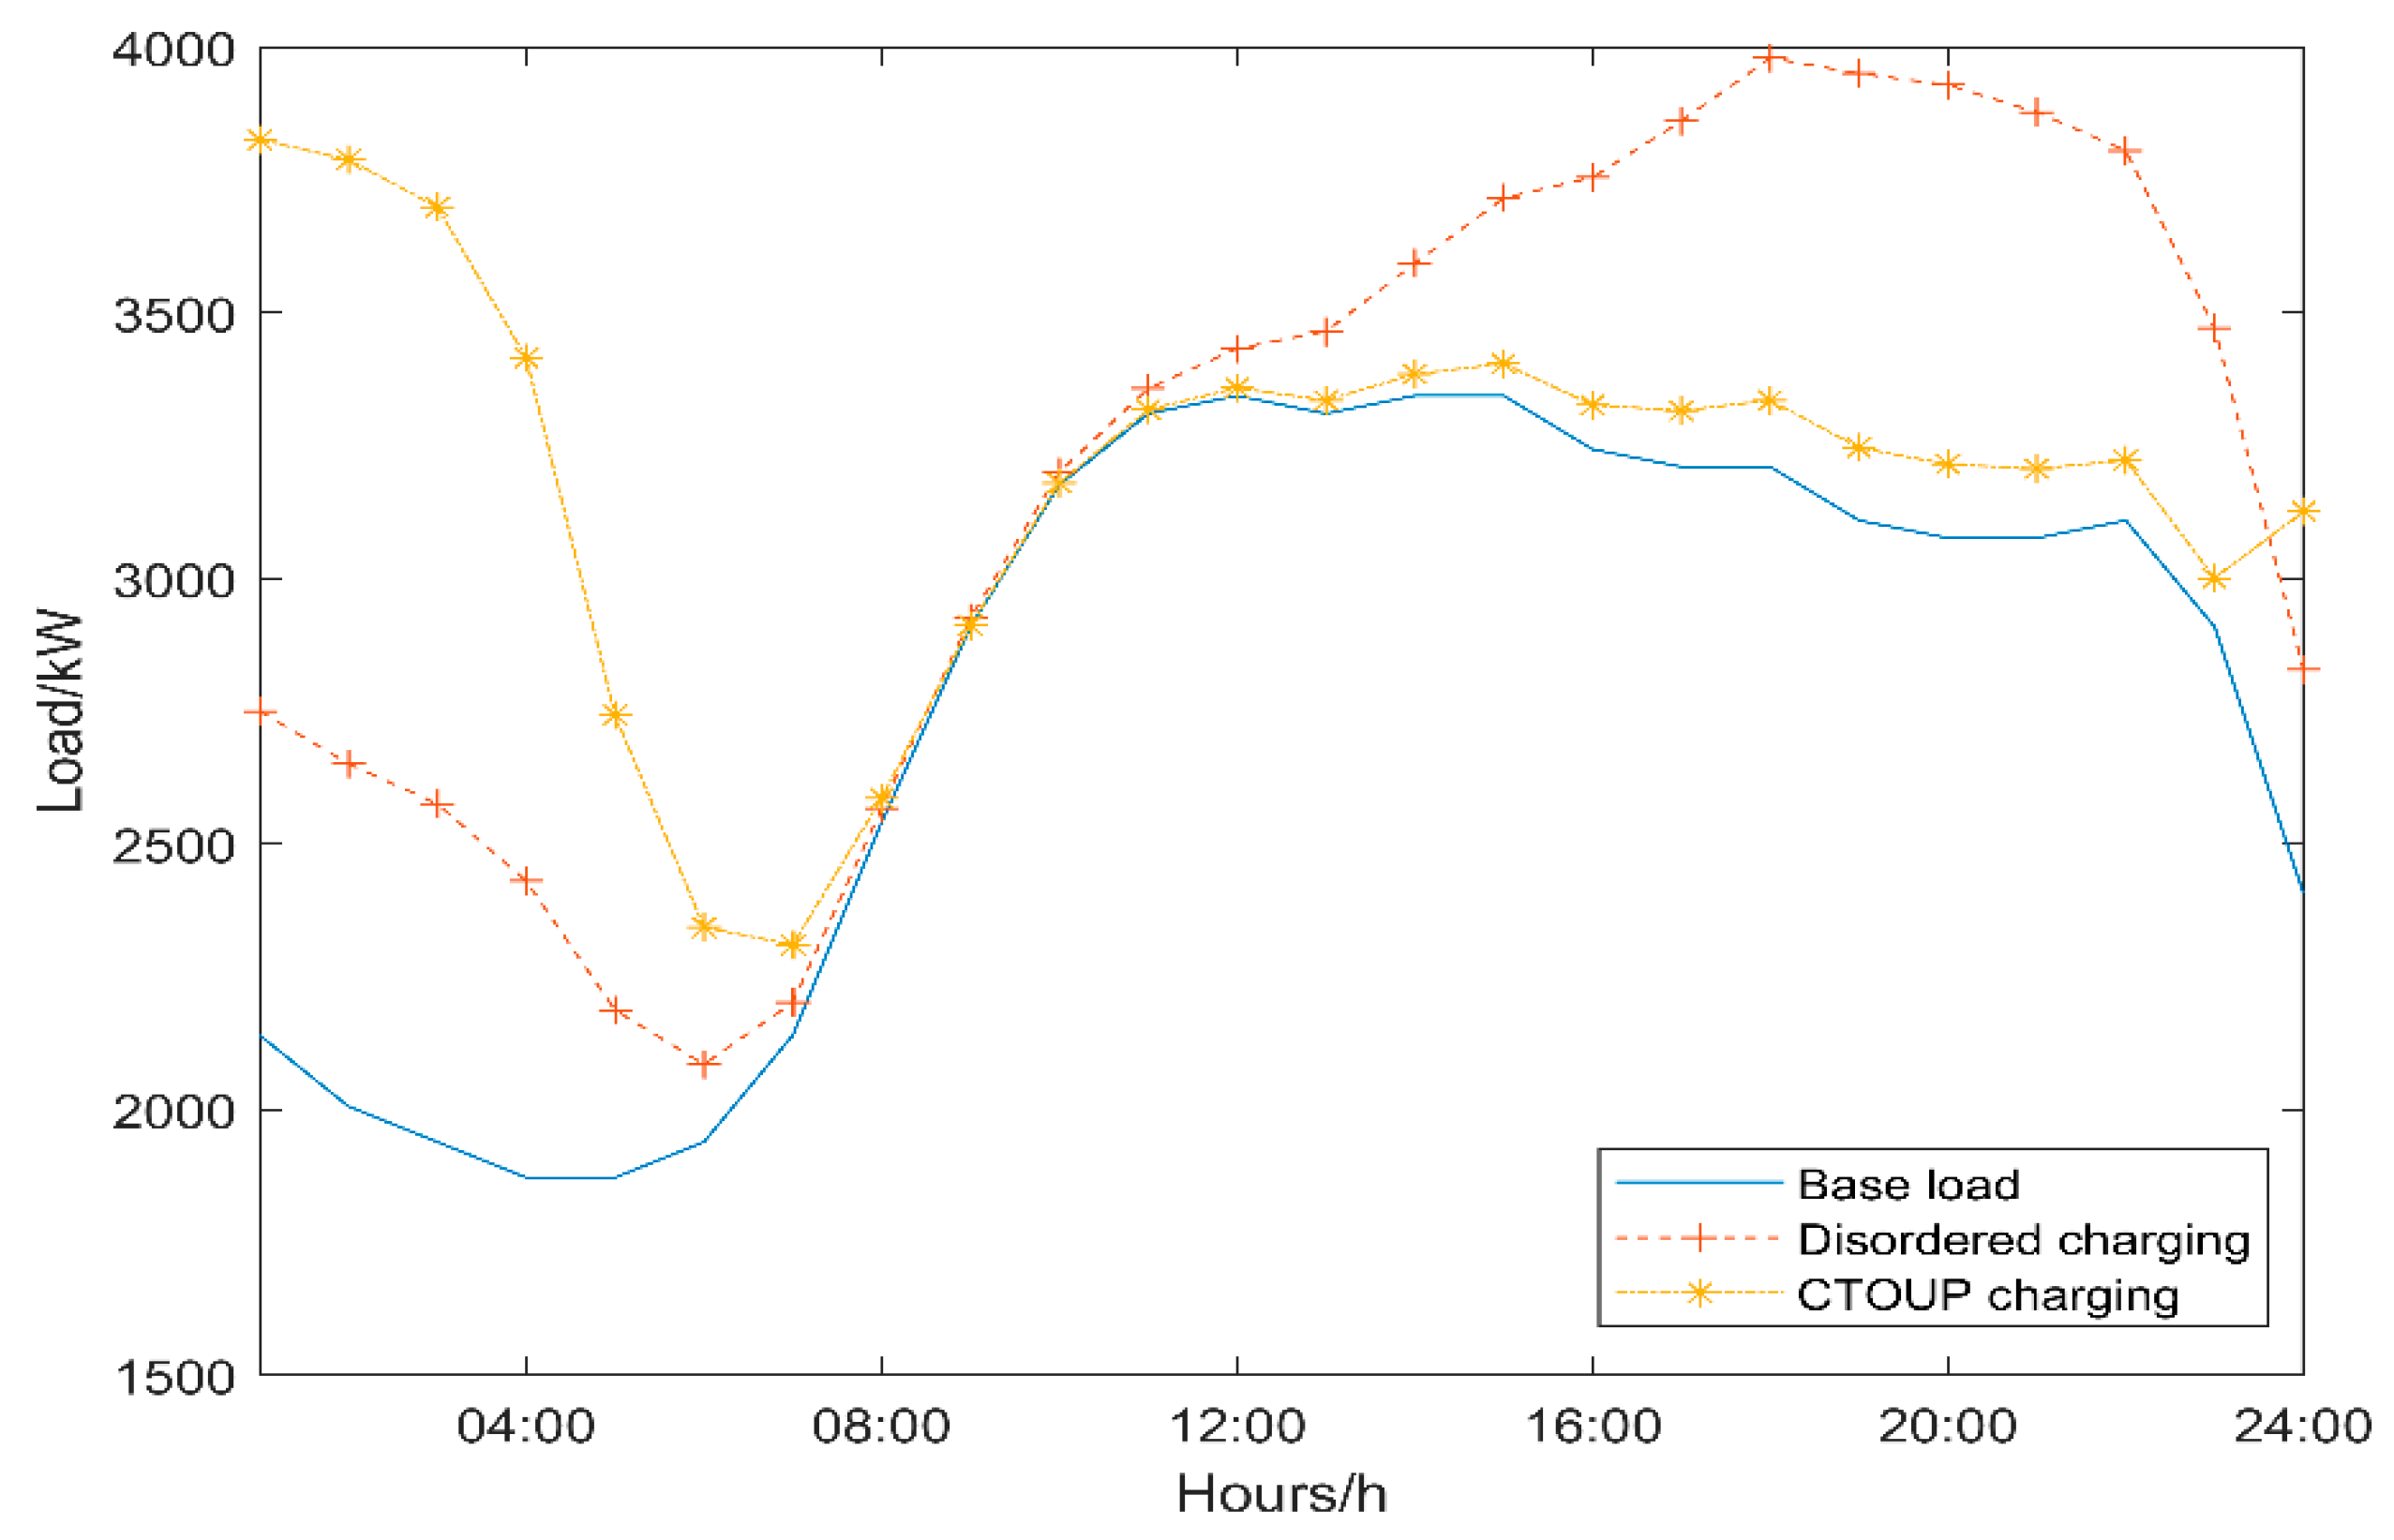
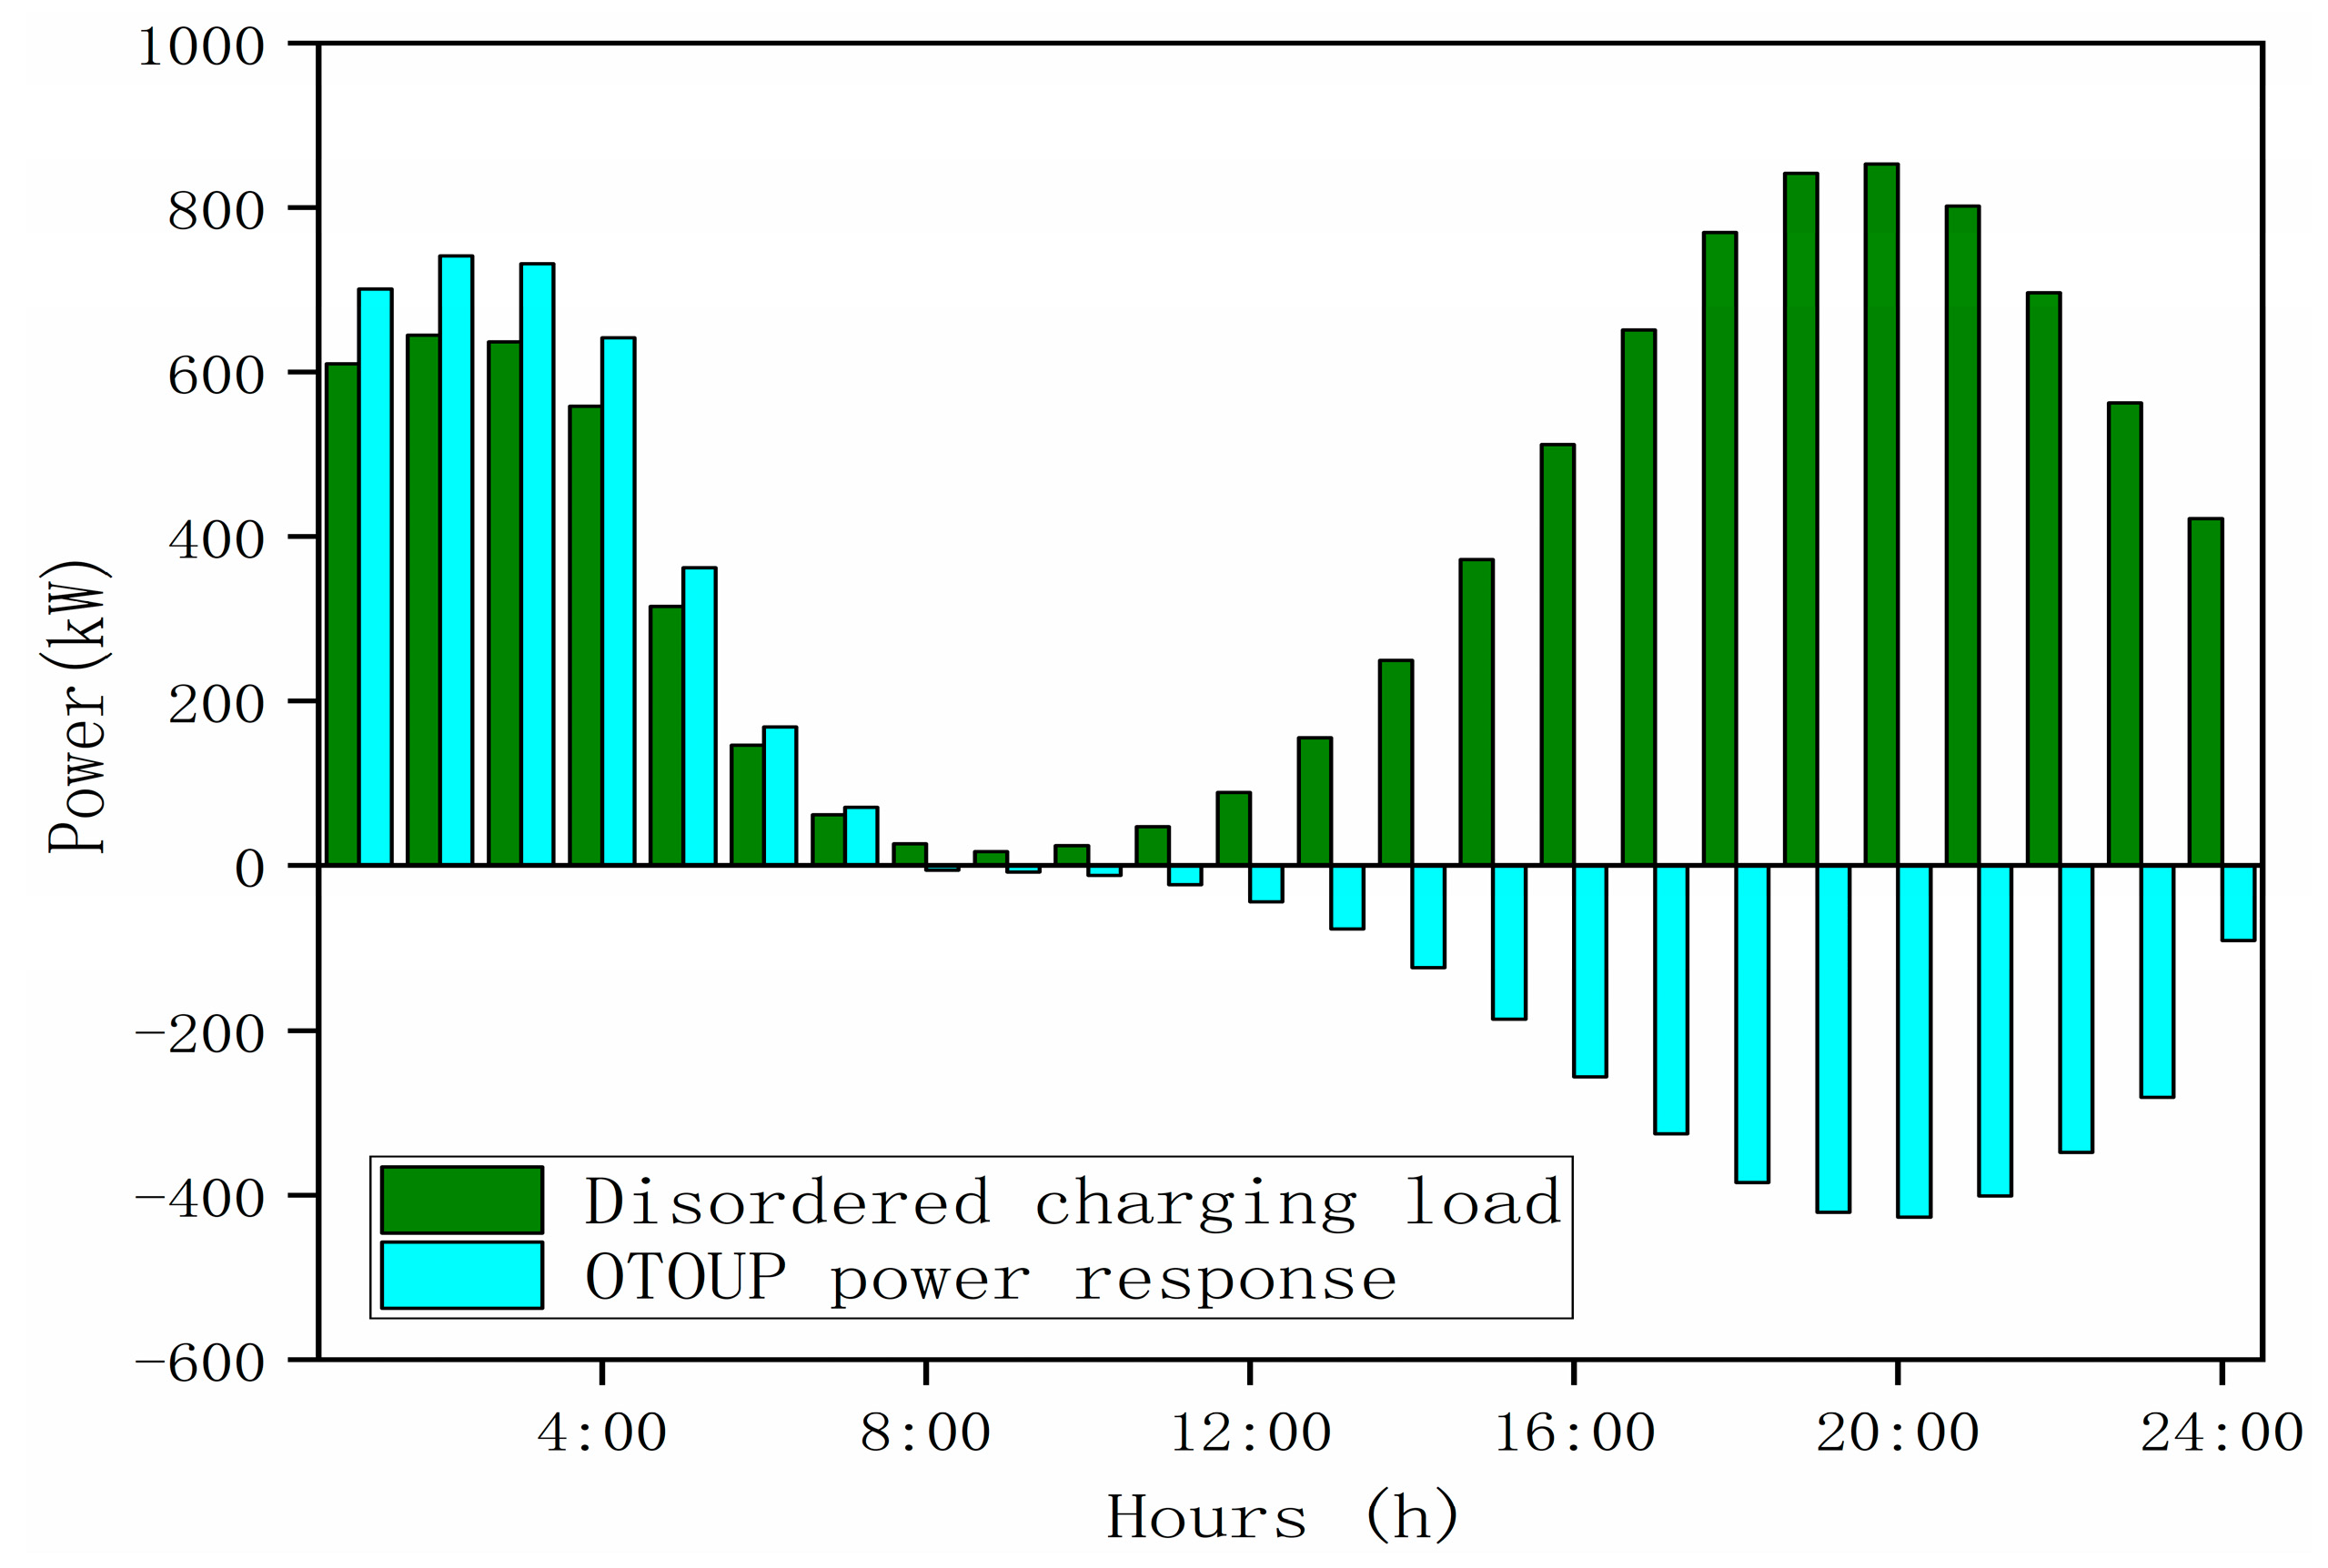
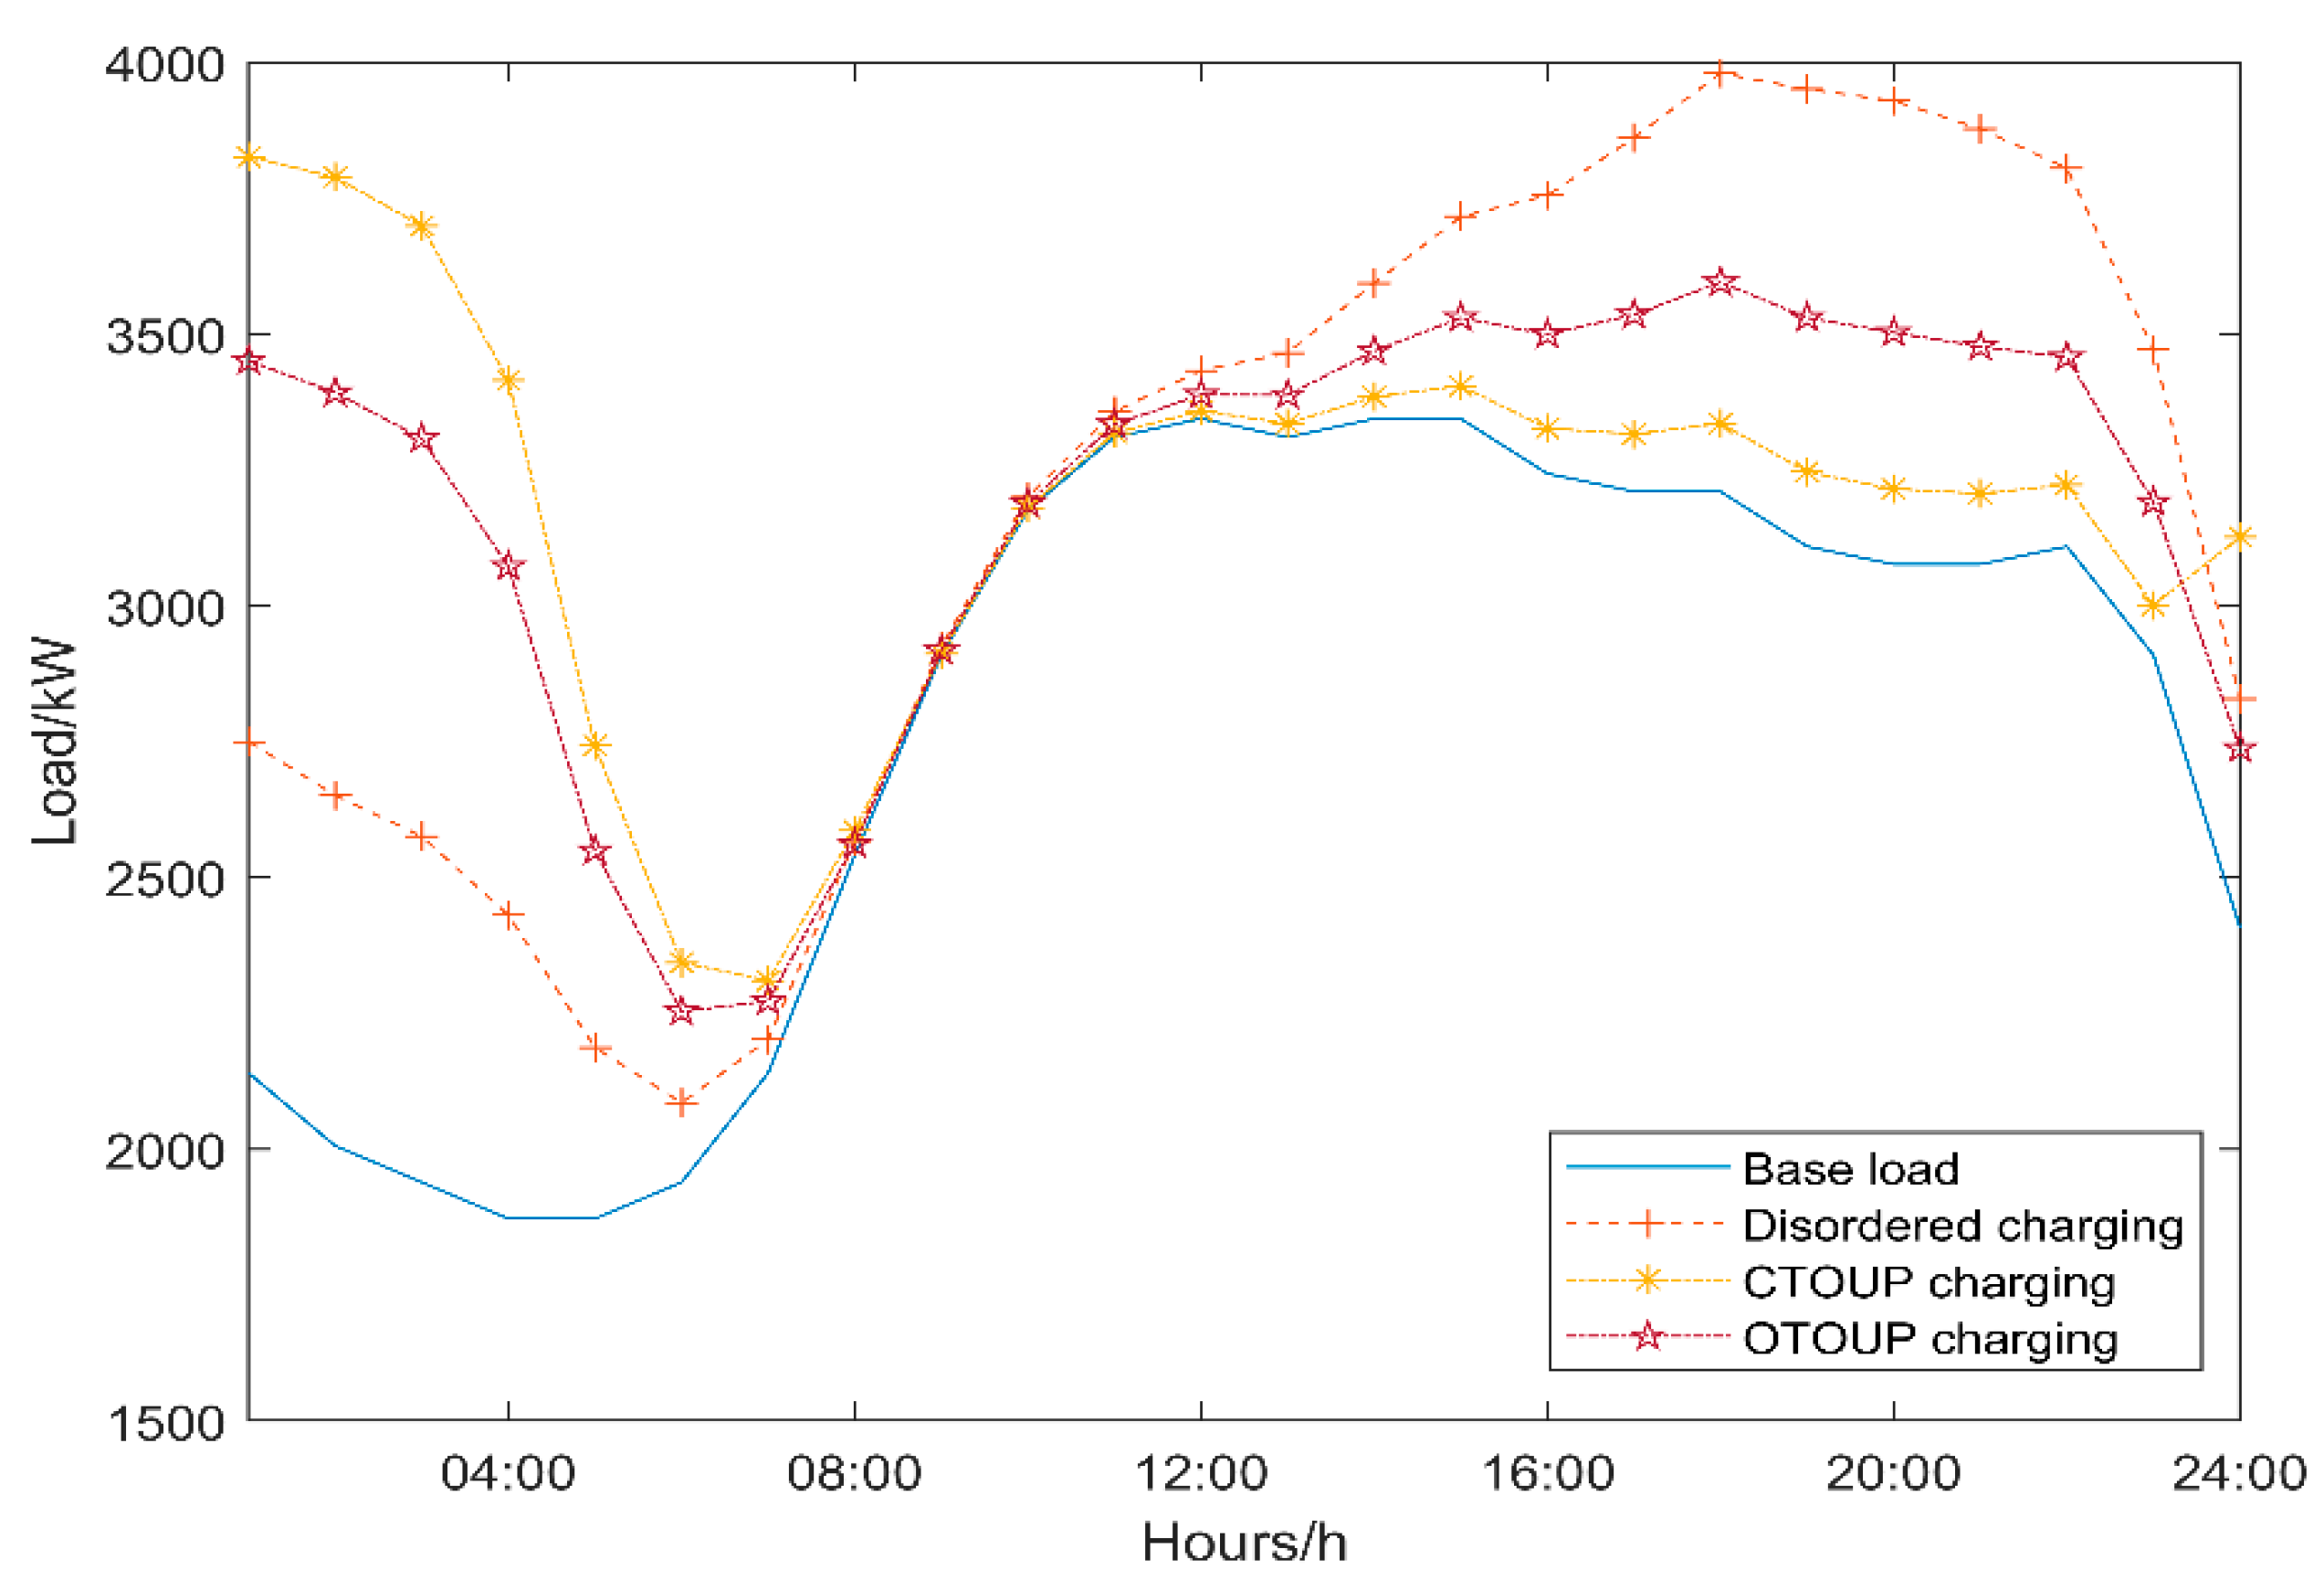
5.2.1. Results of Optimal Electricity Price Charging for EVs

To demonstrate the efficacy of the orderly charging of OTOUP presented in this research, we compared it with two other charging scenarios: disordered charging and CTOUP response charging.
Scenario 1: Disordered charging (fixed price charging). The input of Scenario 1 is composed of four components: a grid load curve, a load time division, a price for energy for each time period, and an EV disorderly charging load curve. The disorderly charging mode is assumed to use fixed electricity rates and that the peak, flat, and valley power costs all measure 0.6 CNY/kWh in this article. The output of an EV’s unordered charging process is comprised of four components: the standard deviation of load fluctuation, the peak–valley difference in load, the charging cost, and the voltage deviation. As there are no measurements of EV charging in an ordered fashion, the first three outputs can be calculated simply using the grid load curve and the EV charging load curve in an ordered fashion. The load from each period of the disordered charging load curve is added to the IEEE-33 distribution network system, and the grid’s overall voltage deviation is calculated by subtracting the difference between the highest and lowest voltages in all periods.
Scenario 2: CTOUP charging. Scenario 2’s inputs are identical to those of scenario 1, except that the electricity price for each period is different. In scenario 2, CTOUP is considered for each period, and the peak, flat, and valley prices are, respectively, 1.05, 0.75, and 0.45 CNY/kWh. The procedure for EVs to participate in demand response is as follows: The first step is to determine the variance in electricity prices throughout each period covered by the CTOUP based on the fixed charging price (0.6 CNY/kWh). In the second stage, one may obtain the charging load curve for EVs under the demand response of a CTOUP by utilizing Equation (30) from the publication. In the third stage, scenario 2 produces the same four outputs as scenario 1, which can be obtained by applying the same calculation method to the charging curve after response and grid load curves as scenario 1.
Scenario 3: OTOUP charging. The remaining three inputs in scenario 3 are identical to those in scenarios 1 and 2, except for the fact that the price of electricity varies over time. In scenario 3, EVs will participate in the demand response process to decide the OTOUP, and the study develops a multi-objective optimization model using Equations (31)–(35). The following protocol applies to EVs participating in the OTOUP demand response program: The first step is to randomly establish the electricity price within the acceptable range. In this article, peak electricity costs range between 0.9 and 1.2 CNY/kWh, flat electricity prices range between 0.6 and 0.9 CNY/kWh, and valley electricity prices range between 0.3 and 0.6 CNY/kWh. The second to fourth steps are identical to those in scenario 2. The fifth phase represents keeping the algorithm’s dominant people and selectively crossing, crossing, and modifying them. The sixth phase iterates over the second through fifth stages previously described until the algorithm converges. Finally, using the optimal electricity price and Equation (30), the charging load curve of an EV subjected to the OTOUP demand response is determined. The four outputs of scenario 3 are identical to those of scenario 1, which may be derived by using the same calculation procedure to the charge curve after response and grid load curves as in scenario 1.
Figure 6 illustrates the charging curve of EV in scenario 1 using Monte Carlo simulation. As illustrated in the Figure 6, there are two charging peaks for EVs: one between 17:00 and 22:00 and another between 01:00 and 04:00. Figure 7 depicts the total daily load curve for superimposed EV charging loads. It can be seen that the first peak of EV charging nearly coincides with the peak period of base load, increasing the pressure on the power supply during these periods.
Since the peak EV charging load occurs at 20:00, Figure 8 shows the voltage at the system nodes during peak charging period. Node 18 bears a voltage of 0.9235 due to irregular charging of EVs. According to the distribution network’s allowable voltage deviation range of ±7%, this charging behavior will be inconducive to the safe operation of the grid. As a result, corresponding measures to guide EVs for orderly charging are meaningful to maintain the reliability of the grid.
The clustering results for load indicators under various classifications are shown in Table 2. As displayed in Table 2, when the number of classifications equals three, the corresponding clustering validity value is the greatest, indicating that this method produces the best clustering effect. As a result, the base load is divided into three phases: peak, flat, and valley. The peak period is from 9:00 to 23:00, the flat period is 8:00 and 24:00, and the valley period is from 1:00 to 7:00.
In scenario 2, Figure 9 illustrates the comparison between the disordered charging load of an EV (green column diagram) and the CTOUP power response (purple column diagram). The portion of the purple bar chart with a positive value represents the increased charging amount for EVs during this period following the demand response, while the portion of the color bar chart with a negative value represents the decreased charging amount for EVs during this period following the demand response. As illustrated in Figure 9, a significant portion of the charging demand for EVs during peak hours is transferred to the low load period, which serves to improve the load profile. However, it is easy to identify that the increase of charging load between 1:00 and 4:00 a.m. is nearly double the initial charging load, resulting in a new load peak. Figure 10 depicts the load demand curve of EVs prior to and following the response of CTOUP. The aggregation charging behavior of EVs reduces the power grid’s minimum voltage level below the safe level. Figure 11 depicts the power grid’s voltage distribution during the peak charging period.
In scenario 3, Figure 12 compares the EV’s disordered charging load (green column diagram) to the OTOUP power response (cyan column diagram). The positive portion of the cyan histogram indicates that the EV’s charging amount increased during this period following the demand response, while the negative portion indicates that the EV’s charging amount decreased during this period following the demand response. Figure 12 illustrates how the OTOUP incentive affects the charging behavior of EV users, and how the load reduction during peak hours is transferred to the night trough period. In comparison to CTOUP, no new load peak occurs following an EV demand response. The charging curves of an EV prior to and following the OTOUP response are depicted in Figure 13. Although the lowest voltage of 0.9422 is generated at 2:00 a.m., it all remains within the permissible range of voltage and effectively ensures the power grid’s stability. The voltage profile of the distribution network during the OTOUP charging peak period is depicted in Figure 14.
Table 3 compares the charging of EVs in various scenarios. As the table indicates, disorderly charging proves the worst. The standard deviation of load fluctuation increased from 553.72 to 621.83 kilowatts, while the peak–valley difference increased from 1472 to 1895 kilowatts. Additionally, the operating voltage is unqualified, and the high charging costs are prohibitively expensive for consumers. In comparison to disordered charging, CTOUP charging is a significant improvement. In comparison to disordered charging, the standard deviation of load fluctuation is reduced by 242.39 kW, and the peak–valley difference is decreased by 379 kW. When load fluctuation is reduced, the user’s economy is also somewhat improved. The cost of charging is reduced from CNY 6036 to 5404.7 in the case of disordered charging. While the night load transfer reduces the minimum voltage to 0.9219, jeopardizing the safe operation of the power grid. By and large, when the OTOUP is used, the charging effect is optimal. The standard deviation of load fluctuation is reduced by 214.67 kW when disordered charging is employed, and the peak–valley difference is further reduced by 174 kW when OTOUP are used, achieving the best effect of load smoothing. The power grid’s minimum voltage is increased to 0.9422, ensuring the grid’s reliability, while the voltage deviation is the lowest of the three charging scenarios. Additionally, EV users’ charging costs are low, which facilitates their participation in demand responsive charging strategies to a certain extent. This charging strategy can balance the interests of the power grid and the EV user, which is critical to solve the charging problem of EVs.

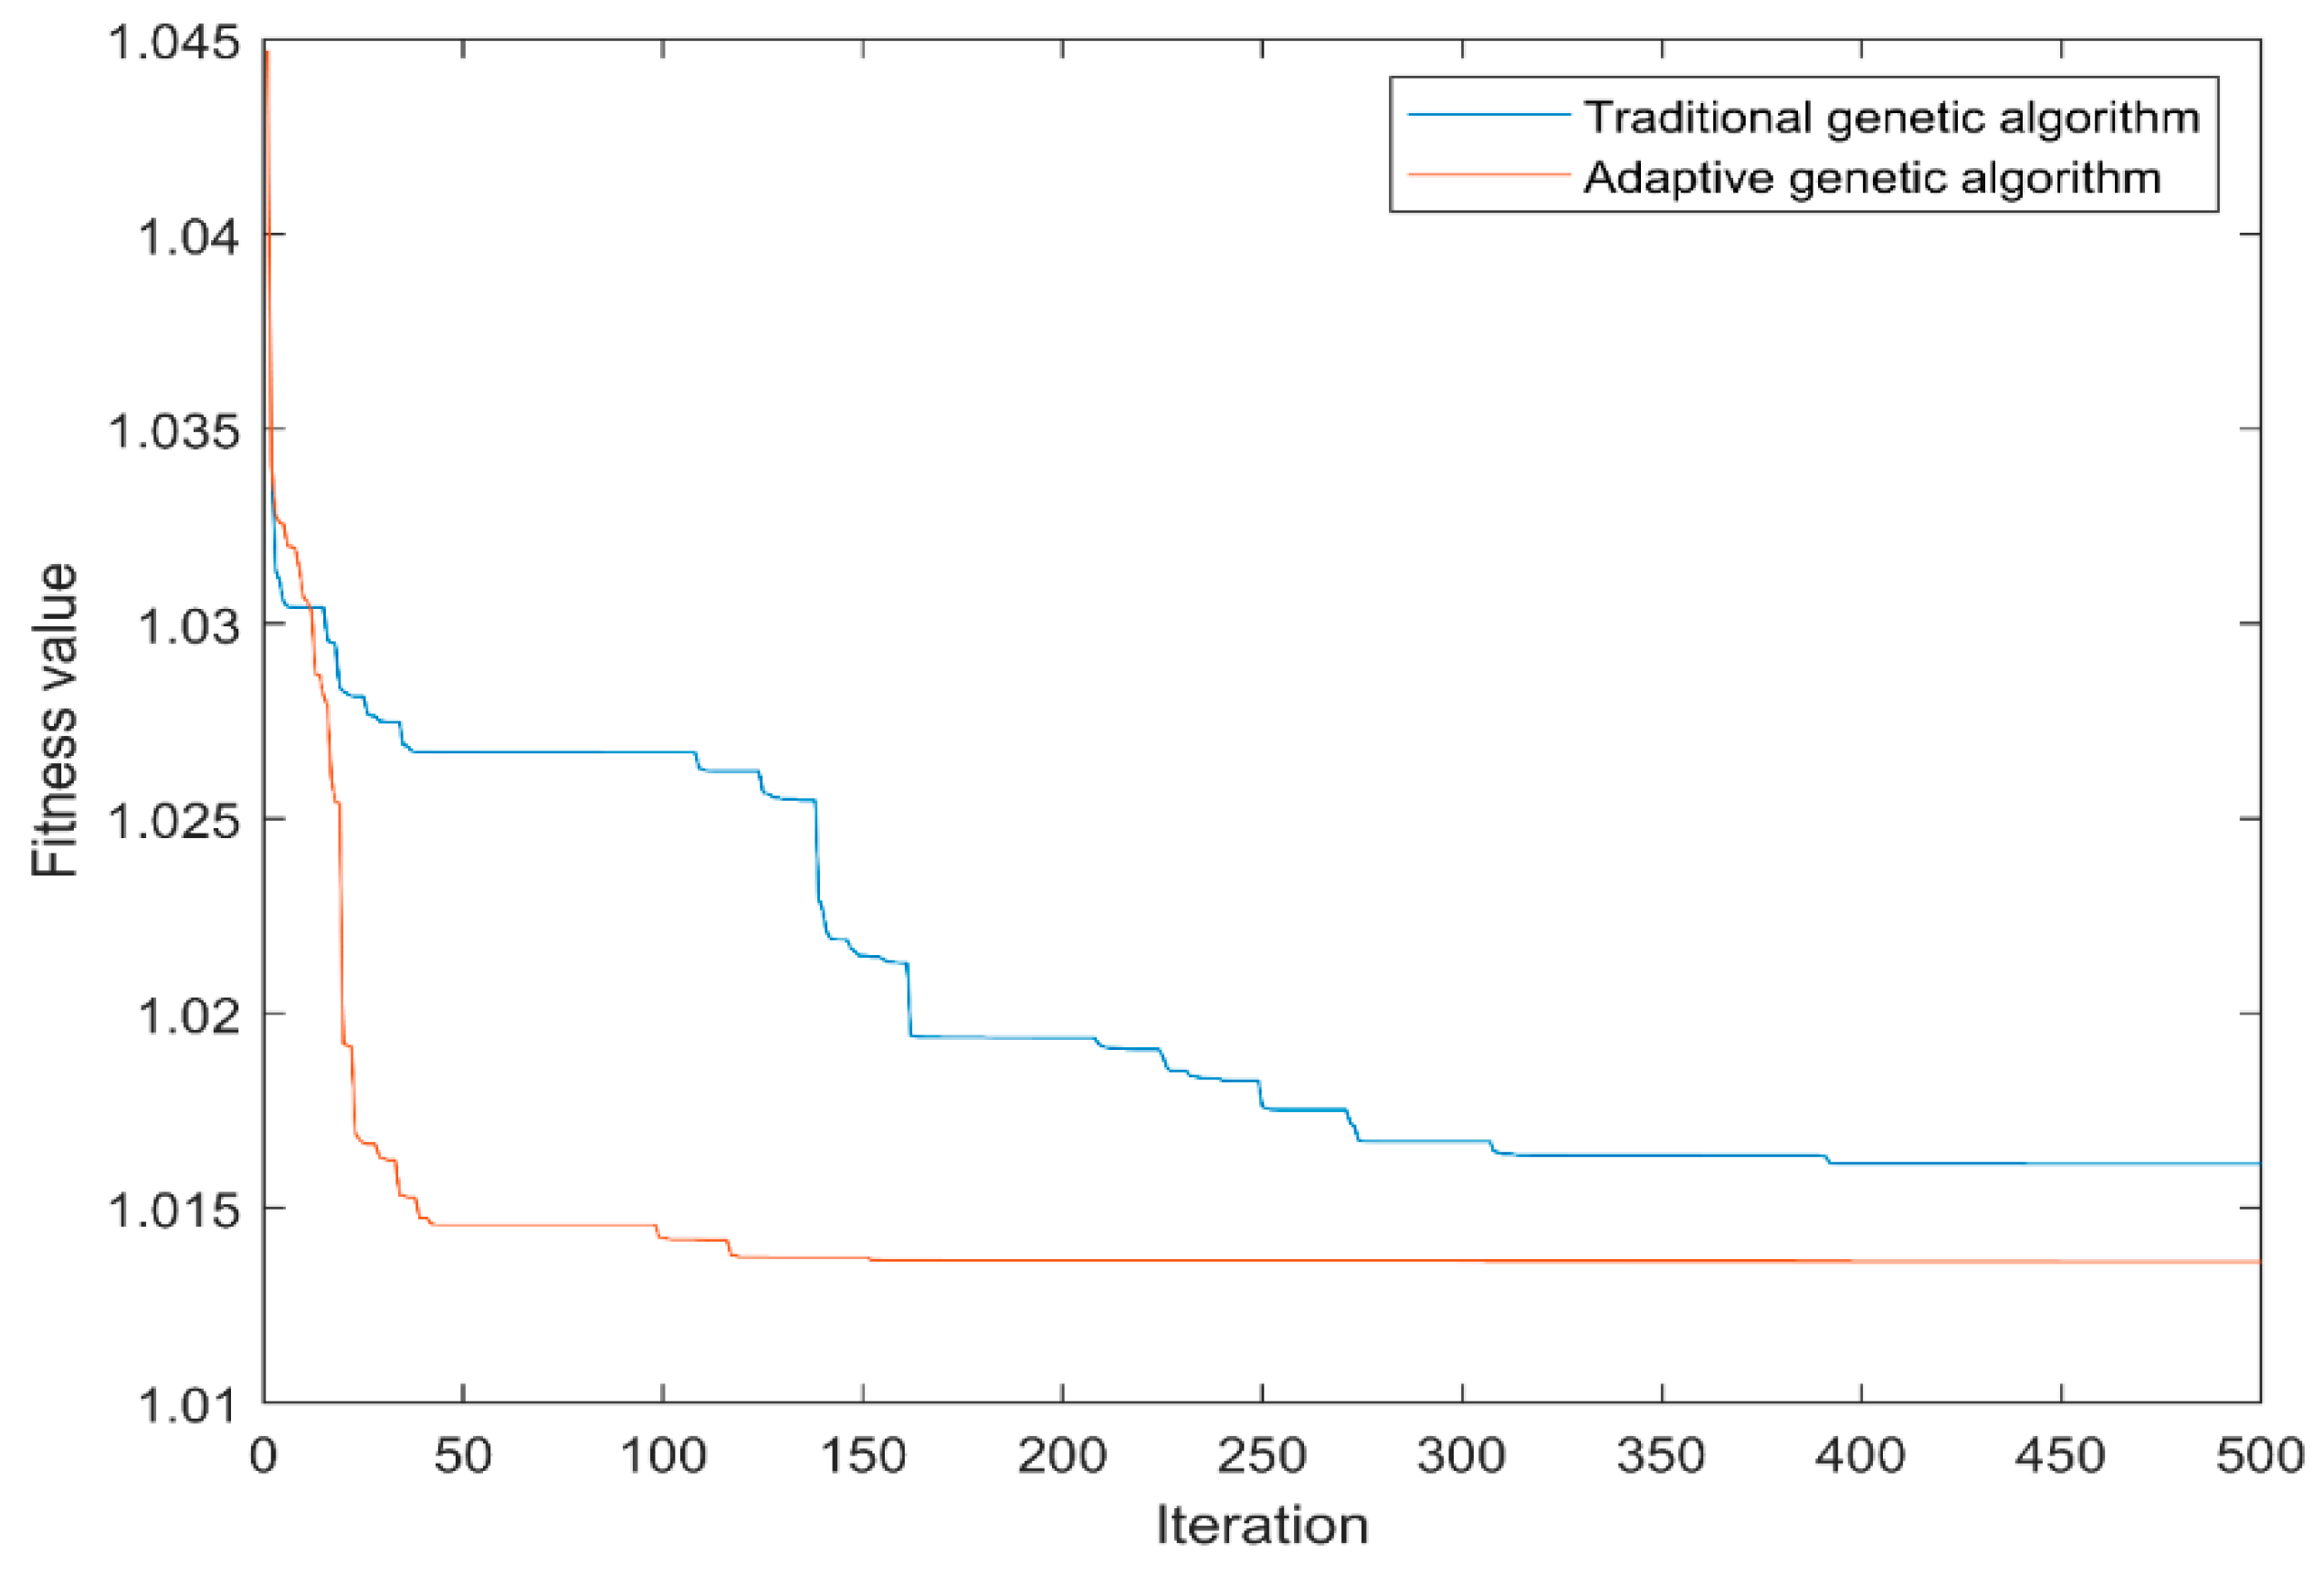
5.2.2. Comparison of Algorithms

To evaluate the proposed algorithm’s effectiveness, the traditional genetic algorithm is compared with the adaptive genetic algorithm proposed in this paper. The population size is 50, crossover probability P c and mutation probability P m are 0.95 and 0.01, respectively. Other parameters, such as k 1 and k 2 , are set to 0.9 and 0.6, respectively, while P c 1 and P c 2 are set to 0.9, P m 1 and P m 2 are set to 0.1 and 0.05, respectively. The algorithm is implemented in MATLAB software, and Figure 15 depicts the iterative curves for the two algorithms. As illustrated in the figure, the adaptive genetic algorithm exhibits better convergence and stronger optimization ability. After 394 iterations, the traditional genetic algorithm discovered the optimal fitness value of 1.0161, whereas the adaptive genetic algorithm discovered a better solution of 1.0137 after iteration 120, demonstrating the proposed algorithm’s superiority.

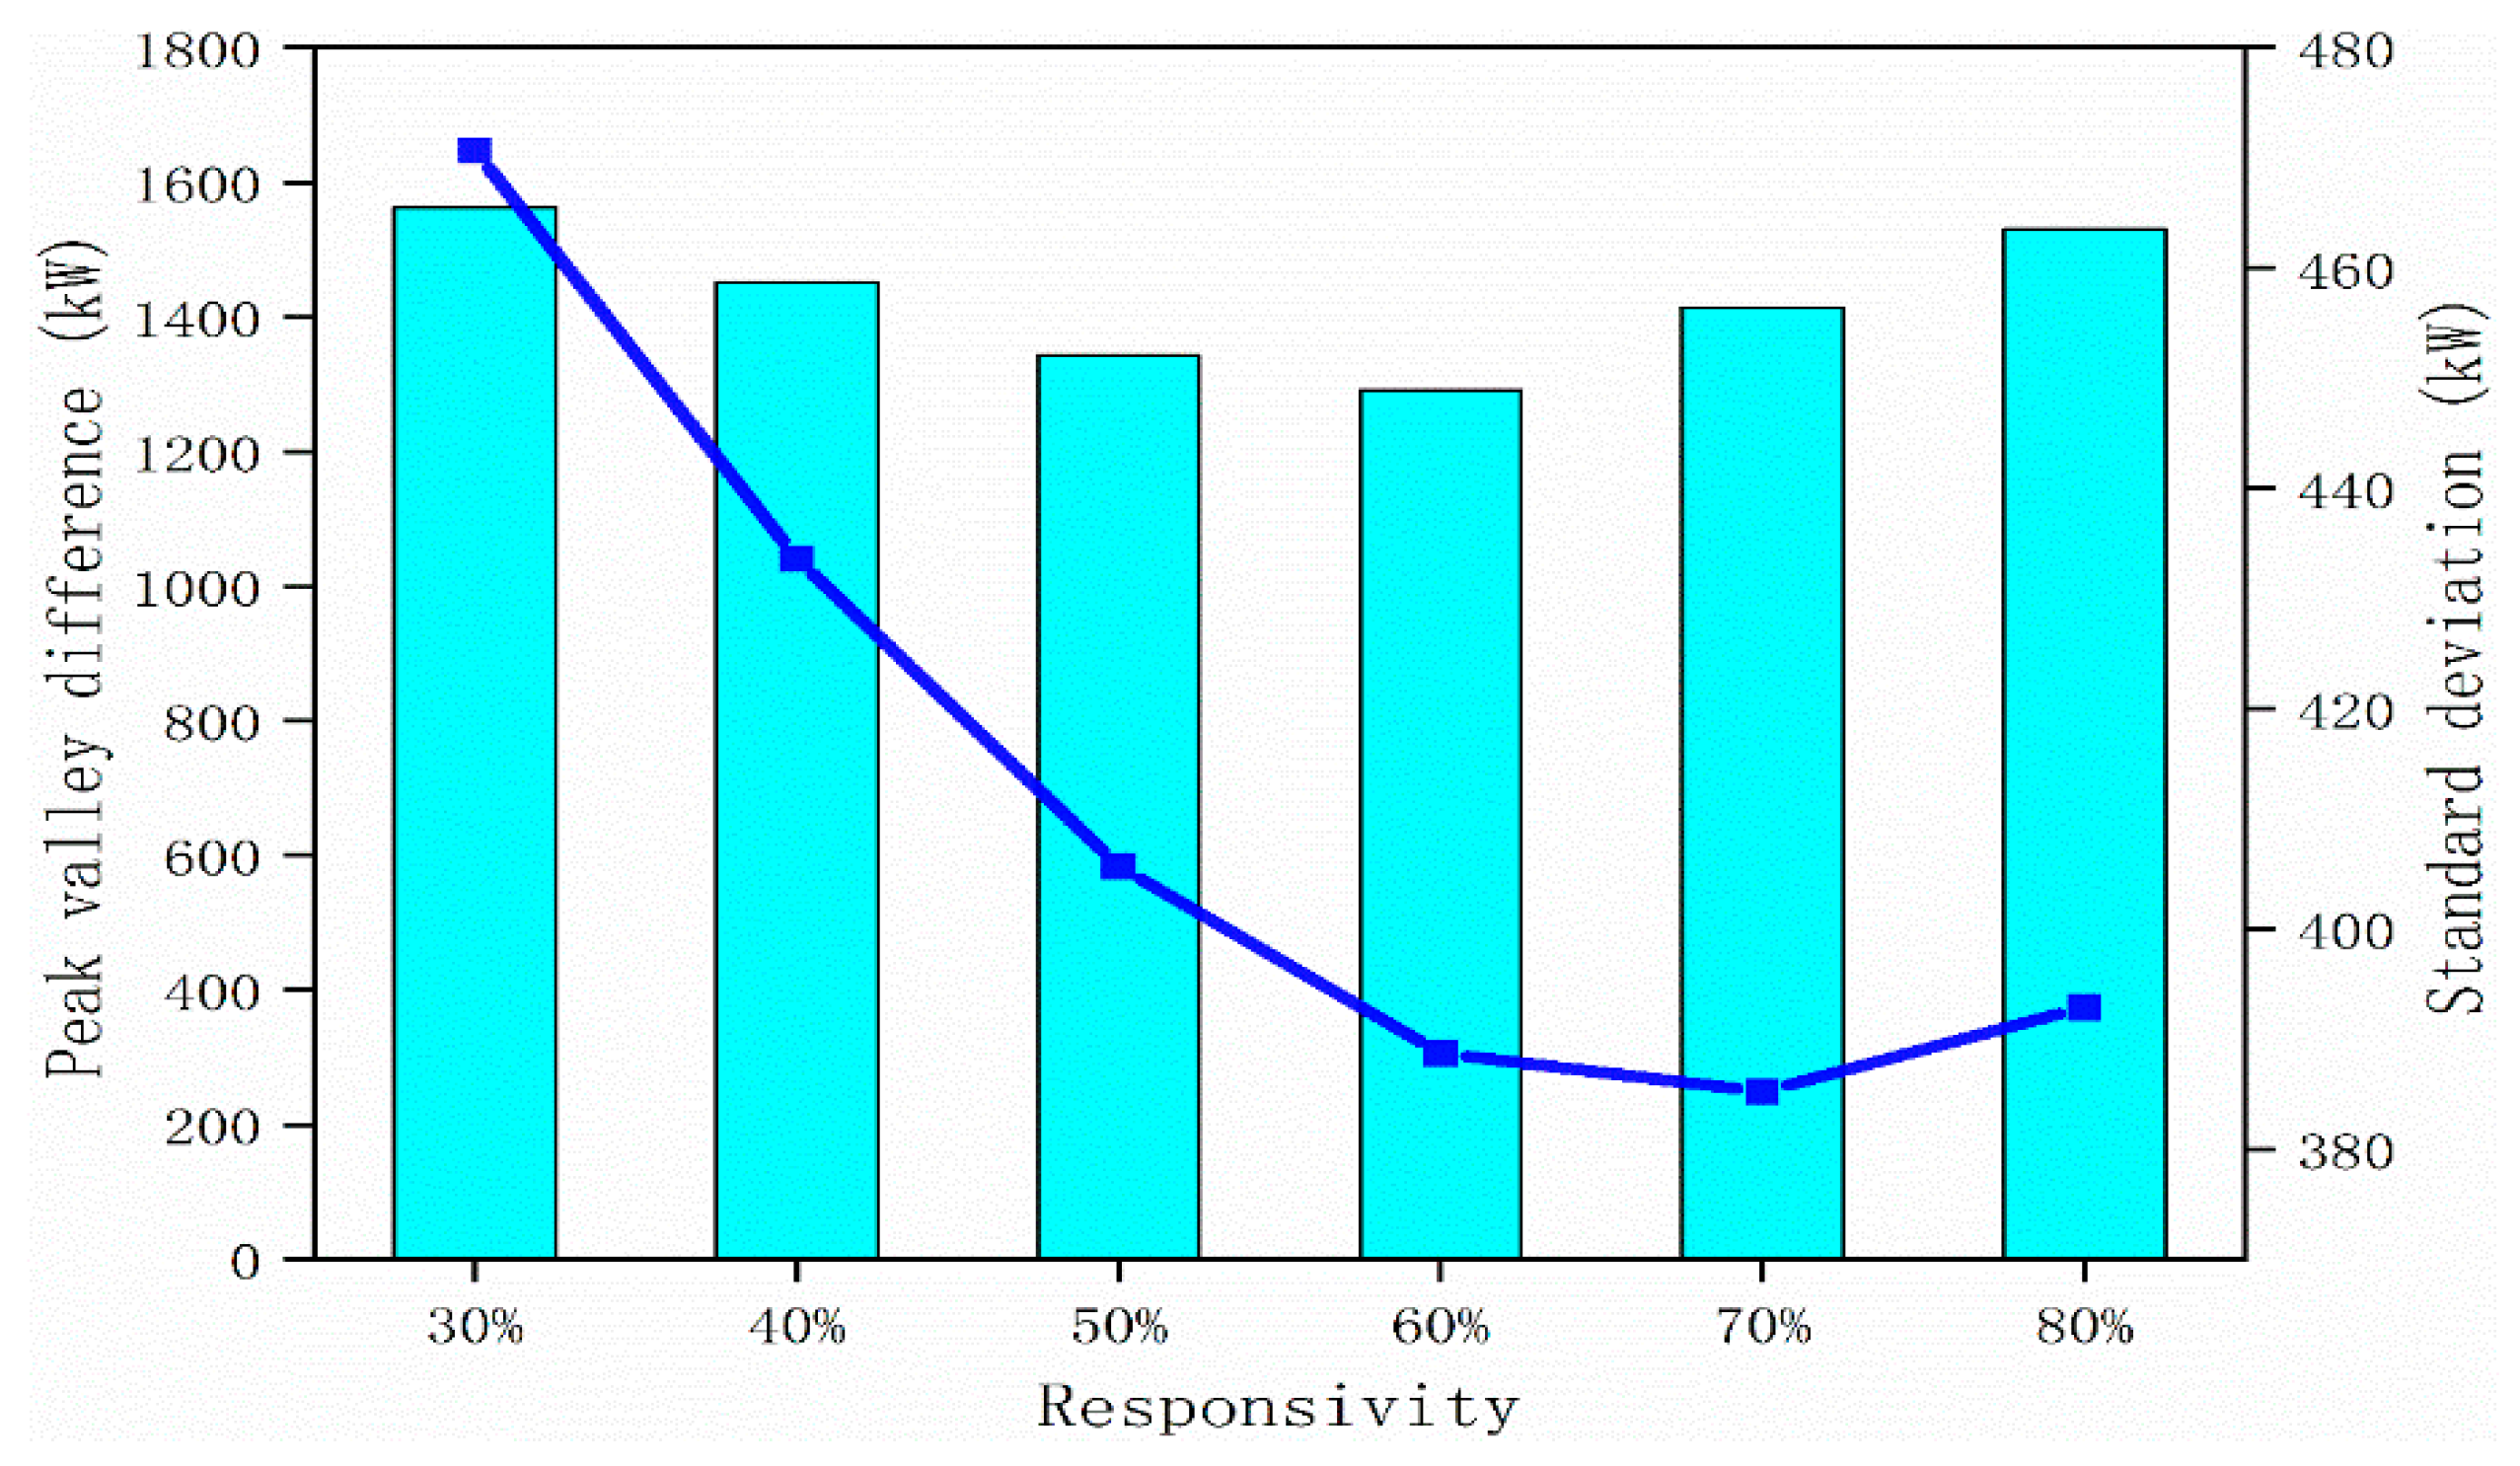
5.2.3. The Effect of EVs’ Varying Responsiveness on Charging Strategy

The responsiveness of EVs refers to the percentage of EV owners participating in orderly charging measures, which directly affects charging power response. If the response capacity of EV is insufficient, it will not achieve the purpose of improving the load curve. If the responsiveness is set too high, a new load peak may emerge. Additionally, the responsiveness of EVs will bear an effect on the OTOUP’s electricity price optimization results. This paper compares the effect of EV responsiveness of 30%, 40%, 50%, 60%, 70%, and 80% on orderly charging strategy and OTOUP. Charging results of EVs with varying responsivity are depicted in Figure 16. The peak valley difference is calculated as follows: maximum load—minimum load. As illustrated in Figure 16, when the responsiveness of the EV is less than 60%, the standard deviation of load fluctuation gradually decreases, indicating that the EV effectively inhibits load fluctuation in the demand response strategy of orderly charging. However, as the responsiveness of EVs approaches 70% and greater, the standard deviation of load fluctuation increases, indicating that EVs’ excessive response behavior results in the generation of new load peaks. Similarly, the peak–valley difference exhibits the same phenomenon. When the responsivity of an EV is less than 70%, the improvement of responsiveness can reduce peak–valley difference, which is beneficial to improve load stability. However, when the EV responsiveness increases to around 80% and beyond, the aggregation charging behavior increases the peak–valley difference in load.
The results of TOU price optimization and the charging costs of EVs with varying degrees of responsiveness are shown in Table 4. As Table 4 indicates, as the responsiveness of EVs increases, the peak electricity price also increases. Electricity prices in flat periods change in the opposite direction of those in peak periods, and electricity prices in valley periods always remain at their lowest levels. Peak–valley electricity price differentials gradually increase as EV responsiveness increases, which means that EV users’ charging loads will decrease during peak periods, while charging demands will increase during valley periods. Additionally, as the responsiveness of EVs improves, the cost of charging for EV users decreases gradually. This benefits EV users by allowing them to participate in the demand response strategy’s orderly charging strategy.

6. Conclusions and Future Work

6.1. Conclusions

To address the detrimental effect of large-scale EV disordered charging on the distribution network, this paper proposes an orderly charging strategy based on the OTOUP demand response of EV (This research encompasses load prediction for electric vehicles, load period division, and multi-objective optimization, among other things. We are willing to communicate with scholars who are interested in this topic and to share the findings of the experiments). To begin, the Monte Carlo method is applied to forecast the charging load of electric vehicles. In distribution networks, load time is classified scientifically using a fuzzy clustering algorithm in conjunction with a selected load index. Then, using demand price elasticity, a relationship between EV charging load and charging electricity price is established. Finally, the optimization model is established while considering the comprehensive interests of distribution network and EV users, and an orderly EV charging scheme is obtained by solving the problem using an improved genetic algorithm. The proposed method is validated using an IEEE-33 node distribution system simulation. In comparison to fixed power prices and CTOUP, the demand response charging strategy based on OTOUP achieves better results in terms of reducing load peak–valley differences and increasing power grid operating voltage, while also being less expensive for EVs. Additionally, the effect of EVs’ varying responsiveness in demand response on charging strategy is analyzed. The results illustrate that the trend of peak electricity price and flat electricity price is opposite to the increase of responsiveness. While increasing the responsiveness of EVs within a certain range can effectively reduce load fluctuation and charging costs, additional measures are required to deal with the new load peak caused by over-response.

6.2. Future Work

While the strategy suggested in this research bears the potential to aid in the orderly charging of EVs, it does contain some drawbacks. The paper’s drawback is that the charging effect reduces as the rate of EV adoption increases, mostly as this paper only discusses the division of time periods once, which is related to the setting of energy prices, which bears a big impact on guiding orderly EV charging. When the pace of EV charging penetration grows, the period of low load may become the period of high load, reducing the charging effect. Further research can be conducted in the future on the following two points. On the one hand, dynamic load period division can help avoid the situation in which the valley phase of an EV charging with a high permeability becomes the peak period, thereby improving the charging effect. The second aspect is that the charging strategy should take into account the vehicle-to-grid characteristics of EVs. In the future, EV discharge behavior will prove critical for energy management of large-scale EVs.

Author Contributions

Conceptualization, H.H.G.; methodology, H.H.G.; software, H.H.G., D.Z. and W.D.; validation, H.H.G., D.Z. and W.D.; formal analysis, K.C.G.; investigation, H.H.G., C.S.L. and T.A.K.; resources, H.H.G. and L.Z.; data curation, L.Z.; writing—original draft preparation, L.Z.; writing—review and editing, H.H.G. and K.C.G.; visualization, H.H.G., C.S.L. and T.A.K.; supervision, H.H.G. and D.Z.; project administration, H.H.G.; funding acquisition, H.H.G. All authors have read and agreed to the published version of the manuscript.

Funding

This research was funded by Jun Wu Scholar Grant Scheme, Vot: A3020051008. In addition, the APC was funded by Guangxi University.

Institutional Review Board Statement

Not Applicable.

Informed Consent Statement

Not Applicable.

Data Availability Statement

The study did not report any data. Further data can be provided upon email request to the corresponding author.

Conflicts of Interest

The authors declare no conflict of interest.

Nomenclature

Abbreviations
EVelectric vehicle
TOUtime-of-use
OTOUPoptimal time-of-use pricing
CTOUPcommon time-of-use pricing
SOCstate of charge
LCRload change rate
CEclustering effectiveness
Indices and sets
i index of EV
j index of classification
k index of clustering object characteristic indicator
t ,   s index of time period
L set of load periods
U p set of peak period
U v set of valley period
Parameters
u s ,   σ s mean and standard deviation of initial charging time
a ,   b minimum and maximum values of initial state of charge
E c battery capacity
P c h charging power
η charging efficiency
N number of EVs
x t i charging state of the i-th EV
P t c charging load of EV in the t-th period
T number of load periods
l t load in the t-th period
l min ,   l max minimum and maximum load
L C R ( t ) rate of change of load in the t-th period
l t k value of the k-th index of the t-th cluster object
l t k value of the k-th index of the t-th cluster object after standardiza-tion
l k ¯ average value of the k-th index
S k standard deviation of the k-th index
l t k value of the k-th index of the t-th cluster object after normalization
r t s similarity between the t-th clustering object and the s-th clustering object
t ( R ) transitive closure of similar matrix R
λ confidence level, between 0 and 1
t ( R ) λ intercept matrix at confidence level λ
r t s ˜ values of elements in the intercept matrix at confidence level λ
r number of classifications
T j number of individuals in class j
L ( j ) ¯ clustering center of class j
L ¯ clustering center of the total sample
l g ( j ) g-th sample in class j
C E r clustering effectiveness under r classification number
F a ( r 1 , T r ) value of F distribution with degree of freedom (r−1,Tr) under significance level a
ε t t self-elastic coefficient
ε t s cross elastic coefficient
q t ( 0 ) charge quantity before response in time period t
p t ( 0 ) electricity price before response in time period t
p s ( 0 ) electricity price before response in time period s
V t ¯ highest node voltage
V t _ lowest node voltage
g 1 ,   g 2 ,   g 3 weight coefficients of F G 1 ,   F G 2 and F G 3 respectively
w 1 ,   w 2 weight coefficients of F G and F C respectively
P t 0 disorderly charging price in period t
P t _ minimum value of TOU price in t period
P t ¯ maximum value of TOU price in t period
k 1 ,   k 2 adjustment coefficient
P c 1 ,   P c 2 cross coefficient
P m 1   ,   P m 2   mutation coefficient
Variables
S O C i initial state of charge of the battery
S O C e S O C of the battery at the end of EV charging
q t charge quantity after response in time period t
p t electricity price after response in time period t
Δ q t charge change in time period t
Δ p t price change in time period t
p s electricity price after response in time period s
Δ p s price change in time period s
P a v e average load of the whole day
F G 1 load fluctuation standard deviation
F G 2 load peak–valley difference
F G 3 sum of voltage deviation
F C EV charging cost
P t charging price in time period t
F G comprehensive objective function value on the power grid side
F G C comprehensive objective function value of power grid side and user side
P t electricity price in t period after optimization
f smaller fitness value of the two crossover individuals
f fitness value of the mutated individual
f min minimum value of population fitness
f a v e mean values of population fitness
P c crossover rate
P m mutation rate
Operators
synthesis operation of matrix
norm calculation

References

  1. Cui, Q.; Bai, X.; Zhu, S.; Huang, B. Cost-benefit calculation and analysis of V2G system. In Proceedings of the 2016 China International Conference on Electricity Distribution, Xi’an, China, 10–13 August 2016. [Google Scholar]
  2. Zhang, Z.; Chen, Z.; Xing, Q.; Ji, Z.; Zhang, T. Evaluation of the multi-dimensional growth potential of China’s public charging facilities for electric vehicles through 2030. Util. Policy 2022, 75, 101344. [Google Scholar] [CrossRef]
  3. Tao, Y.; Huang, M.; Chen, Y.; Yang, L. Orderly charging strategy of battery electric vehicle driven by real-world driving data. Energy 2020, 193, 116806. [Google Scholar] [CrossRef]
  4. Ren, H.; Zhang, A.; Li, W. Study on Optimal V2G Pricing Strategy under Multi-Aggregator Competition Based on Game Theory. In Proceedings of the 2019 IEEE Sustainable Power and Energy Conference (iSPEC), Beijing, China, 21–23 November 2019. [Google Scholar]
  5. Zhong, J.; Xiong, X. An Orderly EV Charging Scheduling Method Based on Deep Learning in Cloud-Edge Collaborative Environment. Adv. Civ. Eng. 2021, 2021, 1–12. [Google Scholar] [CrossRef]
  6. Qian, K.; Zhou, C.; Allan, M.; Yuan, Y. Modeling of load demand due to EV battery charging in distribution systems. IEEE Trans. Power Syst. 2010, 26, 802–810. [Google Scholar] [CrossRef]
  7. Karmaker, A.K.; Roy, S.; Ahmed, M.R. Analysis of the impact of electric vehicle charging station on power quality issues. In Proceedings of the 2019 International Conference on Electrical, Computer and Communication Engineering (ECCE), Cox’sBazar, Bangladesh, 7–9 February 2019; pp. 1–6. [Google Scholar]
  8. Crozier, C.; Morstyn, T.; McCulloch, M. The opportunity for smart charging to mitigate the impact of electric vehicles on transmission and distribution systems. Appl. Energy 2020, 268, 114973. [Google Scholar] [CrossRef]
  9. Jin, Y.; Agyeman, K.A.; Han, S. Grid impact analysis of electric vehicles charging with different load profiles. In Proceedings of the 2019 IEEE Transportation Electrification Conference and Expo, Asia-Pacific (ITEC Asia-Pacific), Seogwipo, Korea, 8–10 May 2019; pp. 1–5. [Google Scholar]
  10. Liu, L.; Niu, M.; Li, B.; Zhang, Y.; Zou, M.; Liu, D.; Liu, M. Aggregation Optimization Method of Virtual Energy Storage for Electric Vehicles Considering User Elasticity. In Proceedings of the IOP Conference Series: Earth and Environmental Science, Chongqing, China, 20–22 November 2020. [Google Scholar]
  11. Dong, X.; Mu, Y.; Xu, X.; Jia, H.; Wu, J.; Yu, X.; Qi, Y. A charging pricing strategy of electric vehicle fast charging stations for the voltage control of electricity distribution networks. Appl. Energy 2018, 225, 857–868. [Google Scholar] [CrossRef]
  12. Kasani, V.S.; Tiwari, D.; Khalghani, M.R.; Solanki, S.K.; Solanki, J. Optimal Coordinated Charging and Routing Scheme of Electric Vehicles in Distribution Grids: Real Grid Cases. Sust. Cities Soc. 2021, 73, 103081. [Google Scholar] [CrossRef]
  13. Qu, D.; Liu, Q.; Fan, J.; Yang, J.; Yao, L. Analysis on Peak Clipping Effect of Distribution Network Based on Incentive Demand Response Participated by Electric Vehicles. In Proceedings of the 2020 IEEE Sustainable Power and Energy Conference (iSPEC), Chengdu, China, 23–25 November 2020. [Google Scholar]
  14. Hou, H.; Wang, Y.; Xie, C.; Xiong, B.; Zhang, Q.; Huang, L. A dispatching strategy for electric vehicle aggregator combined price and incentive demand response. IET Energy Syst. Integr. 2021, 3, 508–519. [Google Scholar] [CrossRef]
  15. Vuelvas, J.; Ruiz, F.; Gruosso, G. A time-of-use pricing strategy for managing electric vehicle clusters. Sustain. Energy Grids Netw. 2021, 25, 100411. [Google Scholar] [CrossRef]
  16. Lu, Z.; Qi, J.; Zhang, J.; He, L.; Zhao, H. Modelling dynamic demand response for plug-in hybrid electric vehicles based on real-time charging pricing. IET Gener. Transm. Distrib. 2017, 11, 228–235. [Google Scholar] [CrossRef]
  17. Tan, J.; Wang, B.; Li, Y. Application of system dynamics on comprehensive benefits valuation of demand response. Autom. Electr. Power Syst. 2014, 38, 128–134. [Google Scholar]
  18. Azimi, Z.; Hooshmand, R.A.; Soleymani, S. Energy management considering simultaneous presence of demand responses and electric vehicles in smart industrial grids. Sustain. Energy Technol. Assess. 2021, 45, 101127. [Google Scholar] [CrossRef]
  19. Gong, L.; Cao, W.; Liu, K.; Yu, Y.; Zhao, J. Demand responsive charging strategy of electric vehicles to mitigate the volatility of renewable energy sources. Renew. Energy 2020, 156, 665–676. [Google Scholar] [CrossRef]
  20. Liao, Y.; Chen, L.; Chen, X. An efficient time-of-use pricing model for a retail electricity market based on pareto improvement. In Proceedings of the 2011 Asia-Pacific Power and Energy Engineering Conference, Wuhan, China, 25–28 March 2011. [Google Scholar]
  21. Zheng, Y.; Luo, J.; Yang, X.; Yang, Y. Intelligent regulation on demand response for electric vehicle charging: A dynamic game method. IEEE Access 2020, 8, 66105–66115. [Google Scholar] [CrossRef]
  22. Lei, H.; Yan, J.; Sang, Z.; Wu, L.; Du, Z.; Yang, D.; Wang, S. A Coordinated Charging Strategy for Electric Vehicles Based on Valley Load Tracking. J. Physics Conf. Ser. 2019, 1314, 012075. [Google Scholar] [CrossRef]
  23. Wang, H.J.; Wang, B.; Fang, C.; Li, W.; Huang, H.W. Charging load forecasting of electric vehicle based on charging frequency. In Proceedings of the IOP Conference Series: Earth and Environmental Science, Chengdu, China, 7–9 December 2018. [Google Scholar]
  24. Lin, H.; Shen, X. The Predicting of Charging Load for Pure Electric Buses. In Proceedings of the 8th International Conference on Management and Computer Science (ICMCS 2018), Shenyang, China, 10–12 August 2018. [Google Scholar]
  25. Zheng, Y.; Shao, Z.; Zhang, Y.; Jian, L. A systematic methodology for mid-and-long term electric vehicle charging load forecasting: The case study of Shenzhen, China. Sust. Cities Soc. 2020, 56, 102084. [Google Scholar] [CrossRef]
  26. Datchanamoorthy, S.; Kumar, S.; Ozturk, Y.; Lee, G. Optimal time-of-use pricing for residential load control. In Proceedings of the 2011 IEEE International Conference on Smart Grid Communications (SmartGridComm), Brussels, Belgium, 17–20 October 2011. [Google Scholar]
  27. Ji, Y. Research on Power Forecasting and Optimal Placement for Distributed Photovoltaic. Master’s Thesis, Taiyuan University of Technology, Taiyuan, China, 8 June 2017. [Google Scholar]
  28. Subcommittee, P.M. IEEE reliability test system. IEEE Trans. Power App. Syst. 1979, 98, 2047–2054. [Google Scholar] [CrossRef]
Figure 1. Orderly charging strategy framework for EVs based on OTOUP demand response.
Energies 15 01869 g001
Figure 2. Semi-trapezoidal membership function: (a) smaller (b) larger.
Energies 15 01869 g002
Figure 3. Flow chart of adaptive genetic algorithm.
Energies 15 01869 g003
Figure 4. IEEE-33 standard distribution network system structure diagram.
Energies 15 01869 g004
Figure 5. Basic load curve of distribution network system.
Energies 15 01869 g005
Figure 6. Disordered charging load curve of EV.
Energies 15 01869 g006
Figure 7. Daily total charging load curve with disordered charging.
Energies 15 01869 g007
Figure 8. Voltage profile of distribution network under disordered charging.
Energies 15 01869 g008
Figure 9. Comparison between disordered charging load of EV and CTOUP power response.
Energies 15 01869 g009
Figure 10. Charging load curve under CTOUP.
Energies 15 01869 g010
Figure 11. Voltage profile of distribution network under CTOUP.
Energies 15 01869 g011
Figure 12. Comparison between disordered charging load of EV and OTOUP power response.
Energies 15 01869 g012
Figure 13. Charging load curve under OTOUP.
Energies 15 01869 g013
Figure 14. Voltage profile of distribution network under OTOUP.
Energies 15 01869 g014
Figure 15. Comparison of two optimization algorithms.
Energies 15 01869 g015
Figure 16. Load standard deviation and peak–valley difference of EVs under different responsivity.
Energies 15 01869 g016
Table 1. Distribution network system parameters.
No.FromToImpedance (Ω)Voltage (p.u.)
1120.0922 + j0.0471.05
2230.3660 + j0.18641
3340.3660 + j0.18641
4450.3811 + j0.19411
5560.8190 + j0.70701
6670.1872 + j0.61881
7780.7114 + j0.23511
8891.0300 + j0.74001
99101.0440 + j0.74001
1010110.1966 + j0.06501
1111120.3744 + j0.12381
1212131.4680 + j1.15501
1313140.5416 + j0.71291
1414150.5910 + j0.52601
1515160.7463 + j0.54501
1616171.2890 + j1.72101
1717180.3720 + j0.57401
182190.1640 + j0.15651
1919201.5042 + j1.35541
2020210.4095 + j0.47841
2121220.7089 + j0.93731
223230.4512 + j0.30831
2323240.8980 + j0.70911
2424250.8960 + j0.70111
256260.2030 + j0.10341
2626270.2842 + j0.14471
2727281.0590 + j0.93371
2828290.8042 + j0.70061
2929300.5075 + j0.25851
3030310.9744 + j0.96301
3131320.3105 + j0.36191
3232330.3410 + j0.53621
Table 2. Time division results based on fuzzy clustering.
Sort (r)23456
F-statistics43.787872.824267.193667.322254.7459
Fa (a = 0.2)1.751.741.71.661.64
C E r 24.021640.85338.525639.555532.3816
Table 3. Comparison of different charging scenarios.
Standard Deviation (kW)Peak Valley Difference (kW)Minimum Voltage (p.u.)Voltage Deviation (p.u.)
Base load553.7214720.97671.4466
Scenario 1621.8318950.92352.1269
Scenario 2379.4415160.92191.9187
Scenario 3407.1613420.94221.9128
Charging Cost (CNY)Peak Electricity Price (CNY/kWh)Flat Electricity Price (CNY/kWh)Valley Electricity Price (CNY/kWh)
Base load----
Scenario 160360.60.60.6
Scenario 25404.71.050.750.45
Scenario 35334.60.94160.83030.3
Table 4. Charging electricity price and charging cost of EVs under different responsivity.
ResponsivityPeak
(CNY/kWh)
Flat
(CNY/kWh)
Valley
(CNY/kWh)
Cost
(CNY)
30%0.94260.81770.36208.4
40%0.94370.80270.35773.4
50%0.94830.74210.35341.4
60%0.95220.68260.34908.6
70%0.95370.67010.34469.9
80%0.95800.61220.34027.9
Publisher’s Note: MDPI stays neutral with regard to jurisdictional claims in published maps and institutional affiliations.

