1. Introduction
The concurrence of environmental, social and political pressures demonstrates the increasing need for an immediate transition of the current energy systems towards more sustainable models. As a potential leverage of this transition, energy communities (ECs) have been gaining relevance as a niche innovation framed within the wider historical evolution of energy systems. This includes the market structure, the available technology, the institutions and policies, and social–cultural situation [
1].
Beyond a mere structural definition, such as the one provided in the 5th Assessment Report of the IPCC that defines energy systems as “all components related to the production, conversion, delivery, and use of energy” [
2], within this article, by “energy systems” we refer to the complex mix of actors, rules, technologies and energy sources that converge in shaping the energy value chain (production and consumption) and, ultimately, providing diverse forms of energy for satisfying the specific socio-economic needs of society. In this article we make reference to the comprehensive definition of ECs provided by Caramizaru and Uihlein [
3] that highlights the institutional, social and technical requirements as well as the potential of ECs. They define ECs as “…collective energy actions that foster citizens’ participation across the energy system…a way to “organise” collective energy actions around open, democratic participation and governance…energy communities … contiguous processes of both the energy transition and social innovation. As decentralised and renewable-based energy projects, they can promote sustainable energy production and consumption practices. As consumer-empowerment and community-driven initiatives, energy communities can play a key role for social innovation as they reflect a fundamental shift in consumer behavior” [
3].
By looking at this definition from a multi-level perspective, ECs can be seen as strategic niche innovations, particularly socially innovative niches that can affect the trajectory of how the energy system evolves. Drawing from the existing literature [
4,
5,
6,
7] that focuses on the challenges posed by the existing market environment to disruptive organizational and business model innovations, the development of ECs in Europe is affected by the current structure of the market and by the uncertainty that is inherent in any kind of innovation. Thus, the specific domain this article is focused on is related to concerns about security of supply, network integrity, governance of fragmented production systems and price volatility of the fully market-driven multiple actor production models.
Moreover, locally-owned community energy projects are influenced by national and EU legislation, formal institutional rules such as support mechanisms for renewables and spatial planning. Thus, viewed as strategic niches [
8], the institutional and political components have the ability to create protected spaces where ECs can innovate and develop. As such, these niches have the potential to shift the energy system towards more distributed renewable energy, but they require policies that allow for these protected spaces to develop.
Finally, societal norms, including attitudes towards the cooperative model as a form of ECs, and cultures of local energy activism, have an influence on how the energy system develops in connection to the sustainable energy transition. In countries with a long-lasting tradition of cooperative movement, citizens are aware of its legal structure and the related benefits. Countries that are less familiar with the cooperative model among citizens and stakeholders, may raise a “cognitive barrier” from the low awareness [
9]. Additionally, problematic experiences with a specific type of cooperative model can constitute a “(negative) historical legacy” [
10].
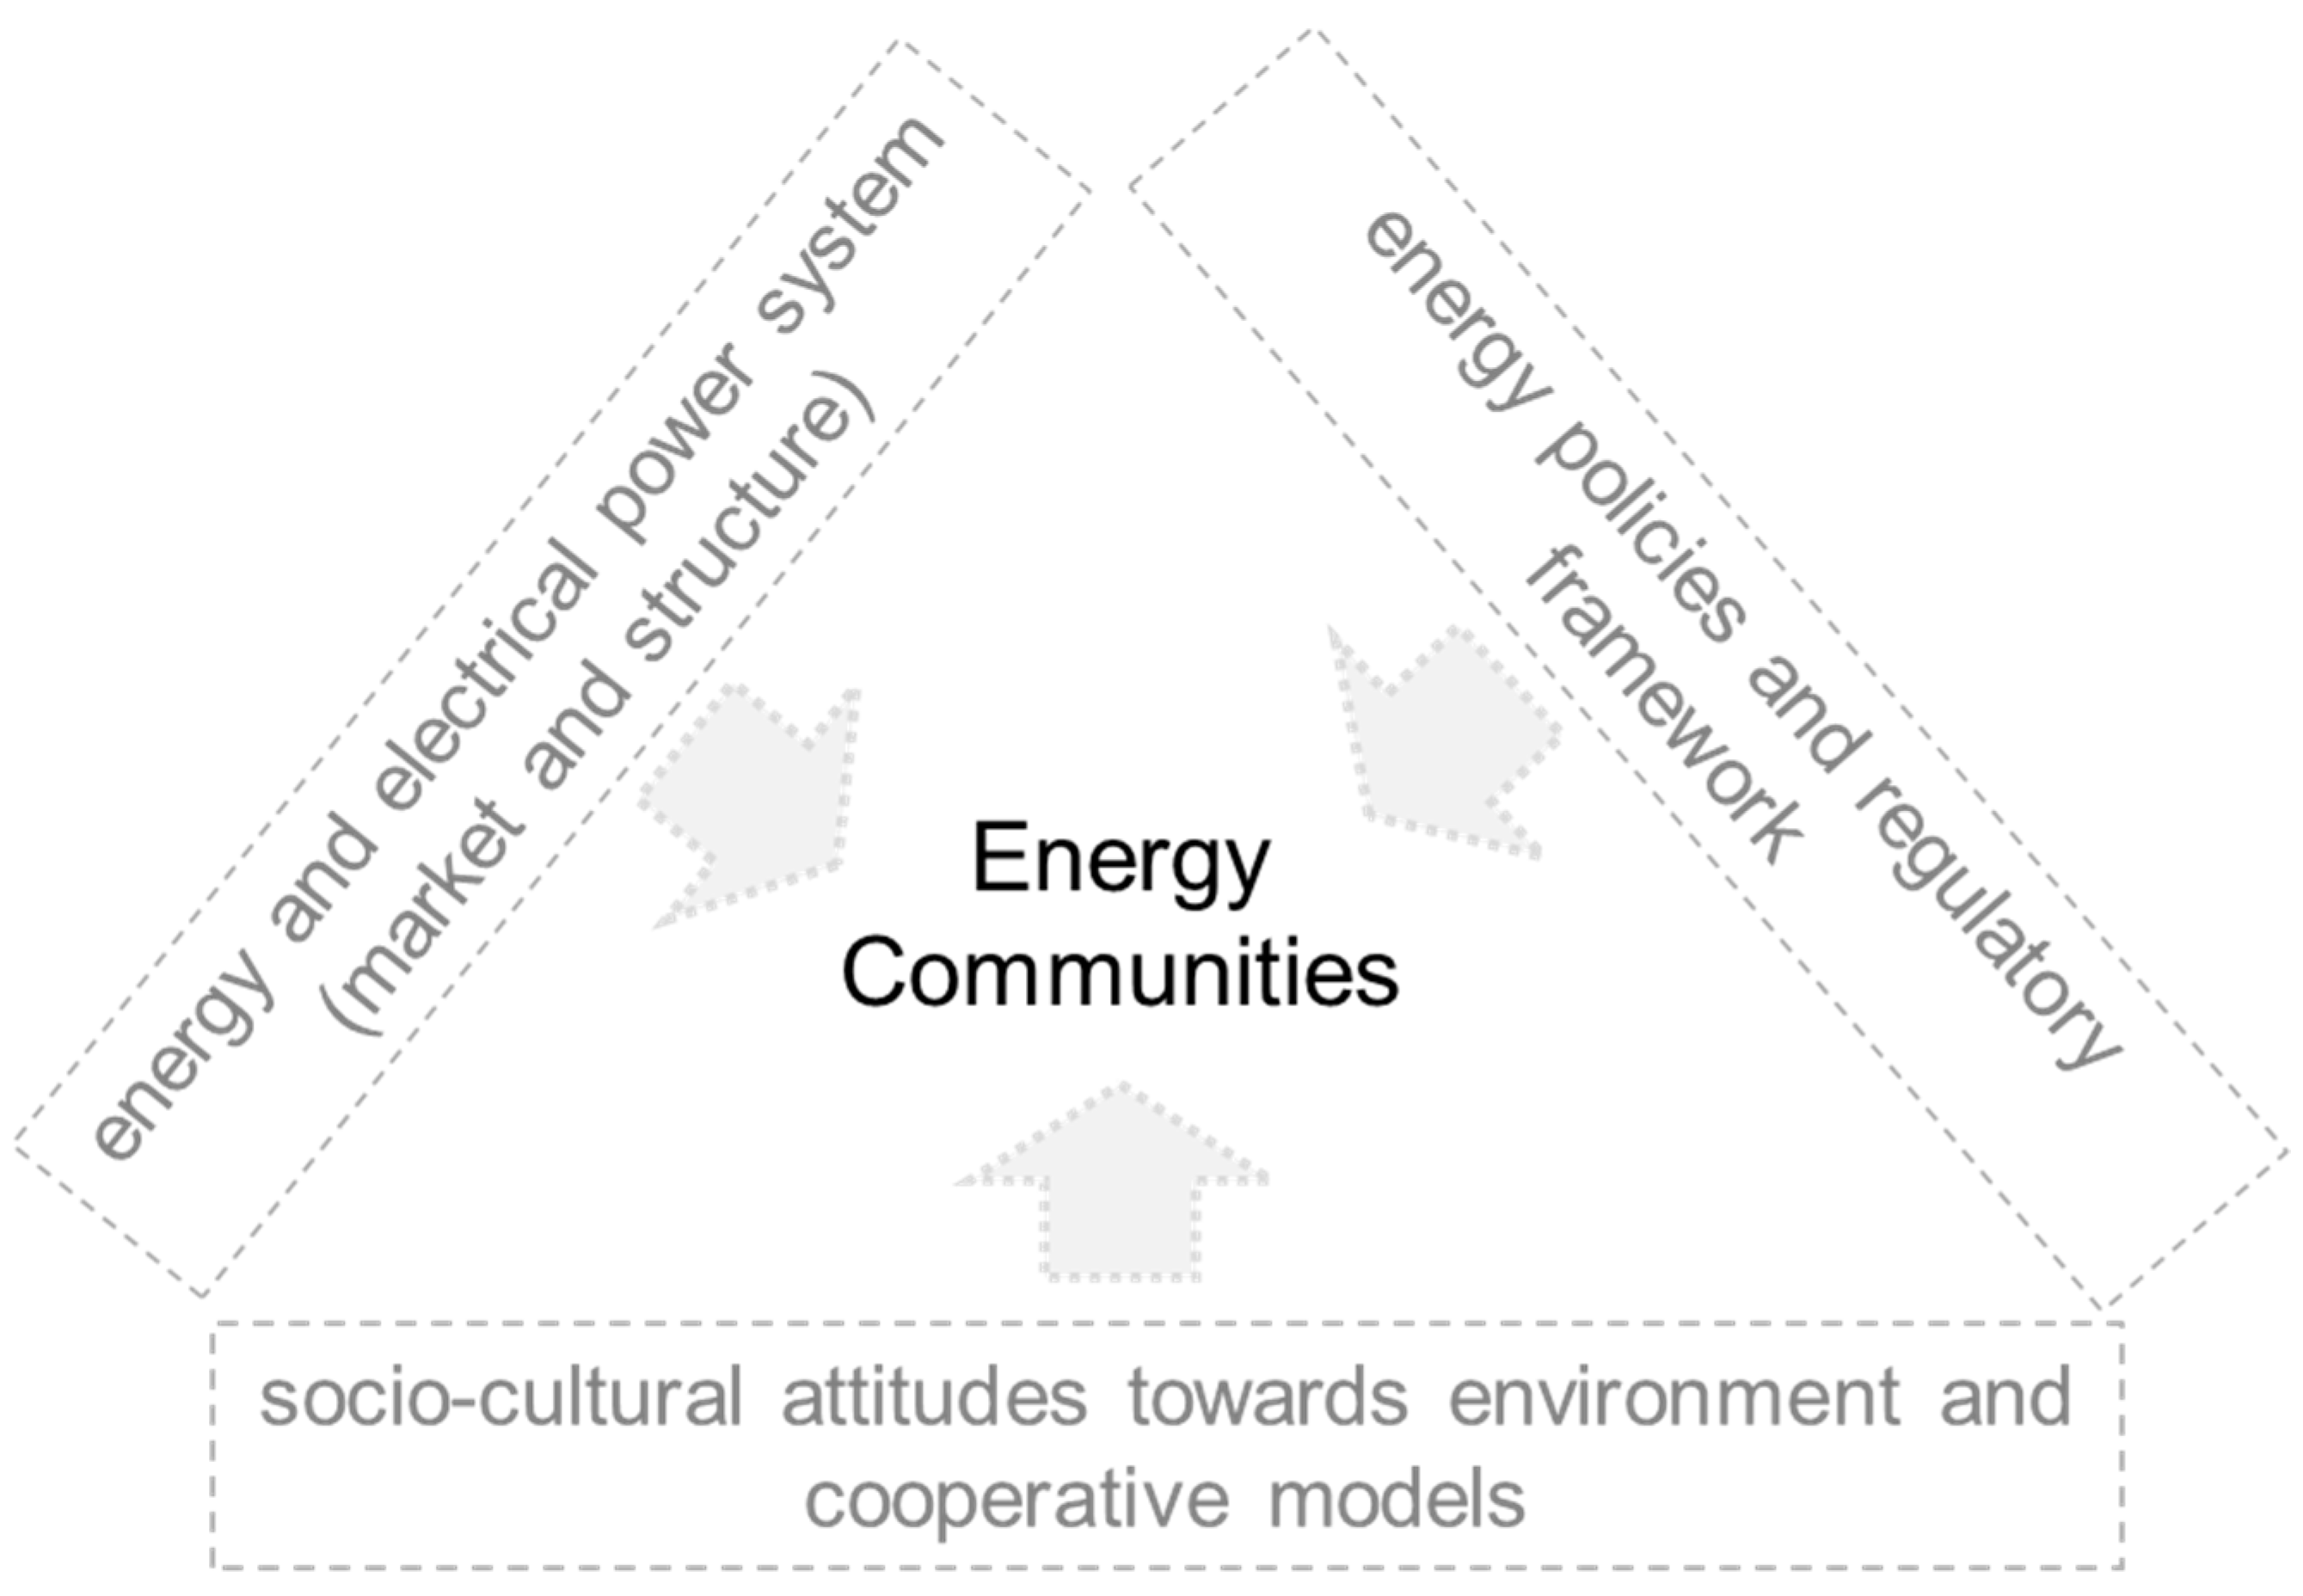
Three dimensions can therefore BE identified as aggregators of potential enabling factors for ECs (see
Figure 1): (1) energy and electrical power system (market and structure); (2) energy policies and regulatory framework; (3) socio-cultural attitudes towards environment and cooperative models.
After having flourished around Europe for the past two decades as spontaneous initiatives triggered by a diverse scheme of incentives at national levels, the European Union recently formally recognized ECs with the Internal Electricity Market Directive (EU) 2019/944 that provides rules for citizen energy communities, and the Renewable Energy Directive (EU) 2018/2001 that provides rules for renewables energy communities. Given our interest in exploring the potential of these initiatives in fostering the energy transition, this article focuses on the latter, involving only the communities that implement renewable energy sources.
All EU countries are obliged to transpose the directives into national law (Dir. 2019/944 by 31 December 2020; Dir. 2018/2001 by 30 June 2021), and in order for the directives to be properly tailored to the specific national context, it seems particularly appropriate to engage in a careful description of the EU countries’ institutional, economic and social context with specific reference to the energy field.
The primary objective of this paper is therefore to explore how the historical development of the components reported in
Figure 1 and their interactions might influence the proliferation of ECs in Europe by addressing the following specific questions:
How might the liberalization of the electricity sector facilitate or hinder the diffusion of ECs?
How has the historical evolution of the institutional and policy settings established and enabled environments to support or hinder ECs’ development?
What role might society’s familiarity with the cooperative model play in the diffusion of the EC’s initiatives?
Given the complexity of the interaction among the processes these research questions refer to, the adoption of a comparative approach allows the possibility to investigate the evolutionary dynamics of the energy system and ECs within specific institutional, cultural and social contexts (e.g., how the liberalization processes worked in different institutional settings) and, at the same time, supports the identification of common paths, if any.
To find an answer to these questions, we conducted a comparative analysis across six EU countries within the framework of the COMETS project (Collective Action Models for the Energy Transition and Social Innovation): Belgium, Estonia, Italy, the Netherlands, Poland and Spain. The six countries have been selected on the basis of their representativeness of the EU heterogeneity by taking into account three main dimensions: (i) The structure of their energy system as a proxy of their attitude towards renewables exploitation. (ii) The development paths of their energy system as a proxy to assess their position on a liberal versus centrally planned economies continuum. (iii) The geographical position and the related socio-institutional and historical heritage (former socialist east, north and Mediterranean) as a proxy of their attitudes towards bottom-up and decentralized initiatives and the cooperative model.
In order to investigate the three aspects reported in
Figure 1, a specific questionnaire was created to collect additional information based on secondary data from Eurostat and national level databases. The questionnaire was submitted in each of the six countries to the COMETS National Research Teams (for further information, please contact the corresponding author). The research teams included scientists and experts in the field composed of COMETS partners, as well as other experts and practitioners in each country. The questionnaire aimed at investigating both the historical pathways of the national energy system with a specific focus on the liberalization process spanning roughly from the 1990s to the present, and the current institutional and regulatory situation in view of the future exploitation of the ECs’ potential. The questionnaire was organized in four main sections: (1) historical background, with attention paid to the liberalization process; (2) market overview, with focus on energy consumption trends, market structures and the technological landscape; (3) governance, national regulatory frameworks, support mechanisms and planning policies; (4) bottom-up initiatives, with insights on the legal framework, the social attitudes towards the cooperative model and local activism experiences.
The paper is structured as follows. In
Section 2 and
Section 3, we respectively summarize the energy system evolution with specific attention paid to electricity production and consumption and the electricity market structure in the six countries. We then move in
Section 4 to analyse the institutional and regulatory aspects that jointly shape the governance of the electricity system. In
Section 5, we take into account the country’s experiences and the socio-cultural attitudes towards energy and the environment and the adoption of cooperative models in the energy field. In
Section 6, a summary synthesis of the main elements raised from the analysis is reported. The main findings are discussed in the conclusions,
Section 7, in order to find provisional answers to the questions above identified.
2. The Energy and Electrical Power System in the Six Case Study Countries
The key background for determining the factors and conditions for the development of ECs is the structure of the energy system. Given that decentralization can be considered at the same time a feature and a pre-requirement of both RES and ECs, it is worth paying attention to the energy mix (production and consumption) characterizing the specific national contexts. Eurostat data for the production and consumption of energy from different sources are presented for the countries participating in the COMETS project (Belgium, Estonia, Italy, The Netherlands, Poland and Spain) and contrasted with the EU27 average. After a first overview of general headline indicators referred to the overall energy system,
Table 1, a focus is provided on the electricity production and consumption that represents the primary domain of interest for the development of ECs.
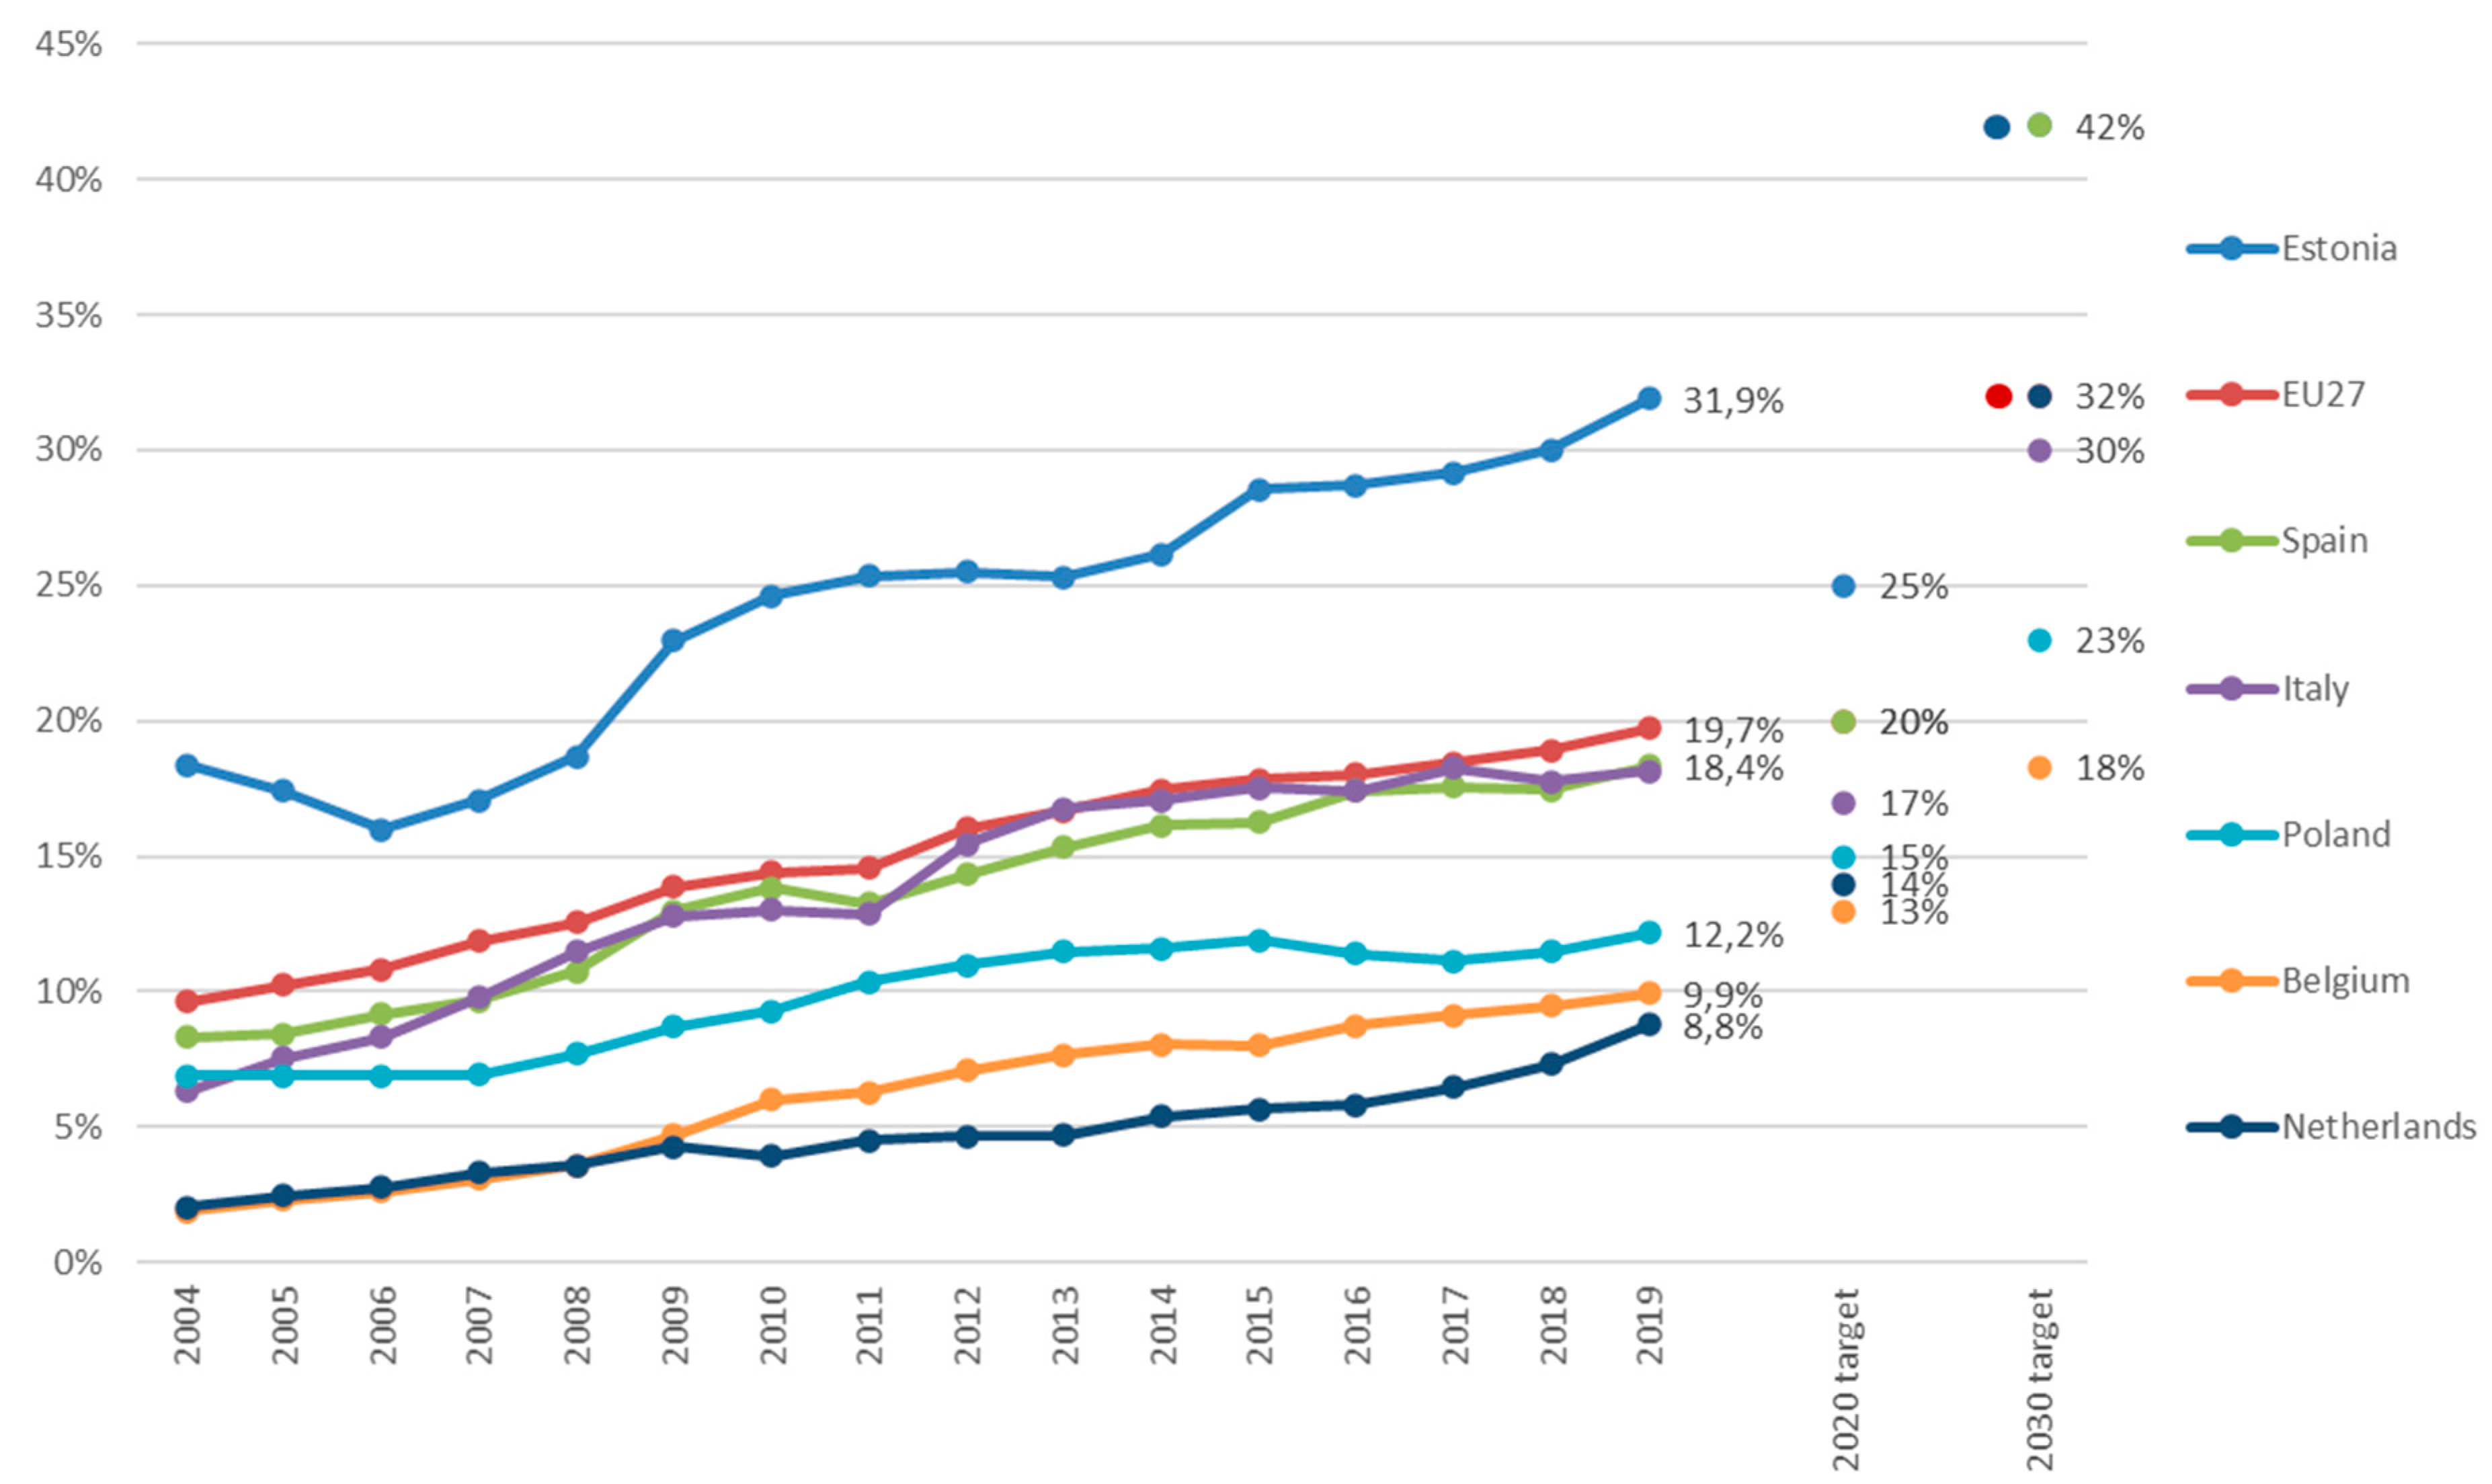
The EU27 share of renewable energy sources (RES) in energy production,
Figure 2, is close to the assumed targets for 2020. Not all COMETS countries have achieved this. The countries with the lowest RES share (Belgium, The Netherlands, Poland) are furthest from their target due to very different reasons. Poland, for example, strongly depends on solid fossils, whereas Belgium continues exploiting nuclear sources (see
Table 1 and
Table 2). The 2020 goals will be achieved by Italy and most likely Spain. Estonia significantly exceeded its declared 2020 target. The Netherlands and Spain have the most ambitious plans to increase the share of RES by 2030.
In 2019, the total energy demand (primary consumption) of the EU27 was estimated at 3.0 TOE (Tonnes of Oil Equivalent) per capita. Final energy consumption was, at the same time, 2.2 TOE per capita. Belgium and The Netherlands consume much more above the EU27 average (primary and final consumption). Italy, Poland and Spain have lower consumption in that regard. For comparison, Estonia has the biggest difference between primary and final consumption in both absolute and relative terms. Estonia has also the biggest final consumption in households (717 KGOE per capita). This is more than twice as much as consumed by domestic households in Spain (313 KGOE per capita—lowest value among all COMETS countries).
Energy dependence data, which are calculated as the difference in imports and exports by gross available energy, shows the high energy dependence of the EU27.
According to Eurostat data in 2019, 6.9% of EU citizens are energy poor, meaning they cannot afford to heat their home sufficiently or have access to modern energy services and products. Energy poverty is on the broadest scale in Italy (around 11% of respondents declared, in a survey, economic problems in heating) and Spain (7.5%). Only 2.5% of Estonians and 3% of Dutch respondents reported in 2019 that they were unable to keep their home adequately warm.
Analysing greenhouse gas emissions, we can see that the Netherlands has the smallest reduction (−7.4%) since year 2000, as a consequence of their energy system structure. Among the six COMETS countries, only two countries reduced their greenhouse gas emissions more than the EU27 average (−17.2%): Spain and Estonia (both −20.3%).
In the EU27, the share of renewable energy sources (RES) in gross final energy consumption was below 20% in 2019. Electricity production is the sector where RES contribute the most. Next is the heating and cooling sector, and the least is transport. The lowest share of RES within COMETS countries is in the Netherlands (9%) and Belgium (10%). Estonia has the largest total RES share (32%) due to the fact that more than half of the heating/cooling demand are covered by RES. When it comes to electricity production from RES, Spain and Italy are the most well positioned (37% and 35%, respectively). Poland has the lowest percentage of “clean electricity” from RES (14%).
As for the total installed power capacity, intended as the maximum output of the electricity system that can be produced under optimal conditions, the EU27 has nearly 42% of the installed capacity based on fossil fuels (
Table 2). Almost 12% of the available volume comes from nuclear power plants. The rest (46.5%) comes from RES (wind, 18%; hydro, 16%; solar, 13%).
Table 3 shows that in 2019, the EU27 produced a total of around 2900 TWh of electricity. The share of RES in electricity production in the entire EU 27 is nearly 35%. Nuclear power plants and fossil fuels provide 26% and 38% of the electricity, respectively. With more than 40% of the RES share, Italy is the leader of the six surveyed countries for non-fossil energy sources’ adoption followed by Spain (38%). The Netherlands produces nearly 59% of electricity by means of gas-fired power plants, Italy over 48%. Estonia relies heavily on oil and petroleum (57%). Belgium has the highest share (47%) of nuclear power in electricity production among the six COMETS countries. Poland is the most dependent on fossil fuels in the production of electricity (72%, mainly from hard coal and lignite).
In the EU27,
Table 4, the dominant RES types are wind energy (onshore and offshore, 37% share among RES) and hydropower plants (34%). The growing market for solar photovoltaic (PV) installations accounted for 12% of electricity production from renewables in 2019, biofuels and biogases for 8% and 6%, respectively.
Despite the overall share of energy from RES growing, the greenhouse gas emissions intensity of energy consumption is still under targeted levels. One of the fundamental difficulties in achieving climate goals is the various energy policies of the EU member states. This is a derivative of the structural differentiation of the energy markets we focus on in the next section in order to complement the analysis of the first determinant defined in the conceptual framework (“Energy and electrical power system”, see
Figure 1).
3. The Liberalization of the Electricity Market in the Six Case Study Countries
This section complements the previous in addressing the first layer of enabling factors for ECs: energy and electrical power market and infrastructure. Energy systems carry important functions in society. They provide energy supply and grant access to energy services. To carry out these functions, countries have been historically establishing National Energy Providers and giving them a special role (in some circumstances as state-owned vertical monopolies) on the energy market. National Energy Providers have been designed to be the big institutions with enough financial and technical capacity but also with the necessary skills and know-how to operate the energy systems within and between the countries. As early as 1988, the European Commission began considering how the Single European Act of 1986, which paved the way for the European Single Market, might be applied to the energy sector, specifically to electricity supply. This began a long process of opening national wholesale and retail electricity markets to trade and competition [
21]. The vision of the European Union to expand the integration process across Member States through the electricity sector concretized in three directives on electricity market delivered in 1996, 2003 and 2009 (Directives 96/92/EC, 03/54/EC and 09/72/EC, respectfully) The Member States (plus Norway) were asked by these directives to transpose in their national legislation specific requirements as well as supporting a pan-European policy. All the components of the electricity sector were affected by these directives: generation; transmission; distribution; retail suppliers; customers; cross-border trading over interconnectors and the degree of unbundling (both horizontal and vertical between generation, transmission, distribution, retail) [
21,
22,
23].
This vision permeated national energy systems through the implementation of the energy packages but at different speeds and degrees. The following will shed light on the market structure resulting from the liberalization process, and on the power dynamics on the electricity market across the six countries highlighted in the COMETS project [
23].
In
Belgium, the electricity market is regulated according to the different competences attributed to the Regional and Federal level. The Regional level was responsible for the distribution and local transport of electricity below or equal to 70 kV as well as to promote the development of renewable energies from 1989 onwards [
23]. The monopolist system in place saw a transformation from 1999 onwards [
24] Flanders opened the electricity market to competition in 2003. Wallonia and Brussels-Capital Region opened the market to all consumers in 2007 [
25].
The liberalization process shows the concentration of market shares within the hands of few players in a context marked by a wave of controversial mergers [
14]. Engie Electrabel and SPE Luminus still remain the largest electricity producers in Belgium, with a market share of more than 50% in 2018. Shortly after the liberalization of the retail market, energy suppliers Engie Electrabel and SPE Luminus had a combined market share of approximately 97% [
26]. While the dominant players remain well-established, competition is slightly improving in the electricity market, as new players come in and compete with each other to gain market shares [
27]. The municipalities are heavily present through municipal associations (public companies established by an association of municipalities), which own shares of the distribution system operators (DSOs). The DSOs play as monopolists and, since the opening of the market, they have been one of the main contact points for consumers. The intermunicipal companies that used to distribute gas and electricity prior to the liberalization are still involved as shareowners of the DSOs [
26].
In
Estonia, the development of the electricity market has been closely linked to the advancements in the EU energy policy through two Acts, the Energy Act in 1998, and the Electricity Market Act in 2003. Although the Energy Act was in line with the EU legislation, the provisions were considered too general and not thorough enough [
28]. Some competition started from 2010 onwards with the amendment of the Electricity Market Act so that large consumers had not only a right but also an obligation to buy electricity from the open market. In January 2013, Estonia opened the electricity market for all consumers. Nevertheless, until today, Estonia has not privatized the state-owned electricity monopoly Indeed, the incumbent player, Eesti Energia, owns 90% of the market shares and is fully state-owned. It is still protected by direct and indirect subsidies and regulations.
In
Italy, the Legislative Decree 79/1999, or so-called “Bersani decree”, represented a milestone in the reform of the Italian electricity sector, as it provided specific requirements for the restructuring of the electricity sector to Enel, the monopolistic player at the time. In 2014, the European Commission noted that despite the numerous active suppliers, the Italian generation sector remained concentrated: 85.4% of the total supply of electricity was provided by Enel [
29]. The free market was less concentrated with a combined share of the three main grid operators (Enel, Edison and Eni) at 34.3%, of which the leading operator (Enel group) accounted for 20.3%. Despite efforts to attenuate its power, the incumbent player Enel remains the dominant player in the market.
In
The Netherlands, the Electricity Act in 1998 liberalized the electricity sector, resulting in a radical unbundling of the system. No utility can be responsible for the whole supply chain anymore, but various independent parties have responsibility for parts of the chain. [
27,
30]. During this unbundling process, competition was introduced. First for large consumers such as companies, in 1998, and in 2004, for the whole demand side of the energy market [
30]. In addition, the so-called Wet Onafhankelijk Netbeheer (WON), informally called the “Splitting Act”, came into force in 2006. As a result of the strong resistance of the companies Delta and Eneco, including several lawsuits, the split of companies was delayed till 2017. In 2019, the most important electricity generating companies in The Netherlands were Delta, EON, Eneco, Engie, Essent and Nuon [
31]. Most of these originated from government-owned companies. After the liberalization, new, mostly small producers, entered the market, such as farmers, citizens, cooperatives and small companies. In the Netherlands, about 50 suppliers exist and several energy cooperatives have their own supplying company.
As for the grid ownership, transmission system operators and distribution system operators are owned, directly or indirectly, by the Dutch state, provinces, municipalities or other public bodies [
32].
In Poland the Council of Ministers adopted, in 2006, the Programme for the Electric Power Sector. This strategic document laid down a path for the development of the power market in Poland and called for the consolidation of energy companies into four vertically integrated energy groups, holding generation and distribution assets, owned by the state. Currently, while legally unbundled, there are five main distribution companies (Tauron, PGE, Energa, Enea and Innogy) of which three are state-owned. PGE is the largest electricity market player, followed by Tauron Polska, Enea and EDF. They represent 65% of electricity production in Poland. In 2015, there were more than 100 active alternative retail suppliers on the electricity market, though the top four suppliers accounted for 87% of the retail market.
As a result of the liberalization of the electricity market in Poland, institutional clients obtained the right to change electricity suppliers from 1 July 2004. Individual customers have had this opportunity since 1 July 2007 as a result of the implementation of the TPA (Third Party Access) principle that enables the use of the distribution network by other entities trading electricity. Nevertheless, the opening of the market has not reached all of the customers yet.
In
Spain, the liberalization of the electricity sector materialized with Law 54/1997 of November 27 of the Electric Sector (LSE) and with the privatization of public electricity companies. The implementation of this market model gave rise to the creation of a new institutional framework, in accordance with European regulations. The possibility of the eligibility of all consumers was set from 1 January 2003, as the right of consumers to choose how to contract electricity provided two choices: to contract electricity supply with the distribution company of one’s choice or to continue “at rate” (price set by the Government). With this measure, the full liberalisation of the market was achieved, both in terms of generation and consumption. In retail this liberalisation was progressively established, and the industrial consumers were the first to access the liberalised market before 2003. However, the regulated price of electricity for domestic final consumers (Tarifa Eléctrica Integral) posed some barriers to the liberalised price and did not allow the desired degree of competition until its disappearance in 2009. The tariff was established by the administration and included both the cost of access to networks and the cost of energy acquisition that was not established upon estimation and policy decisions instead of market criteria. To solve the problem associated with the coexistence of integral tariffs and a competitive market, the Tarifa de Último Recurso (TUR) or “Last Resort Tariff” was established, replaced by the “Voluntary Price for Small Consumers” (Precio Voluntario Pequeño Consumidor or PVPC) in 2014. The TUR was defined as “Last Resort Providers” charge (Suministradores de Último Recurso or SUR). By replacing the Tarifa Eléctrica Integral with a rate resulting from a competitive process, the last resort does not hinder the competitiveness of the market, as it is ensured by a cost-representative price. In Spain, electricity companies maintain a “high concentration” of the market in the domestic segment despite the push from small retailers, and remain predominant despite an increase in RES Energy cooperatives, which have been increasing since 2010 [
33]. This development of initiatives could be due to the current structure of the market (five companies concentrate around 80% of the final customers), the economic crisis of 2008, the possibility of trading electricity since 2010 and the influence of political movements, such as the 15-M, and a legislative curb to renewable energies since 2012. Additionally, renewable energy organizations, such as the Spanish Association of Renewable Energy Companies (Asociación de Empresas de Energías Renovables, APPA), currently represent a “de facto power” that did not exist before.
To summarize, on the basis of what is reported above, it seems that, on average, all the six countries have taken action to comply with the European Directives. At the same time, the liberalization process has experienced a concentration of the electricity market in the hands of a few players, in turn, hindering smaller players from entering the market.
4. Governing the Energy Transition: Planning Policies and Support Mechanisms
This section refers to the second dimension of the conceptual framework: energy policies and regulatory framework. With the new regulations (REDII directive 2018/2001 IEM directive 2019/944, see Reference [
3]), member states are now committed to restructuring their energy systems. As described in
Section 3, European energy markets have been opened for the variety of energy providers, including providers offering small-scale local production and individual energy producers. Special focus has been given to low-carbon energy sources, especially renewable energy sources (RES). As mentioned in the introduction, the IEM and REDII directives, next to the structural and technical changes, also promoted new business models including the establishment, respectively, of citizen energy communities and renewable energy communities (RECs). A research and policy challenge for the future will be to address how these differ among communities and their development, what the differences are among them and how they can be integrated into a sustainable democratization of the energy system. Given that the focus of this paper is on investigating the past pathways followed by the EC models in the different countries in the framework of RES exploitation, our main reference in this section will also be the RECs.
The progress of the implementations of the EU Directives 2018/2001 and 2019/944 has been different in EU countries for both RES and REC support (
Table 5).
The differences in the progress towards the directive transposition is due to the different political and governing structures inside countries that offer an assorted picture of the planning policies in the energy field including the number of decision-making actors implied in the adoption of the measures. Belgium and Spain have the most complex models, whereas Estonia, Italy, Poland and Netherlands have more centralized models.
As for the RES, as reported in
Table 5, all of the six countries investigated by COMETS have been using some sort of direct or indirect mechanisms for establishing the market position for RES, although developed through the market regulations instead of through the direct financial support. In Belgium the national Green Certificate System has been combined with the buying requirements for the energy distributors and additional local incentives for energy producers, including individuals. Despite the national adoption of the scheme, there can be remarkable differences between regions in Belgium.
The European Commission has adopted the collective target to increase the share of RES to 20% of the final consumption and member states have developed their own targets to achieve that. Estonia (with 31.9%) and Italy (18.2%) have already achieved their 2020 renewable energy targets (25% and 17%, respectively) as of 2019 (see
Table 5 and
Figure 2), while Spain is very close with 18.4% (aiming 20%). Poland, Belgium and Netherlands have, still, a significant gap between the goals and the reality. However, it is also important to emphasise the progress of these countries on reshaping their energy markets. Netherlands has more than doubled its RES share from 3.9% in 2010 to 8.8% in 2019. Moreover, Belgium (from 6% to 9.9%) and Poland (from 9.3% to 12.3%) have made improvements on reducing their dependency on fossil fuels. Estonia has achieved its target already in 2011, but will probably have to re-evaluate the strategy because of the controversial role that wood is playing in renewable energy production [
34].
As for the provision of an enabling framework for ECs and self-consumption development, at the time of writing this article (July 2021), Belgium (in some of its regions) and Italy have established regulations for RECs according to the directive 2018/2001, article 22, but all countries are working on the development of legal frameworks for ECs, helping to remove barriers to entry of the market. The following provides further details in each of the six countries investigated by the COMETS project (for a detailed description see reference [
23]):
In Belgium, the Walloon region is in favour of the development of RECs and has legally allowed ECs since 2019, whereas Flanders has been deciding on how to design a framework for ECs with various pilot projects ongoing. In this sense, the Belgian National Energy and Climate Action Plan 2030 (NCEP) is willing to remove the administrative burden and legal barriers to encourage the development of local ECs as a way to trigger the empowerment of citizens and local authorities and make them play a role in the energy transition. With specific reference to smart grids, Flanders aims to maximize the deployment and use of digital meters by 2024 (it started in 2019), to maximize the benefits, and encourage ECs to broaden participation in the energy market.
Estonia’s legal system allows the creation of RECs and the production of renewable energy for self-consumption. The energy roadmap for the city of Tallinn was prepared in 2018 and the Sustainable Energy and Climate Action Plan in 2020. Tartu Regional Energy Agency has been supporting the energy community initiatives in Estonia and has helped to develop several Sustainable (Climate and) Energy Action Plans for municipalities joining the Covenant of Mayors. This Agency is also acting as a technical expert for smart city development.
Italy, through the Ministry of Economic Development, has set incentives that support mechanisms for energy communities, with tax deductions, the alternative to the net metering system called “scambio sul posto”.
In
the Netherlands, the Dutch law stipulates measures that will make 200,000 sustainable houses each year (efficient homes that is built or retrofitted in a way that respects resources, optimizes energy and water use, and will last longer with quality systems), the closure of all coal-fired power stations at the latest in 2030, CO
2; storage and replacement of the obligation to connect homes to the gas grid. In 2030, only emission-free cars will be allowed to drive on the road and the Ministry of the Interior and Kingdom Relations started a project in order to stimulate municipalities to develop natural gas-free heat systems for villages or neighbourhoods [
35,
36].
In Poland, the Ministry of Energy has launched the “National Plan for Energy and Climate for 2021–2030”, which assumes achieving by 2030 a 21% share of renewable energy in final (gross) consumption of energy—including heating and cooling, as well as for transport purposes. The Government is also working on relieving administrative burdens and has set an exclusion of the obligation to hold a license for the production and trade of electricity for collective prosumers when the total installed electrical capacity of renewable energy installations in a collective prosumer’s area does not exceed a certain level. The new regulations will include a definition of energy communities, collective prosumer and virtually operated power plants.
In Spain, many actors take part in the planning policies: the Ministry for Ecological Transitions and Demographic Challenges has the principal responsibilities, but the Autonomous Communities (CCAA) have assigned responsibilities in energy and environmental matters. This has provided the CCAA the capacity to take measures through subsidies and grants. Moreover, municipalities can elaborate on energy efficiency and mobility plans. The Institute for the Diversification and Saving of Energy (IDEA), which is the main energy-related agency of the Spanish national government, has undertaken a line of work to promote local energy communities, by preparing a guide with the steps to follow for its constitution and the possibility of financing pilot projects. It is not the only institution of this nature in Spain. There are others in some Autonomous Communities, such as Catalonia (ICAEN) or the Basque Country (EVE), with an important role in the energy field in their own CCAA.
To summarize, the support mechanisms provided by national government might vary a lot along a continuum “…of payment-based instruments, which provide money directly (e.g., grants and funding programs) or indirectly (e.g., tax exceptions or feed-in tariffs) to community energy projects” [
37]. Poland has implemented arguably the most diverse set of support mechanisms, including the feed-in tariffs (FiT) and feed-in premium (FiP) for electricity providers and additional subsidies for households changing their heating systems and installing PV panels. Additionally, Spain has adopted both FiT and FiP support mechanisms that were remarkably reduced in 2012—an unfortunate development, especially for small-scale market actors. Although Spain had one of the most successful experiences in the public promotion of electricity from renewable energy sources (RES) since the implementation in 1998 of the feed-in tariff (FIT) scheme, a change of government in 2012 provoked a deep change in the regulation and the regime started to protect the traditional utilities against RECs and set up new regulations, namely the PV sup-port, which were suspended by the Royal Legislative Decree 1/2012 [
33]. Estonia and Italy have established FiT tariffs, and the Netherlands has set FiT tariffs together with local/regional tax reductions for citizen cooperatives. Belgium has also set up an incentive that helps to establish the competitiveness of renewable energy in the market.
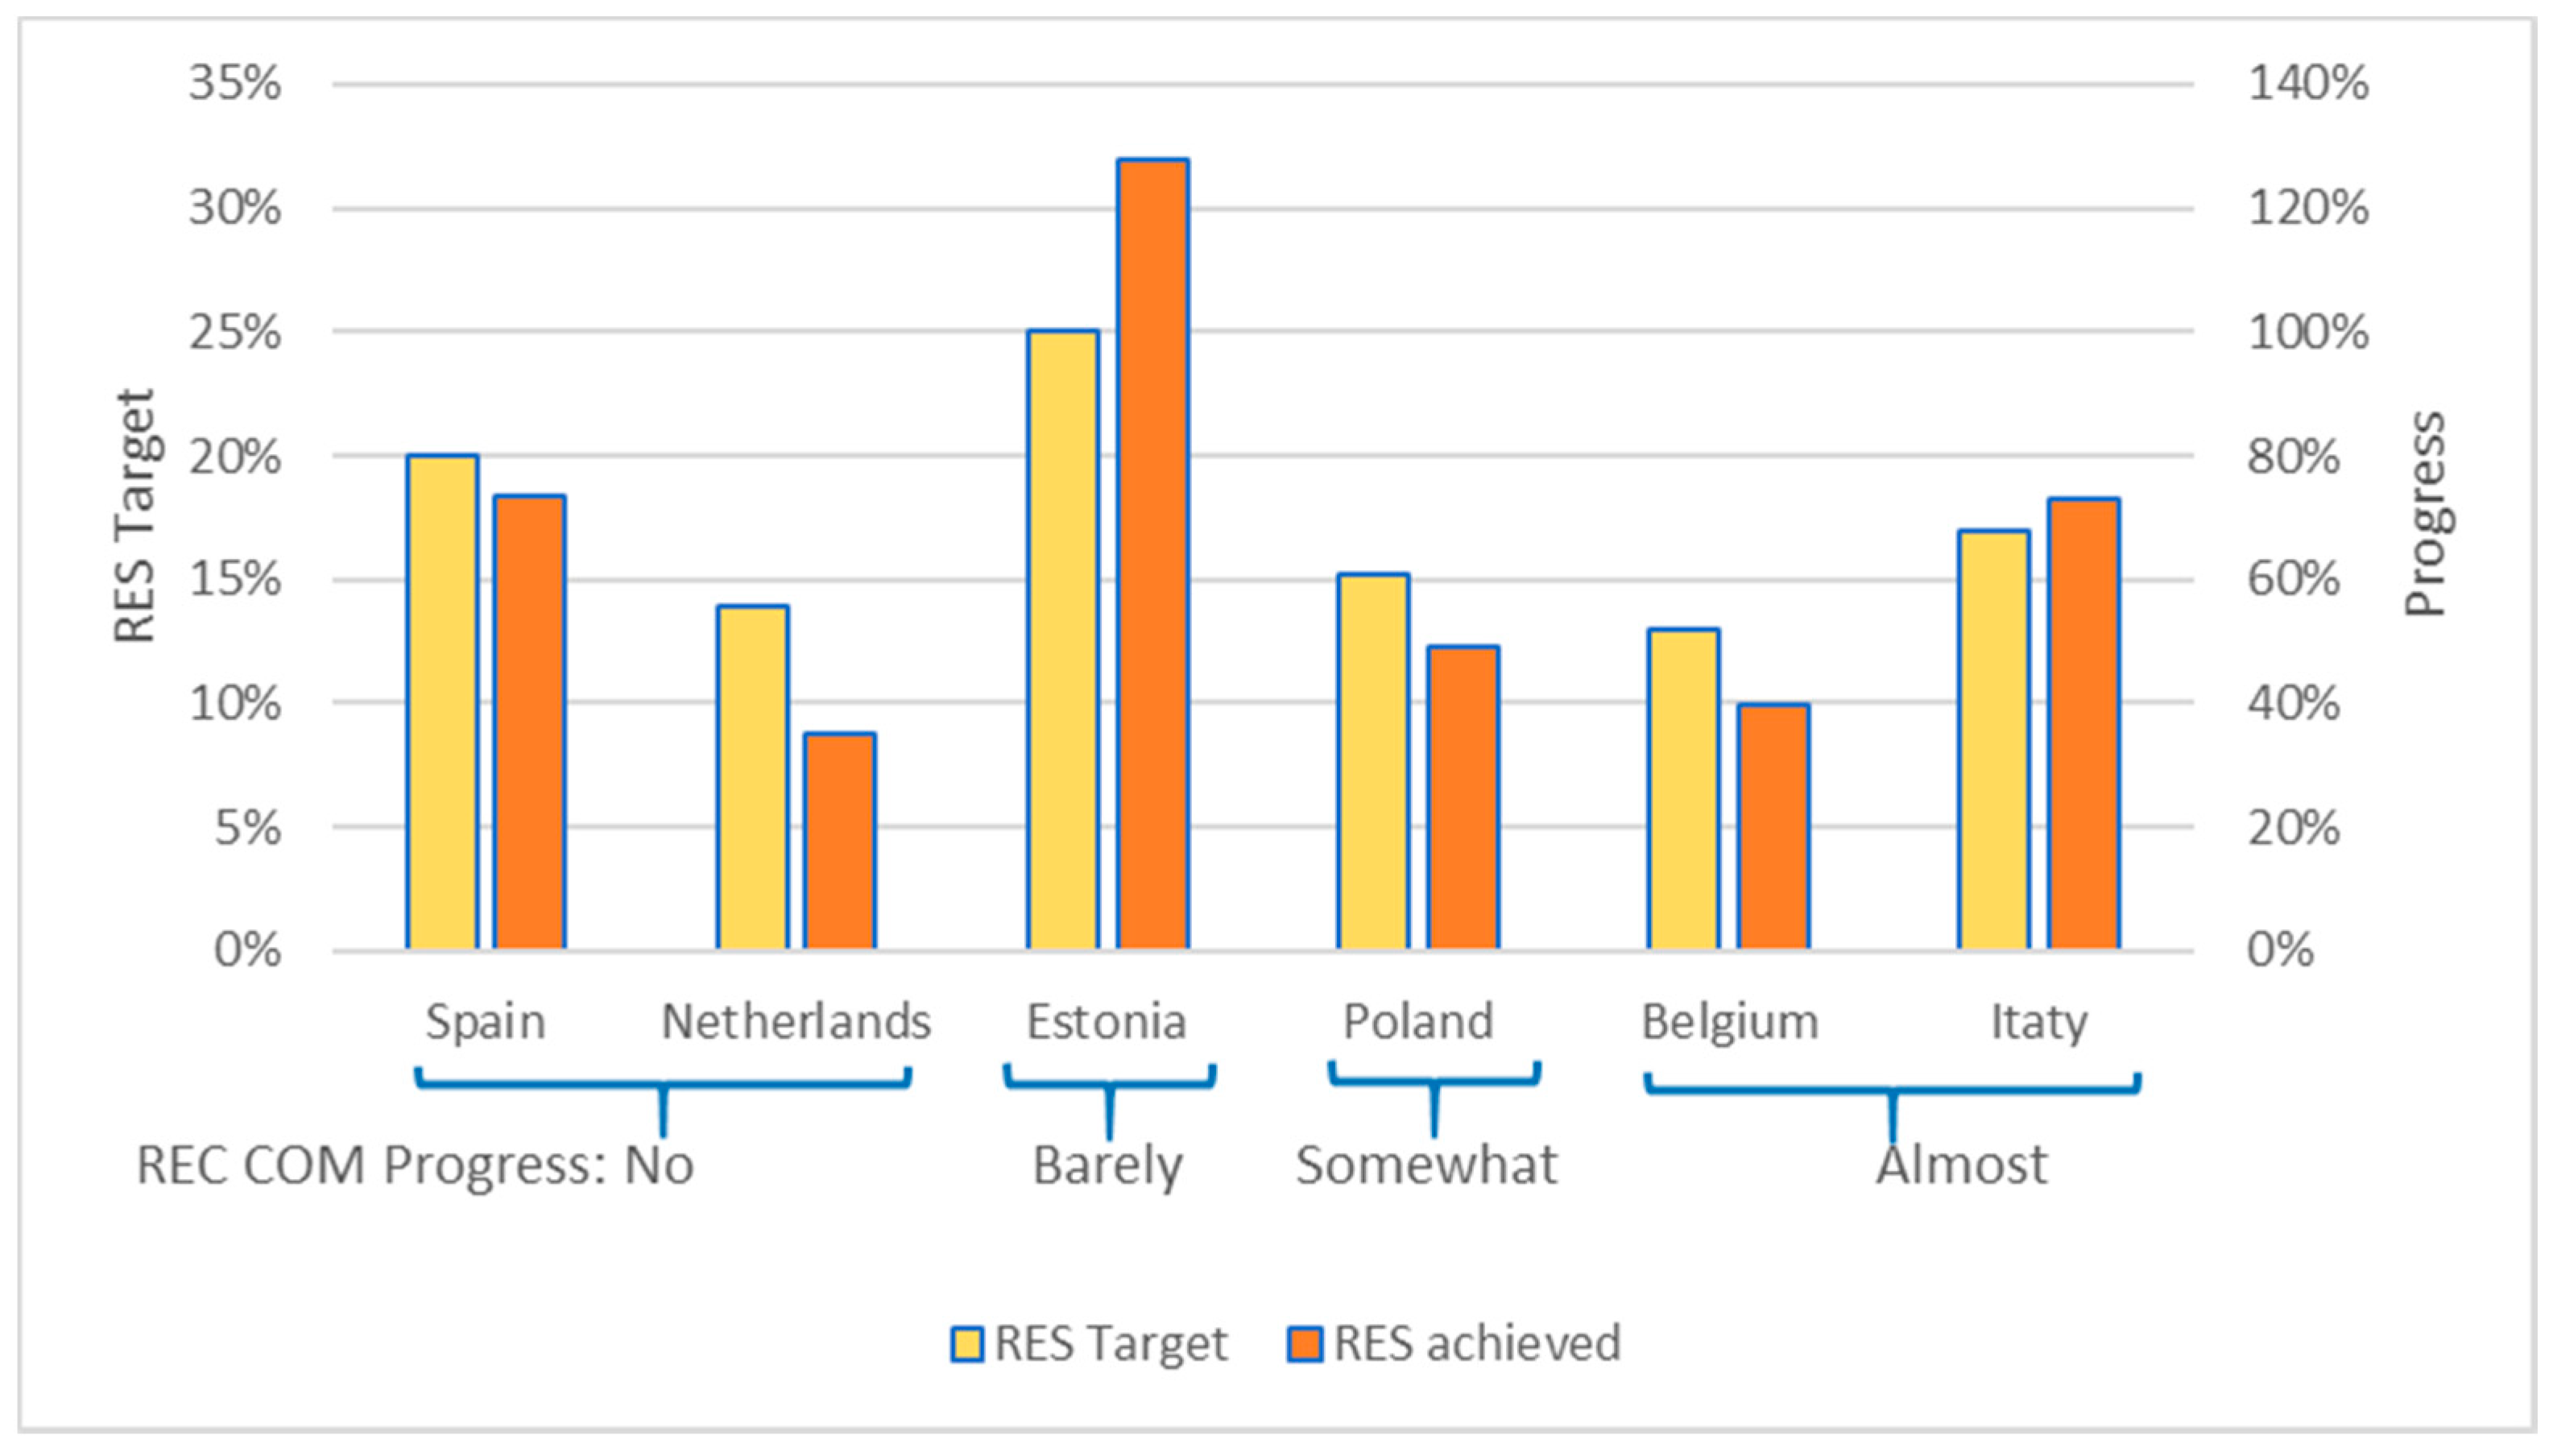
As for the implementation of a proper regulatory framework to support ECs’ development and the increase in RES share in energy production and consumption in July 2021,
Figure 3 reports the progress of the six surveyed countries. The situation is expected to evolve quite fast given the obligation to all the EU countries to transpose the EU directive. Therefore, it is worth highlighting here the absence of a strong relationship between the different progress in the provision of the enabling regulatory framework and the heterogeneity in the decision-making actors network that varies from the centralized models. This is especially evident when comparing Estonia, Italy, Poland and The Netherlands to the more distributed models in Belgium and Spain. However, Belgium and Italy are at the forefront, although the decision making is highly different, whereas The Netherlands and Spain are both delayed in the directive transposition.
5. Socio-Cultural Attitudes towards Bottom-Up Initiatives
This section addresses the third and final layer of the conceptual framework: socio-cultural attitudes towards environment and cooperative models. It is focused on two aspects that explore the extent to which a country is prone to EC implementation, namely the familiarity with cooperative enterprising and its history of energy activism. The former aims at reporting the experience with cooperative enterprising, which can be built on by ECs to develop a local energy movement, while the latter, which includes anti-nuclear activism, is intended as a proxy of a more general readiness of a country’s citizens to engage with energy and environmental issues. As in the previous sections, the main insights from the analysis carried out in the framework of the COMETS project are reported below (For a detailed description, see reference [
23]).
In
Belgium, the ECs are predominantly incorporated as energy cooperatives. Socio-cultural developments influencing their development are the longstanding familiarity with cooperative enterprising, and, to a limited extent, anti-nuclear mobilisation. As for the familiarity with cooperative enterprising, the cooperative movement dates back to the first half of the nineteenth century in Belgium when the cooperative ideas from the Rochdale Society of Equitable Pioneers in England, created in 1844, spread across the borders. Some energy cooperatives follow the cooperative principles, while others are top-down, incumbent-owned power companies [
4]. These “top-down” initiatives, using the cooperative model to finance RE production plants, undermine the legitimacy of the collective action “bottom-up” approach, as these cooperatives do not allow the members to co-own the enterprise and its technology. To counter this phenomenon, REScoop Belgium, was created in 2013 to voice and promote the cooperative ideal [
4]. Today, REScoop is an EU-wide federation of renewable energy cooperatives. As for energy activism, the anti-nuclear mobilization has been marginal in the public debate in Belgium. However, several cooperatives were, at their origin, associated with local protest movements against nuclear waste and nuclear energy [
4].
In Estonia, financial cooperation and collective forms of entrepreneurship have a deeply ambivalent connotation. The first initiatives are in the process of establishing an energy cooperative in southern Estonia. If these are a success, then others may follow. As for the familiarity with cooperative enterprising, cooperative activities were popular in Estonia in the 1920s and 1930s. Due to the rapid increase in economic activities after WWI, the period between the two world wars was a golden era, especially for rural cooperatives. However, this was not the case for the energy sector that was under strict control of the state. In the following period, the good experiences with collective enterprising were overshadowed by the collectivization during the years of soviet occupation. In this cultural context, the collective forms of entrepreneurship are linked with the memories of forced collectivization and the general mismanagement of the resources by the foreign ruling power. The rapid and disruptive manner of privatization of large-scale, post-soviet industries during the 1990s has also been linked with the negative experience of collective ownership and has left tens of thousands of people jobless and without many well-earned social benefits. However, the tide has started to turn again, because due to the increase in economic activities, new forms of entrepreneurship models, including energy cooperatives, are finding more acceptance and interest among the general public. As for energy activism, historically there have been examples of activism at a local and even at the national level against intensive production of shale oil. Because of the social and structural changes during the 1990s and 2000s, the tradition of energy activism has been weakened, but there has been a new rise in environmental and energy activism in Estonia that may become more influential in the years to come.
In
Italy, as with most Southern European countries, the number of ECs is still small compared with Northern and Central European countries, where hundreds of renewable energy cooperatives can be counted [
3]. As for the familiarity with cooperative enterprising, “historical hydroelectric cooperatives” emerged as early as the first half of the twentieth century in the northern Alpine area of the country. Their purpose was to provide access to electricity and foster the economic and social well-being of mountain populations through the production and distribution of electricity from hydroelectric plants. Since the nationalization of the electricity grid, these cooperatives have enjoyed a special legal status, which also allows them to maintain ownership of local grids. As such, they are not a replicable model to date. However, new EC projects have emerged since the late 2000s in a context of liberalized energy markets, progressive transition of energy systems towards renewables and distributed generation, and subsidies for RE. About 60% of those ECs are constituted as cooperatives, while others are associations or limited companies. Some energy communities have a top-down approach, meaning that a municipality or another private company promotes the initiative and involves the participation (and the financing) of citizens. Others have a bottom-up approach, and citizens themselves organize and finance ECs [
38].
As for energy activism, the liberalization of electricity markets and generous incentive schemes to support renewable generation since the late 1990s have produced land-use tensions. They were mostly associated with large biogas facilities in agriculture-oriented areas in northern Italy, and to wind and solar power plants in the southern regions of the country [
39]. The NYMBY Forum Report [
40] still reports many cases of local environmental controversies in Italy. The connection of these movements and the emergence of ECs in Italy cannot be directly inferred, but it can be stated that at the origins of several ECs are ecopreneurs of different types [
41]. In some cases, they have links with the environmental movement of the 1970s or with the social economy, in others they are new figures who have acquired technical knowledge and environmental sensitivity by working in the emerging green economy sector.
In
The Netherlands, as in Belgium, a cooperative association (with excluded liability) is a favourite among ECs [
42,
43]. It lends itself to collective action because it is a form of enterprise that members manage and finance based on a shared objective. As for the familiarity with cooperative enterprising, already at the start of the 20th century, some Dutch citizens started to organize in energy cooperatives. The aim of these over 80 cooperatives was to bring electricity to the countryside. During this period, characterised by the industrial revolution and strong Liberalism, other types of cooperatives also arose, some were related to socialist or anarchist movements, but often they were very practically-oriented and shared machines, capital and labour to organize production and retail. Although energy cooperatives were already active from 1905 until about 1960, and again from the 1980s onwards, the big wave came after 2010 when the economic and regulatory climate became more favourable. As for energy activism, in the 1980s, some anti-nuclear activists together with other actors started wind cooperatives. This resulted in some large wind cooperatives, which now have several wind parks and many customers [
44].
In
Poland, the ECs landscape refers to a variety of initiatives such as energy cooperatives, energy clusters and small energy sharing initiatives (even if not formalized). As for the familiarity with cooperative enterprising, the history of cooperatives in Poland is quite long and goes back to the second half of the nineteenth century. Various cooperatives were also important during the formation of the state after 1918 (independence of the country). However, the experience of real socialism destroyed the enthusiasm for cooperative enterprising. The experience of involuntary associations meant that Poles are reluctant to participate in collective actions. One of the lower levels of social trust in EU countries (European Social Survey) is also a barrier. As for energy activism, with worsening air quality and the acute problem of acid rain caused by industrial and energy sector emissions, “alternative energy sources” were explored as an option in Poland already in the early 1990s. Nuclear energy was not even considered in the aftermath of earlier societal protests [
45]. However, this energy activism did not lead to the formation of energy cooperatives.
Finally, in
Spain, most of the energy communities marketing renewable electricity are also cooperatives. As for the familiarity with cooperative enterprising, two important periods can be identified in Spain’s recent history. The first wave of cooperatives was between the end of the 19th and beginning of the 20th centuries when people from peripheral regions collaborated to supply electricity to their businesses and homes. There was no interest from the state nor from private investors to connect those areas to the grid. Among those energy cooperatives, there were many RES cooperatives based on hydroelectric power [
46]. The second wave of energy cooperatives has been from 2010 onwards, when different organizations focusing mainly on the retailing of electricity from RES have been created. These organisations were motivated by environmental and social concerns following other European examples [
33]. As for energy activism, the anti-nuclear movement has been strong in some parts of Spain. In the Basque Country, important citizen protests against the planned nuclear plants happened. Although the anti-nuclear movements were relevant in Spain, they did not lead to the emergence of RES cooperatives as in other European countries [
33].
To summarize, evidence presented shows a link between collective action initiatives and cooperative movements, although this is stronger in some countries than in others. The growth of collective action initiatives in energy is also linked to environmental activism. Energy community initiatives have been founded in multiple countries as alternatives to nuclear energy, but not in all countries have environmental concerns led to an increase in ECs, as past experiences with collectivism also weigh in (e.g., in Poland). Overall, none of the studied countries have yet experienced a breakthrough of ECs on the electricity market.
6. A Summary of the Main Results
In this section, a synthesis of the main results is provided with attention paid to all the factors explored, namely: the historical evolution of the electricity market structure, the technological trends in electricity generation, the changes in the national regulatory framework, the support instruments for renewables, the planning policies, the attitudes toward the cooperative model and the influence of the ecologist and anti-nuclear movements in shaping local energy activism.
Table 6,
Table 7 and
Table 8 aggregates these factors around the three dimensions considered in this paper as enablers for the development of ECs.
As for the dimension, “energy and electrical power system: market and structure” summarized in
Table 6, the main findings show a direct relationship between the liberalization of the electricity sector and the energy transition. There are different degrees of liberalization in each country that strongly affected the market structure. In markets with a higher level of deregulation, small-scale distributed generation is more likely to support citizens in renewable energy production. This was seen in the Netherlands, with the opposite seen in Estonia and Poland. In Estonia, where the market is still dominated by a single state-owned company (holding 97% of the production capacity), and in Poland, where state-owned or state-controlled companies account for 65% of total electricity production and 87% of the Polish retail market.
There is still a great opportunity for other players to participate in the uptake in renewable energy sources (RES).
As for the dimension, “energy policies and regulatory framework” summarized in
Table 7, many ECs depend on government support mechanisms and favourable tax programs, yet aspire to create more financially independent and robust self-supporting and funding schemes that are not dependent on the vicissitudes of government funding. For the ECs to survive as an actor in the energy system, their role needs to be explicitly supported by legislation. This drives the need for a proper transposition of the EU Directives 2018/2001 and 2019/944. The six countries investigated by the COMETS project have taken action to comply with the European Directives. At the same time, the liberalization process has experienced a concentration of the electricity market in the hands of a few players, in turn, hindering smaller players from entering the market.
For the dimension, “socio-cultural attitudes towards environment and cooperative models” summarized in
Table 8, there are large variations in the forms and levels of participation and engagement across the six countries studied, especially relating to dimensions such as the type and focus of the ECs and the cooperative culture in the country. This study shows a link between ECs and cooperative movements, although this is stronger in some countries than in others. The growth of ECs is also linked to environmental activism, such as building alternatives to nuclear energy, but not in all countries have environmental concerns led to an increase in ECs, as past experiences with collectives also weigh in (e.g., in Poland). In countries such as Italy and Spain, where the spontaneous and voluntary cooperative movement has an old and well-established tradition, people are both familiar with the legal structure and are aware of its benefits.
7. Conclusions
In this paper we have focused on the role that some social, economic and institutional factors have played, and have the potential to play, in shaping the evolutionary trajectories of bottom-up initiatives in support of the energy transition. The emergence of energy communities, and all forms of collective action initiatives in the energy sector, especially since the 2000s, is associated with a progressive transformation of the energy markets. Market liberalization and the transition toward renewables’ generation and decentralized energy systems have allowed the entry of new actors in the energy markets. This, in turn, has opened up the opportunity for Small and Medium-sized Enterprises (SMEs), local authorities and citizens to take an active role in energy production and ownership. In this context, new and participatory paradigms for the deployment and provision of energy projects and services have emerged, empowering citizens to engage in the energy system.
More recently the EU provided a formal recognition with the directive 2018/2001, which has also contributed to supporting citizen engagement in the energy sector. At this high level, support is an important step for citizen engagement in the energy transition. A chief aim of this article was to contribute to the provision of a useful knowledge base for the effective implementation of this enabling regulatory framework at the country level.
By considering the disruptive innovation potential represented by ECs, as defined by Caramizaru and Uihlein (see reference [
3]) on the institutional, market and social level, we adopted a conceptual framework that considered three layers of aggregation of the potential factors needed to affect the diffusion of ECs: energy and electrical power system (market and structure); energy policies and regulatory framework; socio-cultural attitudes towards environment and cooperative models.
Thanks to this framework we were able to collect and systematize data and information on six EU countries involved in the COMETS project. This provided the necessary analysis to explore the extent to which the diverse institutional and socio-economic national settings might affect the implementation of ECs. We identified three main questions to be answered. First, we examined the relationship between the liberalization of the electricity sector and the energy transition, and the results of our analysis show how the different degree of liberalization in each country has strongly affected the market structure and the related opportunities for innovative actors as ECs to produce and distribute electricity. In markets with a higher level of concentration, incumbent utilities are more likely to dominate renewable energy markets, while in deregulated markets, small-scale distributed generation is more likely to rise as a relevant factor in renewable energy production. This is the case in The Netherlands, while the opposite is seen in Estonia and Poland. In Estonia, the market is still dominated by a single state-owned company (holding 97% of the production capacity), and in Poland, state-owned or state-controlled companies account for 65% of total electricity production and 87% of the Polish retail market. Belgium, Italy and Spain stand in the middle with historical incumbent players still keeping a considerable market power.
As for the second question, we examined the extent to which the evolution of the policy and institutional settings might create a regulatory framework able to support or hinder ECs’ diffusion. It seems clear that for the ECs to survive as an actor in the energy system, their role needs to be explicitly embedded in legislation. This drives the need for a proper transposition of the EU Directives 2018/2001 and 2019/944. In July 2020, when a survey was carried out by the COMETS project, the directives were only partially transposed by Italy with a temporary legislation that will be dramatically revised at the time of full implementation.
With reference to the governmental incentives mechanisms and the planning policies, the development of community energy projects for renewable energy production was significantly supported in Europe in the first decade of the 21st Century. National energy policies have a significant influence (either positive or negative) on the creation and scaling up of ECs. If governments want to encourage their proliferation as part of a scale-up decarbonisation strategy, then policy makers should consider the added value of citizen participation when designing tendering procedures and policy frameworks. This can also include tax incentives and streamlined approval processes. In terms of “soft” policy support, there is a need for better access to knowledge and expertise about RES, about how to create an energy cooperative and about technical energy solutions in general, knowledge-sharing at the community level.
Through the means of a variety of supportive tools (feed-in tariffs (FiTs), installation subsidies) in many EU countries, RES production increased consistently. However, all these measures showed only a temporary effect as they had a typical duration of 10–13 years, after which they have been replaced with less support. This is exemplified by FiT incentives to photovoltaics (PV), which by guaranteeing fixed long-term tariffs and net metering to PV system owners, made PV investments quite profitable and relatively low risk, thus making them more easily implemented by local energy communities. This explains why a high majority of ECs have so far focused on PV plants as their main activity along the supply chain [
41]. Once FiTs are no longer available, local ECs struggle to maintain their activities.
The market power has not significantly changed, nor have national governments in the six countries. This is true even given a certain degree of systematic protection of the traditional utilities, with a rising tendency after the 2008 economic crisis towards establishing an institutional environment more hostile towards community energy initiatives. This has been particularly clear in the case of Belgium, Estonia, Italy, Poland and Spain, with the Dutch case representing an exception due to the introduction of a new support mechanism in 2014: a zip code scheme that provides a lower energy tax on electricity in the case of collective generation by a cooperative within a certain zip code area.
When it comes to policymaking, a number of recent policy interventions aimed at stimulating the emergence and establishment of EC projects can be highlighted in terms of either direct or indirect support instruments. Some direct support policies worth mentioning are specific loans or guarantee schemes, technical assistance and capacity building, being part of national or international networks and partnerships with government agencies. Some indirect support schemes that can support renewable energy diffusion include other sustainability-focused interventions such as the eco-social requisites in public tenders and similar proposals for changes in the general framework for policies beyond the energy domain. A variety of notable situations is being implemented in the investigated countries. Belgium, Spain and The Netherlands have policies and incentives developed at regional and local levels that are playing a fundamental role in shaping an energy transition based on democratic, sustainable and decentralized production. Conversely, Estonia and Poland are both lacking any institutional or public involvement in creating energy communities.
Finally, as for the third question about the role of societal attitudes towards the cooperative model in fostering the diffusion of ECs, a variety of situations characterize the surveyed countries. In the Mediterranean countries Italy and Spain, as well as in Belgium and The Netherlands, where the spontaneous and voluntary cooperative movement has an old and well-established tradition, people are both familiar with the legal structure and are aware of its benefits. In countries where the general public and other actors are less familiar with this model, a low awareness may potentially constitute a “cognitive barrier” [
3]. In Eastern European countries, the cooperative movement invokes a connection with former state-run socialism. The quick transition to market economies in the 1990s partially explain the negative view of collective ownership among citizens in Estonia and Poland, particularly the widespread mistrust of the cooperative institutional structure due to its top-down misuse by the establishment during the socialist era.
Although preliminary, in line with other recent publications in the field [
47,
48], our exploration confirms the relevance of a widely diffused positive social attitude towards ECs as enabling these initiatives to be established and scaled up. However, as we have already noticed with energy market structures and national-level institutional frameworks, the role of different historical experiences that have contributed to define enabling attitudes seems to be more relevant. The main results of the COMETS project comparative analysis carried out in the six countries confirms that the country-specific historical pathways, followed by both the energy systems and the perspectives on the cooperative model, can strongly affect the conditions and the likelihood for ECs to become crucial actors in the energy transition.


 ,
, 


