2. State of the Issue
The approach to management has evolved in time. As a separate field of science, “Management and Organization” began to function structurally only in the 19th century and developed as “Management” in the 20th century [
1]. However, “Housekeeping” or “Husbandry”, which can be considered a prototype of the concept of “Management”, functioned unofficially in ancient times, referring, mainly through Xenophon and Aristotle, to the concept of the management of household resources [
2]. Over the past few decades of the 20th and 21st centuries many definitions of “management” have been proposed. One of them is the definition proposed by Nicki W. Griffin: “Management is a set of activities (…) directed at the resources of the organization (…) carried out with the intention of achieving the objectives of the organization in an efficient and effective manner” [
1]. A number of concepts of, and approaches to the issue of management and its types have been developed, among others for organizations (such as business enterprises). One of them is strategic management—which is of particular interest to the authors due to the subject matter of this article—belonging to the so-called “modern management methods” [
3]. Strategic management, the product symbol of which is strategy, is the broadest type of management in terms of content. It covers the entire organization: all the aspects of its long-term activity including ongoing change [
4]. This conceptual sphere of management is associated with a set of distinctive features, which include the following [
5]:
- -
Quantitative data as a basic source of knowledge;
- -
High uncertainty about the results of the planning;
- -
The reliance on examples, theories and rules in management strategies;
- -
The lack of one (best, most effective) way of developing strategies;
- -
basing the strategy on a qualitative and quantitative approach while using empirical and deductive methods.
The approach to strategic management itself also evolved, driven by changes in the characteristics of the purposefulness of business entities. In the 1970s, the main goal of the enterprise was a product-oriented management, seen as a way to meet demand. In the 1980s, management activities were directed at the market and its formation; the linking of the company’s goals with its competitiveness. At that time, the so-called “school of resources” emerged, based on the claim that the competitive advantage of an organization depends on its accumulated skills [
6]. Another change, to the value of the enterprise (or “goodwill”), understood in tangible terms, appeared in the 1990s. It was based on free cash flows as a measure of efficiency consistent with value-based management, reflecting the value of the company for shareholders in relation to the weighted average cost of the invested capital (WACC) [
7]. Since the beginning of the 21st century, there has been an increasing focus on the inclusion of the so-called “intangible assets” in the creation of value, with the value of the enterprise measured by multiple criteria involving both tangible and intangible areas. Now, more than 20 years after the concept was created, this is the main approach used by shareholders, as intangible resources are now the main factor in the building of the strategic long-term competitive advantage of enterprises, especially those with large repositories of knowledge and proprietary know-how [
8]. Research carried out by R. Isaac and I. Herrmens has shown that the factor allowing for the effective and continuous development of an enterprise is intellectual capital. At the same time, this capital makes it possible to observe the principle of proportionality between the pace of development of the enterprise and its environment [
9]. This capital is an exclusive value of the organization, while being dependent on the type of business, external environment, business environment, as well as the culture and history of the organization. Due to this individual nature, there are problems with the metering of this factor but it is known that it plays a significant role for shareholders [
10]. According to a Standard & Poor’s survey, intangible factors determined as much as 85% of the value of the 500 largest global companies already by 2015.
In terms of this multi-criterial understanding of the value of the enterprise, material factors are based on financial values which include, among other things, fixed and current assets, financial capital and net profit [
11]. It is possible to capture them in a numerical way that ensures comparability. Intangible factors pose a greater challenge in terms of their quantitative measurement because they include, among other things, relations with stakeholders, organizational culture, methods of communication or management styles. However, both these groups of factors are closely related and act on each other in terms of value creation. Therefore, it should be remembered that, while developing one group, we should not forget about the other, equally important. We need to develop them in a sustainable way, working on capitals in order to build value in terms of tangible and intangible factors.
The above changes in the understanding of the value of enterprises and the ways of creation of this value are also connected and interfused with changes in the objectives of the development of the human population in terms of including the context of the environment in them. In 1987, the United Nations’ World Commission on Environment and Development defined the concept of “sustainable development”, meaning such socio-economic development of modern societies that maintains the status quo for future generations [
12,
13]. The idea of sustainable development is based on three main factors: global environmental protection, solidarity between countries (especially between those situated on the two extremes from the economic point of view), taking into account the needs of future generations and recognizing and treating responsibly relationships between political, social, economic and ecological factors [
12,
13]. Sustainable development can be considered in terms of micro and macro perspectives The macro approach concerns a global approach based on the implementation of ideas into the policies of individual countries and, furthermore, their relationships and groups [
14]. Global issues are directly related, firstly, to the so-called “social megatrends”, i.e., global trends affecting social, political and cultural changes that are taking place in the modern world [PWN] and, secondly, to the legislation in individual countries that regulates the elements related to reporting the impact of enterprises on issues related to sustainable development. In turn, the micro approach refers to local activities of a given entity, such as an enterprise, which are a direct response to sustainable development issues on the macro scale [
14].
“Corporate social responsibility” is a concept inextricably linked to the idea of sustainable development. In contrast to the concept of sustainable development, which has been developing in the macro scale (i.e., globally, mainly based on the United Nations), corporate social responsibility has been implemented at the micro scale (i.e., directly in enterprises), having its roots in the philanthropic activities of companies and/or in public relations (PR) activities. In 1979, A.B. Carroll formulated the first definition of the concept of CSR, stating that “Corporate social responsibility encompasses the economic, legal, ethical, and discretionary (philanthropic) expectations that society has of an organization at any given time” [
15,
16]. In 2001, CSR was defined in more detail in the European Commission’s Green Paper as such a concept for the functioning of enterprises, according to which they will implement their strategies taking into account social and environmental aspects, placing particular emphasis on these factors in their commercial activities and in their contacts with the stakeholders. CSR focuses mainly on the “good” development of the company, but not always approaching its activities in a holistically sustainable way. Nevertheless, it allows a company to implement activities in the current perspective, being a bridgehead for developing a strategy towards sustainable activities. However, the displacement or absorption of activities related to the socially responsible approach by the implementation of the concept of sustainable development is currently observed due to the cascading of the concept from the macro approach to the micro approach.
There are two basic types of multi-criteria approaches to the value creation. One of them is an integrated approach, under which there is the construction of a single strategy, based on the idea of sustainable development, maximizing results on individual forms of capital: most often financial, material or natural (representing tangible values) and labor, social and intellectual values (representing intangible assets). The other is the non-integrated approach based on the strategy of corporate social responsibility in the building of intangible elements of value.
Organizations should base their activities on a well-developed business strategy. Accordingly, the strategy should take into account social responsibility issues. More specifically, a corporate social responsibility strategy or a sustainable development strategy should be developed to define and describe the directions of current and future activities [
17]. Nowadays, companies are, or should be, aware of chances and opportunities arising from the integration of their basic business model and strategy related to social responsibility or sustainable development, because there is not only correlation but often even interdependence of policies, procedures or processes that form the basis for effective management of the organization [
17,
18]. The sustainable development strategy is a company’s business strategy which assumes the creation of enterprise value based on building value also for its stakeholders. According to the definition of sustainable development itself, the strategy should focus on three areas: environmental protection and rational waste management, economic growth and fair distribution of its benefits and broadly understood social development. From the business perspective, such a strategy allows us to systematize the activities carried out by the company in individual areas and, next, to define precise and realistic long-term goals. In order to maintain transparency, companies often decide to publish the effects and annual progress of their activities in documents, most often annual reports. The sustainable development strategy should be based on, and often be, the company’s business strategy while taking into account the opinion of the company’s environment, as well as the risks associated with the challenges posed to a given industry. In turn, the CSR strategy indicates a comprehensive direction of the organization’s activity in the non-business or business-related aspect, related to its external or internal environment (employees), which includes legal, operational, environmental, market and socio-cultural activities. In contrast to the sustainable development strategy, the CSR strategy is a kind of signpost and a set of specific guidelines allowing for effective management of relations with the environment and identification of opportunities, threats, weaknesses and strengths of the entity in activities aimed at building a good image and positive relations of the company with its environment, which is why it is so important to pursue it correctly [
17,
18]. Existing norms and standards, such as ISO26000:2010, GRI Standards or the AA1000 Group Standards, are helpful in this process by providing consistency, complementarity, systematization and standardization of the activities discussed in the previous paragraphs.
In both cases the same algorithm of strategy-building is used although, depending on the role and importance, i.e., the scope of the company’s approach to weight, and behind it the inclusion of stakeholders in value creation and the approach to directing the goal of value implementation, companies choose a CSR strategy (related to lesser participation of the environment in value creation) or a sustainable development strategy (associated with a greater contribution of environmental participation in the building of value).
Step 1 of building such a strategy, in both of the above approaches, consists in defining the mission and vision of the organization, its values and building a code of ethics in force in the organization, as well as creating organizational and legal elements that establish so-called “corporate governance”. It is these elements that determine the legal and ethical basis for any future actions taken by the company. Step 2 consists in identifying the company’s stakeholders, taking into account the divisions between internal and external stakeholders, and then indicating their impact and interest in the organization. Step 3 involves developing a plan to engage individual stakeholder groups according to their impact and interest and defining the policies to be applied to them. This activity should be the most important planning part of the work applied by the entity to the individual stakeholders. In the integrated approach it will be a sustainable development strategy, in the non-integrated approach it will be a CSR strategy. Step 4 is the effective implementation of the plan developed in step 3. Step 5 involves the monitoring of the stakeholder engagement plan and the capture of feedback. Step 6 consists in studying the results of the whole cycle, including their reporting, which are to be used as a contribution to the possible update of the values identified in Step 1 [
19].
The concept of the “stakeholder”, introduced in 1963, initially meant “groups without the support of which the organization would cease to exist” [
20]. Over time, a broader approach to this concept has developed, defining the stakeholders as all organizations and/or individuals who participate in the development of a project. The market value of the company is built precisely for these various groups of stakeholders, among whom the following are mentioned most often [
21]:
- -
stockholders, owners, shareholders;
- -
clients;
- -
suppliers, subcontractors and entities cooperating with the organization;
- -
executives, managers and employees;
- -
associations, chambers of commerce;
- -
administrative authorities;
- -
financial institutions and investors.
All the above stakeholder groups are closely related to, and dependent on, one another because all of them are in some way interested and have an impact on the company, and thus on the value it builds, being aware of its implementation also thanks to them and often also on their behalf. For this reason, these stakeholders are collectively referred to as the “strategic stakeholders”, often also referred to as “general stakeholders”. There are also “operational stakeholders”, often referred to as “local” and, among them, there are the so-called “hosts”, i.e., representatives of local stakeholders. They are located in the area concerned by a geographically small project. Residents, landowners or NGOs are examples of such hosts [
22]. Local stakeholders are included in the group of the so-called “operational stakeholders”, influencing and being involved in the current operations or short-term activities of the company. According to the concept of building value in a multi-criteria way, it is believed that, in order for the enterprise to effectively build its market value, it must operate in parallel in the tangible and intangible area, providing this value also for all the stakeholders, both general and local.
The above algorithm for creating and implementing the strategy focuses strongly on the stakeholders because they directly or indirectly create the organization and allow it to operate effectively. Therefore, it is extremely important to correctly identify the individual stakeholder groups and properly determine the way they are involved, which will be a direct response of the company to the level of their impact and interest in the organization. Conducting effective communication, implementing an effective action plan towards and/or with the stakeholders, and thus maintaining good relations with them, helps in the effective functioning of the organization, understood through the prism of the concept and goals of sustainable development. The stakeholder mapping can be considered in terms of two approaches: strategic and operational [
21,
22]. The strategic mapping refers to the identification of the general stakeholders of the enterprise, i.e., those influencing, and being involved in, the overall activities of the entity. In turn, the operational mapping is related to projects implemented by the entity, i.e., initiatives limited by the territorial area, substantive and intentional scope and a group of stakeholders involved in the implementation of a given initiative.
The AA1000SES Standard indicates the importance of defining the goal, the scope of the way the stakeholders are engaged, which should be combined with the overall strategy and activities of the organization. The process of engaging the stakeholders is presented there based on the Deming cycle (PDCA), where the next steps are: planning, preparation, implementation and action, review and improvement. The AA1000SES Standard introduces guidance and good practices for the process of engaging the general stakeholders of the enterprise. Based on the analysis, the results of which are briefly presented above, the authors must conclude that they have not yet encountered a systematizing tool or standard for mapping of the stakeholders in operational terms. Both the AA1000SES Standard and other legislative and standardization documents (such as ISO26000:2010, the European Commission’s Strategy on CSR, Vision 2050, ISO26000:2010, SA8000 or GRI Standards) describe the importance of involving the stakeholders in the activities of the organization and conducting a dialogue with them, without indicating a specific tool to building engagement with the project stakeholders (local stakeholders).
In many situations and value chains this can also be a way to obtain the so-called “social license to operate”, i.e., a consent for the implementation of a project or for the conduct of a business, subject to regulation or supervision by the authority giving this a license. The above situation occurs, among others, in the case of the mining industry and related projects. The International Council of Metals and Mining (ICMM) identifies 10 principles that can support the mining and metallurgical industries in achieving the UN’s sustainable development goals, i.e., combating the climate change and eradicating poverty and growing inequalities. One of these principles is the stakeholders’ engagement, which speaks of the need to actively involve the key stakeholders in the challenges and opportunities related to sustainable development. ICMM also points to the need to implement engagement in a transparent and open manner, through effective reporting and verification of progress and results achieved [
23].
3. Materials and Methods
As previously mentioned, there are two groups of stakeholders, strategic and operational, the demarcation of which is the result of two types of mapping. The guidelines contained in the AA1000SES Standard concern the mapping and involvement of the strategic stakeholders of the enterprise. The proposal presented by the authors concerns the second group: operational stakeholders who have a direct impact on projects implemented by enterprises and affecting the organization in a smaller area, directly related to the project implemented by the company. Due to the limitation of the area accepted for analysis, based on the specificity of the implemented project, the group of operational stakeholders can be narrowed down to representatives of local stakeholders, the so-called “hosts”. The solution proposed by the authors concerns this narrow group of study subjects.
Persons responsible for engaging the stakeholders in the project should identify and map the stakeholder groups associated with the project and then review and, where appropriate, verify the mapping during the project. Therefore, it is a continuous process during the project. In this regard, the guidance of the AA1000SES Standard can be used, suggesting the involvement of the stakeholders at the following stages: 1. Stakeholder profiling, 2. Stakeholder mapping, 3. Review and verification [
24]. The authors note that the mapping method presented in the Standard has a high level of generality, without proposing a detailed algorithm of actions or tools to be used. It also has no indications of a quantitative nature, of the nature of calculations, or at least of a computational or indicative nature. Therefore, the authors propose to develop the staged system proposed in the Standard, to elaborate it in more detail and to adapt the tools to the needs of engaging stakeholders in operational terms, especially in relation to local stakeholders.
Stakeholder mapping algorithms, similar in their assumption, were presented in a study prepared by consulting company Deloitte, described in the article by R. Ogrodnik and J. Mieszaniec. The first of these documents presents a tool for mapping stakeholders and defining a dialogue formula. It has 7 steps: (1) Selecting an industry, (2) Conducting a survey with a customized set of questions, (3) Subjective assessment of influence and interest of stakeholders, (4) Generating a stakeholder map, (5) Determining levels of engagement with stakeholders, (6) Defining dialogue objectives, (7) Determining optimal forms of dialogue [
25]. Of particular note is the fact that this study does not provide a list of questions that can be used. This is probably related to the commercial nature of the organization publishing the solution. The next significant observation is the provision in paragraph 3 that talks about the subjective evaluation made by the company representatives. This evaluation is done with reference to previously conducted surveys, although it has been pointed out that the subjective evaluation aspect can completely change the layout of the results obtained from the surveys [
25]. The second literature example cited presents an algorithm consisting of three steps: identifying stakeholders, prioritizing selected stakeholders, and determining the relationship between stakeholders and the company [
26]. It is important to note in this material that despite the algorithmic approach to the entire process, many choices are made through subjective selection. In steps 2 and 3 it is also recommended to assign a numerical rating, but it is not indicated how to do this, so one can conclude that again one should be guided by experience [
26]. The three literature examples cited above were selected because of their wide availability (all three examples), accessibility in Polish (examples 2 and 3), and presentation of good practices (example 1). However, it should be noted that all the material and information available in the literature that talks about establishing a dialogue with stakeholders or about stakeholder mapping directly, refers to the entire enterprise and strategic stakeholders. This paper addresses and proposes a solution to operational stakeholder mapping, by design.
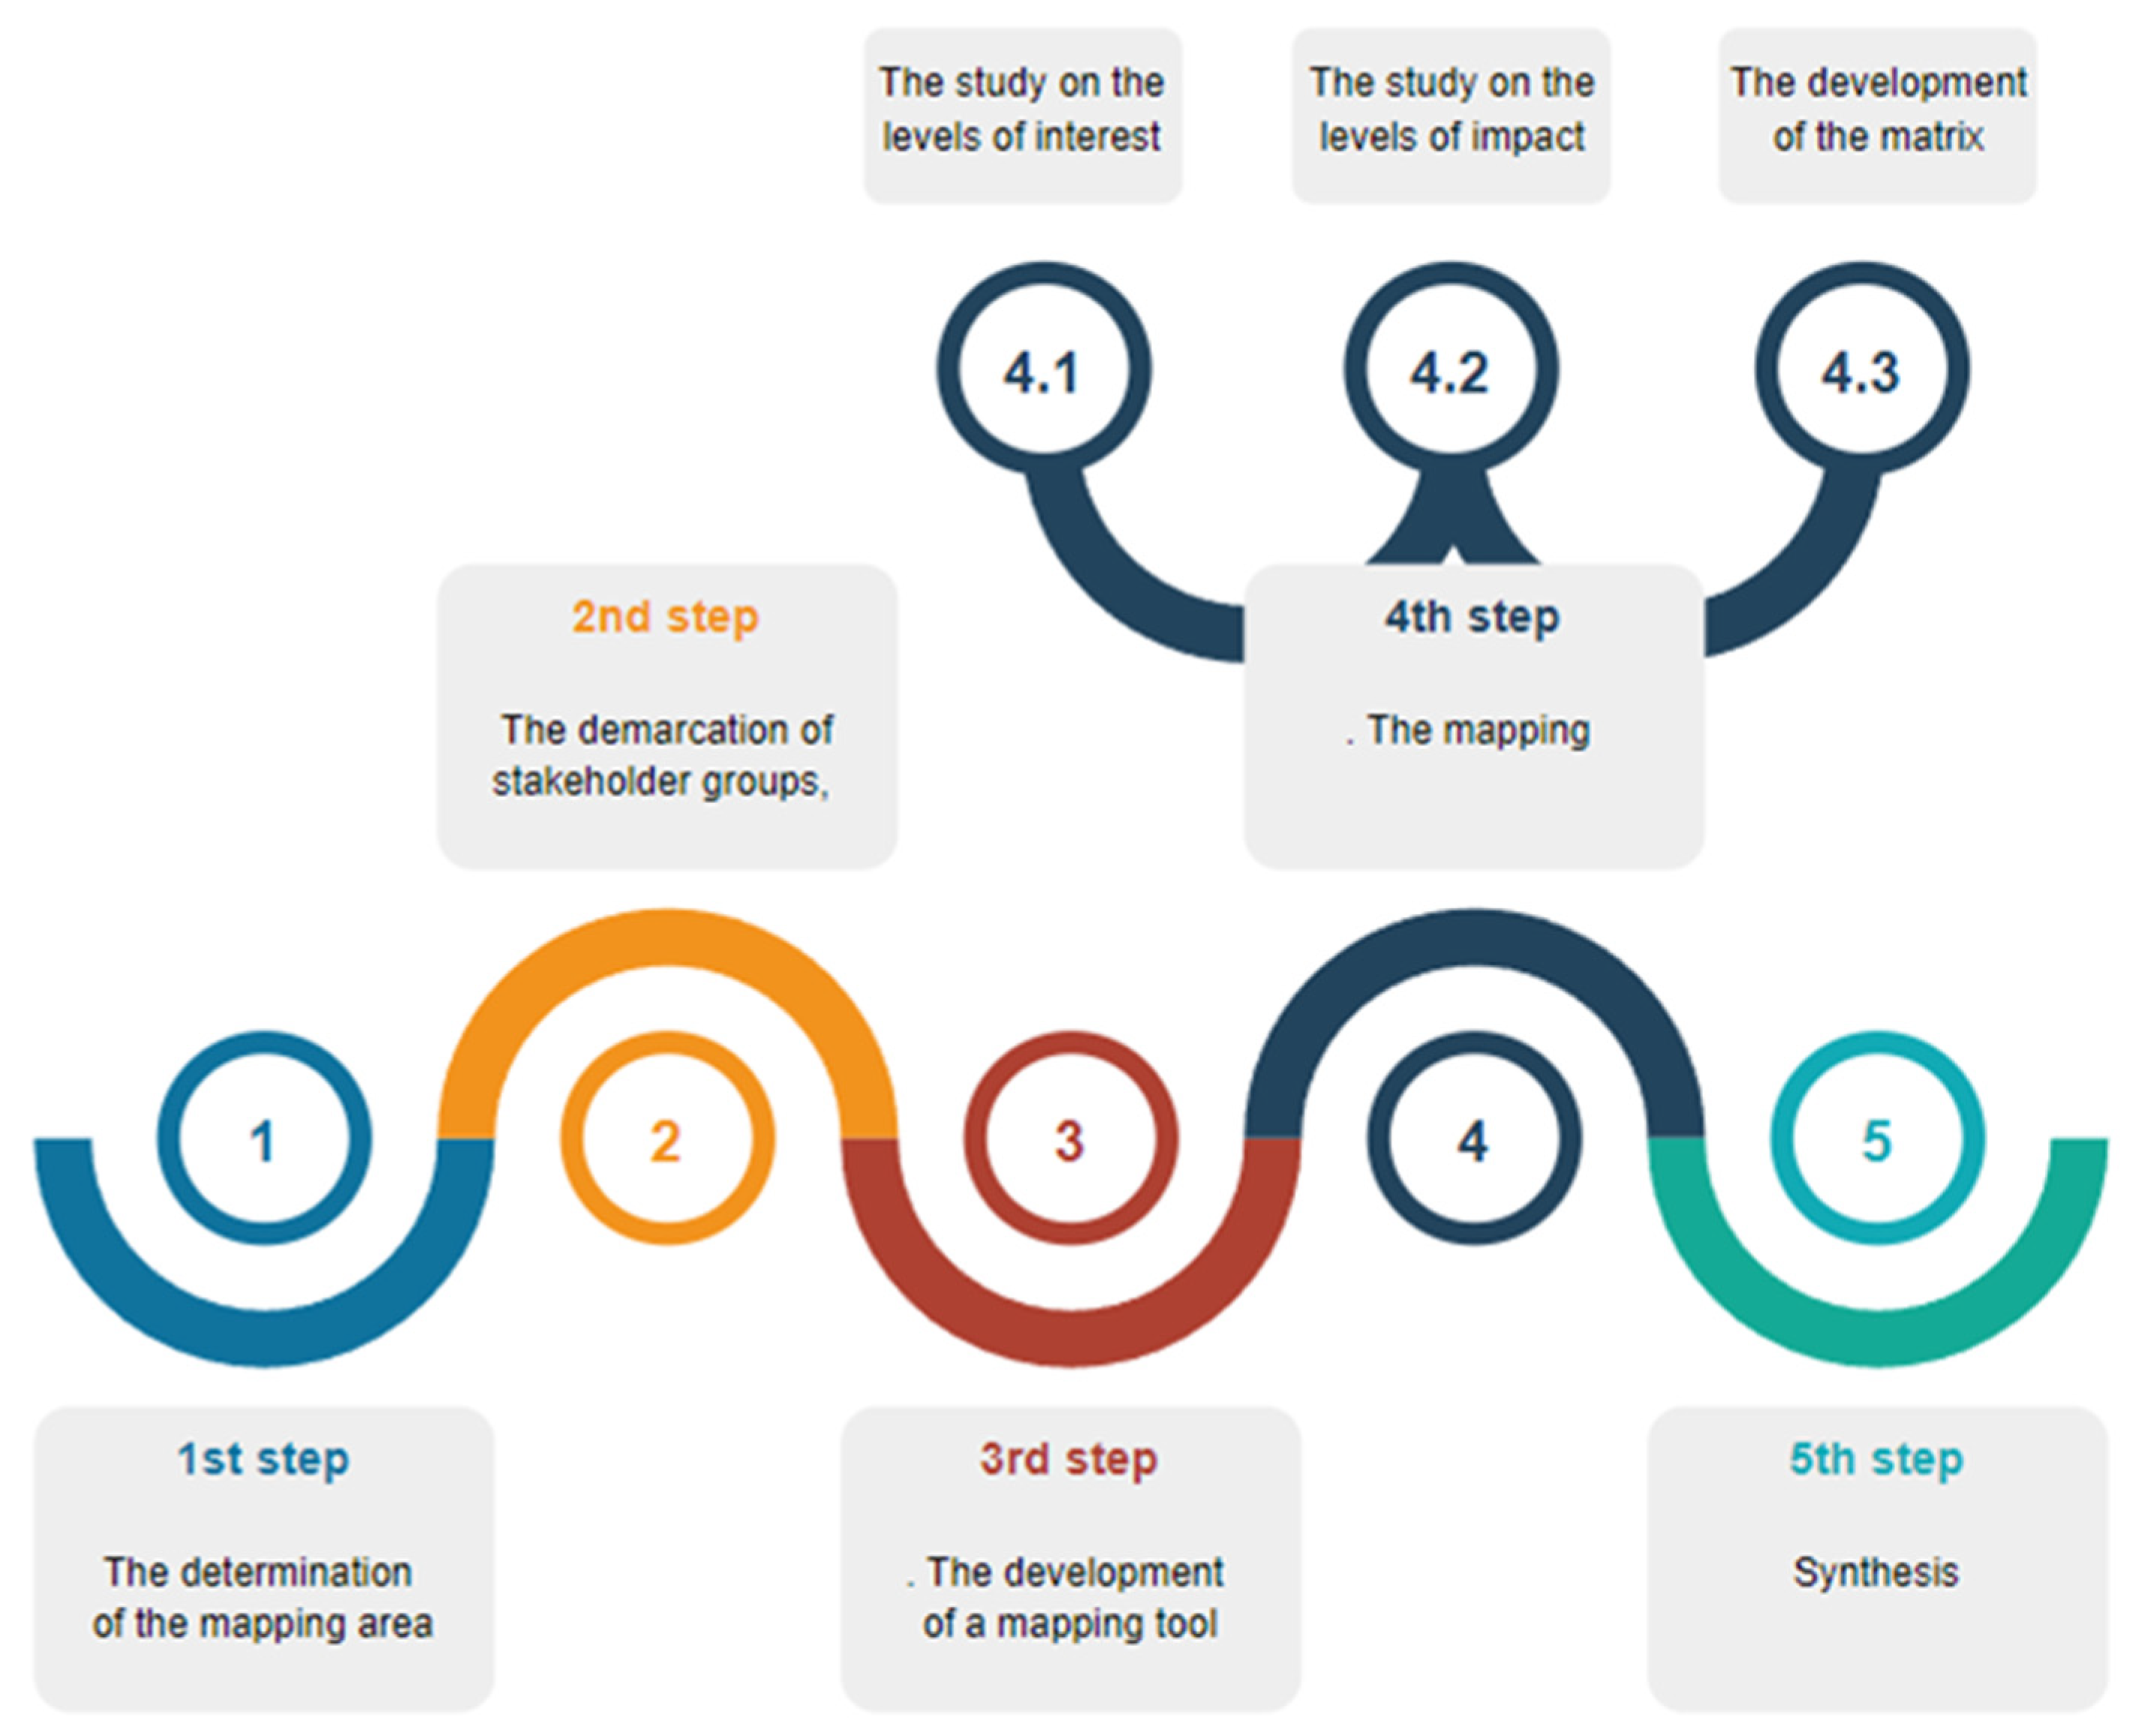
Figure 1 presents the proprietary algorithm concerning the second stage of the above stakeholder engagement cycle, i.e., the stakeholder mapping stage which, at the same time, serves as a guide to this process. Step 1 concerns the determination of the mapping area, i.e., the demarcation of the project area on which the research will be conducted. Step 2 involves the demarcation of the stakeholder groups in the study area. Then, in Step 3, it is proposed to build a tool thanks to which the mapping will be carried out in a standard way, ensuring repeatability of activities and the result of which will allow for easier definition of ways of engaging the stakeholders. Step 4 consists in assigning the levels of impact and interest to the stakeholder groups, where initially the level of interest and impact of the stakeholders should be determined and then, on this basis, a matrix should be built presenting the both sets of this information, thanks to which the level of involvement of individual groups will be known. The last, fifth step of the proposed algorithm is to summarize the study and draw conclusions in order to take effective engaging actions.
3.1. Determination of the Mapping Area
The determination of the mapping area is strictly dependent on the project for which the mapping is carried out. The basic, strict, area is the area of the project’s functioning along with the so-called “safety cushion area” understood as an area surrounding the site of the project, the radius of which should range from a few to several kilometers in the case of local projects [
27]. The best solution is to mark the area of the local project on the map and then draw a safety area with a given radius. The whole area is then accepted for analysis.
3.2. Identification of Stakeholder Groups
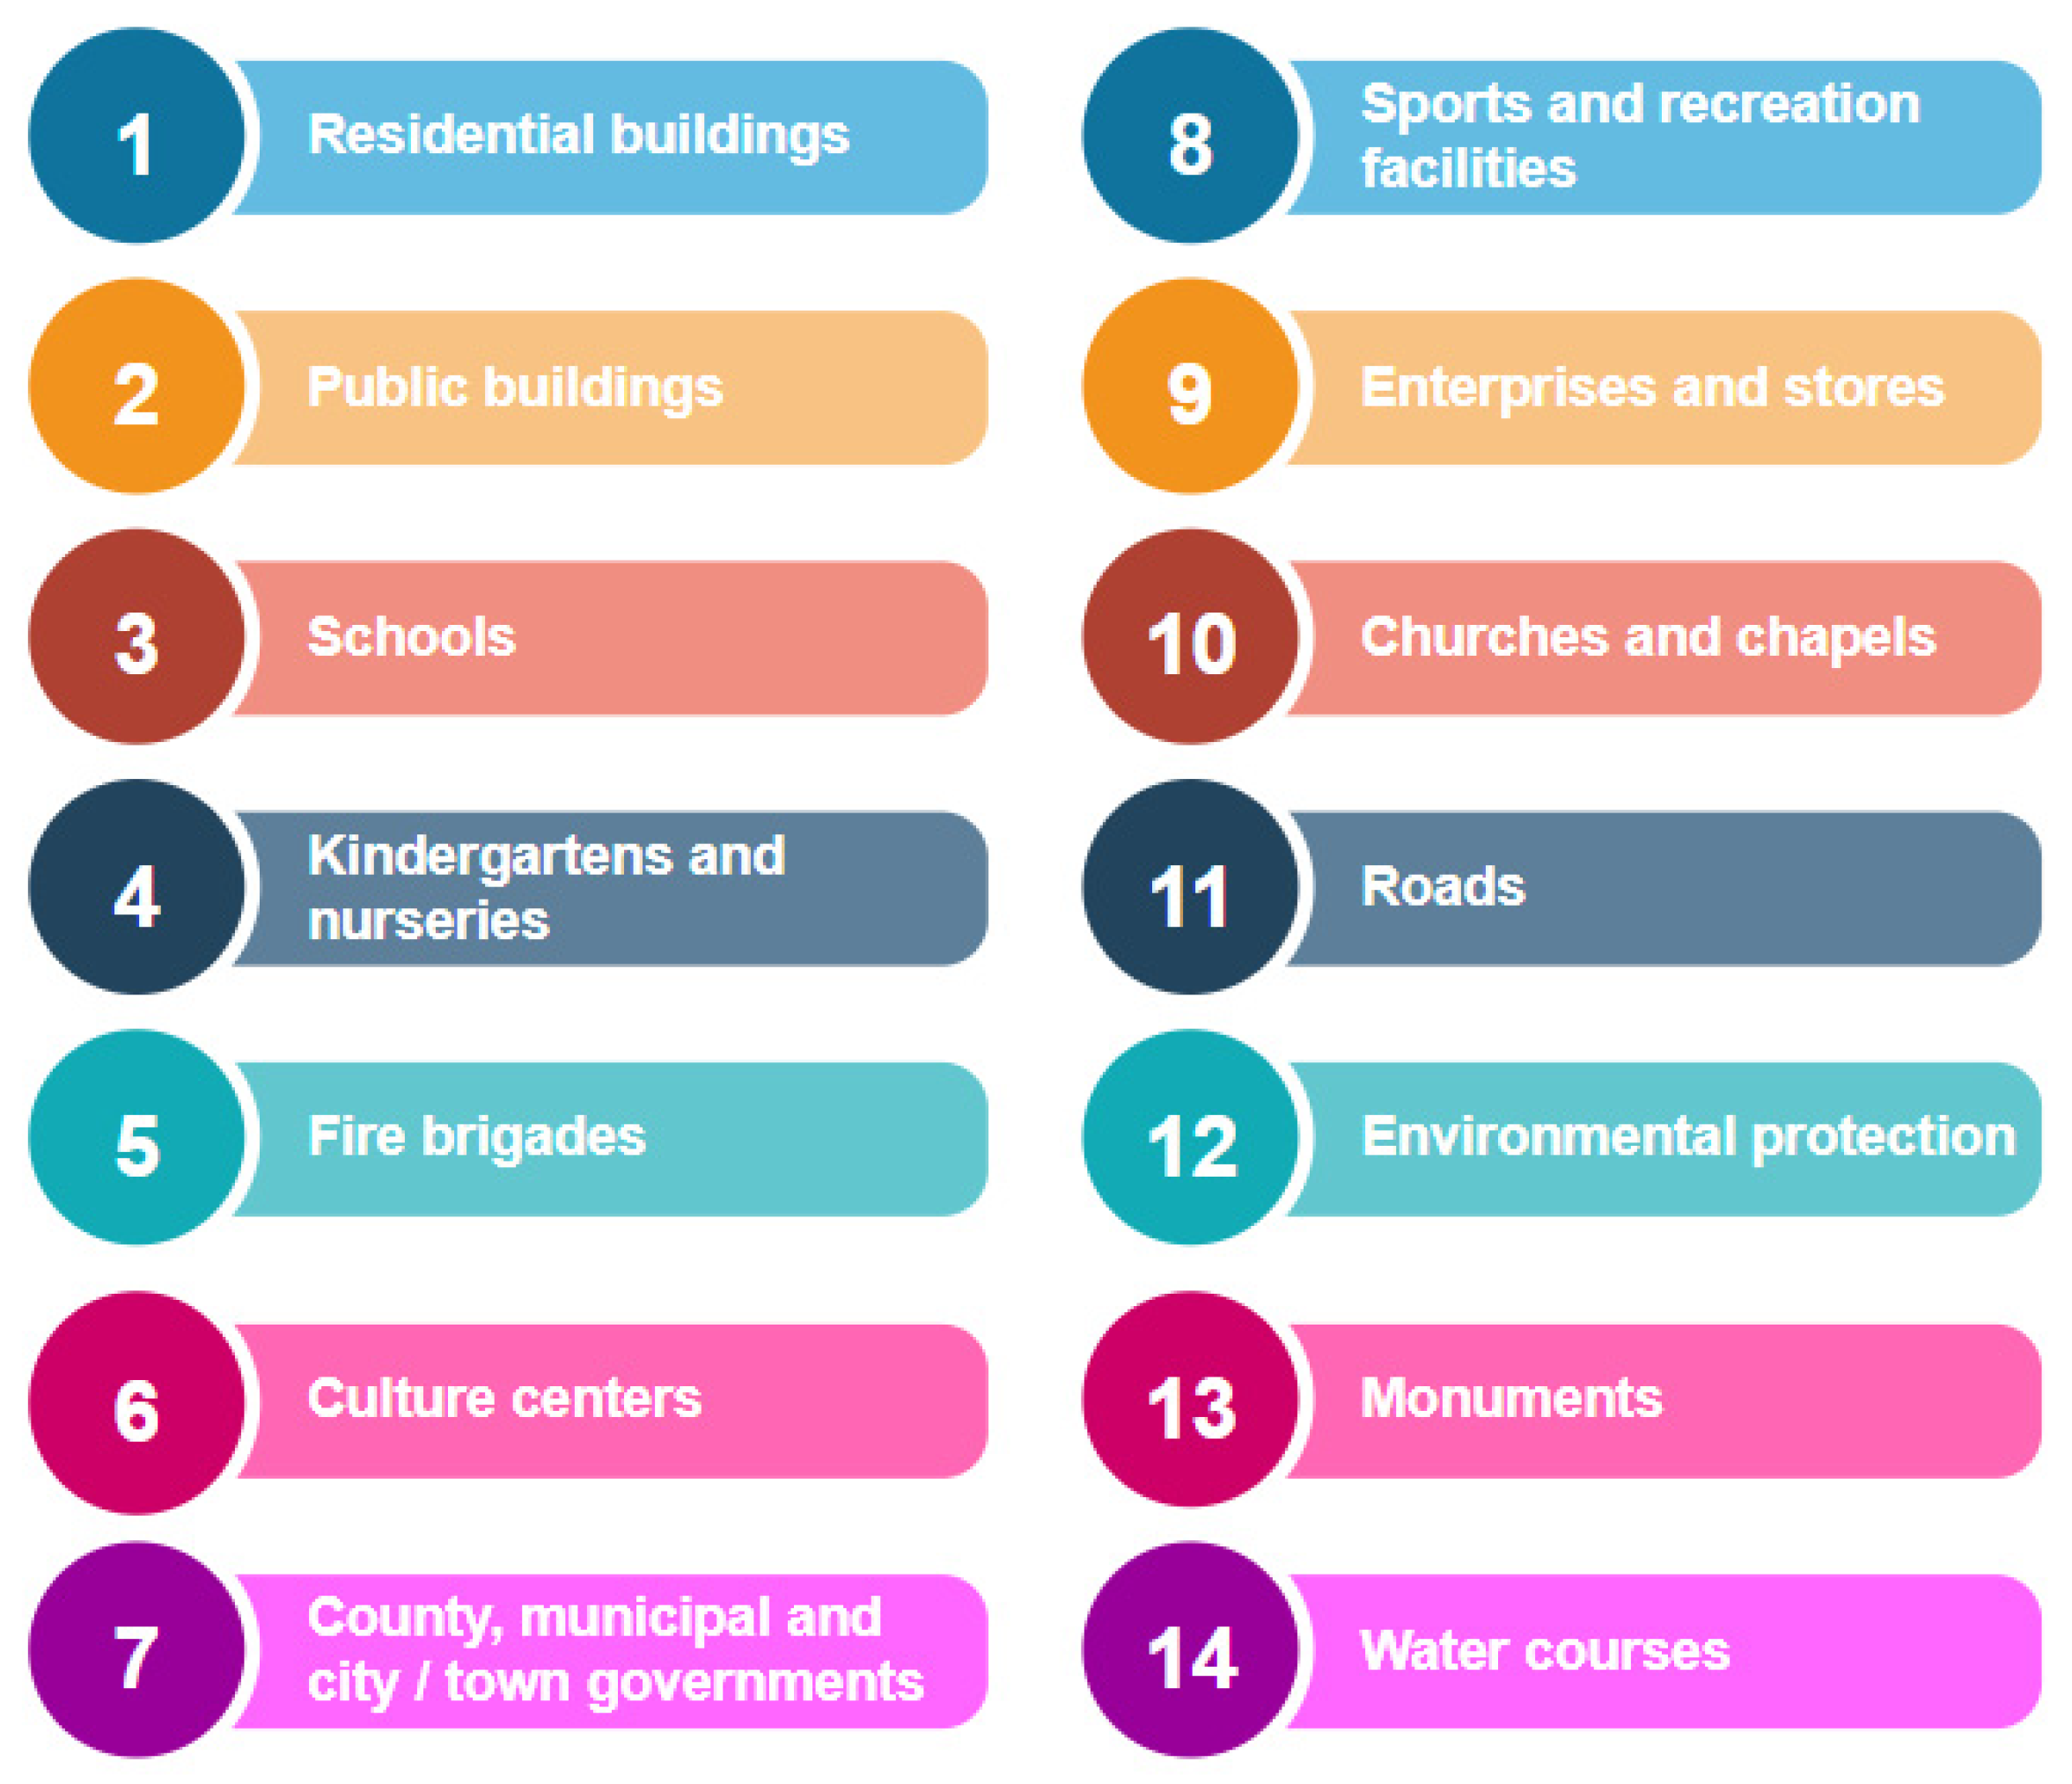
Within the entire plotted area, stakeholder groups are identified. This action should start with the identification of the types of objects occurring in the area and be based on existing documents, such as, for example: the stakeholder groups identified in the overall strategy of the organization (i.e., the strategic stakeholders), the local land-use plan, or reports (e.g., on the organization’s impact on the environment). The authors also propose to use their proposed list of standard objects (
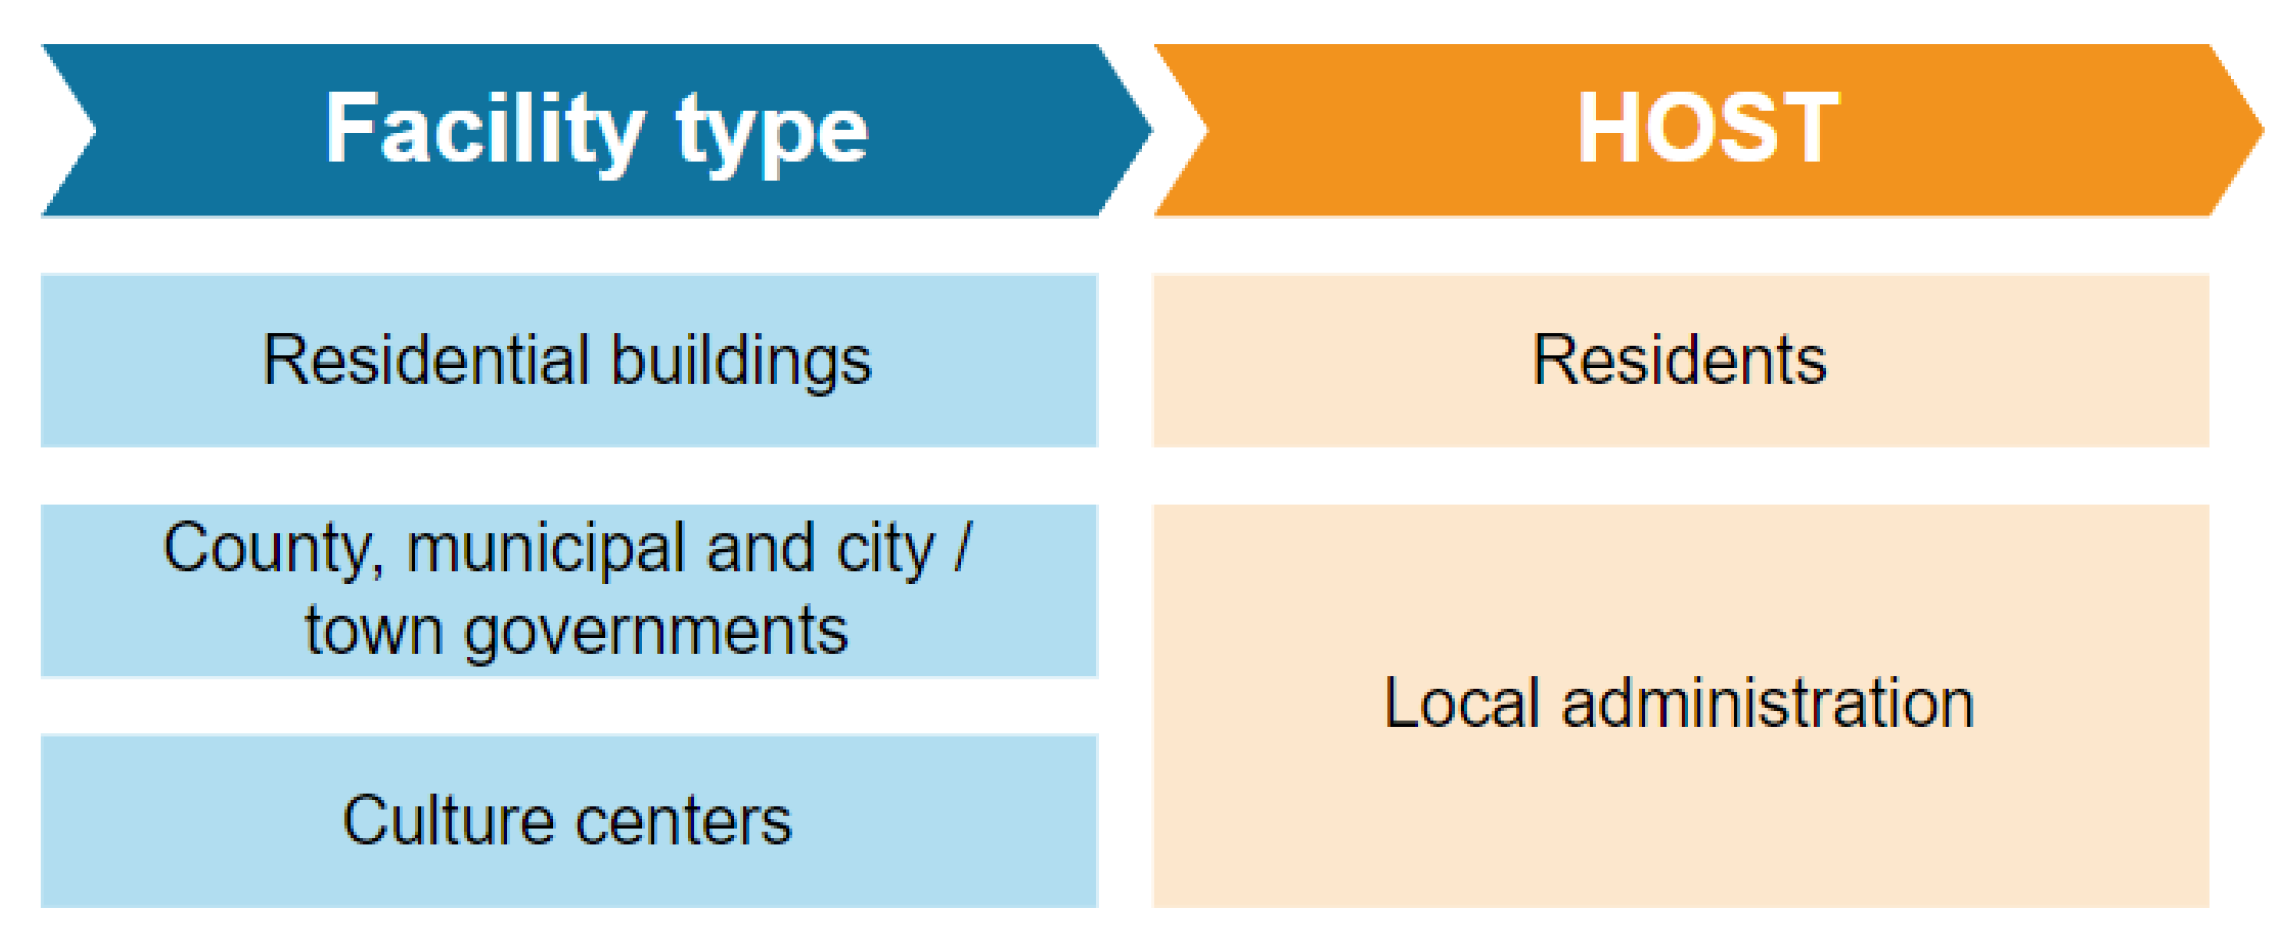
Figure 2), which is the result of analyses carried out as part of the study on the accumulation of objects in a specific area of operation of one of the leading mining companies in Poland, ordered by this company. The objects in question were identified based on information on the generic qualification used by the Polish Central Statistical Office, which is also consistent with the tax systematics of the European Statistical Office. It is also reflected in the Geoportal system (the portal belonging to the Central Office of Geodesy and Cartography, presenting the most important map resources at the central, county and municipal levels). In some cases, the managers, owners or administrators of individual facilities have been recognized as local stakeholders. This applied to public buildings. Creating a list of objects occurring in the area concerned will enable identification of the individual groups of local stakeholders, i.e., hosts, by assigning individual types of objects to the stakeholder groups. The original, standardizing fit is shown in
Figure 3.
3.3. The Development of the Mapping Tool
The matrix/table (created using any software) is a universal tool proposed by the authors as necessary in the mapping process, which, in their opinion, can be adapted by any organization to its own needs and to the specificity of the project. However, it is important that this table has appropriate headings that will be standardized and will allow for consistent compilation. As part of the tool, the authors propose to include basic information in the header part—the project name, main location of the project, coverage (the basic area expressed in square kilometers or hectares)—and, in the appropriate part, the following items: the name of the town, the object type, the host, the accumulation in the area, the representative of the stakeholders (personal data, telephone, e-mail, address), description, comments. An example of the header part is presented in
Table 1.
The next step is to feed data to the table. In the era of the Internet, obtaining the aforementioned information is usually not a problem and this can be done in whole or in part based on publicly available information posted, for example, on websites of the analyzed company or local media, in social networks of both the analyzed enterprise and local communities or in media or local or thematic Internet forums, where issues related to the company under consideration could have been discussed. In the event of an information shortage, it should be determined whether this data is critical for the result in terms of the overall study and, if necessary, field research should be conducted, e.g., through direct conversations with employees of a municipal office, counting objects, engaging in dialogue with owners or opinion leaders in this area.
3.4. The Mapping
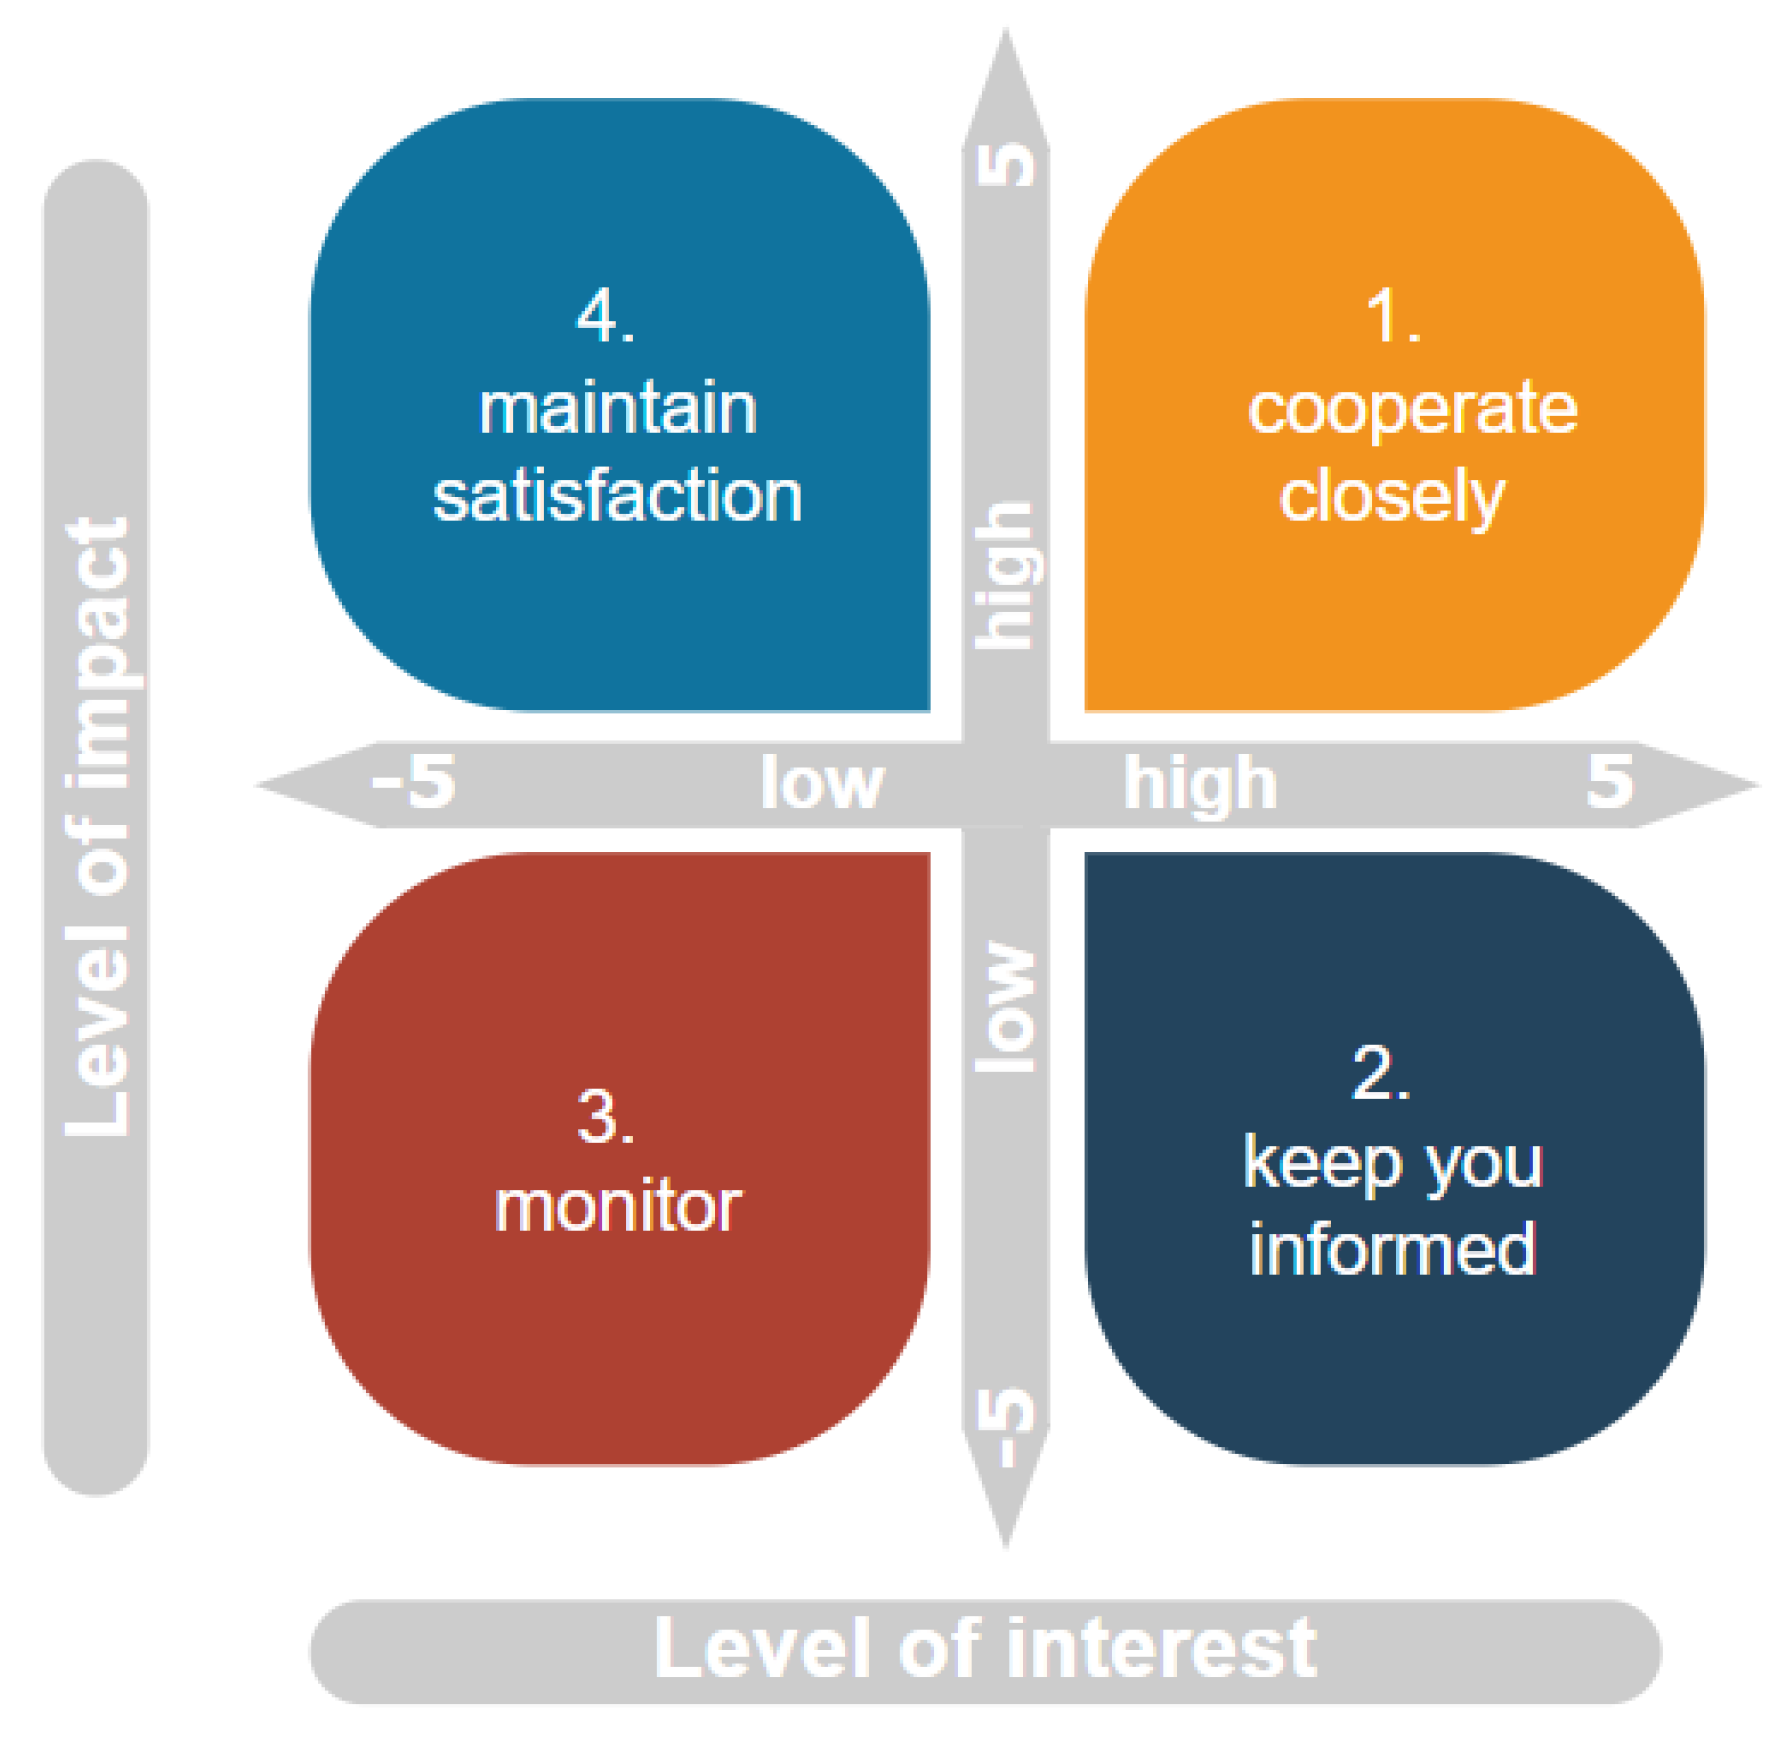
The study requires determination of the level of interest and impact of the stakeholders and, then, compilation of a summary to get information on how to engage the stakeholders. The authors propose to use the matrix developed by G. Johnson and K. Scholes (
Figure 4), which divides stakeholders into four groups [
28]:
- -
key stakeholders who are very interested in the situation in the company and have a very large impact on it;
- -
stakeholders who are very interested in the situation in the company but have little influence on it;
- -
stakeholders who are not interested in the situation of the enterprise and have minimal influence on it;
- -
stakeholders who have a very large influence on the company but are not interested in its situation.
The G. Johnson’s and K. Scholes’s matrix has a scale ranging from −5 to +5 on both axes showing the level of interest and the level of impact, respectively, where −5 means no impact or interest of any kind and +5 means a high level of impact or interest.
3.4.1. The Examination of the Level of Interest
Stakeholders’ views can also be analyzed based on publicly available information: protests, letters (open or addressed to organizations), media communications (in traditional media and in social networks) and their own posts on websites and forums. According to the authors’ proposal, the effect of such an analysis should be a table in which a quantitative number of negative, neutral and positive reactions for each of the stakeholder groups is marked. This is followed by calculations that aggregate all the information for each stakeholder group (Formula (1)) and for all the groups (Formula (2)):
Mi—The number of mentions for stakeholder groups
i—The next stakeholder group
P—The number of positive mentions
N—The number of neutral mentions
U—The number of negative mentions
M—The total number of mentions
Next, the share of the information category in relation to the total information for a given stakeholder group is calculated (Formulas (3)–(5)):
pPi—% of positive mentions among the stakeholder group
i—The next stakeholder group
pNi—% of neutral mentions among the stakeholder group
i—The next stakeholder group.
pUi—% of negative mentions among the stakeholder group
i—The next stakeholder group.
Subsequently, the conversion is made according to Formula (6) on a scale from −5 to +5, according to the key: −5—negative, 0—neutral, +5—positive.
Zi—The level of interest among the stakeholder group
i—The next stakeholder group
In this way, a numerical view of the level of interest for each of the stakeholder groups is obtained, and distributed on a scale from −5 to +5, which was used due to the resulting use in the G. Johnson’s and K. Scholes’s matrix.
3.4.2. The Study on the Level of Impact
Analyzing of the level of impact of the individual stakeholder groups can be done indirectly, based on data obtained as a result of the competition benchmarking process, or directly, based on surveys or meetings with the stakeholders. A combined solution using the both methods is also possible.
The process of benchmarking aimed to determine the level of impact of the stakeholders, in accordance with the author’s proposal, can be divided into four steps:
- -
Selection of organizations competing with the organization carrying out the project;
- -
Analysis of the demarcation of the stakeholder groups by individual organizations, their unification and identification (this activity can be carried out in a tabular form);
- -
Assigning weights on a five-point scale, which allows for standardized consistent further calculations, and, at this stage, allows for the unification of different scales used in reports and of information provided by different organizations. The scale regarding the level of impact of the stakeholders on the company is most often chosen in companies arbitrarily. Therefore, there are scales in the range from −5 to 5, from 0 to 10, from 1 to 5 and others. The proposal to unify the scale in the range of 1–5 that identifies the following categories: 1—no impact, 2—low impact, 3—moderate impact, 4—strong impact, 5—very strong impact. To replace the existing scale with a five-degree scale, appropriate conversions should be made. In the first step, one should specify the number of degrees on the existing scale, e.g., there will be 11 degrees on the scale of −5 to 5, and 5 degrees on the scale from 0 to 4. The value for the new, standardized, scale is then calculated in accordance with Formula (7):
G—The value of the weight after the standardization (5-step scale)
j—The next value of the weight for the company or for the stakeholder group
g—The existing value of the weight
l—The number of steps in the existing scale
L—The number of steps after the standardization, constant L = 5
In the next step, the rounding to integers is made.
- -
Carrying out calculations for their own organization, in strategic terms, using Formula (8) in which the set of analyzed organizations also includes their own organization:
Wi—The level of impact of the stakeholder group
Wp—The level of impact of the stakeholder group for all the studied organizations
O—The number of all the studied organizations
i—The next stakeholder group
Then, groups of the local stakeholders identified in the current project should be selected for further analysis. This is how the level of impact of the stakeholders on the enterprise is calculated, which serves as an input to the G. Johnson and K. Scholes matrix.
3.4.3. The Development of the Matrix
The figures obtained based on the activities proposed in
Section 3.4.2 and
3.4.3, thanks to the use of the scale in the range from −5 to 5, will allow the relevant stakeholder groups to be placed in the appropriate quarter of the G. Johnson’s and K. Scholes’s matrix.
3.5. Synthesis
Based on the G. Johnson and K. Scholes matrix, which, as previously mentioned, divides the stakeholders into the four groups in terms of their levels of impact and interest (
Figure 3), knowledge is obtained about the effective approach to the individual stakeholder groups. On this basis, it is possible to create a plan for the involvement of the individual groups, depending on their positions in the matrix. The following groups are distinguished in the matrix.
Based on the G. Johnson and K. Scholes matrix which, as previously mentioned, divides the stakeholders into four groups in terms of their levels of impact and interest (
Figure 3), knowledge is obtained about the effective approach to the individual stakeholder groups. On this basis, it is possible to create a plan for the involvement of the individual groups, depending on their positions in the matrix. The following groups are distinguished in the matrix:
- -
Group 1—high impact and high interest: These are the key stakeholders with whom close cooperation should be established because, most often, these stakeholders are the source of the greatest risk to the project. Appropriate communication and close cooperation allow us to minimize this risk or even turn it into an “asset”.
- -
Group 2—low impact and high interest: These stakeholders who should be kept informed about the activities undertaken because the result of the project itself is relatively neutral. This group does not cause problems but, due to their high impact, their satisfaction should be a concern. It is also possible to use relations with this group to manage or build rapport with other groups.
- -
Group 3—low impact and low interest: These stakeholders should be informed about the progress of the project and monitored for possible changes in their attitudes.
- -
Group 4—high impact and low interest: these stakeholders should be kept satisfied because they can provide information about the final stage of the project.
Based on this information, it will be easier and more effective to determine the types of activities and select channels of communication with the individual stakeholders.
4. Implementation of Authors’ Method on the Example LW Bogdanka
The authors implemented the proposed solution in 2020 on the example of the newly launched project of a company known as Lubelski Węgiel Bogdanka S.A. (“LW Bogdanka”), operating in Poland in the fields of extraction, enrichment and sales of hard coal. The company is listed on the Warsaw Stock Exchange and is part of the ENEA Group (one of the leaders of the Polish energy market), which obliges it, among other things, in accordance with the EU’s Directive 2014/95/EU, to report its non-financial data annually, including information concerning sustainable development and CSR, as part of its business activity. In 2019, the company obtained a concession for the extraction of hard coal from deposits K-6 and K-7 located in the Cyców mining area, which resources are estimated at 66 million tons. In the vicinity of the mine it is also planned to build a commercial power plant to be included in the Polish energy system, powered by syngas obtained from extracted coal, and to install a photovoltaic farm with a capacity of up to about 30 MW, tasked to power the mine and, thus, reduce the cost of coal production [
29].
Launching a new project, especially in the mining industry, which is currently struggling with problems due to the phasing out of hard coal-based energy in Poland, is a considerable challenge for various reasons. One of them is the need to obtain the social license to operate as mentioned above. This requires involvement of local stakeholders in the launched project, mainly due to their huge impact on the operation of the proposed undertaking.
The process of implementing the proposed tool is presented in subsequent subsections, in terms methodologically analogous to the algorithm of the author’s research presented in
Section 2.
4.1. The Determination of the Mapping Area for the Cyców LW Bogdanka Mining Area
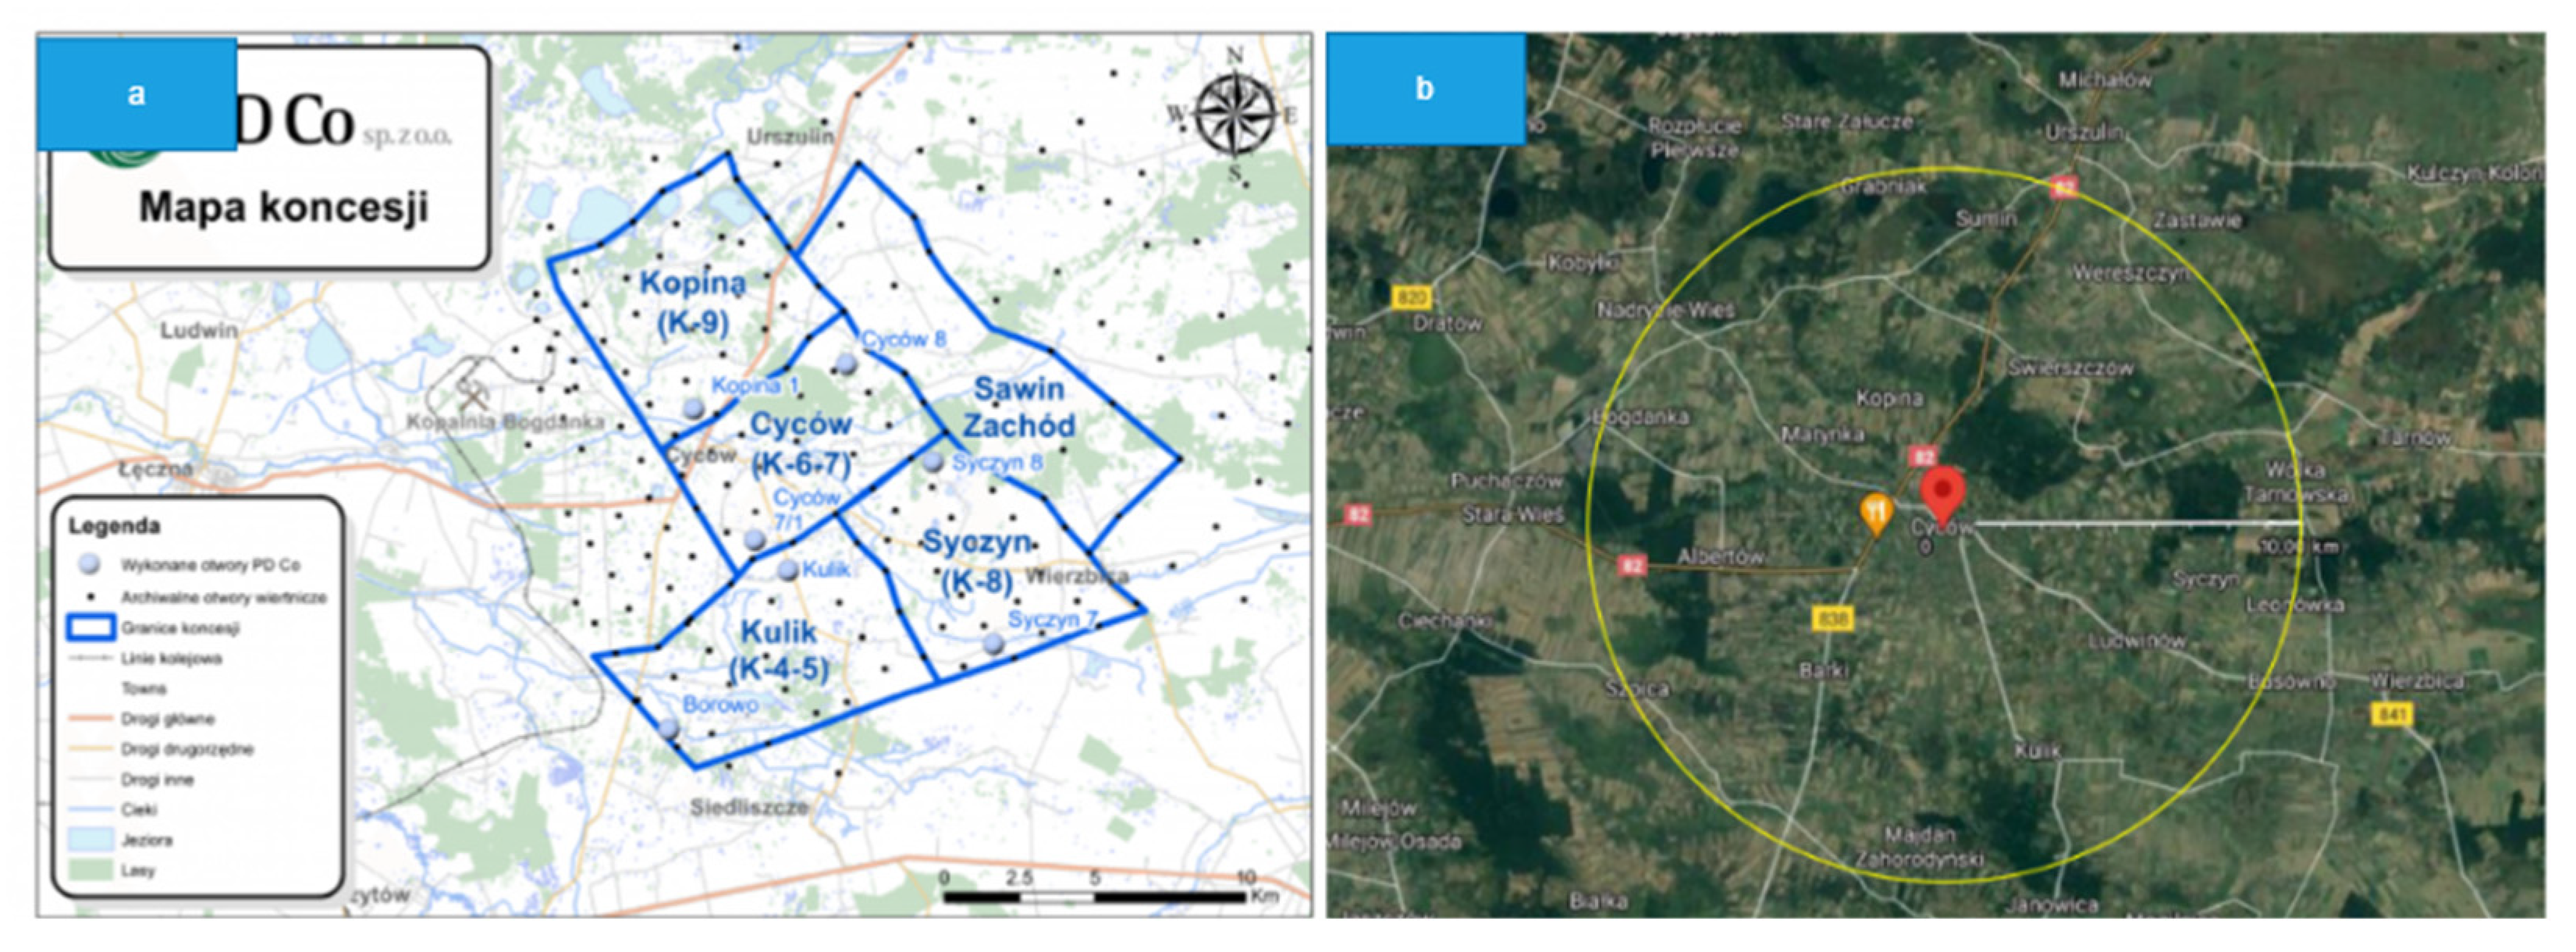
The analyzed area is located within the boundaries of the Central Coal Basin, in the Lublin Coal District. The area borders with the Puchaczów V mining area and with the K-9 deposit on the north and with the K-4, K-5 and K-8 deposits on the south. This location is shown in
Figure 5a. The administratively analyzed area is located in Lublin Province, in the Łęczyński County (the Cyców and Puchaczów municipalities) and in Chełm County (Wierzbica and Siedliszcze municipalities).
According to the methodological assumptions, an area with a radius of 10 km from its center was mapped (
Figure 5b). Therefore, the whole map covers 10 municipalities and 51 localities.
4.2. The Demarcation of the Local Stakeholder Groups for the Cyców LW Bogdanka Mining Area
The demarcation of the groups of objects and, then, the assignment of hosts was done based on the “Consolidated Report of LW Bogdanka for 2018” [
30], the “Report on the environmental impact of hard coal exploitation by LW Bogdanka in the planned mining area” [
31], the “Local Land Use Plan” [
32] and the stakeholder matrix developed by the authors for mining enterprises [
33]. On this basis, a list of local stakeholders for the Cyców LW Bogdanka mining area was drawn up, which is presented in
Table 2.
4.3. The Development of a Tool for the Mapping of the Local Stakeholders in the Cyców LW Bogdanka Mining Area
As part of the study, in accordance with the guidelines presented in
Section 3.3 of this article, a table with a quantitative listing of the individual objects was compiled. This table was prepared using an MS Excel spreadsheet. In the header part there is space for the basic information (project name, main location of the project and the extent of the main and safety cushion areas). The body of the table contains the following items: locality name, object name, object type, host, accumulation in the area, representative of the hosts (personal data, phone, e-mail, address), description, comments.
Finally, there were 167 positions in the table. Among them, 13 groups of objects were distinguished (presented in part “a” of
Table 3). Based on the analysis of the data presented in the table, eight types of hosts were identified (see part “b” of
Table 3).
4.4. The Mapping of the Local Stakeholders for the Cyców LW Bogdanka Mining Area
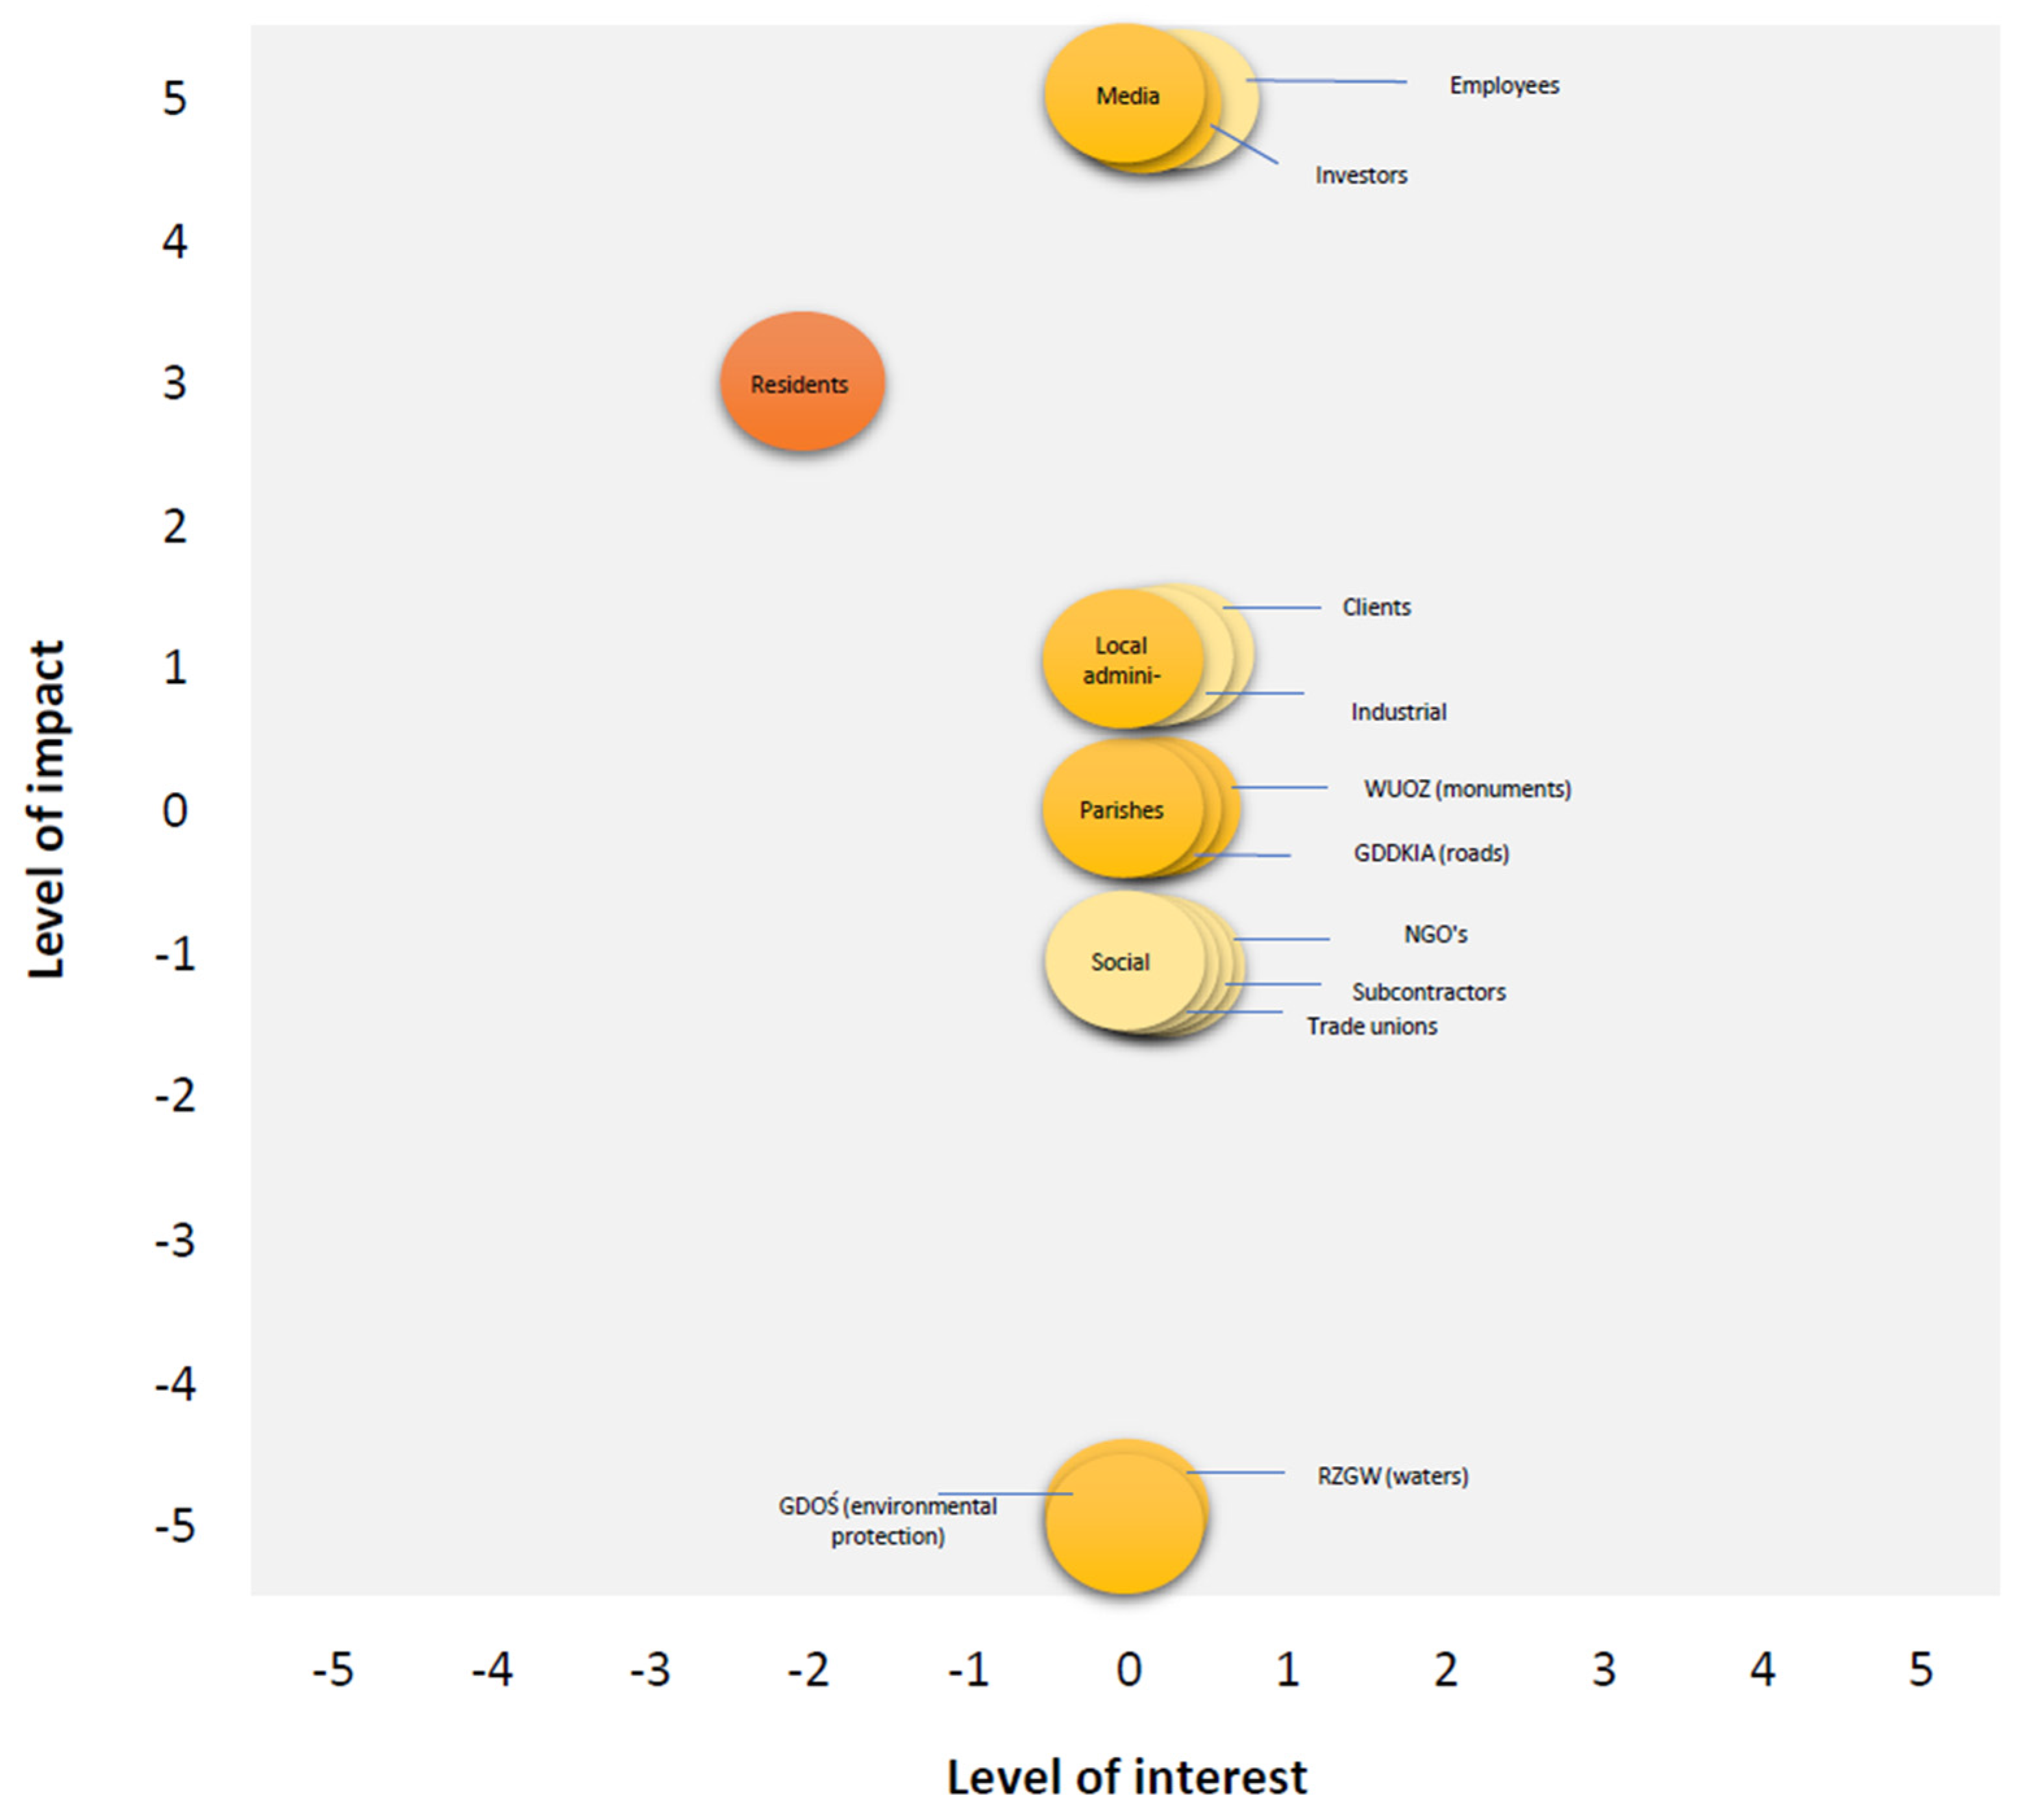
In accordance with the algorithm proposed by the authors, the G. Johnson and K. Scholes matrix was used to carry out the stakeholder mapping, having a scale in the range of −5 to +5, showing the correlation between the level of impact and interest of the individual stakeholder groups.
4.4.1. The Study on the Level of Interest of the Local Stakeholders in the Cyców LW Bogdanka Mining Area
In this part of the study, work was first undertaken on analyzing media messages available on the Internet (local and national press, web forums) and in social media (Facebook) of LW Bogdanka, related to the newly launched project. The messages identified there were divided into three types, according to the algorithm proposed by the authors: positive, neutral and negative. Then, basic calculations were carried out summing up the number of mentions for the individual stakeholder groups and the total number of mentions. The result of this analysis is presented in
Table 4.
The next step was to carry out the calculations in accordance with Formulas (3)–(5), presented in
Section 3.4.1. In this way, the percentage of the individual types of messages (% positive, % neutral, % negative) was determined and the level of interest was calculated. A summary of the results of these activities is presented in
Table 5.
4.4.2. The Study on the Level of Impact of the Local Stakeholders in the Cyców LW Bogdanka Mining Area
Analyzing the level of impact of the individual stakeholder groups began with the benchmarking of the strategic stakeholder groups indicated by Polish companies competing with LW Bogdanka, belonging to the mining and/or energy industries. This group includes: PGE Polska Grupa Energetyczna S.A., Tauron Polska Energia S.A., Jastrzębska Spółka Węglowa S.A., Polska Grupa Górnicza S.A. and KGHM Polska Miedź S.A. Next, aggregated reports and statements on non-financial information published by the aforementioned companies, concerning 2018, and data posted on the websites of the individual companies were analyzed. This period was chosen due to the time compatibility with the data contained in the Consolidated Report LW Bogdanka for 2018, which was used during the research in this project. Subsequently, based on Formula (6), calculations were carried out to determine the levels of impact of the individual stakeholder groups. The results of this analysis are presented in
Table 6.
4.4.3. The Development of the Matrix of the Local Stakeholders in the Cyców LW Bogdanka Mining Area
Based on the calculations from
Section 3.4.1 and
Section 3.4.2, i.e., the determination of the level of interest and impact of the individual local stakeholders, the G. Johnson and K. Scholes matrix was drawn up, which is presented in
Figure 6.
4.5. Conclusions and a Summary of the Study of the Local Stakeholders in the Cyców LW Bogdanka Mining Area
Based on the G. Johnson and K. Scholes matrix, the individual stakeholder groups were assigned to appropriate activities. This list is illustrated in
Table 7.
In group 1, characterized by low impact and high interest, there were as many as eight stakeholder groups: media, trade unions, investors, clients, social partners, the General Directorate for National Roads and Motorways, parishes, the Provincial Office for Monument Protection. Therefore, they are key stakeholders of the project and there should be close cooperation with them because they can become a source of risk for the project. Appropriate communication should be developed and a framework for close cooperation should be defined in order to minimize the risk and turn it into an asset.
Group 2, characterized by low impact and high interest, included industrial organizations, the Regional Water Authority and the General Directorate for Environmental Protection. These stakeholder groups should be kept informed about the activities undertaken in the project, although they are probably relatively neutral to the result of the project itself. The group does not pose a high risk to the project but, due to the high impact, the group should be kept satisfied. It is also recommended to use a positive relationship with these persons in order to effectively manage or build relationships with other groups.
Group 3, characterized by low impact and low interest, included environmental organizations and subcontractors. They should, therefore, be informed about the progress of the project and monitored for possible changes in attitudes but, at present, they do not pose a risk to the project.
Group 4, characterized by high impact and low interest, included residents, employees and local administration. These are stakeholders whose satisfaction should be sought, because they can provide information about the final stage of the project.
The indications developed based on the above table should be a bridgehead for further work on the development of methods for involving the individual groups, for example in accordance with the project management methodology.
In summary, during the study, the 169 objects located in the design area (the basic and safety cushion areas) were identified and, next, the 13 stakeholder groups and the eight host groups were demarcated, thanks to which it was possible to conduct further research. The results of the level of interest analysis showed the occurrence of 107 media messages regarding the new LW Bogdanka project.
5. Discussion
The method of mapping the stakeholders proposed by the authors takes a numerical form, which, according to the knowledge of the authors and the information cited in the initial part of the article, is a rare approach. Such methods are usually presented using algorithms but they are based on descriptive information or opinions of teams developing stakeholder maps.
The method proposed by the authors is methodologically uncomplicated, although analytically requires a lot of work in the development and application phases. The authors provide accurate lists and formulas for conducting the necessary calculations, indicate specific sources, and provide ready-made templates of tables or lists. This method guides the person who wants to carry out the mapping of stakeholders throughout the process, indicating the appropriate steps one by one. Therefore, this method can be an independent tool helpful in carrying out the process of engaging operational stakeholders in situations of project implementation and in obtaining a social license to operate. The authors have presented the practical use of the proposed solution for one of the leading mining companies in Poland and Europe.
During the research work and during the consultation of this activity, the authors saw room for improvement and further work on the proposed method, which they want to implement in their subsequent research projects.
The first aspect to be elaborated on is the need for taking into account the importance of the individual types of media messages (mentions). A system of weights or a scale should be used to refer to by which to measure the importance of the messages, which will allow for a better representation of the reach and opinion-forming impact of relevant information, and thus have an impact on the quantitative calculation. The idea of using a system of weights is justified mainly by the fact that various types of media messages are analyzed: press articles (traditional or local), posts, comments or videos on social media, interviews, information about protests, etc. It is known that each such message “costs” a different amount of energy and carries a different kind of emotions and information from the stakeholders. Also, the messages differ in reach and opinion-forming strength due to the ways they are conveyed and resources (including experts) they draw from.
In order for the mapping to be more effective and to provide reliable information on the impact and involvement of the stakeholders, the way of collecting data should also be expanded: using not only indirect information (media and benchmarking), but also direct information, i.e., data collected directly from the interested parties through surveys or face-to-face meetings. Developing a list of questions that the company will be able to use to build its own data collection tool is the next stage of this research.
This study is and will be continued as part of the doctoral thesis of one of the authors of this article, which aims to create a comprehensive stakeholder mapping method based on quantitative data, complementing qualitative data, also having a tool component, ready to be used by the enterprise to determine the initial plan for the involvement of individual stakeholder groups. The completion of this research work is planned for autumn 2022.
6. Conclusions
As presented in
Section 1 of this article, stakeholder mapping and the process of involving them are extremely important for the implementation of the ideas of sustainable development and corporate social responsibility. Correct identification of the stakeholder groups interested in, and having an impact on, a given company and, then, appropriate adjustment of the ways of communicating with, and involving these groups can offer measurable benefits to the company, such as the following:
better knowledge of the stakeholders;
effective cooperation with representatives of the individual stakeholder groups;
obtaining ready-made ideas or developing common solutions to problems;
introducing changes in non-financial reports by taking into account the voice of the stakeholders;
building a positive image of the company among the stakeholders;
improving the image of the entire industry;
obtaining a license to operate.
In the aspect of the strategic stakeholders, there are methodologies that approach the issue of mapping the stakeholders in a numerical and algorithmic way; however, the approach to the operational stakeholders is insufficiently described, hence the authors decided to create a methodology that takes into account the specificity of the approach to these stakeholders in terms of the project. Described in detail in
Section 2 of this article, this is an original algorithm consisting of five stages: 1. The determination of the mapping area, 2. The demarcation of stakeholder groups, 3. The development of a mapping tool, 4. The mapping (4.1 The study on the levels of interest, 4.2 The study on the levels of impact, 4.3 The development of the matrix), 5. Conclusions and summary. The further part of the article describes the approach to the above algorithm, indicating appropriate ways of conducting mathematical calculations and drawing information from specific sources, such as broadly defined web portals or documentation analyzed in the benchmarking process.
Section 3 presents the use of the proposed algorithm in a real project implemented in the aspect of the Cyców LW Bogdanka mining area. In the course of this study, mapped stakeholder groups were divided into four categories according to the matrix arrangement proposed by G. Johnson and K. Scholes. This indicated that the group of the key stakeholders with whom we should closely cooperate include: media, trade unions, investors, clients, social partners, the General Directorate for National Roads and Motorways, parishes and the Provincial Office for Monument Protection. Information dissemination activities (group 2) should be undertaken towards industrial organizations, the Regional Water Authority and the General Directorate for Environmental Protection. Monitoring-based communication (group 3) should be directed towards environmental organizations and subcontractors, while activities aimed at maintaining satisfaction (group 4) should be applied to employees, residents and local administration. Appropriate selection of communication methods will allow for more effective cooperation with the aforementioned stakeholders.
The implementation presented by the authors on the example of the LW Bogdanka project applied the algorithm, but attention can be drawn to the insufficient quality of the available application data (gaps in the data or a small amount of them). Hence, the authors recommend further studies to confirm the results. It should be noted, however, that the method itself, in its previous version, was also tested in another project (the project mentioned by the authors, during which a list of objects was developed) and then proved to be sufficient due to the availability of complete and representative data.
The challenges and limitations of the presented algorithm are presented in detail in
Section 5, but it should be noted that the biggest challenge is the availability and representativeness of the data. Hence, in the next step of stakeholder mapping work allowing for greater detail, the next stage of mapping should be carried out based on surveys conducted with representatives of individual stakeholder groups in order to obtain direct data and adjust the G. Johnson and K. Scholes matrix accordingly. Work on building this second iteration of the algorithm, including surveys, is currently being conducted as part of the dissertation of the author of this paper.
Nevertheless, the presented algorithm is an independent tool for mapping local stakeholders in terms of a given project undertaken by the company and can be implemented independently. It is a unique tool because it presents a stakeholder mapping method using numerical data while relying on simple and basic calculations. Such features—simplicity, accessibility, algorithmic approach and ease of implementation—foster the use of the tool in real market conditions, extending and complementing the methods already available in the literature.


