
Evaluating Outdoor Thermal Comfort Using a Mixed-Method to Improve the Environmental Quality of a University Campus


Abstract
:1. Introduction
1.1. Background of Outdoor Thermal Comfort Evaluation
1.2. Literature Review
1.3. Originality and Aims of the Study
- To study the role of objective and subjective elements in defining comfort in an urban area;
- To apply qualitative and quantitative research methods in assessing outdoor thermal comfort;
- To explore how and what extent personal factors, weather conditions, environmental conditions, and phisical features of the area can affect comfort sensation.
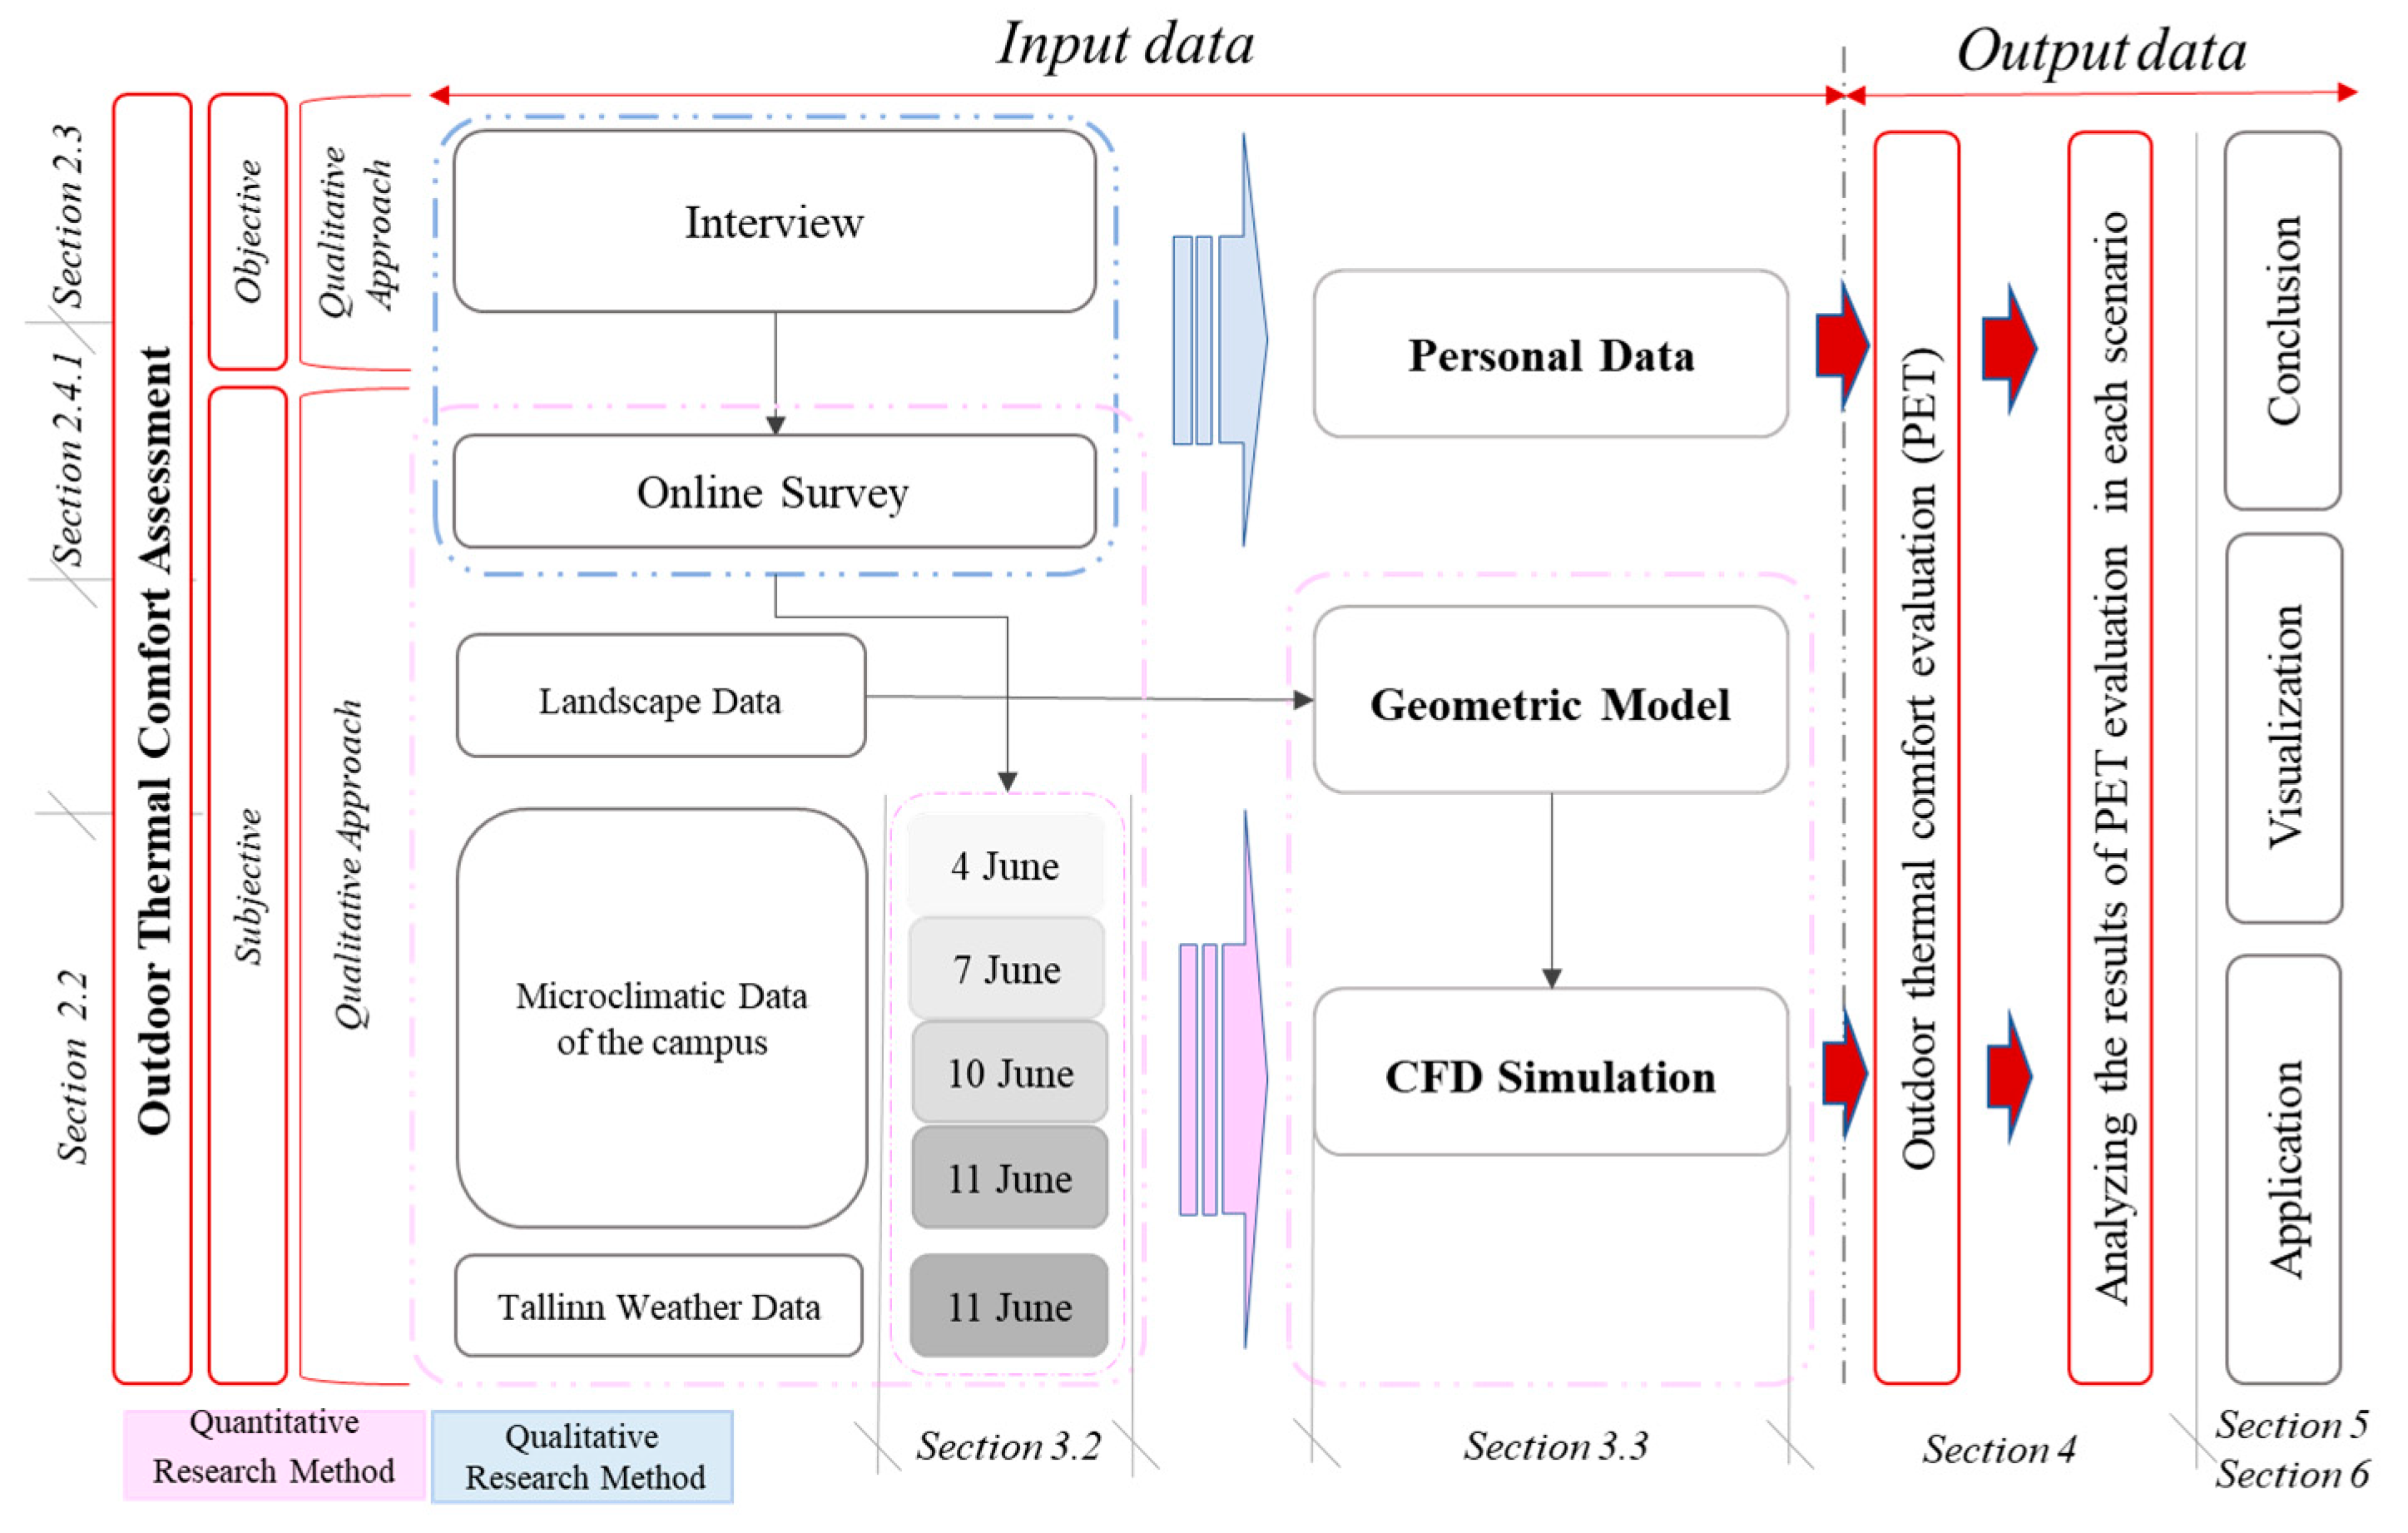
2. Methodology
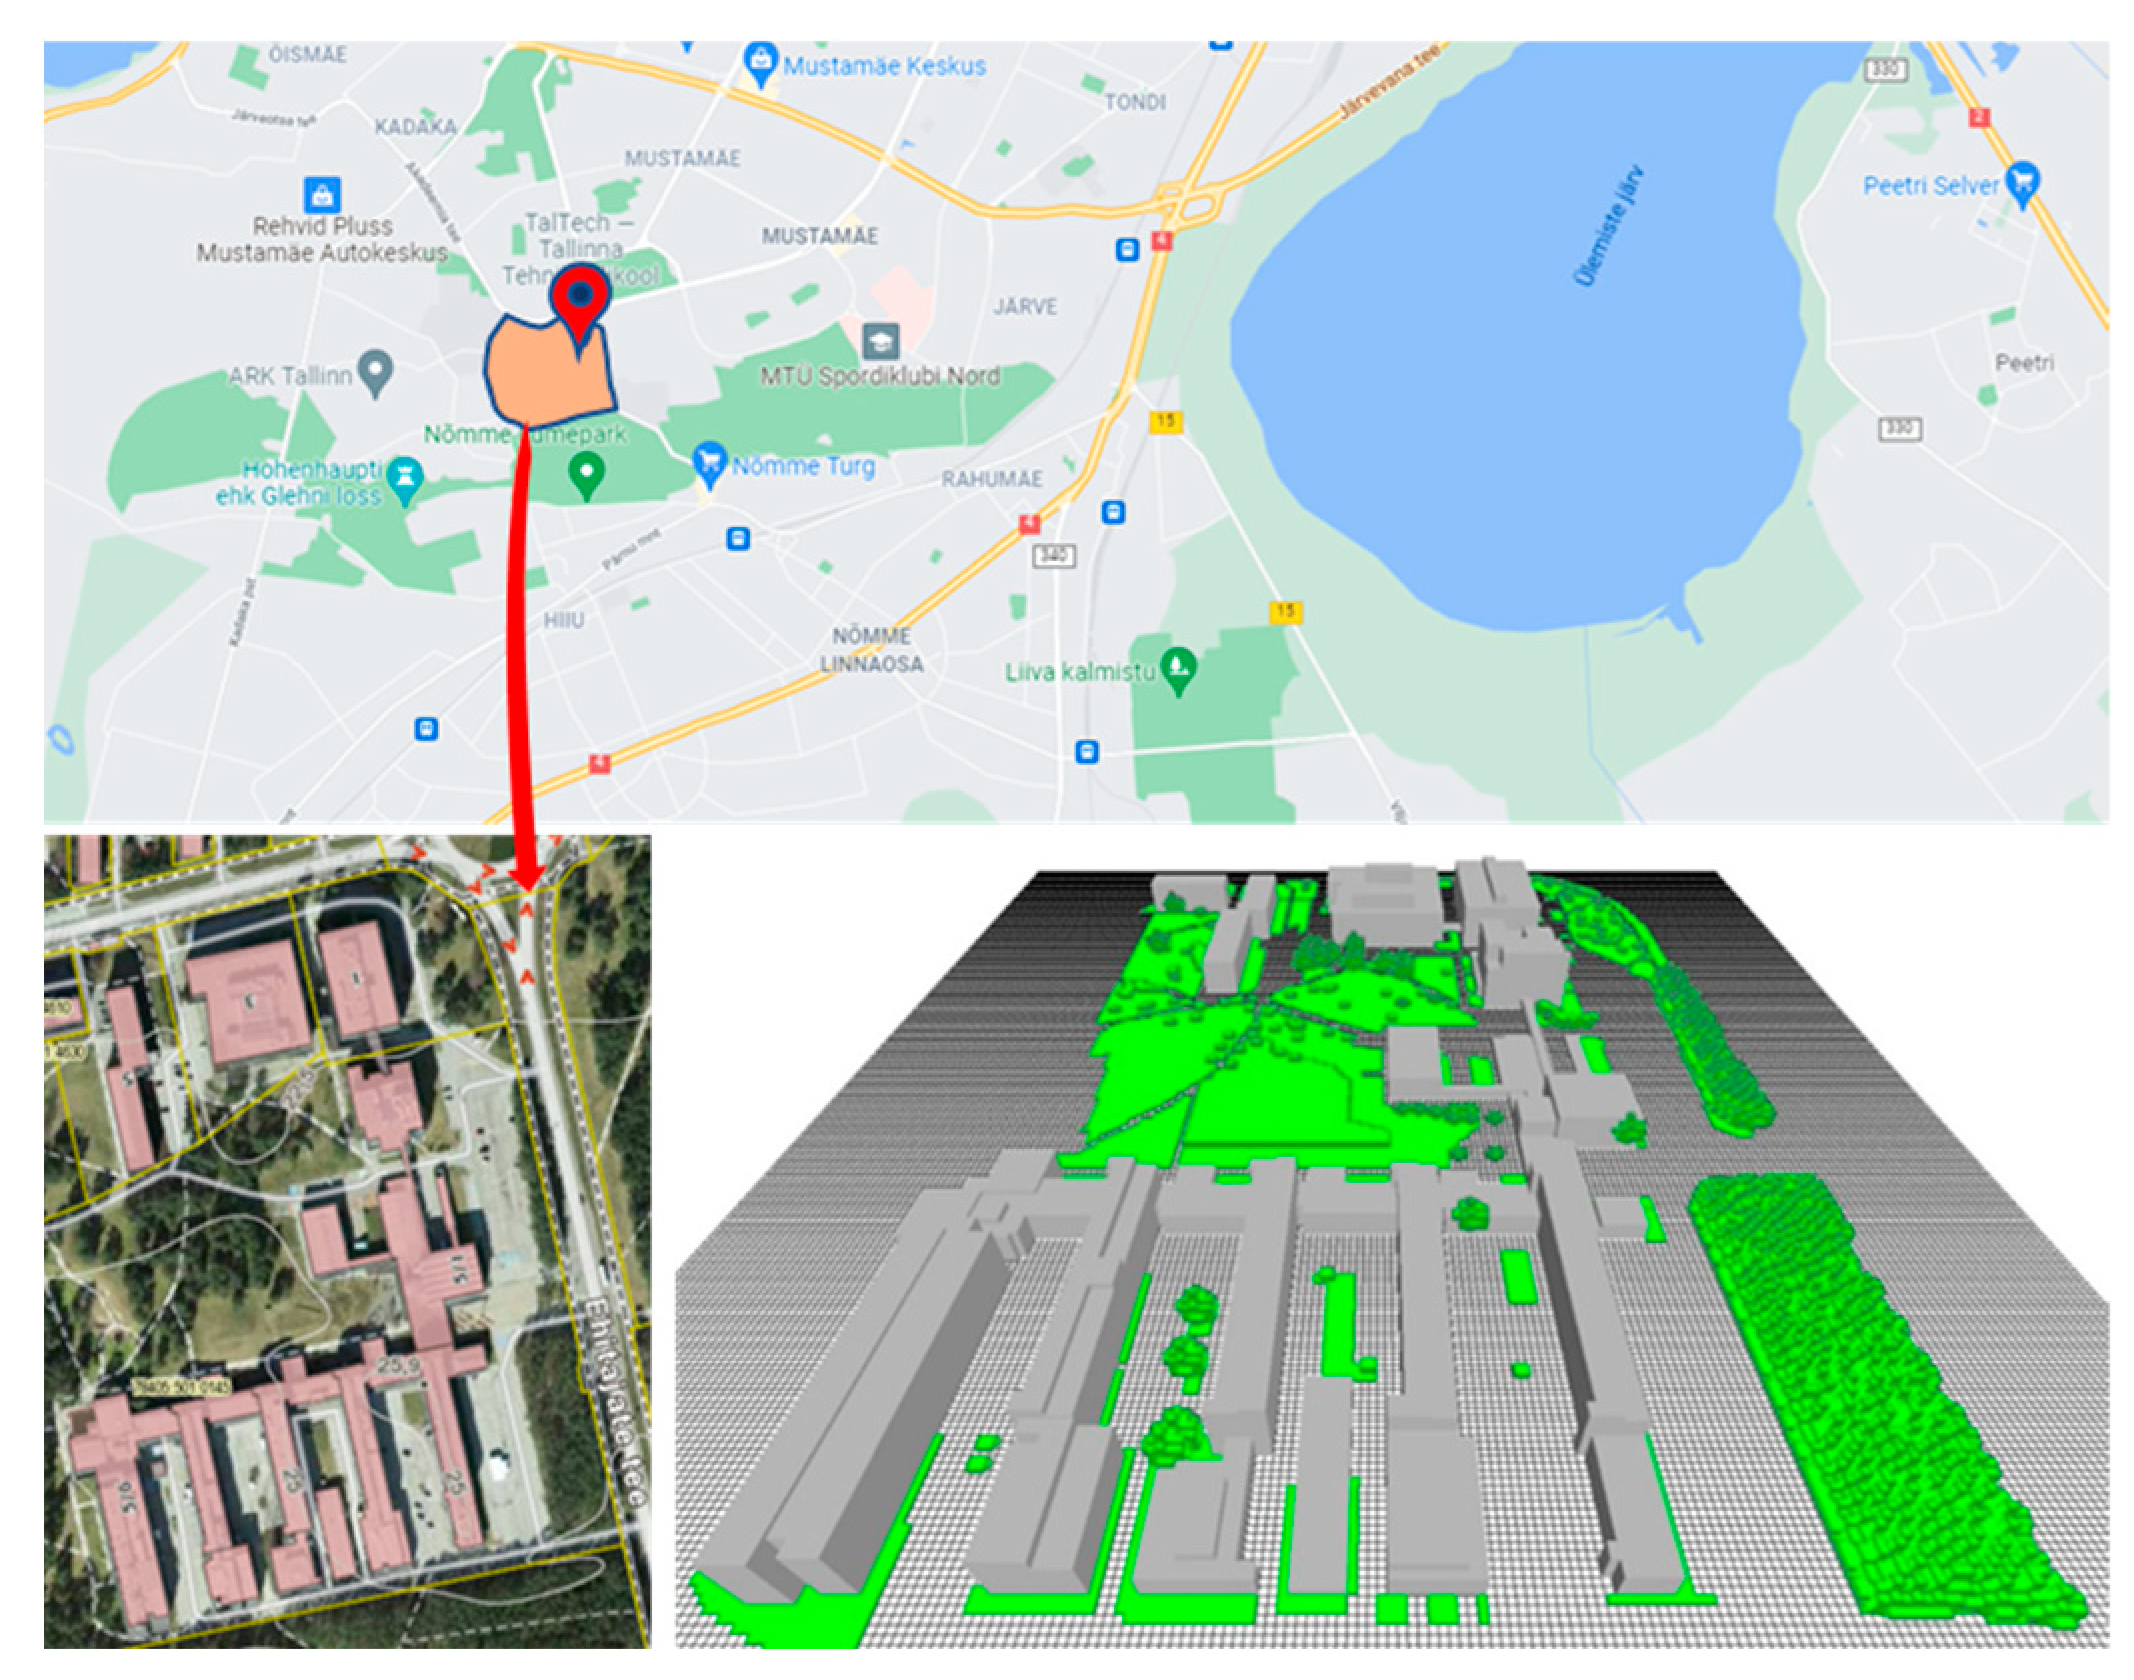
2.1. Case Study
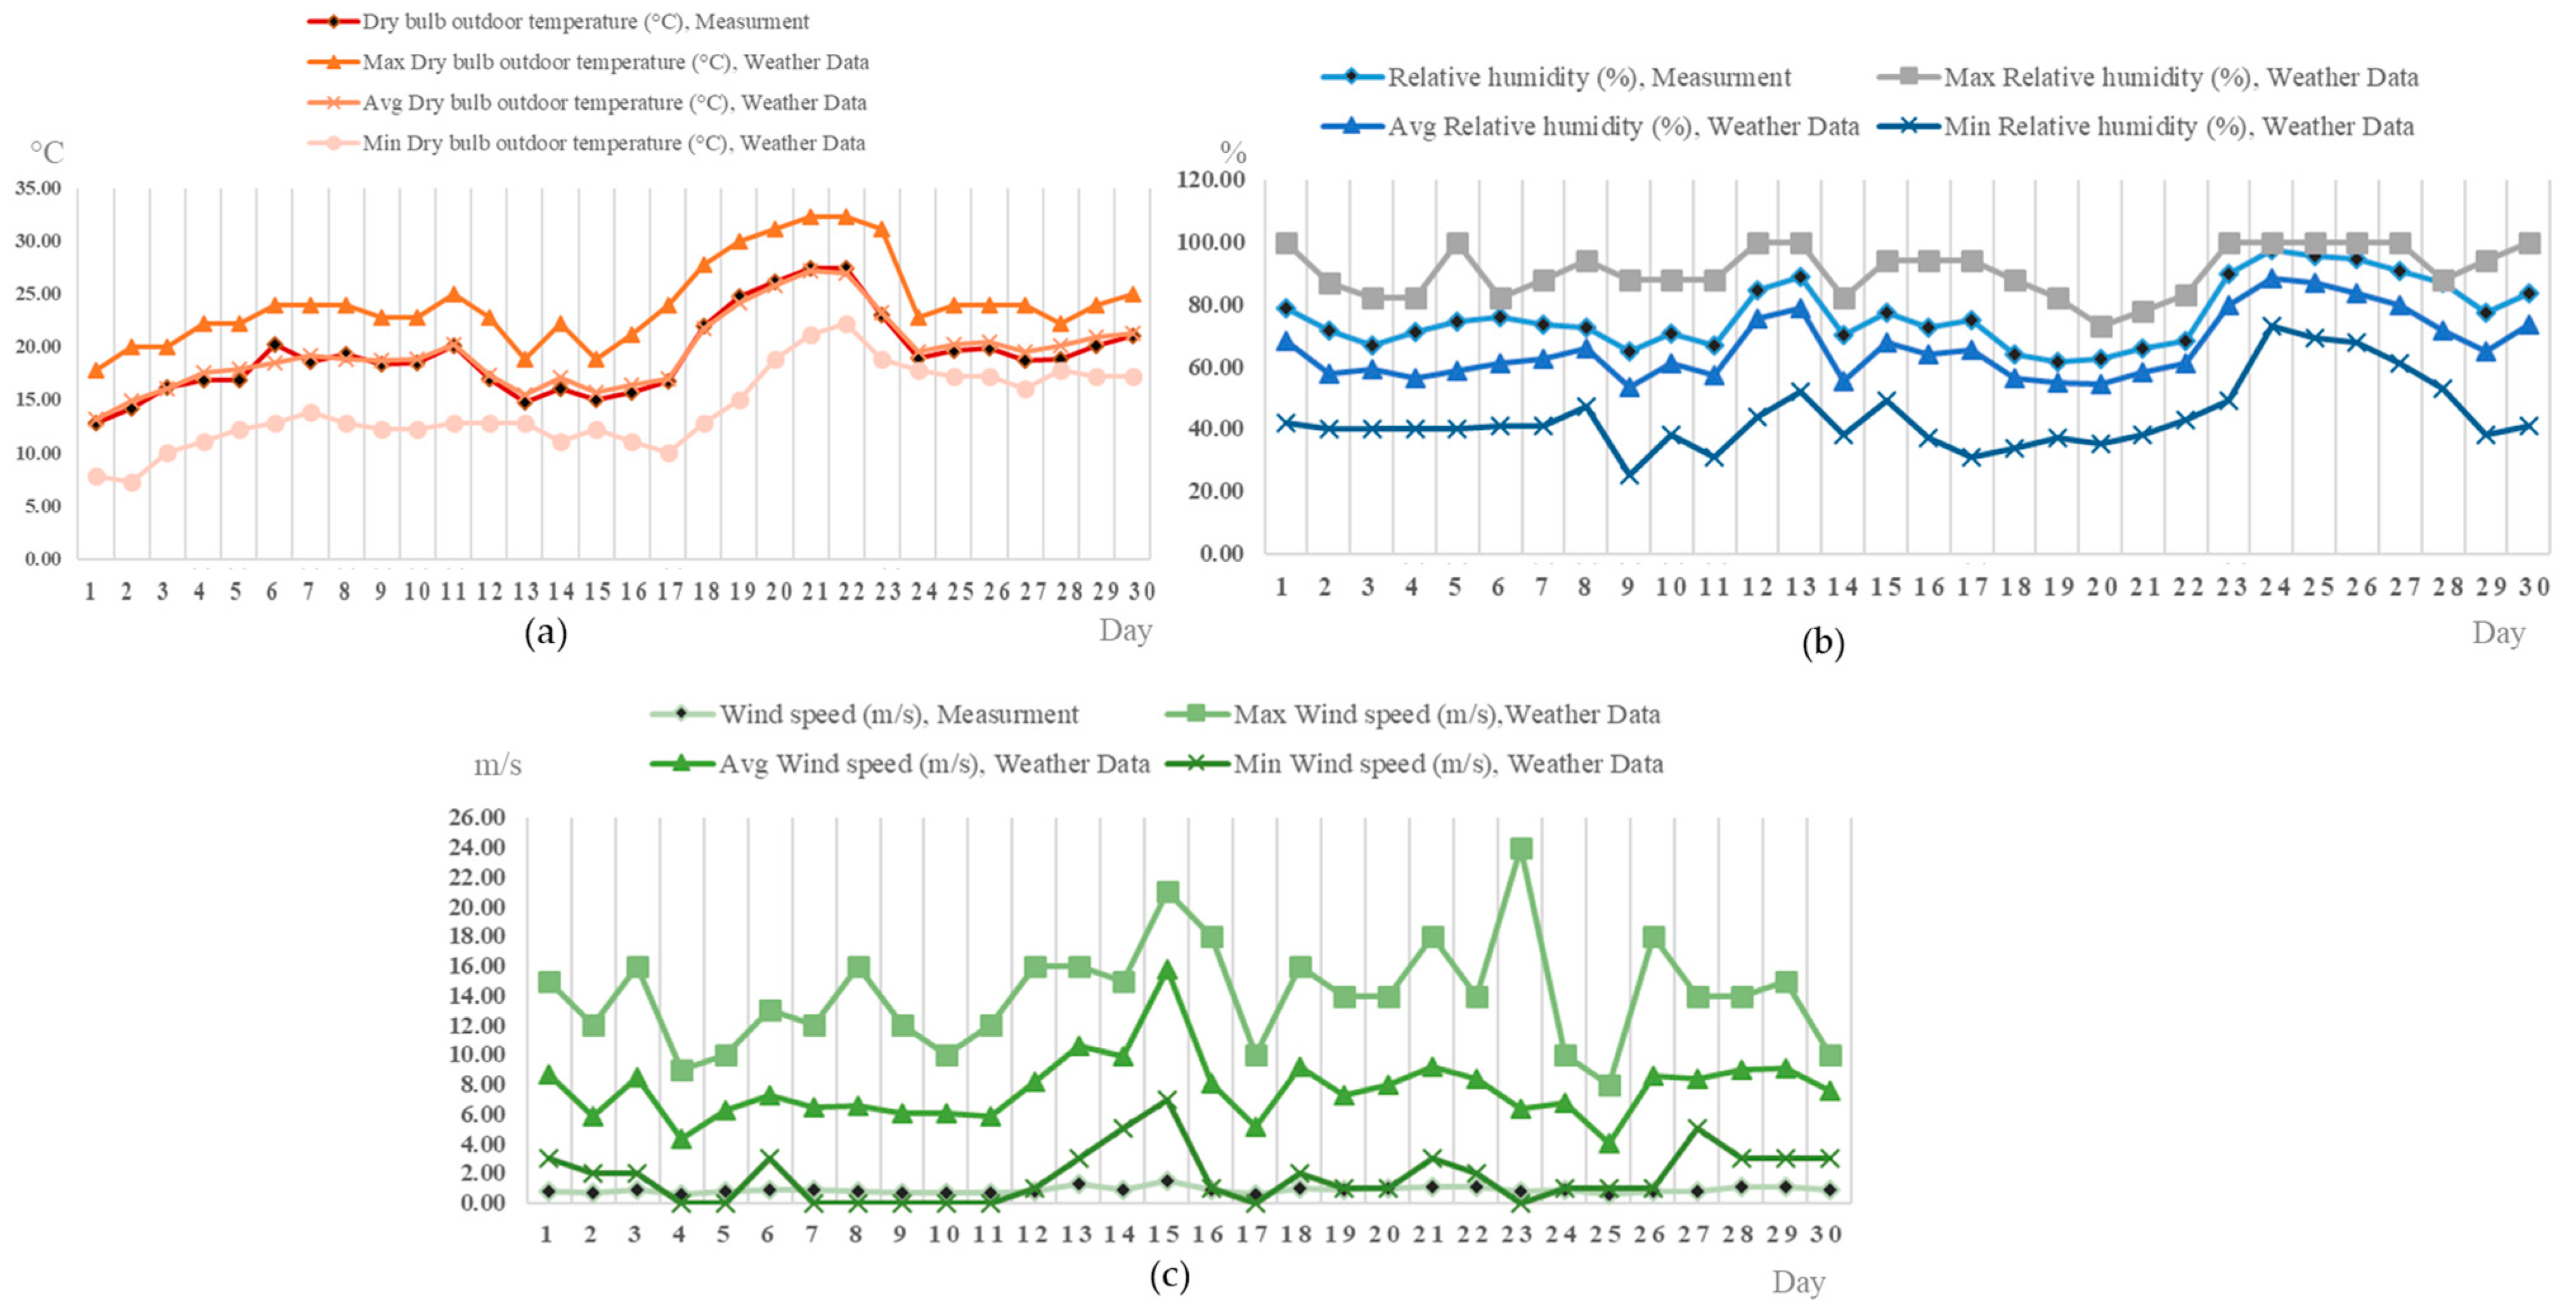
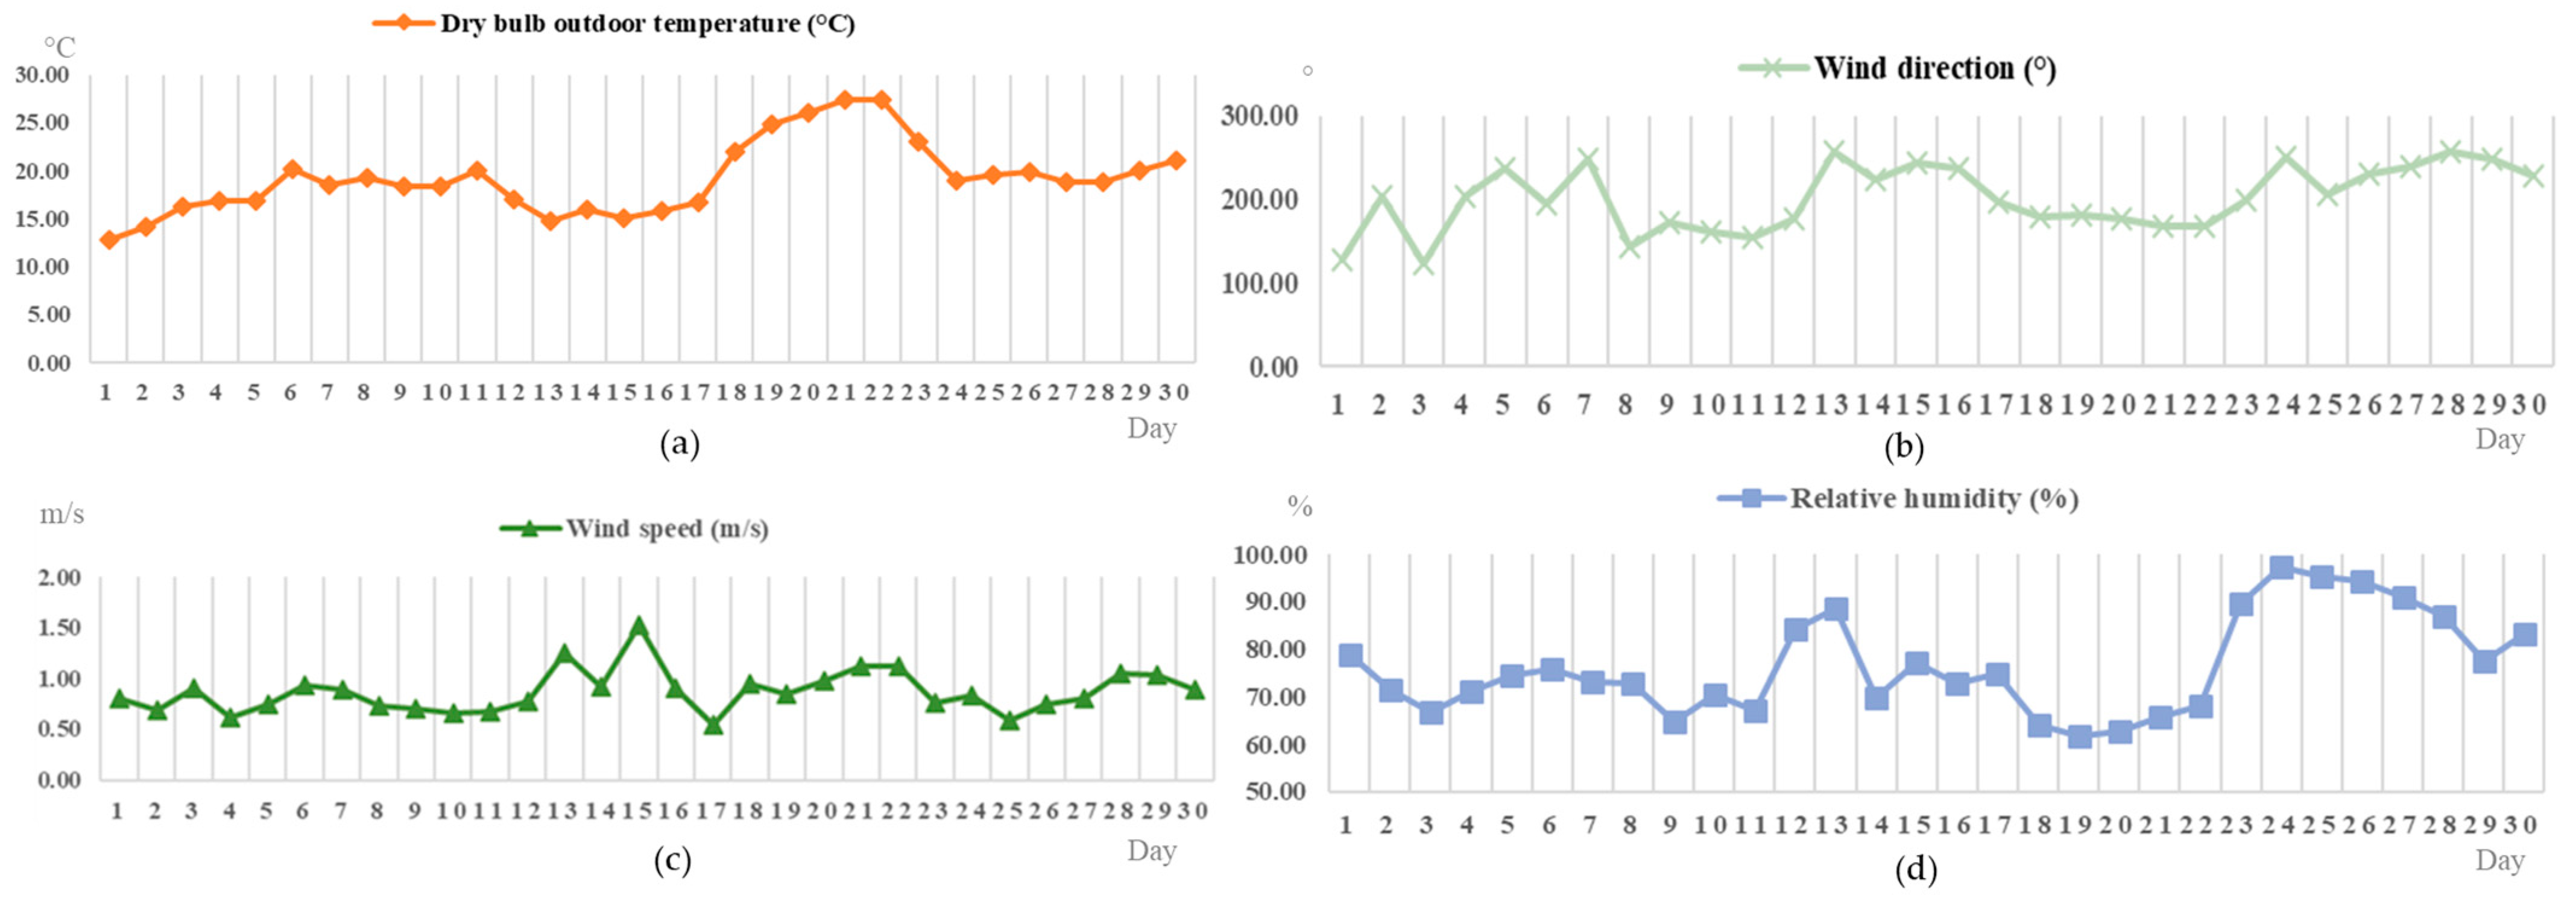
2.2. Climatic Data of the Study
2.3. Qualitative Study Based on Semi-Structured Interviews
2.4. Quantitative Study
2.4.1. Survey Study
2.4.2. Modeling and Simulation Process
3. Results
3.1. Interviews Analyses
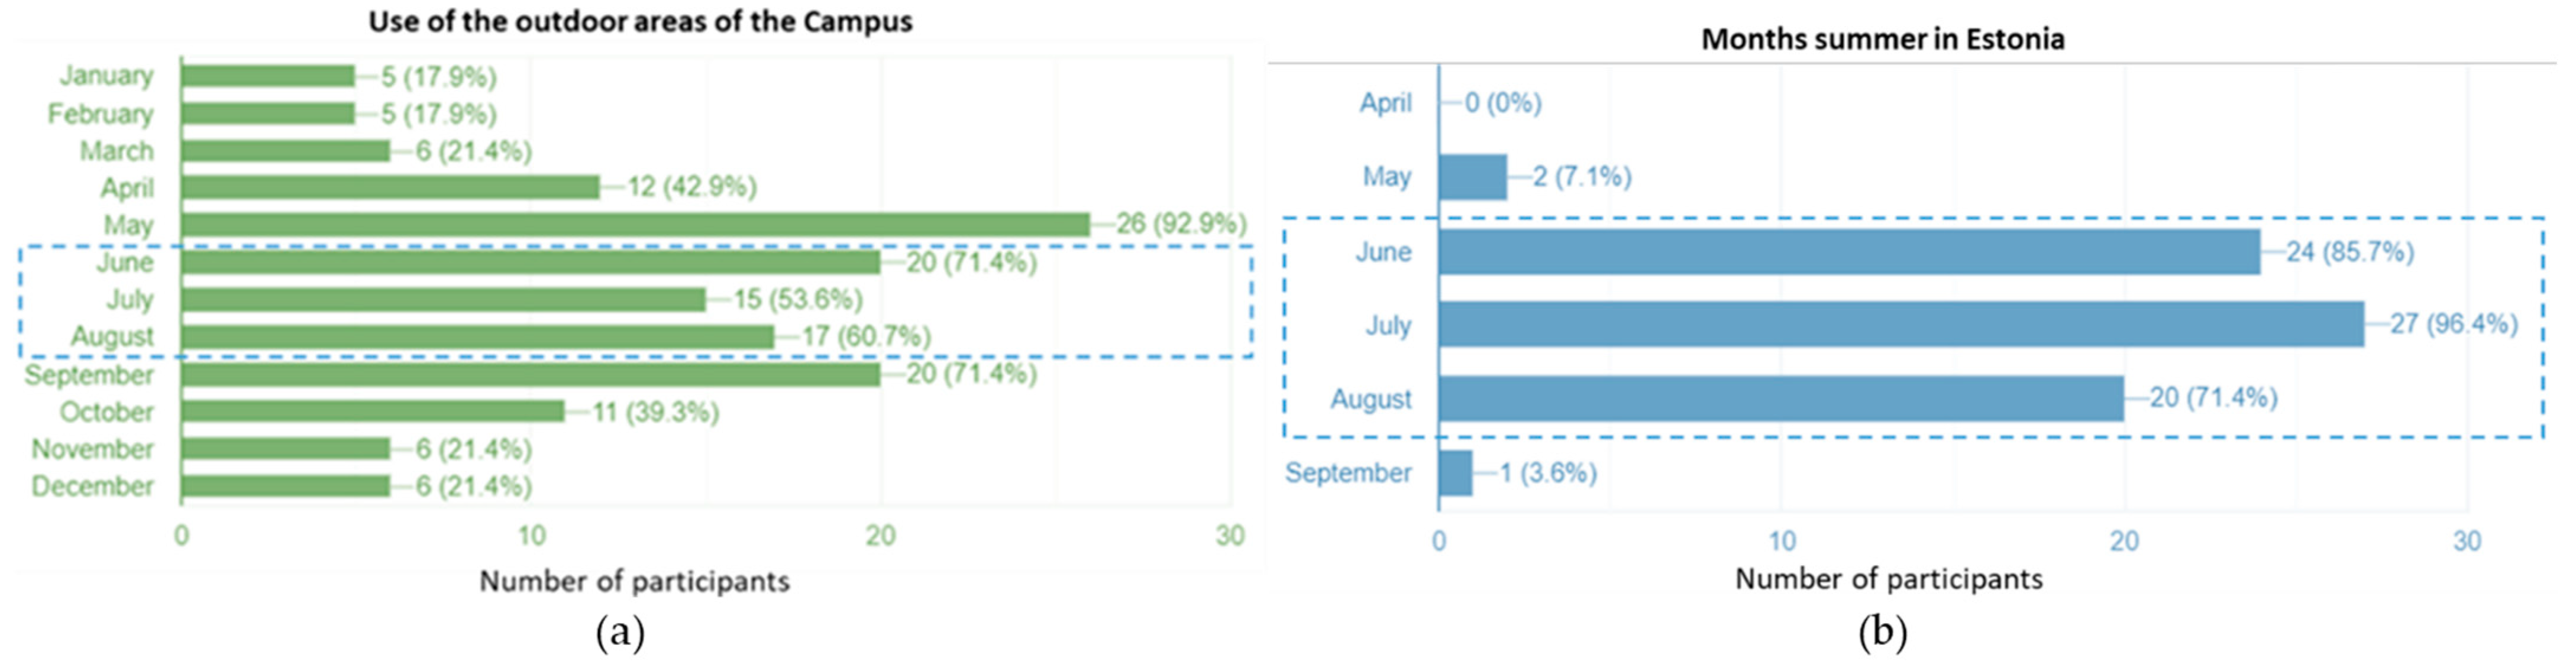
- June and July were the commonly recognised month as part of the summer.
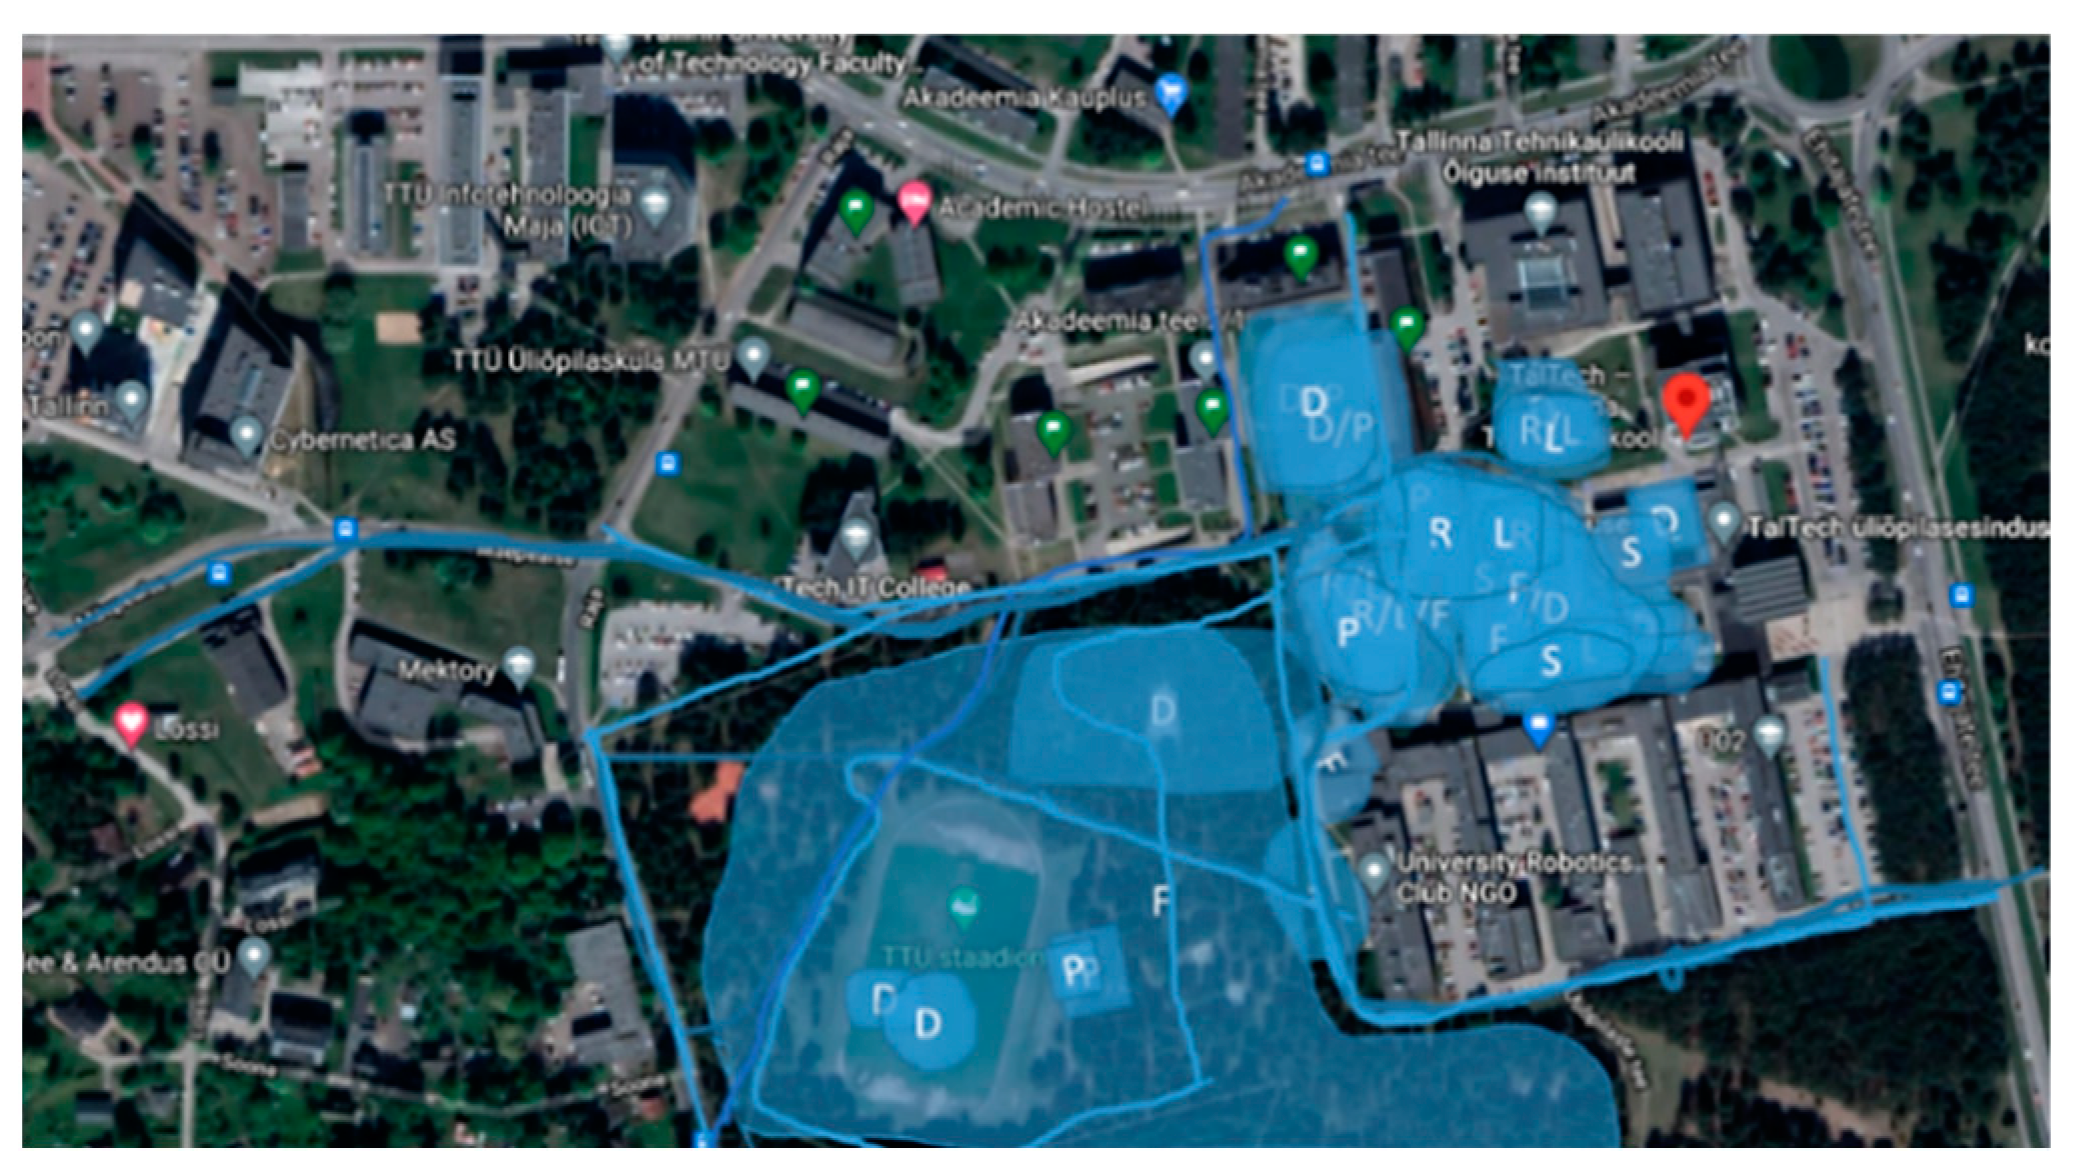
- Among the most common features of the outdoor activities during summer in Estonia, the interviewees used the following terms: sun, nature, fresh air, and daylight. The preference for a specific spot in the campus depends mainly on the level of nature, accessibility, protection against the sun, the presence of shades, and presence of places comfortable for sitting and working with laptops, laptop battery, climate conditions, and level of privacy. The level of clothing depends mainly on the climate conditions and the type of outdoor activity, but generally they prefer to wear short-sleeves/light clothes in summer (answer to RQ0).
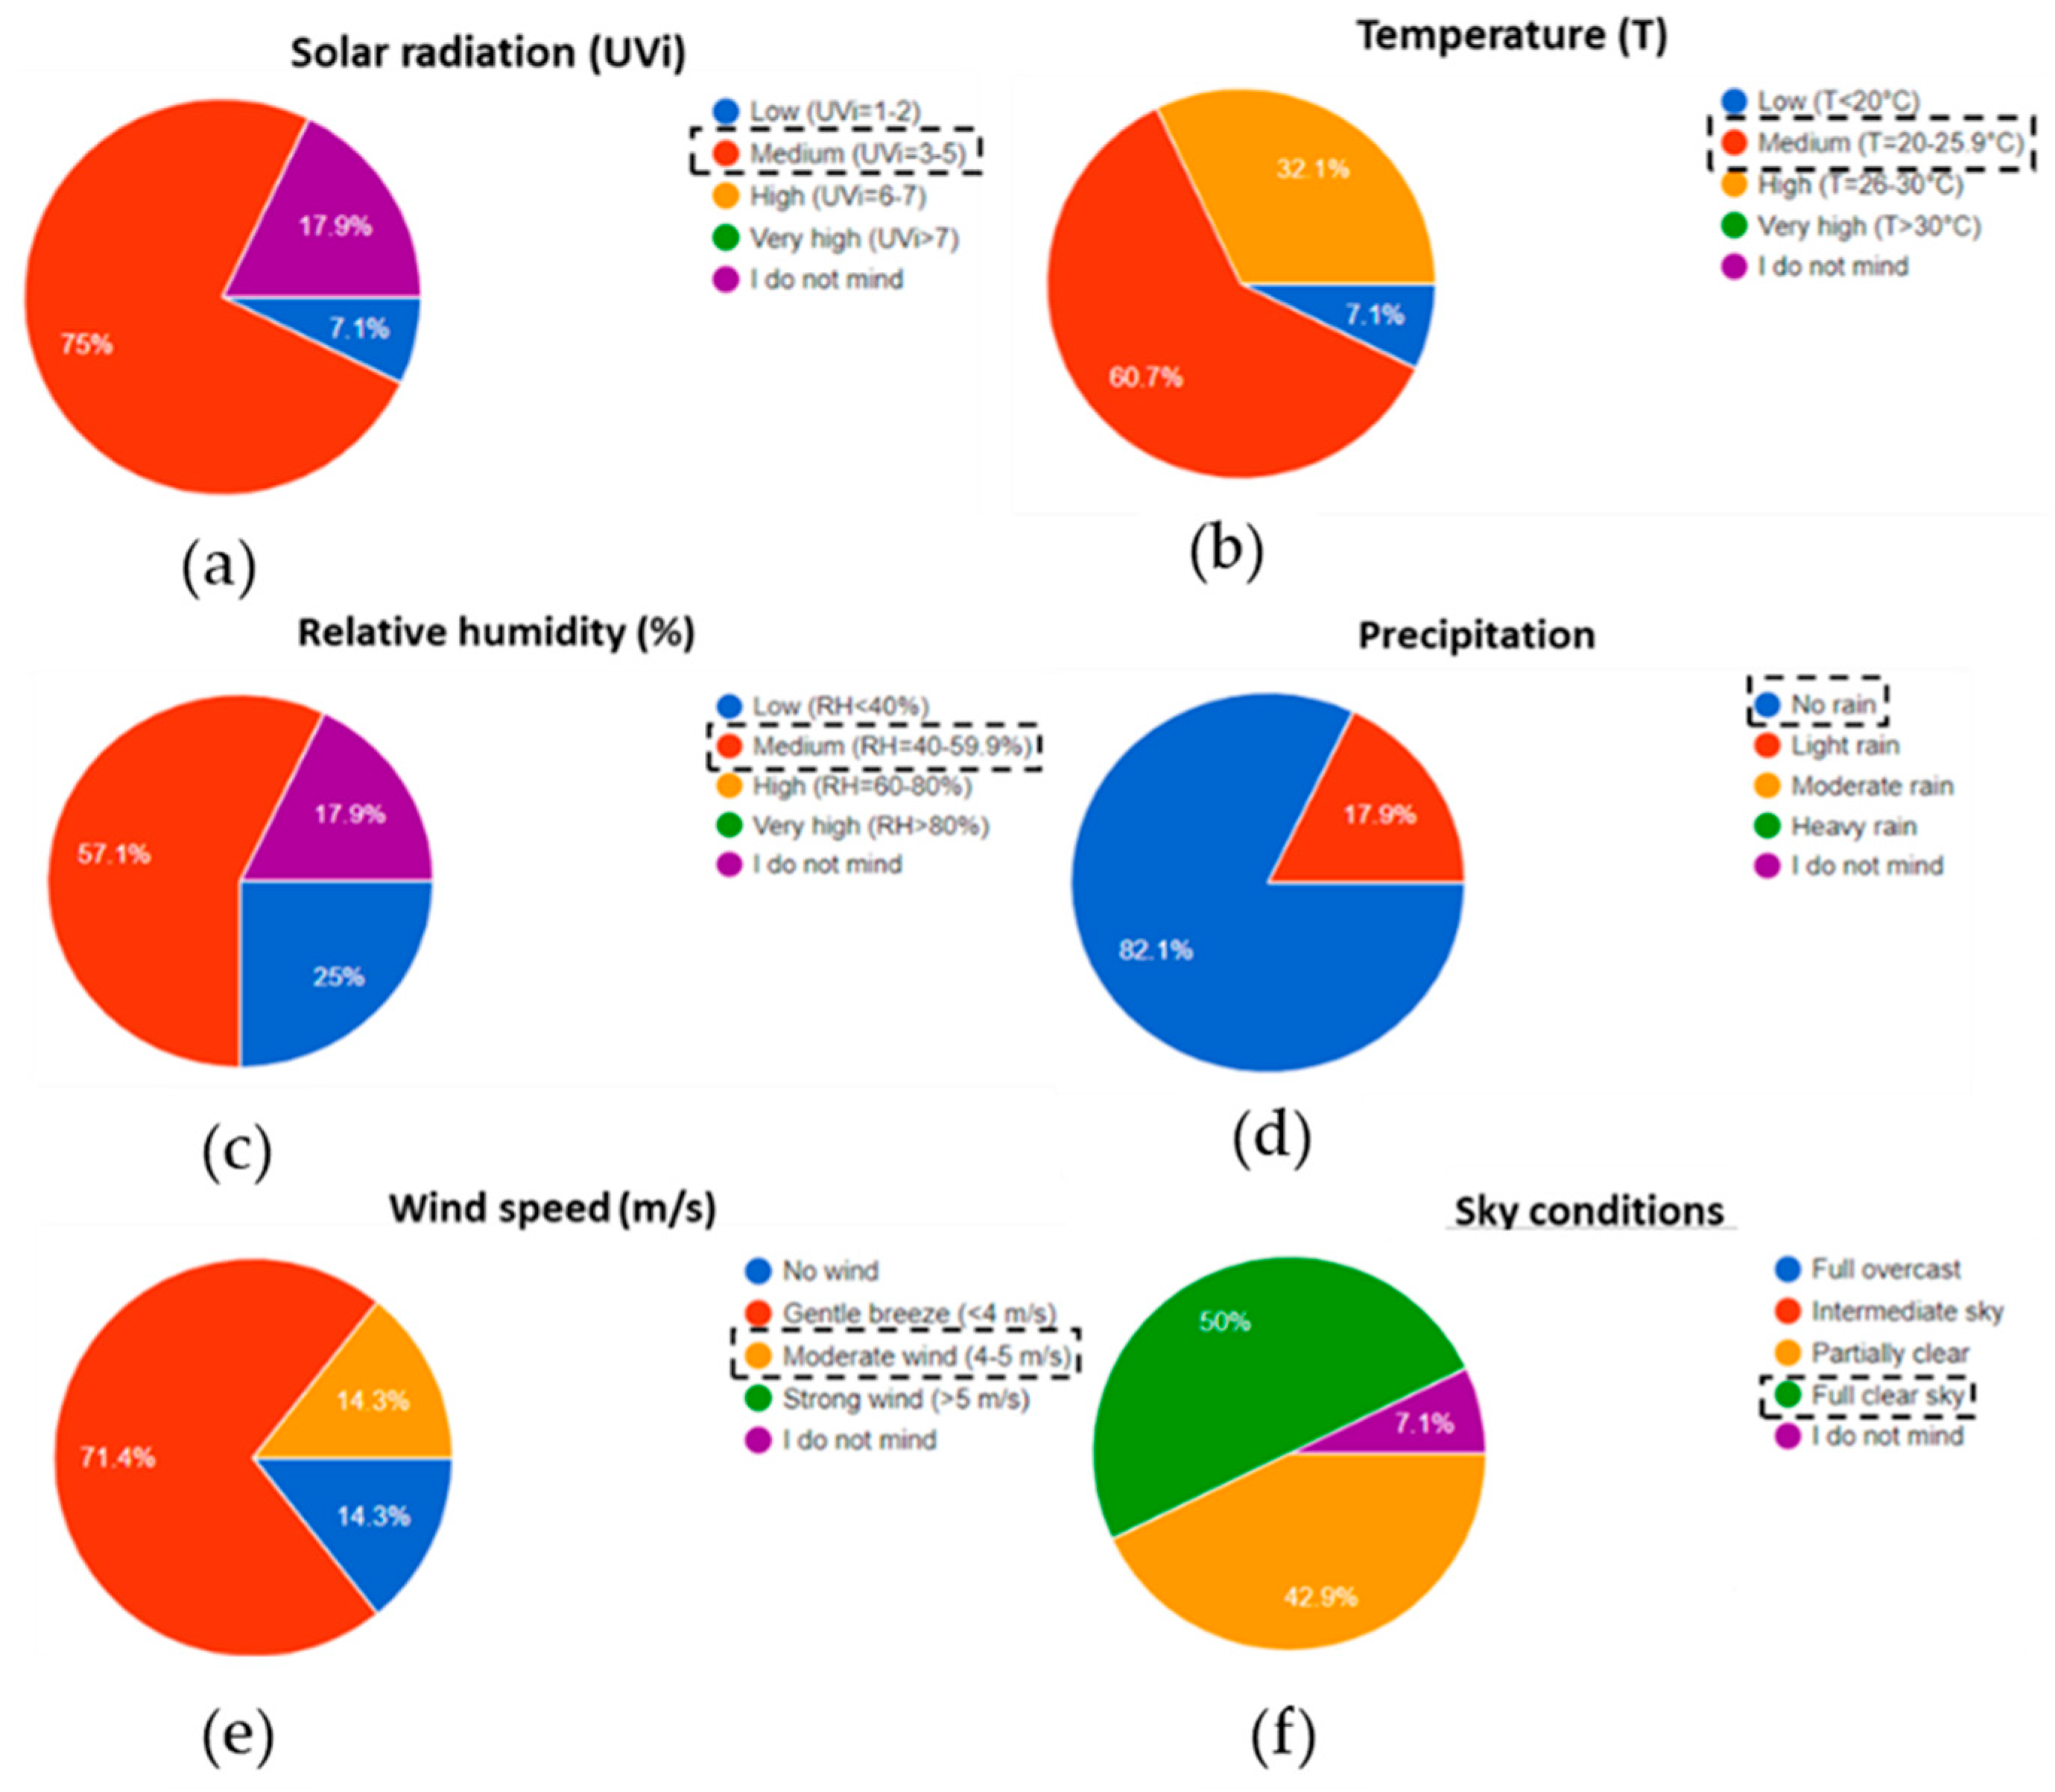
- According to them a perfect summer day would have a temperature between 20 °C and 25 °C with a gentle breeze and almost clear sky (answer to RQ3).
- They consider very hot and humid/stormy days as the less desired ones during summer in Estonia.
- In terms of level of clothing, the 60% of the interviewees like wearing short clothes during summer. The 40% of the interviewees find normal to wear light clothes during summer.
- The half of the interviewees live near the campus so they normally go to the campus by walk. The rest of them would go by car, bus, or even e-scooter. The frequency of visit depends on each person and where they live and work.
- Among 70% of the interviews use the outdoor areas of the campus.
3.2. Survey Analyses
Input Elements to Assess Thermal Comfort Based on the Survey
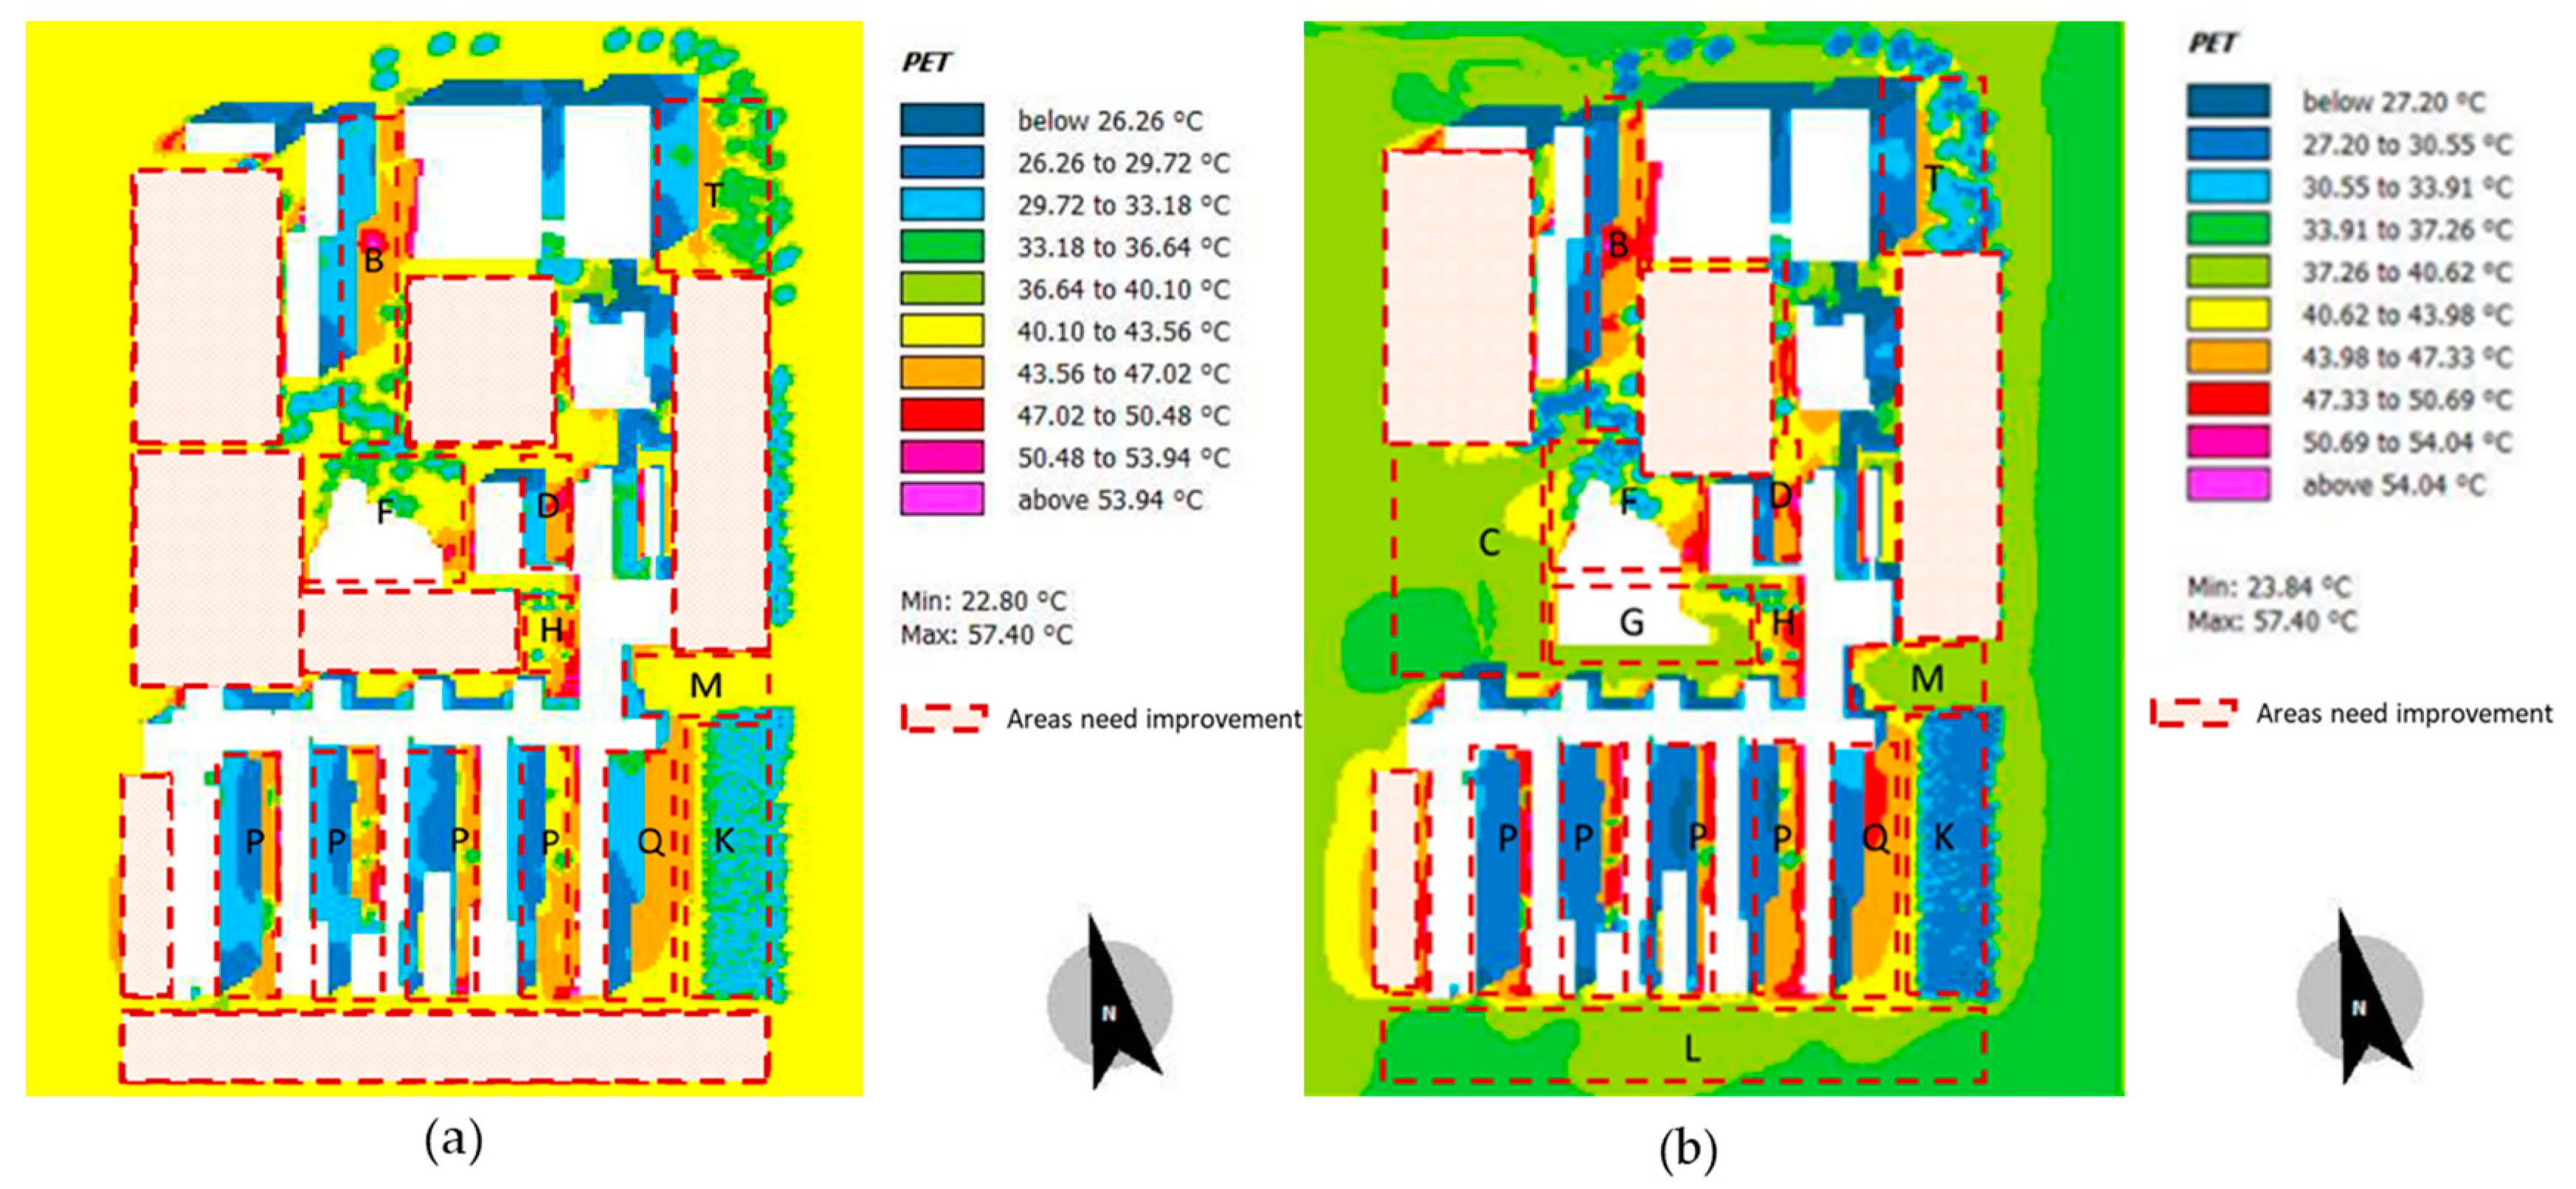
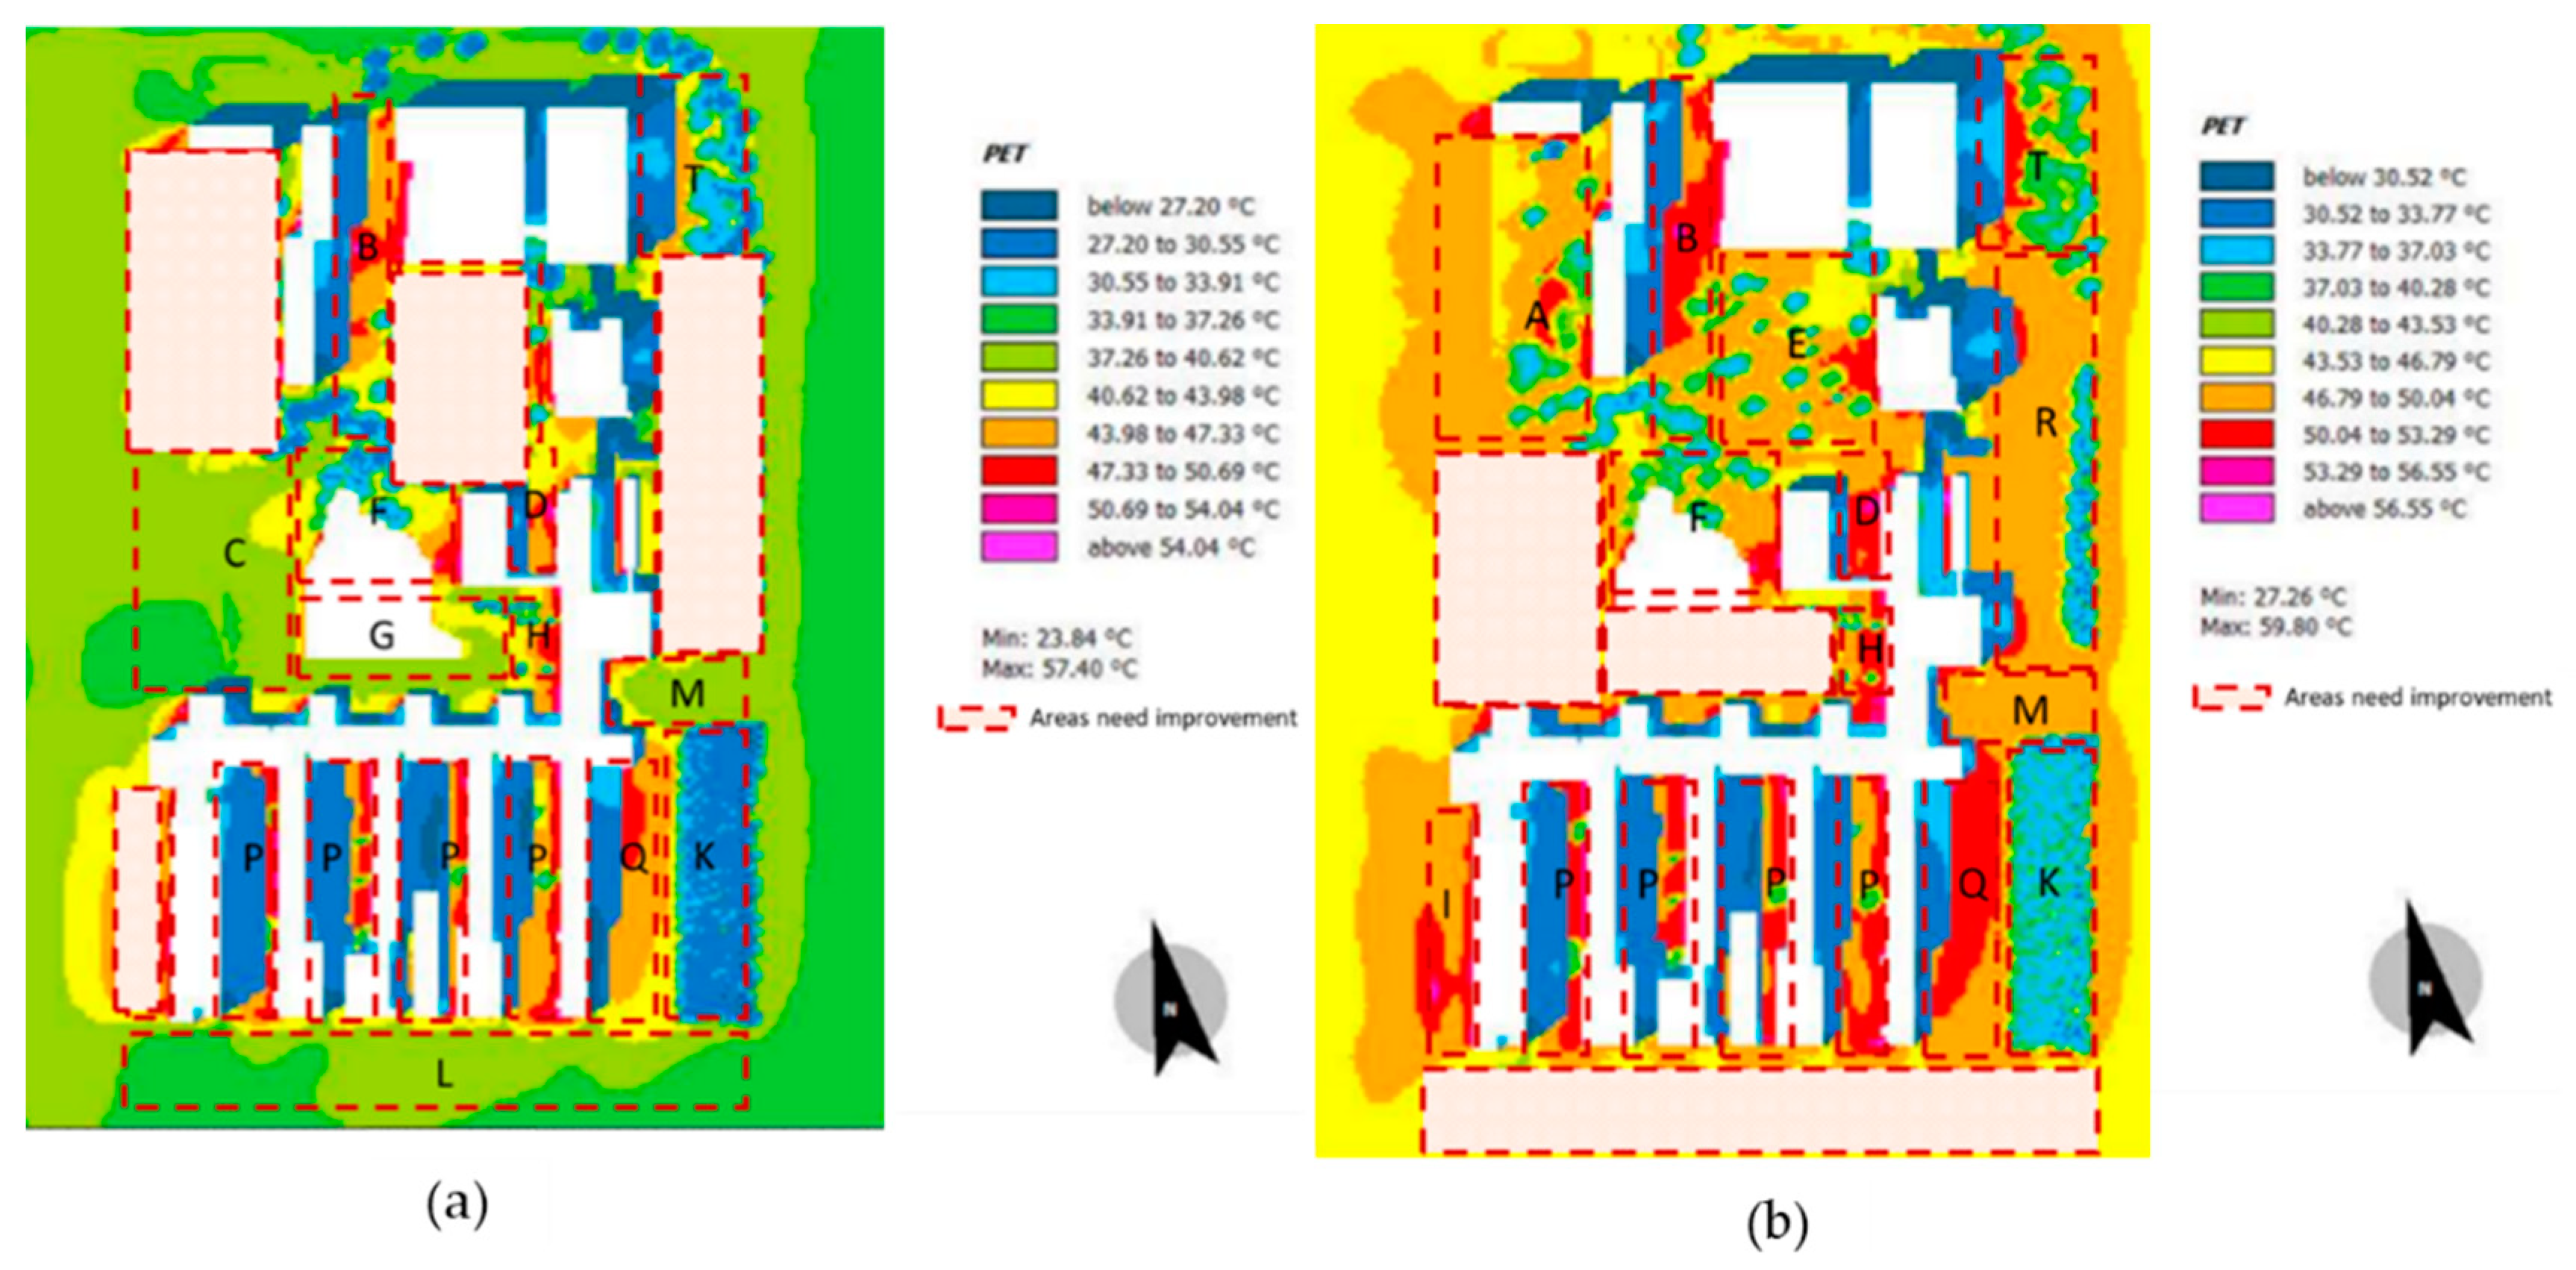
3.3. CFD Simulation Analysis and Results
4. Analyzing the Results of PET Evaluation
5. Application of the Study Results
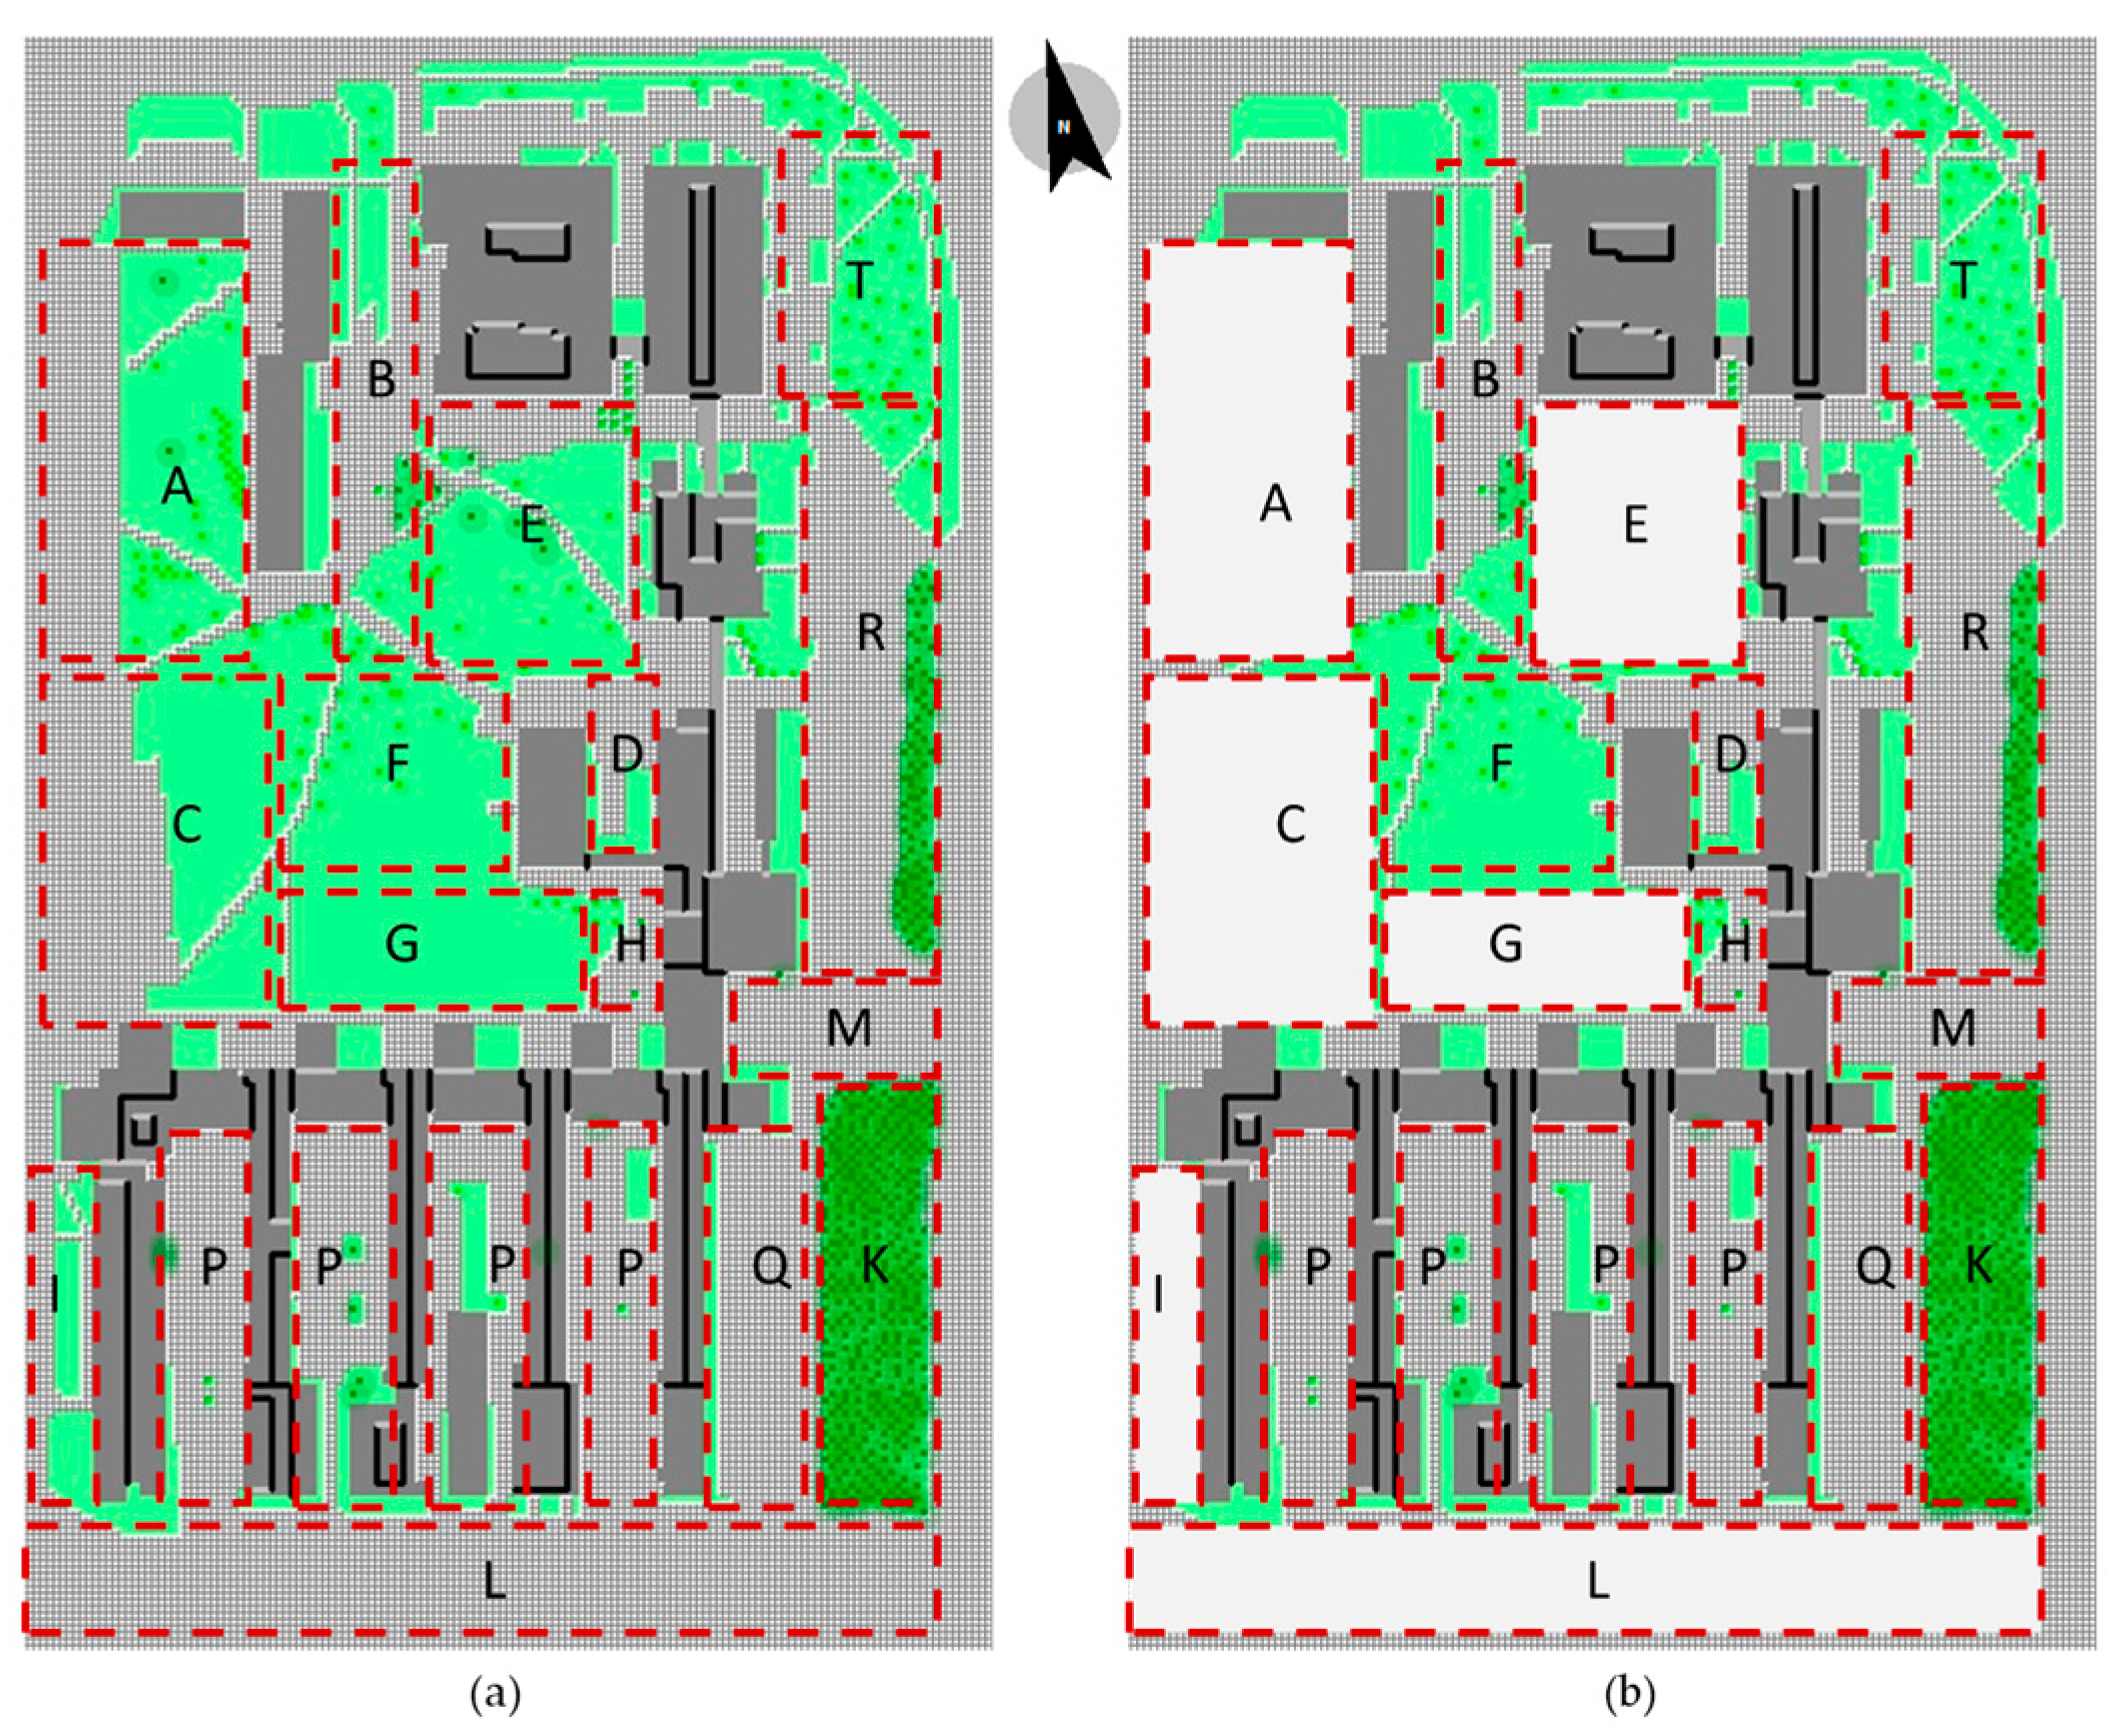
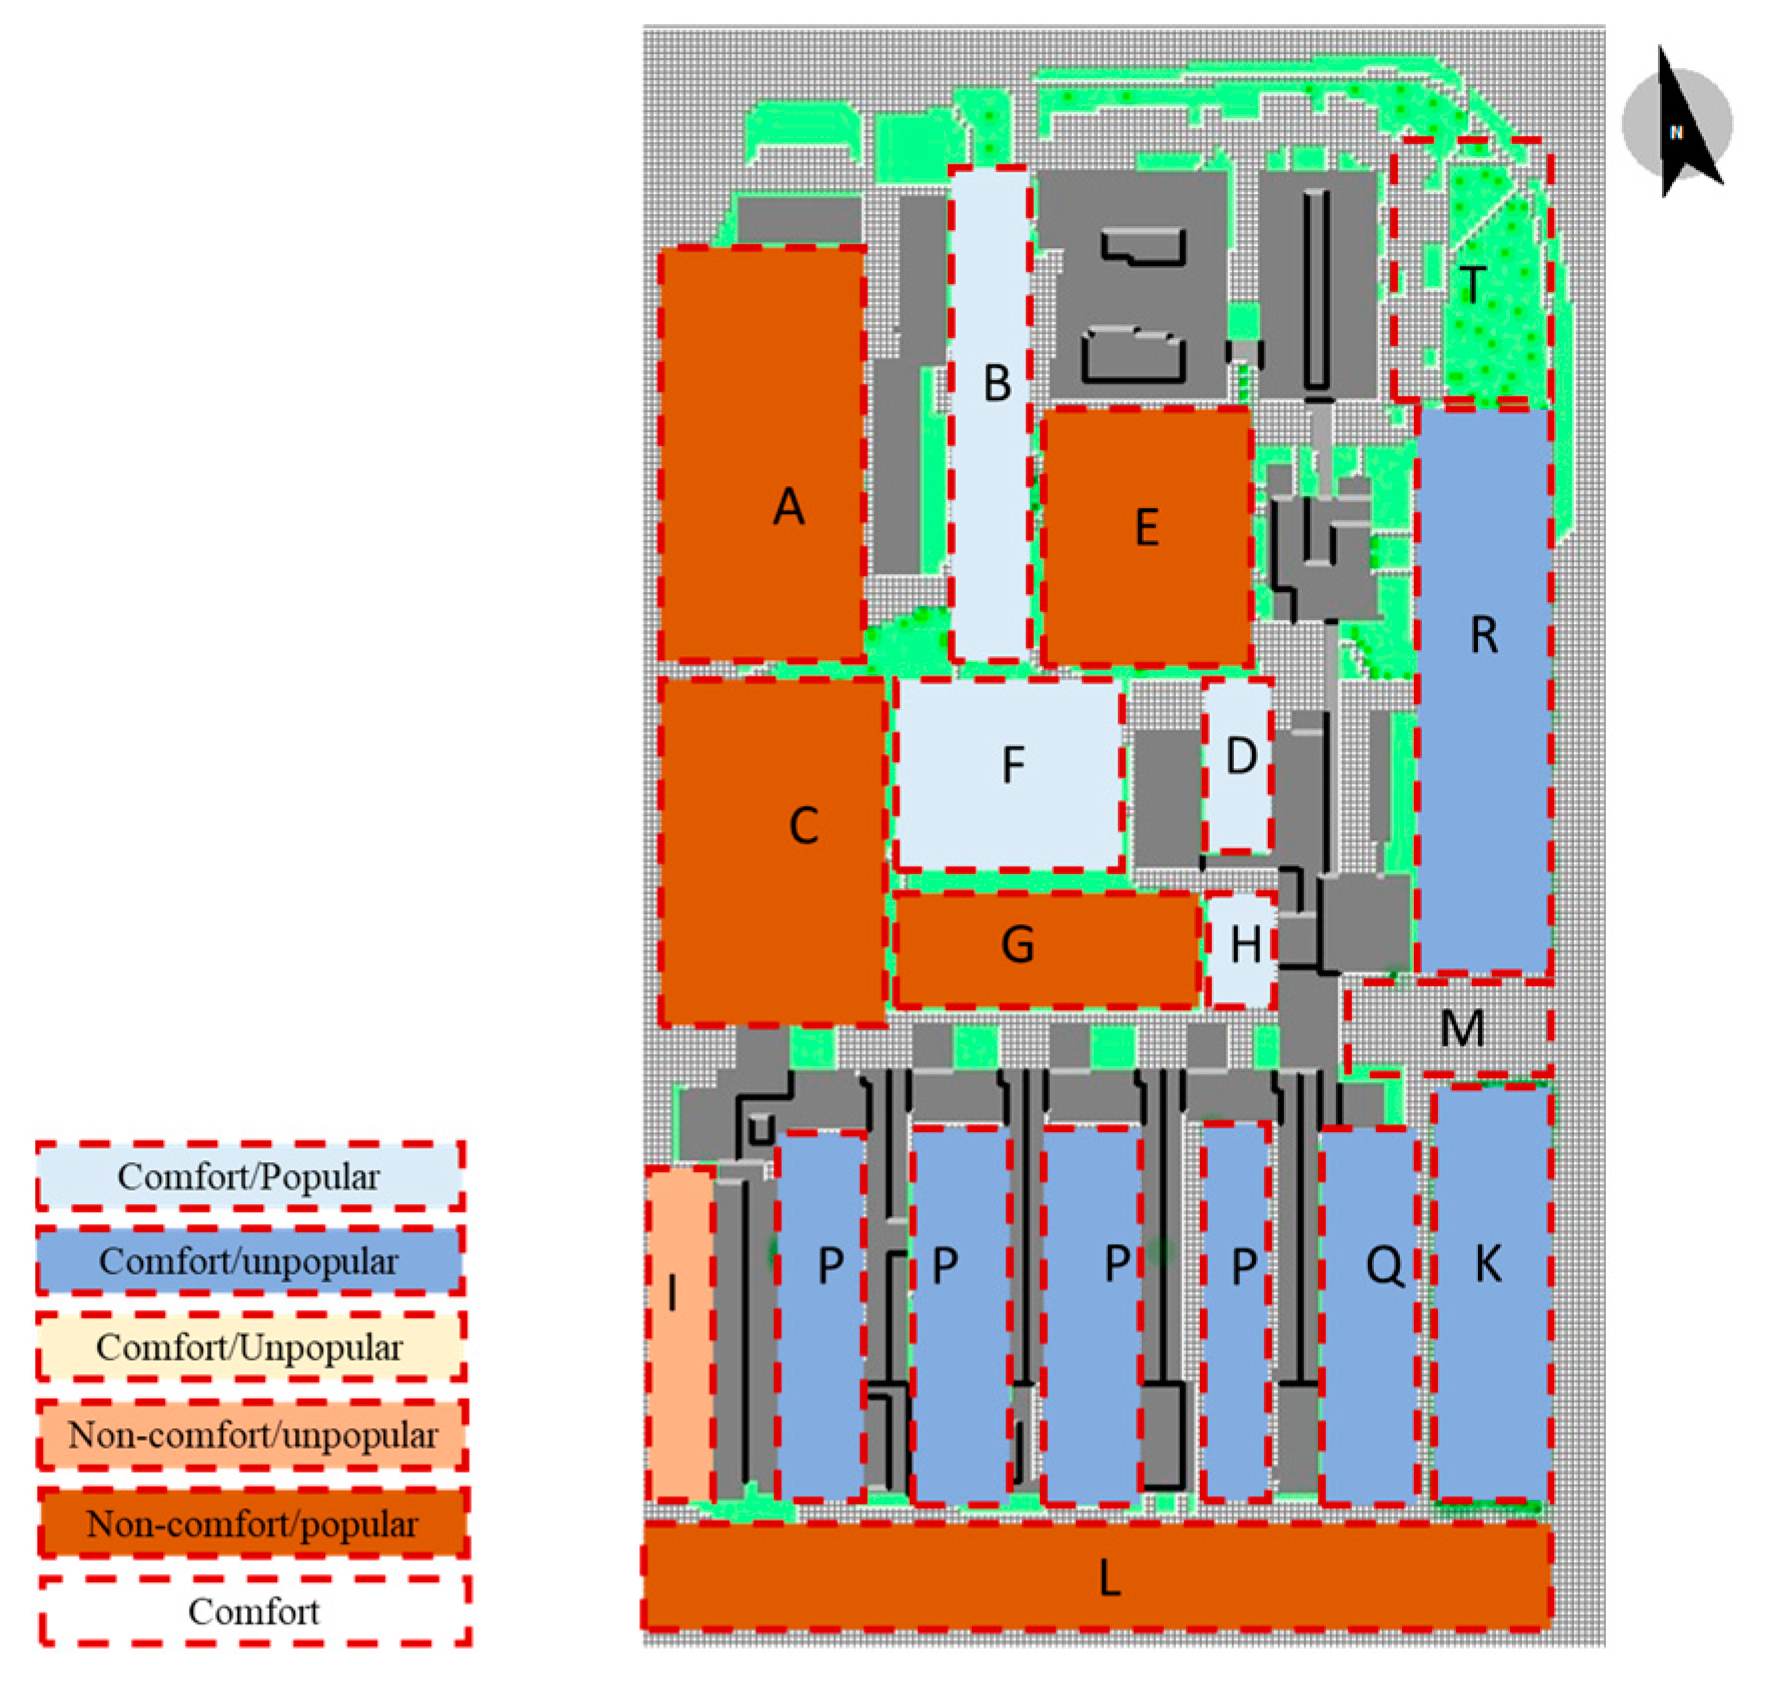
5.1. Visualizing the Results
5.2. Mitigation Strategies for the Improvement Thermal Comfort
6. Conclusions
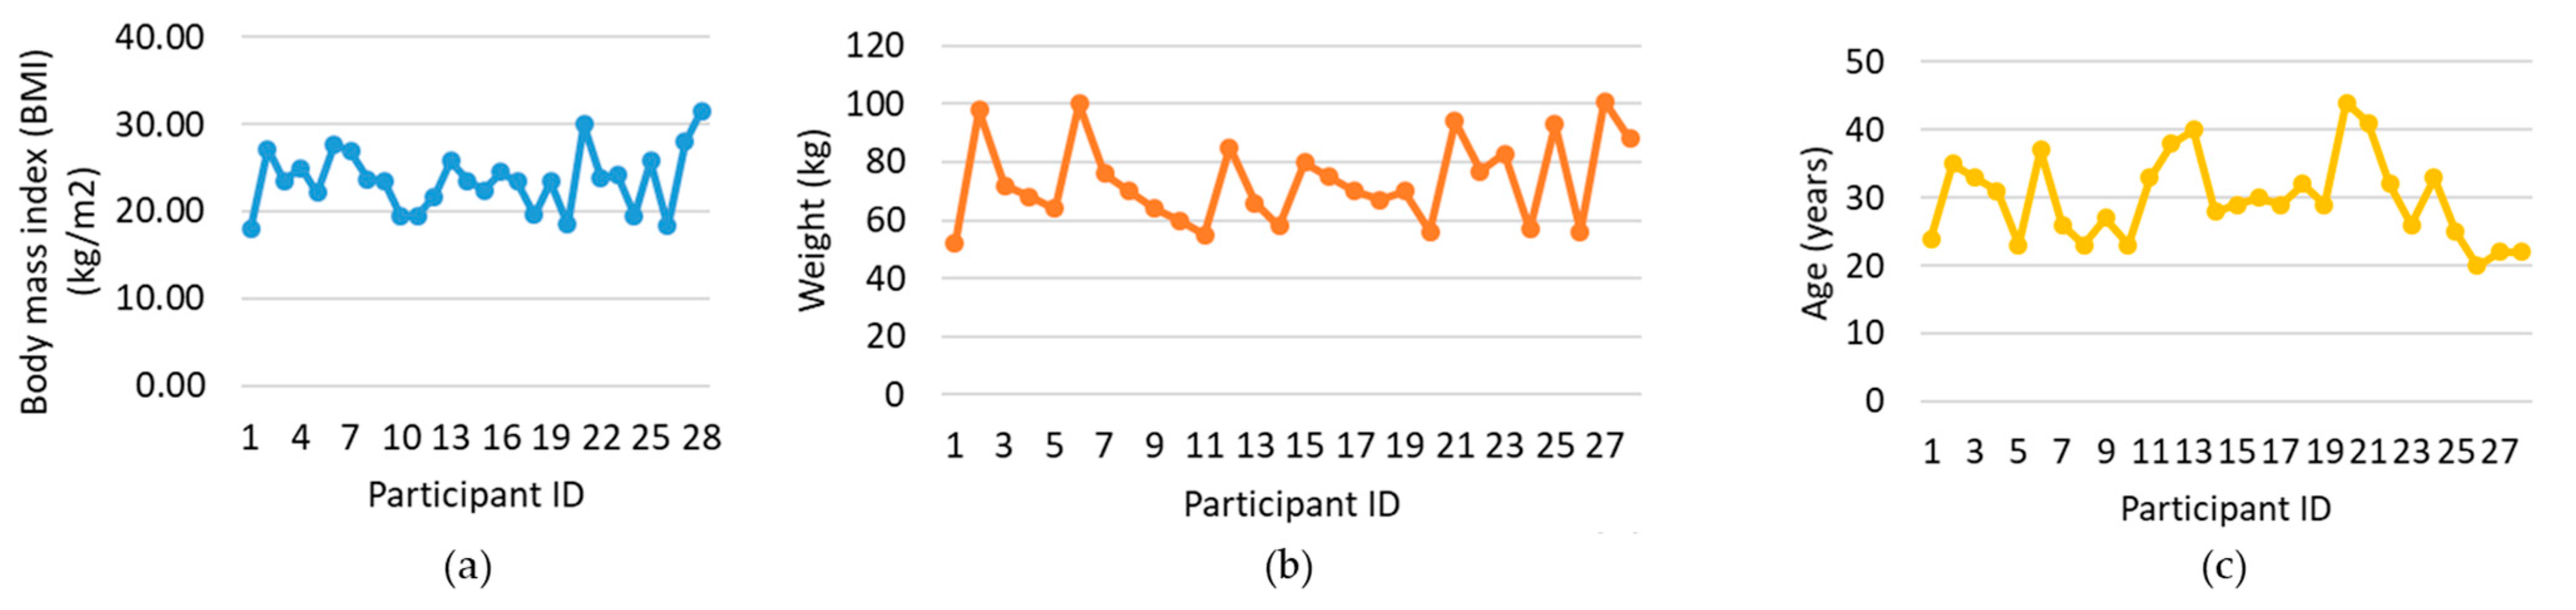
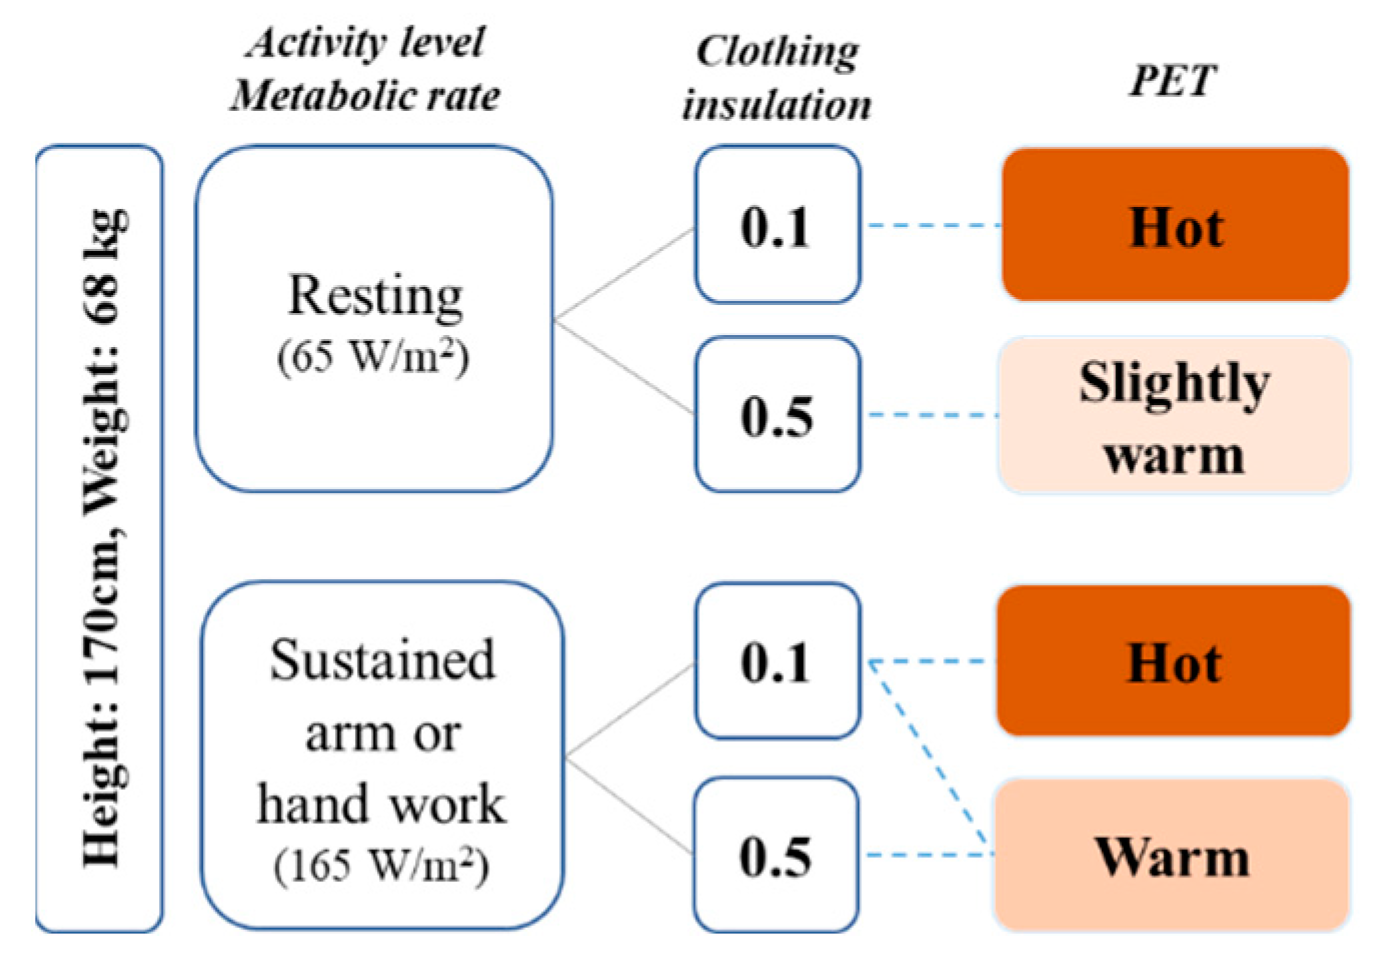
- The analysis of the relationship between personal characteristics and perception of thermal comfort shows that height, weight, degree of clothing, and activity level have an impact on thermal comfort values. The result shows that when the activity level is high, the level of clothing has no significant influence on the thermal comfort value. Furthermore, comparing people with high and low BMI under the same microclimatic conditions, with the same activity and clothing level, the maximum values of PET are higher in people with low BMI than in people with high BMI. Therefore, people with a lower BMI can move more under the same weather conditions without feeling uncomfortable compared to those with higher BMIs.
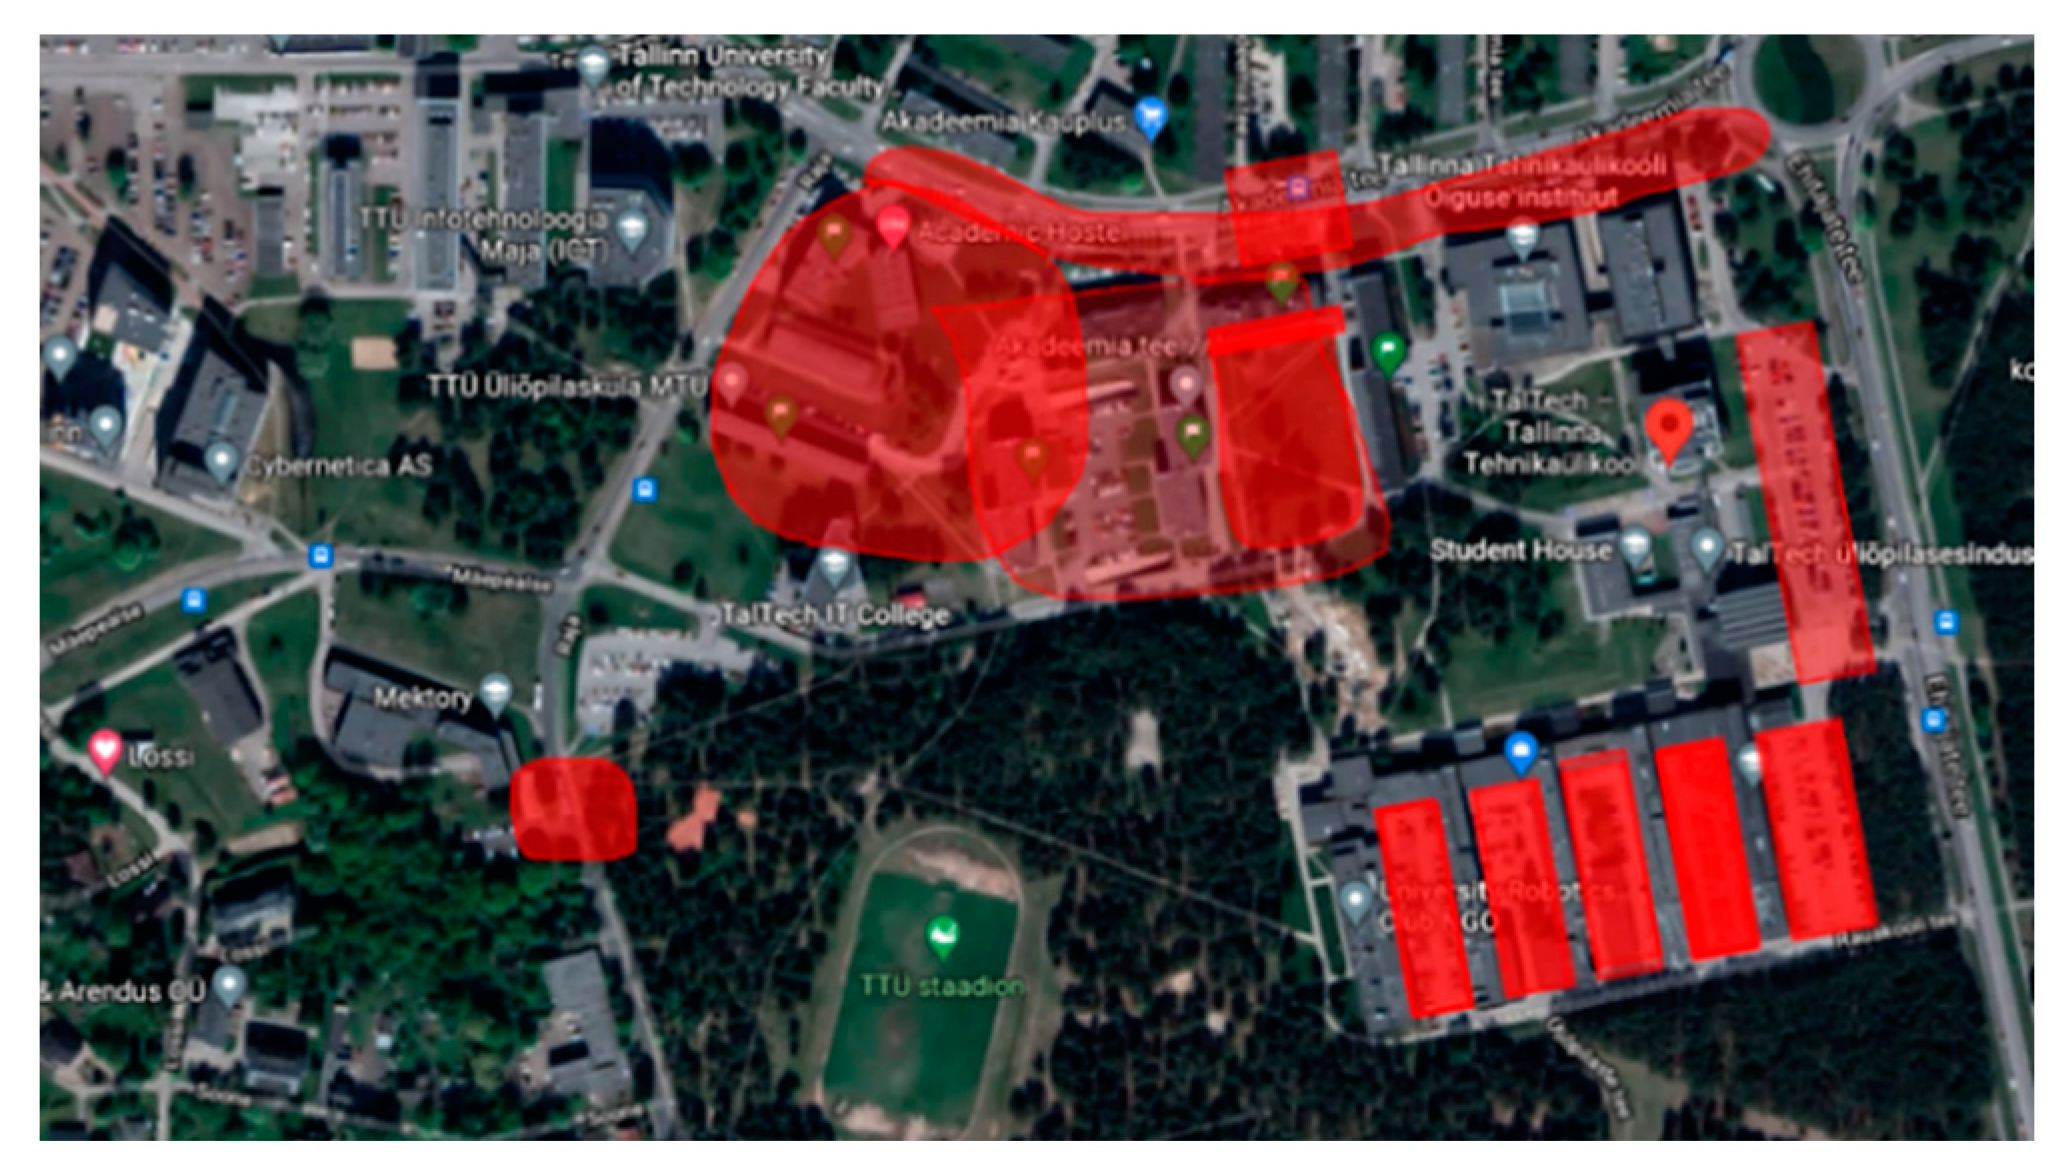
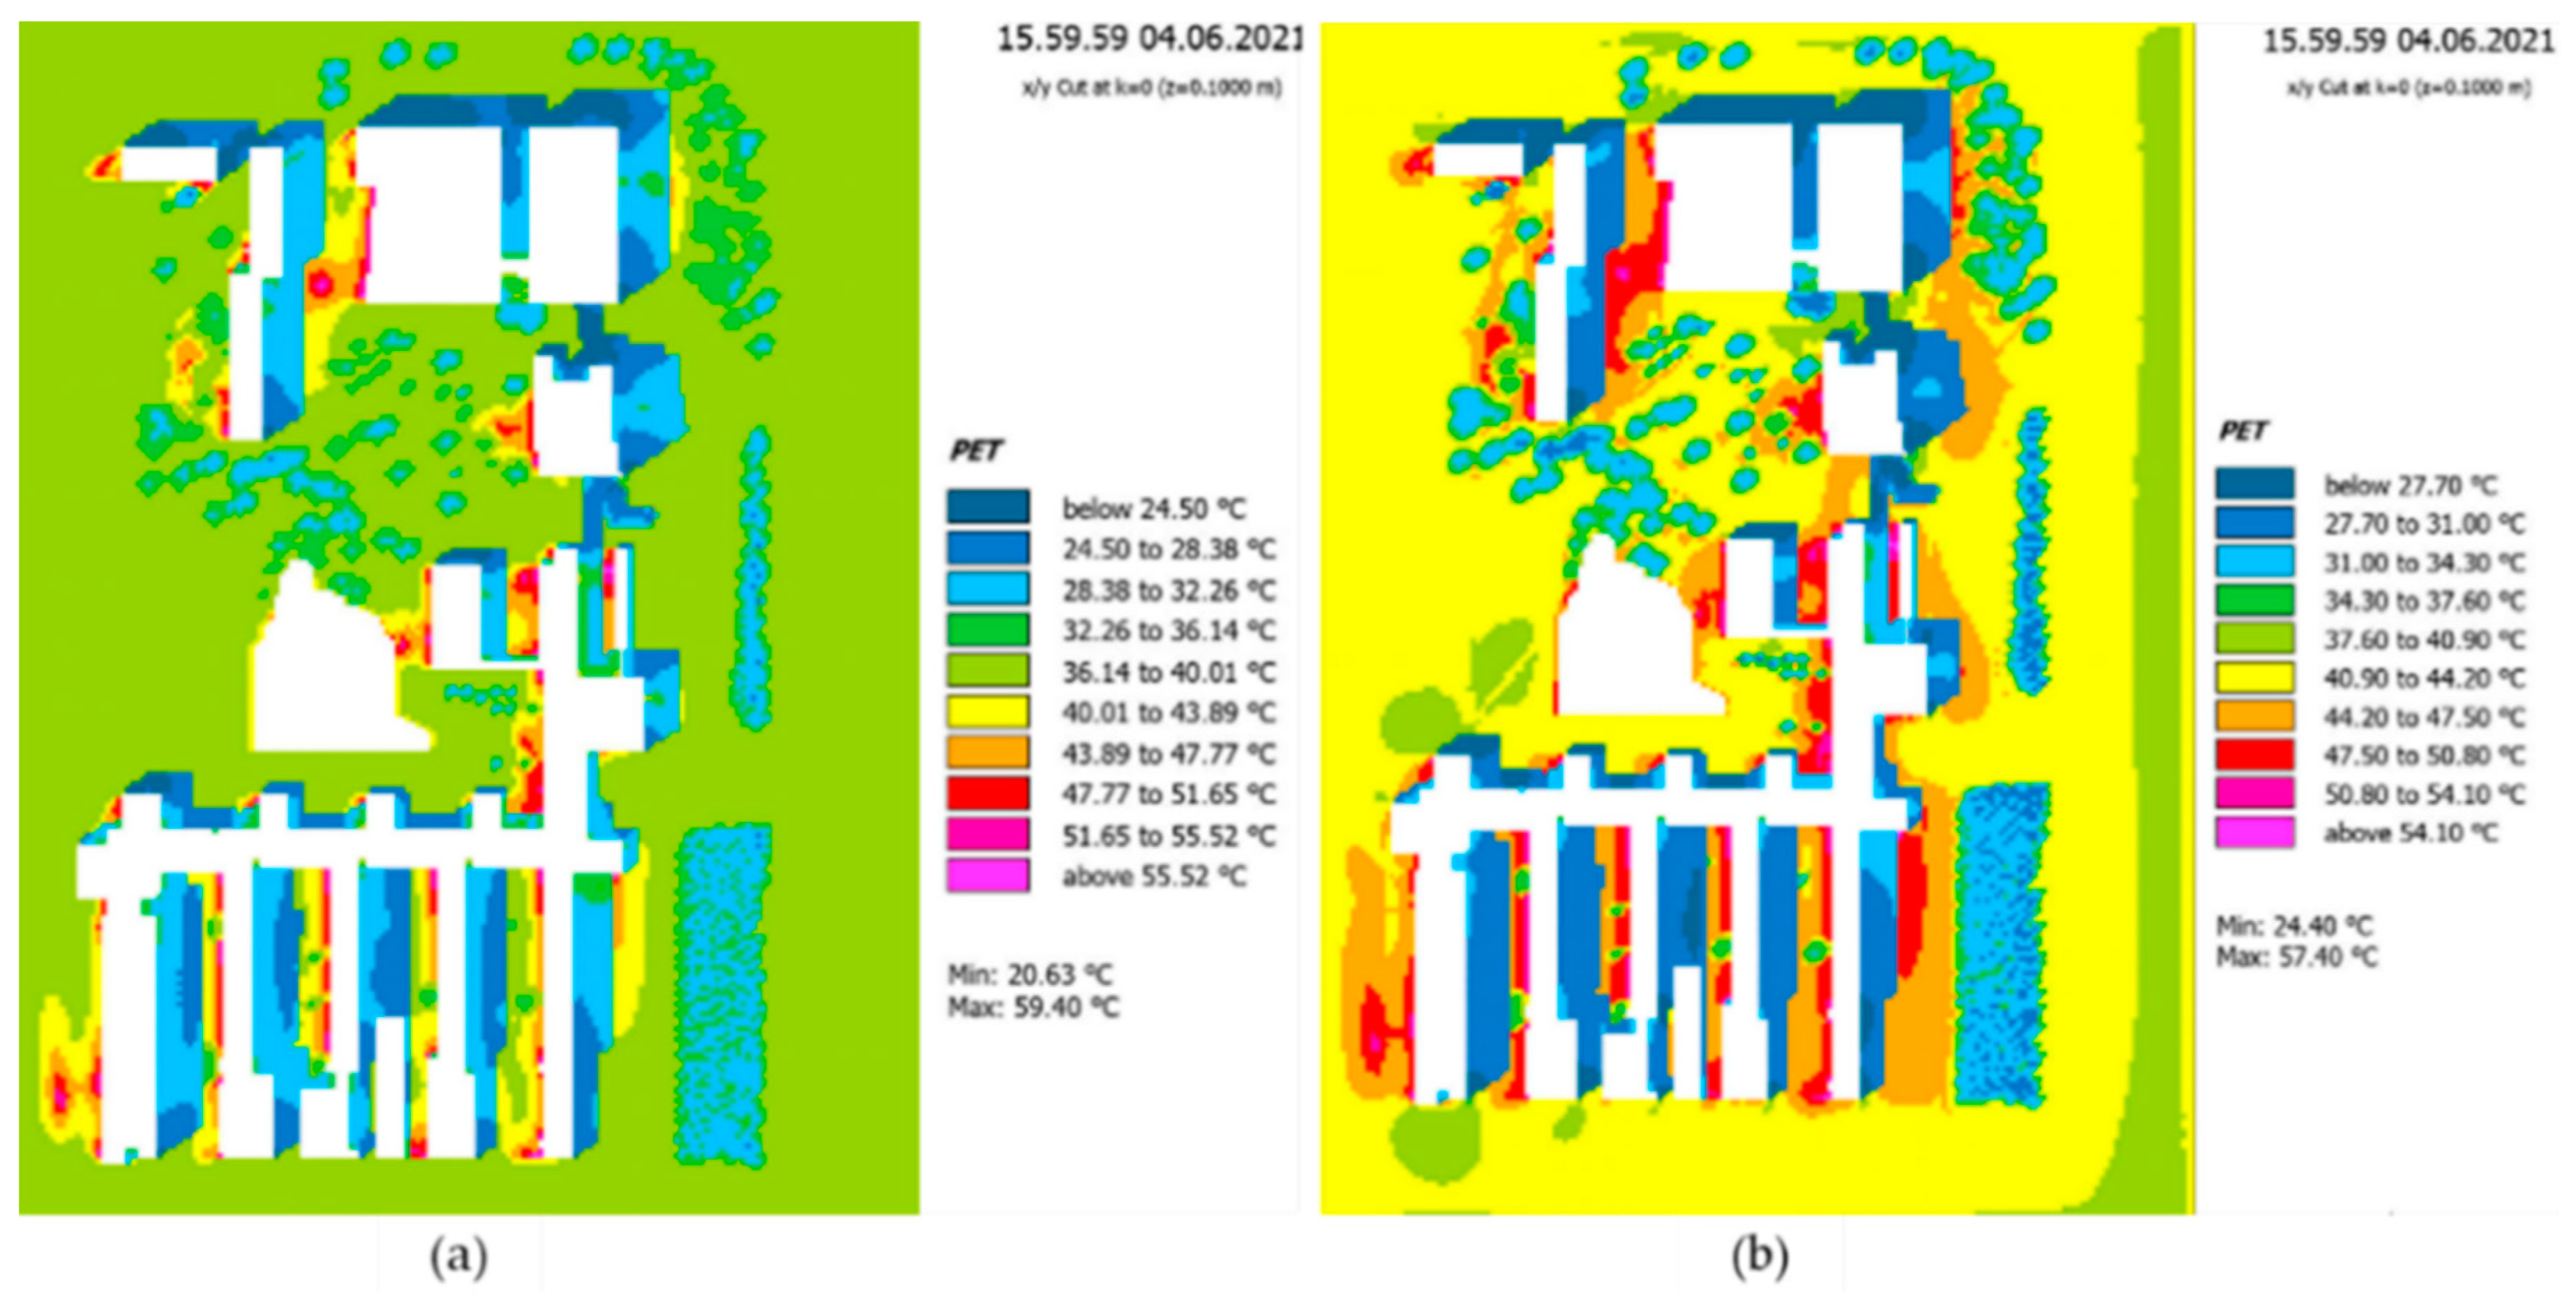
- The analysis of non-environmental variables that depend on people has shown that the choice of place where people are active sometimes depends not only on pleasant thermal conditions, but also on other characteristics of the place, such as visual enjoyment, openness, or enclosure and green spaces. It is like some sun-exposed areas that are not pleasant according to the thermal comfort analysis, but which people choose for their activities. It is the same reason with areas between buildings or car parks that are shaded by the surrounding buildings and provide optimal thermal conditions, but are not chosen by people as places to stay because the lack of green/semi-open areas, and urban furniture. Based on the mentioned findings, it seems that spatial planning for site renovation and improvement should focus on the physical aspects of the areas, taking into account people’s preferences to provide the enjoyable environment for visitors, while considering the thermal comfort of outdoor residents, e.g., by providing some shaded places. This concept covers part of Taltech’s strategic plan in the project called Green Transition.
Author Contributions
Funding
Institutional Review Board Statement
Informed Consent Statement
Data Availability Statement
Acknowledgments
Conflicts of Interest
Nomenclature
| CFD | Computational Fluid Dynamics |
| PET | Physiological Effective Temperature |
| PMV | Predicted Mean Vote Index |
| PPD | Predicted Percentage Dissatisfied Index |
| ISO | International Organization for Standardization |
| MEMI | Munich Energy-Balance Model for Individuals |
| UTCI | Universal Thermal Climate Index |
| TSV | Thermal Sensation Votes |
| BMI | Body Mass Index |
| ASHRAE OUT_SET | American Society of Heating, Refrigerating and Air-Conditioning Engineers Outdoor Standard Effective Temperature |
Appendix A
- How old are you?
- Which is your gender?
- [Female, Male, Transgender female, Transgender female, Gender variant/non-coforming,
- Not listed, Prefer not to answer]
- 3.
- Which is your level of education?
- 4.
- Which is your current occupation?
- 5.
- Which months do you consider as part of the summer in Estonia?
- [June, July, August]
- 6.
- How many summer periods have you been in Estonia?
- 7.
- How much is your height?
- 8.
- How much is your weight?
- 9.
- Do you have any physical disability? In affirmative case, which one?
- 10.
- Do you have any chronic disease? In affirmative case, which one?
- 11.
- Which outdoor activities do you usually practice during summer in Estonia?
- Swimming at lakes, Swimming at the sea, Go surfing, Go paddle, Go surfing, Go kitesurfing,
- Tennis, Table tennis, Hang-out, Read a book, Dancing, Cricket, Baseball, Go picnic, Go Camping, Running, Jogging, Walking, Hiking, Football, Basketball, Beach-volleyball, Combat sports, Badminton, Street workout, Skateboarding, Longboarding, (e-)scooter, Chilling out, Other(s)
- 12.
- Please select the level of these variables to create a perfect summer day in Estonia to practice any of your preferred outdoor activities mentioned in question 11 (UVi = UV index):
| Solar radiation | Low (UVi = 1–2) | Medium (UVi = 3–5) | High (UVi = 6–7) | Very high (UVi > 7) | I do not mind |
| Temperature (T) | Low T < 20 °C | Medium T = 20–25.9 °C | High T = 26–30 °C | Very high T > 30 °C | I do not mind |
| Relative humidity (RH) | Low (RH < 40%) | Medium (RH = 40–59.9%) | High (RH = 60–80%) | Very high (RH > 80%) | I do not mind |
| Precipitation | No rain | Light rain | Moderate rain | Heavy rain | I do not mind |
| Wind speed | No wind | Gentle breeze (<4 m/s) | Moderate wind (4–5 m/s) | Strong wind (>5 m/s) | I do not mind |
| Type of sky | Full overcast | Intermediate sky | Partially clear | Full clear sky | I do not mind |
- 13.
- In which months do you use the outdoor areas of the Taltech Campus?
- [June, July, August]
- 14.
- How far (in km) do you live from Taltech Campus?
- 15.
- In which areas of the Taltech campus do you often spend time? (Figure 7)
- 16.
- According to your opinion, which spot(s) of the TalTech Campus are the less attractive to spend time in? (Figure 7)
- 17.
- How many hours per week do you enjoy the outdoor areas of the Campus during summer?
- 18.
- Which outdoor activities do you practice within the Taltech Campus during summer in Estonia?
- Swimming at lakes, Swimming at the sea, Go surfing, Go paddle surfing, Go kitesurfing, Tennis, Table tennis, Hang-out, Read a book, Dancing, Cricket, Baseball, Go picnic, Go Camping, Running, Jogging, Walking, Hiking, Football, Basketball, Beach-volleyball, Combat sports, Badminton, Street workout, Skateboarding, Longboarding, (e-)scooter, Chilling out, Other(s)
- 19.
- Please, select the main limitations of the actual outdoor areas of the Taltech Campus:
- Green areas, Lack of tables and chairs, Places with privacy, Conditions of the ground, Conditions of the ground, Actual laces to sit are uncomfortable, Accessibility with different ways of transport, Lack of plugs/sockets, Dirty spots, Lack of enough shadow in certain spots, Lack of benches in certain spots, Other(s)
- 20.
- Please, leave in the following box any comment you would like to express:
References
- Chen, L.; Ng, E.Y.Y. Outdoor thermal comfort and outdoor activities: A review of research in the past decade. Cities 2012, 29, 118–125. [Google Scholar] [CrossRef]
- Eslamirad, N.; Mahdavinejad, M. Multi Objective Computing and Applying Expert System in Double Skin Façade system. In Proceedings of the e-Energy ‘18: The Ninth International Conference on Future Energy Systems, Karlsruhe, Germany, 12–15 June 2018; pp. 459–461. [Google Scholar] [CrossRef]
- Lai, D.; Zhou, C.; Huang, J.; Jiang, Y.; Long, Z.; Chen, Q. Outdoor space quality: A field study in an urban residential community in central China. Energy Build. 2014, 68, 713–720. [Google Scholar] [CrossRef]
- Gehl, J. Life between the Buildings: Using Public Space. Available online: http://www.krost-concern.ru/upload/life-between-buildings-1chapter.pdf (accessed on 15 February 2022).
- Lenzholzer, S.; Klemm, W.; Vasilikou, C. Qualitative methods to explore thermo-spatial perception in outdoor urban spaces. Urban Clim. 2018, 23, 231–249. [Google Scholar] [CrossRef] [Green Version]
- Ahmed, K.S. Comfort in urban spaces: Defining the boundaries of outdoor thermal comfort for the tropical urban environments. Energy Build. 2003, 35, 103–110. [Google Scholar] [CrossRef]
- Nikolopoulou, M.; Lykoudis, S. Thermal comfort in outdoor urban spaces: Analysis across different European countries. Build. Environ. 2006, 41, 1455–1470. [Google Scholar] [CrossRef] [Green Version]
- Wang, Z.; Wang, J.; He, Y.; Liu, Y.; Lin, B.; Hong, T. Dimension analysis of subjective thermal comfort metrics based on ASHRAE Global Thermal Comfort Database using machine learning. J. Build. Eng. 2019, 29, 101120. [Google Scholar] [CrossRef] [Green Version]
- Alur, R.; Deb, C. The significance of Physiological Equivalent Temperature (PET) in outdoor thermal comfort studies. Int. J. Eng. Sci. Technol. 2010, 2, 2825–2828. [Google Scholar]
- Luo, Y.; He, J.; Ni, Y. Analysis of urban ventilation potential using rule-based modeling. Comput. Environ. Urban Syst. 2017, 66, 13–22. [Google Scholar] [CrossRef]
- Eslamirad, N.; De Luca, F.; Lylykangas, K.S. The role of building morphology on pedestrian level comfort in Northern climate. J. Phys. Conf. Ser. 2021, 2042, 012053. [Google Scholar] [CrossRef]
- Li, K.; Zhang, Y.; Zhao, L. Outdoor thermal comfort and activities in the urban residential community in a humid subtropical area of China. Energy Build. 2016, 133, 498–511. [Google Scholar] [CrossRef]
- Taleghani, M.; Kleerekoper, L.; Tenpierik, M.; van den Dobbelsteen, A. Outdoor thermal comfort within five different urban forms in the Netherlands. Build. Environ. 2015, 83, 65–78. [Google Scholar] [CrossRef]
- Lai, D.; Guo, D.; Hou, Y.; Lin, C.; Chen, Q. Studies of outdoor thermal comfort in northern China. Build. Environ. 2014, 77, 110–118. [Google Scholar] [CrossRef]
- Shaw, E. Thermal Comfort: Analysis and applications in environmental engineering, by P. O. Fanger. 244 pp. DANISH TECHNICAL PRESS. Copenhagen, Denmark, 1970. Danish Kr. 76, 50. R. Soc. Health J. 1972, 92, 164. [Google Scholar] [CrossRef]
- d’Ambrosio Alfano, F.R.; Olesen, B.W.; Palella, B.I.; Povl, O.F. Impact Ten Years Later. Energy Build. 2017, 152, 243–249. [Google Scholar] [CrossRef] [Green Version]
- Taleghani, M.; Tenpierik, M.; Kurvers, S.; van den Dobbelsteen, A. A review into thermal comfort in buildings. Renew. Sustain. Energy Rev. 2013, 26, 201–215. [Google Scholar] [CrossRef]
- ASHRAE Standard. Thermal Environmental Conditions for Human Occupancy; ANSI/ASHRAE Standard 55-2004 (Supersedes ANSI/ASHRAE Standard 55-1992); American Society of Heating, Refrigerating and Air-Conditioning Engineers, Inc.: Atlanta, GA, USA, 1791; Available online: http://www.ashrae.org (accessed on 15 February 2022).
- Havenith, G.; Holmér, I.; Parsons, K. Personal factors in thermal comfort assessment: Clothing properties and metabolic heat production. Energy Build. 2002, 34, 581–591. [Google Scholar] [CrossRef]
- Lin, T.-P. Thermal perception, adaptation and attendance in a public square in hot and humid regions. Build. Environ. 2009, 44, 2017–2026. [Google Scholar] [CrossRef]
- Ng, E.Y.Y.; Cheng, V. Urban human thermal comfort in hot and humid Hong Kong. Energy Build. 2012, 55, 51–65. [Google Scholar] [CrossRef]
- Kántor, N.; Égerházi, L.A.; Unger, J. Subjective estimation of thermal environment in recreational urban spaces—Part 1: Investigations in Szeged, Hungary. Int. J. Biometeorol. 2012, 56, 1075–1088. [Google Scholar] [CrossRef]
- Krüger, E.; Drach, P.; Emmanuel, R.; Corbella, O. Assessment of daytime outdoor comfort levels in and outside the urban area of Glasgow, UK. Int. J. Biometeorol. 2012, 57, 521–533. [Google Scholar] [CrossRef]
- Höppe, P. Different aspects of assessing indoor and outdoor thermal comfort. Energy Build. 2002, 34, 661–665. [Google Scholar] [CrossRef]
- Fiala, D.; Havenith, G.; Bröde, P.; Kampmann, B.; Jendritzky, G. UTCI-Fiala multi-node model of human heat transfer and temperature regulation. Int. J. Biometeorol. 2011, 56, 429–441. [Google Scholar] [CrossRef] [PubMed] [Green Version]
- Nikolopoulou, M.; Baker, N.; Steemers, K. Thermal comfort in outdoor urban spaces: Understanding the human parameter. Sol. Energy 2001, 70, 227–235. [Google Scholar] [CrossRef]
- Knez, I.; Thorsson, S.; Eliasson, I.; Lindberg, F. Psychological mechanisms in outdoor place and weather assessment: Towards a conceptual model. Int. J. Biometeorol. 2008, 53, 101–111. [Google Scholar] [CrossRef] [PubMed]
- Böcker, L.; Dijst, M.; Faber, J. Weather, transport mode choices and emotional travel experiences. Transp. Res. Part A Policy Pract. 2016, 94, 360–373. [Google Scholar] [CrossRef]
- Eliasson, I.; Knez, I.; Westerberg, U.; Thorsson, S.; Lindberg, F. Climate and behaviour in a Nordic city. Landsc. Urban Plan. 2007, 82, 72–84. [Google Scholar] [CrossRef]
- Klemm, W.; Heusinkveld, B.G.; Lenzholzer, S.; van Hove, B. Street greenery and its physical and psychological impact on thermal comfort. Landsc. Urban Plan. 2015, 138, 87–98. [Google Scholar] [CrossRef]
- Mahmoud, A. Analysis of the microclimatic and human comfort conditions in an urban park in hot and arid regions. Build. Environ. 2011, 46, 2641–2656. [Google Scholar] [CrossRef]
- Zachariáš, J.; Stathopoulos, T.; Wu, H. Microclimate and Downtown Open Space Activity. Environ. Behav. 2001, 33, 296–315. [Google Scholar] [CrossRef]
- Nikolopoulou, M.; Steemers, K. Thermal comfort and psychological adaptation as a guide for designing urban spaces. Energy Build. 2003, 35, 95–101. [Google Scholar] [CrossRef]
- De Luca, F.; Naboni, E.; Lobaccaro, G. Tall buildings cluster form rationalization in a Nordic climate by factoring in indoor-outdoor comfort and energy. Energy Build. 2021, 238, 110831. [Google Scholar] [CrossRef]
- Attaianese, E.; Alfano, F.R.D.; Palella, B.I.; Pepe, D.; Vanacore, R. An Integrated Methodology of Subjective Investigation for a Sustainable Indoor Built Environment. The Case Study of a University Campus in Italy. Atmosphere 2021, 12, 1272. [Google Scholar] [CrossRef]
- Nazarian, N.; Sin, T.; Norford, L. Numerical modeling of outdoor thermal comfort in 3D. Urban Clim. 2018, 26, 212–230. [Google Scholar] [CrossRef]
- Wania, A.; Bruse, M.; Blond, N.; Weber, C. Analysing the influence of different street vegetation on traffic-induced particle dispersion using microscale simulations. J. Environ. Manag. 2012, 94, 91–101. [Google Scholar] [CrossRef] [PubMed]
- Peel, M.C.; Finlayson, B.L.; McMahon, T.A. Updated world map of the Köppen-Geiger climate classification. Hydrol. Earth Syst. Sci. 2007, 11, 1633–1644. [Google Scholar] [CrossRef] [Green Version]
- De Luca, F. Outdoor Comfort Analysis in a University Campus during the Warm Season and Parametric Design of Mitigation Strategies for Resilient Urban Environments. Computer-Aided Architectural Design, “Design Imperatives: The Future is Now”. In Proceedings of the 19th International Conference CAAD Futures 2021, University of Southern California, Los Angeles, CA, USA, 16–18 July 2021. [Google Scholar]
- Available online: https://www.wunderground.com/history/monthly/ee/tallinn/EETN/date/2021-6 (accessed on 7 June 2021).
- Taltech, Nzeb. Available online: https://taltech.ee/en/nzeb-technological-test-facility (accessed on 15 February 2022).
- Chen, Y.-C.; Lin, T.-P.; Matzarakis, A. Comparison of mean radiant temperature from field experiment and modelling: A case study in Freiburg, Germany. Arch. Meteorol. Geophys. Bioclimatol. Ser. B 2014, 118, 535–551. [Google Scholar] [CrossRef]
- Mills, J.; Birks, M. Qualitative Methodology: A Practical Guide; SAGE Publications, Inc.: Thousand Oaks, CA, USA, 2014; ISBN 9781446248980. [Google Scholar] [CrossRef] [Green Version]
- Available online: https://www.wunderground.com/history/monthly/ee/tallinn/EETN/date/2021-6-7 (accessed on 15 February 2022).
- Braun, V.; Clarke, V. Using thematic analysis in psychology. Qual. Res. Psychol. 2006, 3, 77–101, ISSN 1478-0887. [Google Scholar] [CrossRef] [Green Version]
- Berkovic, S.; Yezioro, A.; Bitan, A. Study of thermal comfort in courtyards in a hot arid climate. Sol. Energy 2012, 86, 1173–1186. [Google Scholar] [CrossRef]
- Gao, N.; Shao, W.; Rahaman, M.S.; Zhai, J.; David, K.; Salim, F.D. Transfer learning for thermal comfort prediction in multiple cities. Build. Environ. 2021, 195, 107725. [Google Scholar] [CrossRef]
- Mehta, H.; Kanani, P.; Lande, P. Google Maps. Int. J. Comput. Appl. 2019, 178, 41–46. [Google Scholar] [CrossRef]
- Blazejczyk, K. New climatological-and-physiological model of the human heat balance outdoor (MENEX) and its applications in bioclimatological studies in different scales. Zesz. IgiPZ PAN 1994, 28, 27–58. [Google Scholar]
- Available online: https://www.engineeringtoolbox.com/clo-clothing-thermal-insulation-d_732.html (accessed on 16 November 2021).
- Rawal, R.; Manu, S.; Shukla, Y.; Thomas, L.E.; de Dear, R. Clothing insulation as a behavioural adaptation for thermal comfort in Indian office buildings. In Proceedings of the 9th Windsor Conference: Making Comfort Relevant, Windsor, UK, 7–10 April 2016; pp. 403–415. [Google Scholar]
- Alfano, F.R.D.; Palella, B.I.; Riccio, G.; Malchaire, J. On the Effect of Thermophysical Properties of Clothing on the Heat Strain Predicted by PHS Model. Ann. Occup. Hyg. 2015, 60, 231–251. [Google Scholar] [CrossRef] [PubMed]


| PET (°C) | Thermal Perception (Internal Heat Production: 80 W, Heat Transfer Resistance of the Clothing: 0.9) | Grade of Physiological Stress |
|---|---|---|
| 4 | Very Cold | Extreme cold stress |
| Cold | Strong cold stress | |
| 8 | ||
| Cool | Moderate cold stress | |
| 13 | ||
| Slightly cool | Slight cold stress | |
| 18 | ||
| Comfortable | No thermal stress | |
| 23 | ||
| Slightly warm | Slightly heat stress | |
| 29 | ||
| Warm | Moderate heat stress | |
| 35 | ||
| Hot | Strong heat stress | |
| 41 | ||
| Very hot | Extreme heat stress |
| Block | Questions and Follow-Up Questions |
|---|---|
| I: Personal background |
|
| II: Introduction to the topic |
|
| III: Outdoor habits during summer |
|
| IV: Preferred climate conditions during summer |
|
| V: Thermal comfort during summer in Taltech Campus |
|
| Thematic Block | Requested Information |
|---|---|
| Personal background | Place of birth, age, gender, level of education, current occupation, height, weight, physical disability, chronic disease, number of summer periods in Estonia, summer months. |
| Preferred summer weather conditions | Outdoor activities in summer, preferred level of: solar radiation, temperature, relative humidity, precipitation, wind speed, and sky type. |
| Taltech Campus | Use months, distance from home, used outdoor areas, less attractive outdoor areas, weekly hours spent in outdoor areas, practised outdoor activities in the campus, main limitation of the actual outdoor areas. |
| Value | BMI (kg/m2) | Weight (kg) | Height (m) | Profile ID |
|---|---|---|---|---|
| Minimum | 17.99 | 52 | 1.70 | 1 |
| Q1 | 20.10 | 67 | 1.83 | 2 |
| Q2 | 23.52 | 68 | 1.70 | 3 |
| Q3 | 25.78 | 83 | 1.79 | 4 |
| Maximum | 31.55 | 101 | 1.79 | 5 |
| Date | Air Dry Bulb Temperature (°C) | Solar Radiation (UV-Index) | Wind Speed (m/s) | Wind Direction (°) | RH (%) | Precipitation (Yes/No) | Sky Type |
|---|---|---|---|---|---|---|---|
| 4 June | 20–22 | 5 | 3.3 | 90 | 46–75 | No | Passing clouds |
| 7 June | 21–23 | 5.2 | 4.2 | 90 | 48–77 | No | Passing clouds |
| 10 June | 22–23 | 5.5 | 4. 2 | 90 | 46–82 | No | Passing clouds |
| 11 June | 24–25 | 5.7 | 3.9 | 90 | 35–85 | No | Passing clouds |
| Class | Metabolic Rate (W/m2) | Example | Outdoor Activities (Number of Times Selected) | Selected Times |
|---|---|---|---|---|
| Resting | 65 | Resting | Chilling out in outdoor areas (14), read a book (6) | 20 |
| Low | 100 | Sitting at ease/standing | Go picnic (9), e-scooter (3) | 12 |
| Moderate | 165 | Sustained hand/arm work | Hang out (18), walking (18), go camping (1) | 37 |
| High | 230 | Intense work | Jogging (8), hiking (3), table tennis (2), cycling (1) | 14 |
| Very high | 290 | Very intense to maximum activity | Running (5), beach-volleyball (1), badminton (1) street workout (3), basketball (3), orienteering (1) | 14 |
| Personal Data of Samples | Average PET (°C) in the Campus Area | ||||||||
|---|---|---|---|---|---|---|---|---|---|
| Campus Microclimatic Data | Tallinn Climatic Data | ||||||||
| Case ID | Weight (kg) | Height (m) | Metabolic Rate (W/m2) | Icl (clo) | 4 June | 7 June | 10 June | 11 June | 11 June |
| p1m1c1 | 52 | 1.70 | 65 | 0.1 | 43 | 44 | 30.2 | 47.2 | 43.9 |
| p2m1c1 | 67 | 1.83 | 65 | 0.1 | 36 | 38.2 | 49.8 | 40.1 | 43.6 |
| p3m1c1 | 68 | 1.70 | 65 | 0.1 | 42.3 | 42.7 | 40.3 | 48.2 | 44.1 |
| p4m1c1 | 83 | 1.79 | 65 | 0.1 | 31.3 | 41.7 | 41.3 | 44.8 | 44.2 |
| p5m1c1 | 101 | 1.79 | 65 | 0.1 | 35.7 | 37.1 | 29.3 | 37.2 | 43.8 |
| p1m2c1 | 52 | 1.70 | 165 | 0.1 | 39.3 | 38.7 | 38.7 | 39.9 | 28.6 |
| p2m2c1 | 67 | 1.83 | 165 | 0.1 | 40.1 | 37 | 38.5 | 37.6 | 29.2 |
| p3m2c1 | 68 | 1.70 | 165 | 0.1 | 29.5 | 35.6 | 39.4 | 39.7 | 40.3 |
| p4m2c1 | 83 | 1.79 | 165 | 0.1 | 45.6 | 38.4 | 39.1 | 36.3 | 40.3 |
| p5m2c1 | 101 | 1.79 | 165 | 0.1 | 38.8 | 39.1 | 29.7 | 39.6 | 39.5 |
| p1m1c2 | 52 | 1.70 | 65 | 0.5 | 39.4 | 33.8 | 39.1 | 46.6 | 42.2 |
| p2m1c2 | 67 | 1.83 | 65 | 0.5 | 42.6 | 40.1 | 44.5 | 45.9 | 37.9 |
| p3m1c2 | 68 | 1.70 | 65 | 0.5 | 33 | 37 | 27 | 46.4 | 29.8 |
| p4m1c2 | 83 | 1.79 | 65 | 0.5 | 43.6 | 37.9 | 25.4 | 45.8 | 42.9 |
| p5m1c2 | 101 | 1.79 | 65 | 0.5 | 33.7 | 30.4 | 39.7 | 47.7 | 42.9 |
| p1m2c2 | 52 | 1.70 | 165 | 0.5 | 38.8 | 38.3 | 38.3 | 39.2 | 40.1 |
| p2m2c2 | 67 | 1.83 | 165 | 0.5 | 36.4 | 36.4 | 30.5 | 37.5 | 38.4 |
| p3m2c2 | 68 | 1.70 | 165 | 0.5 | 30.1 | 37.6 | 29.6 | 30.6 | 39.9 |
| p4m2c2 | 83 | 1.79 | 165 | 0.5 | 38.3 | 31.7 | 39 | 39 | 39.4 |
| p5m2c2 | 101 | 1.79 | 165 | 0.5 | 38.4 | 37.8 | 35.2 | 38.6 | 41.3 |
| The Average PET Range | Type of Activity | Icl (clo) | Height (cm) | Weight (kg) | Dry Bulb Temperature (°C) | Wind Speed (m/s) | Relative Humidity (%) |
|---|---|---|---|---|---|---|---|
| Slightly warm (23–29 °C) | Resting | 0.5 | 170 | 68 | 22–23 | 4.17 | 46–82 |
| Resting | 0.5 | 179 | 83 | ||||
| Warm (29–35 °C) | Resting | 0.1 | 179 | 83 | 20–22 | 3.33 | 46–75 |
| Resting, sustained arm or hand work | 0.1, 0.5 | 170 | 68 | ||||
| Resting | 0.5 | 179 | 101 | ||||
| Resting | 0.5 | 170 | 52 | 21–23 | 4.16 | 48–77 | |
| Resting | 0.5 | 179 | 101 | ||||
| Sustained arm or hand work | 0.5 | 179 | 83 | ||||
| Resting, sustained arm or hand work | 0.1, 0.5 | 170 | 52, 68 | 22–23 | 4.17 | 46–82 | |
| Resting, sustained arm or hand work | 0.1, 0.5 | 179 | 101 | ||||
| Sustained arm or hand work | 0.5 | 183 | 67 | ||||
| Sustained arm or hand work | 0.5 | 170 | 68 | 24–25 | 3.88 | 35–85 | |
| Hot (35–41 °C) | Resting, sustained arm or hand work | 0.1, 0.5 | 183 | 67 | 20–22 | 3.33 | 46–75 |
| Resting, sustained arm or hand work | 0.1, 0.5 | 179 | 101 | ||||
| Resting, sustained arm or hand work | 0.1, 0.5 | 170 | 52 | ||||
| Sustained arm or hand work | 0.5 | 179 | 83 | ||||
| Resting, sustained arm or hand work | 0.1, 0.5 | 183 | 67 | 21–23 | 4.16 | 48–77 | |
| Resting, sustained arm or hand work | 0.1, 0.5 | 179 | 83, 101 | ||||
| Sustained arm or hand work | 0.1, 0.5 | 170 | 52 | ||||
| Sustained arm or hand work | 0.1, 0.5 | 170 | 68 | ||||
| Resting, sustained arm or hand work | 0.1 | 170 | 68 | 22–23 | 4.17 | 46–82 | |
| Sustained arm or hand work | 0.1 | 183 | 67 | ||||
| Sustained arm or hand work | 0.1, 0.5 | 179 | 83 | ||||
| Resting, sustained arm or hand work | 0.1, 0.5 | 170 | 52 | ||||
| Resting, sustained arm or hand work | 0.5 | 179 | 101 | ||||
| Resting, sustained arm or hand work | 0.1, 0.5 | 183 | 67 | 24–25 | 3.88 | 35–85 | |
| Resting, sustained arm or hand work | 0.1, 0.5 | 179 | 101 | ||||
| Sustained arm or hand work | 0.1, 0.5 | 170 | 52 | ||||
| Sustained arm or hand work | 0.1 | 170 | 68 | ||||
| Sustained arm or hand work | 0.1, 0.5 | 179 | 83 | ||||
| Very hot (>41 °C) | Resting | 0.1 | 170 | 52, 68 | 20–22 | 3.33 | 46–75 |
| Resting, sustained arm or hand work | 0.1, 0.5 | 179 | 83 | ||||
| Resting | 0.5 | 183 | 67 | ||||
| Resting | 0.1 | 170 | 52, 68 | 21–23 | 4.16 | 48–77 | |
| Resting | 0.1 | 179 | 83 | ||||
| Resting | 0.1, 0.5 | 183 | 67 | ||||
| Resting | 0.1, 0.5 | 170 | 52, 68 | 24–25 | 3.88 | 35–85 | |
| Resting | 0.1, 0.5 | 179 | 83 | ||||
| Resting | 0.5 | 179 | 101 | ||||
| Resting | 0.5 | 183 | 67 |
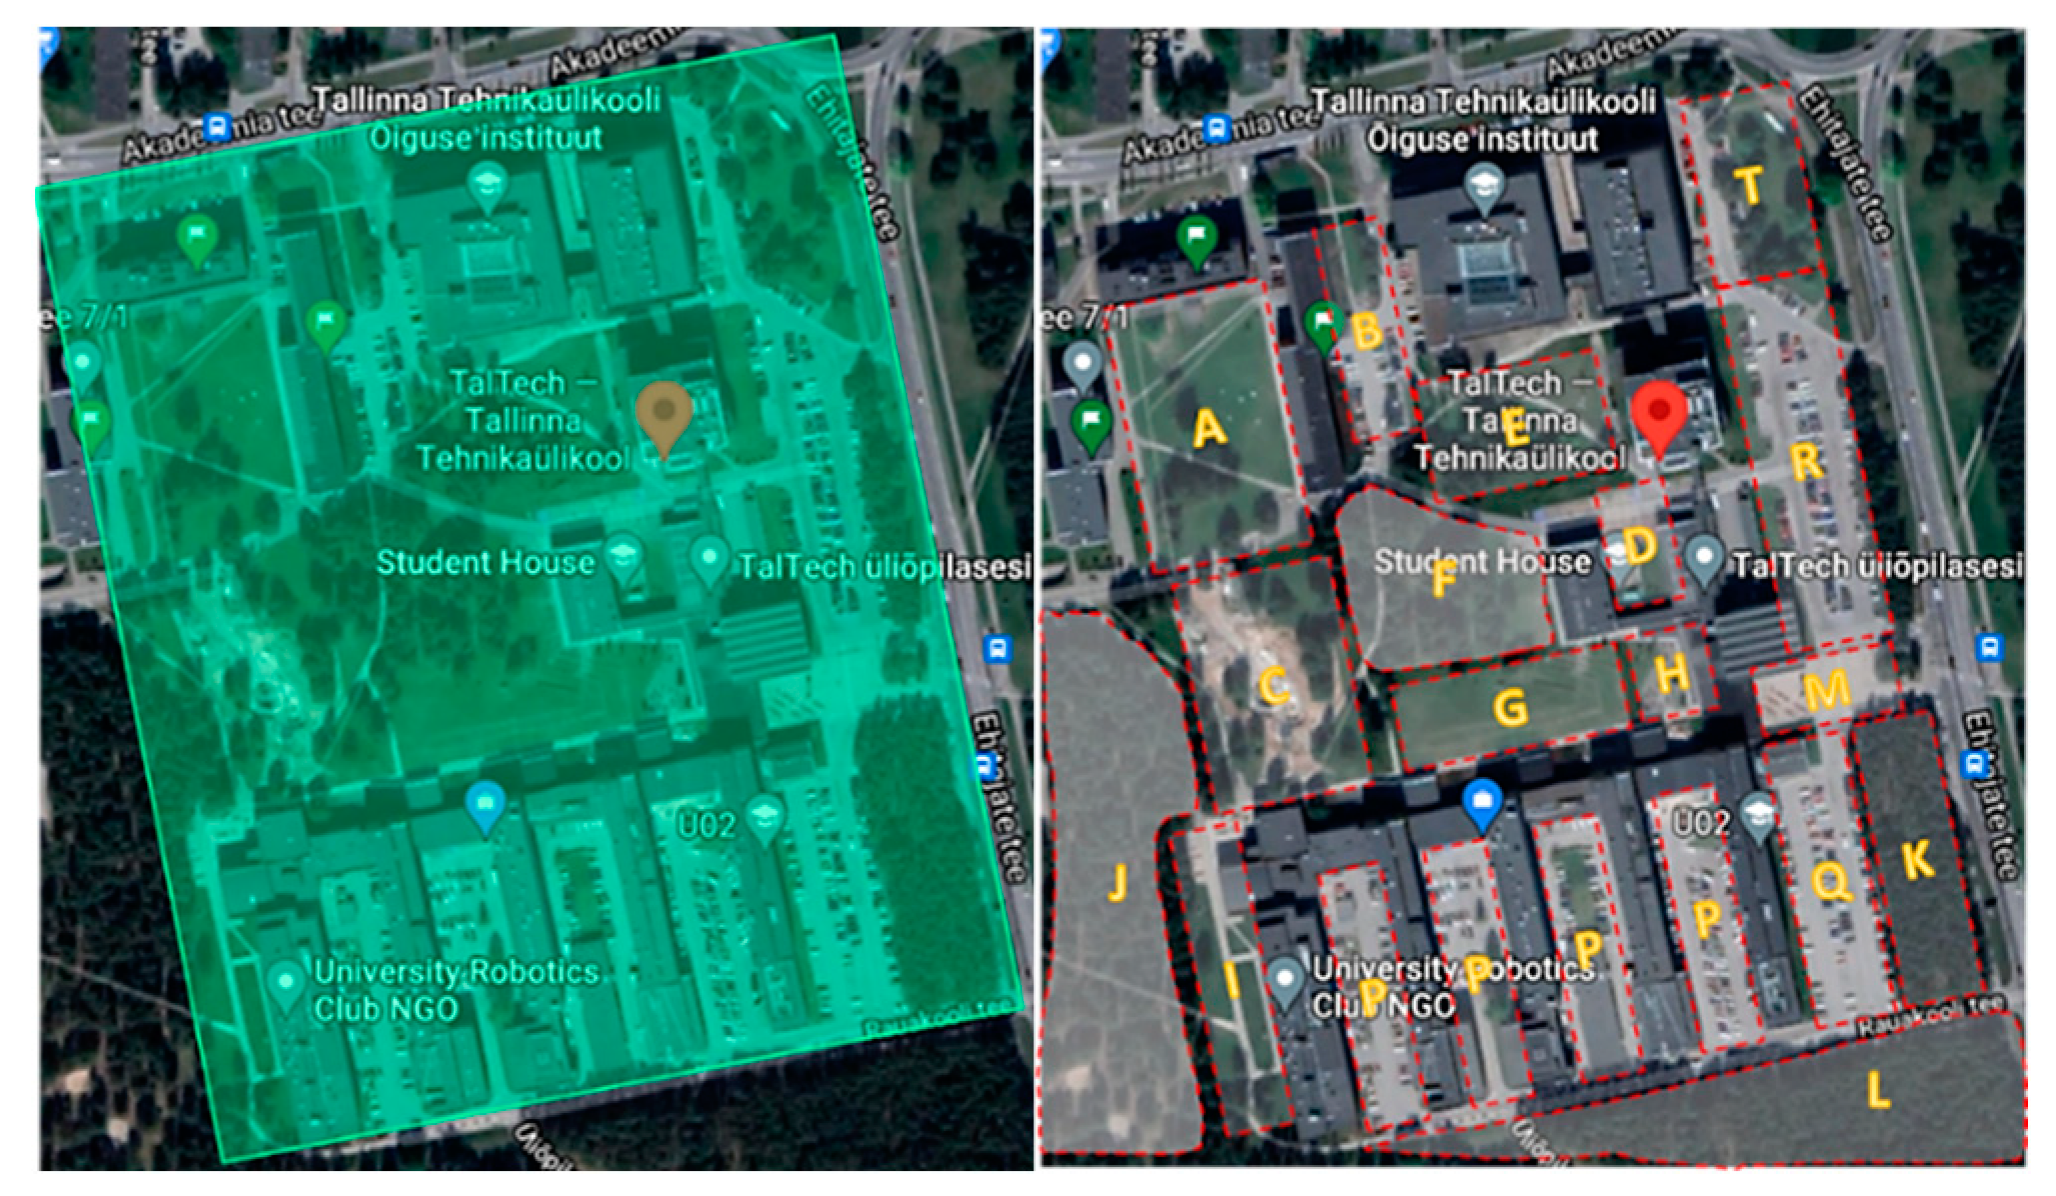
| Name | The Major Elements | Possible Activities (Based on PET Evaluation) | Main Plants | Comfort Lable |
|---|---|---|---|---|
| A | Green area | Chilling out, reading | Grass, trees | Non-comfort |
| B | pavement | Hang out, walking, camping | Grass, bushes | Comfort |
| C | Green area, pavement | Chilling out, reading | Grass, bushes | Non-comfort |
| D | Green area, pavement | Hang out, walking, camping | Grass, pavement | Non-comfort |
| E | Green area | Chilling out, reading | Grass, bushes, trees | Comfort |
| F | Green area | Hang out, walking, camping | Grass, bushes, trees | Non-comfort |
| G | Green area | Chilling out, reading | Grass | Comfort |
| H | Green area, pavement | Hang out, walking, camping | Grass | Comfort |
| I | Green area, pavement | Chilling out, reading | Grass | Non-comfort |
| K | Green area | Hang out, walking, camping | Grass, trees | |
| L | Pavement, street | Chilling out, reading | - | Non-comfort |
| M | Pavement, parking lot | Hang out, walking, camping | - | Comfort |
| Q | Pavement, parking lot, green area | Hang out, walking, camping | - | Comfort |
| P | Pavement, parking lot, green area | Hang out, walking, camping | Grass, tress | Comfort |
Publisher’s Note: MDPI stays neutral with regard to jurisdictional claims in published maps and institutional affiliations. |
© 2022 by the authors. Licensee MDPI, Basel, Switzerland. This article is an open access article distributed under the terms and conditions of the Creative Commons Attribution (CC BY) license (https://creativecommons.org/licenses/by/4.0/).
Share and Cite
Eslamirad, N.; Sepúlveda, A.; De Luca, F.; Sakari Lylykangas, K. Evaluating Outdoor Thermal Comfort Using a Mixed-Method to Improve the Environmental Quality of a University Campus. Energies 2022, 15, 1577. https://doi.org/10.3390/en15041577
Eslamirad N, Sepúlveda A, De Luca F, Sakari Lylykangas K. Evaluating Outdoor Thermal Comfort Using a Mixed-Method to Improve the Environmental Quality of a University Campus. Energies. 2022; 15(4):1577. https://doi.org/10.3390/en15041577
Chicago/Turabian StyleEslamirad, Nasim, Abel Sepúlveda, Francesco De Luca, and Kimmo Sakari Lylykangas. 2022. "Evaluating Outdoor Thermal Comfort Using a Mixed-Method to Improve the Environmental Quality of a University Campus" Energies 15, no. 4: 1577. https://doi.org/10.3390/en15041577