1. Introduction
With the development of modern rammed earth (RE) technology, earthen buildings have returned to being a topic of active interest. RE is perceived as sustainable due to its recyclability and low embodied energy, which is 15% to 25% of the cost of the same volume of burnt clay brickwork [
1]. Moreover, the production of RE materials can effectively reduce the amount of energy consumed for manufacturing and transportation, which accounts for about 35% of the embedded energy for building materials [
2,
3]. RE buildings are warm in winter and cool in summer, maintaining the thermal stability of the building’s internal environment and reducing energy consumption for cooling and heating [
4]. This is because RE constructions are typically 300 mm to 600 mm thick [
5] and can provide a large thermal mass compared to ordinary concrete blocks [
4], leading to a time lag between the indoor temperature wave peak on hot summer days and reducing the impact of periodic outdoor temperature waves on the indoor environment [
6,
7]. Furthermore, with their high thermal capacity and density, RE constructions absorb and retain heat from the environment during the day and release that heat back into the internal space during cool nights [
8].
Although many benefits could be gained through the use of RE construction, the process has its shortcomings. Surveys conducted by Paul and Taylor found that RE construction alone cannot guarantee thermal comfort or energy conservation in cold areas because RE buildings do not necessarily provide better thermal performance than do conventional buildings unless the external walls are sufficiently thick and properly insulated [
9,
10,
11,
12]. In previous research, Adams and Jones [
13] tested the thermal conductivity of stabilized RE bricks and found that thermal conductivity increased exponentially with dry density. Goodhew and Griffiths [
14] made measurements of different types of RE constructions using an innovative thermal probe technique. Soebarto [
4] conducted temperature tests on uninsulated raw earth dwellings and found that the indoor ambient temperature was only 8–12.5 °C during the cold season, making indoor thermal comfort undesirable. Some researchers used slag, water glass, and plant fibers to optimize the thermal performance of RE materials [
15,
16,
17,
18,
19,
20,
21], but the range of thermal conductivity of RE materials was 0.3634 to 0.7838 W/(m K) [
18,
22,
23], which does not meet the regulatory requirements in China for cold areas. Though some other scholars have improved the thermal performance of RE buildings by combining them with passive designs such as glazing, shading, and ventilation, yielding positive effects on building energy consumption [
24,
25], the poor thermal insulation of RE materials is a problem yet to be solved. Researchers such as Taylor, Hall, and others have studied the heat transfer of insulated RE constructions [
13], effectively solving the problem of poor thermal performance. However, their research conclusions were not given in terms of specific design strategies for composite RE walls in particular climates.
The advantages in terms of heat storage offered by RE construction are well studied, but the disadvantages of insulation have to date been relatively ignored. The current state of research on insulation can be broadly divided into two groups. On the one hand, some scholars have used additives to improve the thermal performance of RE, though it is still unable to meet the requirements of national codes. On the other hand, researchers have adopted passive technology and composite insulation earth walls, but there is as yet no quantitative design strategy. The review studies show that few scholars have carried out thermal performance optimization studies on RE constructions based on the relationship between thermal mass and thermal insulation. Therefore, in this research, a design strategy for composite RE construction was studied and optimized. To find a balance between thermal mass and insulation in RE construction, this study proposes a comprehensive evaluation method. The thickness of the construction layers is also described herein, in combination with the code and simulation tools. Finally, the newly proposed design strategy was assessed for risk and specific strategies applicable to Beijing; both are described below.
This research optimized the structural layers of composite RE walls and developed quantitative design strategies for the thicknesses of different layers most suitable to the Beijing area. The authors hope that the research findings will provide a basis and reference for the future design application of RE construction in cold climate zones.
2. Research Methodology
To seek a balance between thermal performance and energy efficiency in RE construction, in the present research, the particle size distribution, density, specific heat capacity, thermal conductivity, and thermal storage coefficients of the soil were evaluated. ln conjunction with WUFI Pro and WUFI Plus, the connection between the thermal performance indexes of new raw soil materials was also analyzed, a comprehensive multi-index evaluation method was established, and appropriate thickness and construction forms for new RE walls in Beijing were derived (see
Figure 1) [
26].
2.1. Research Region
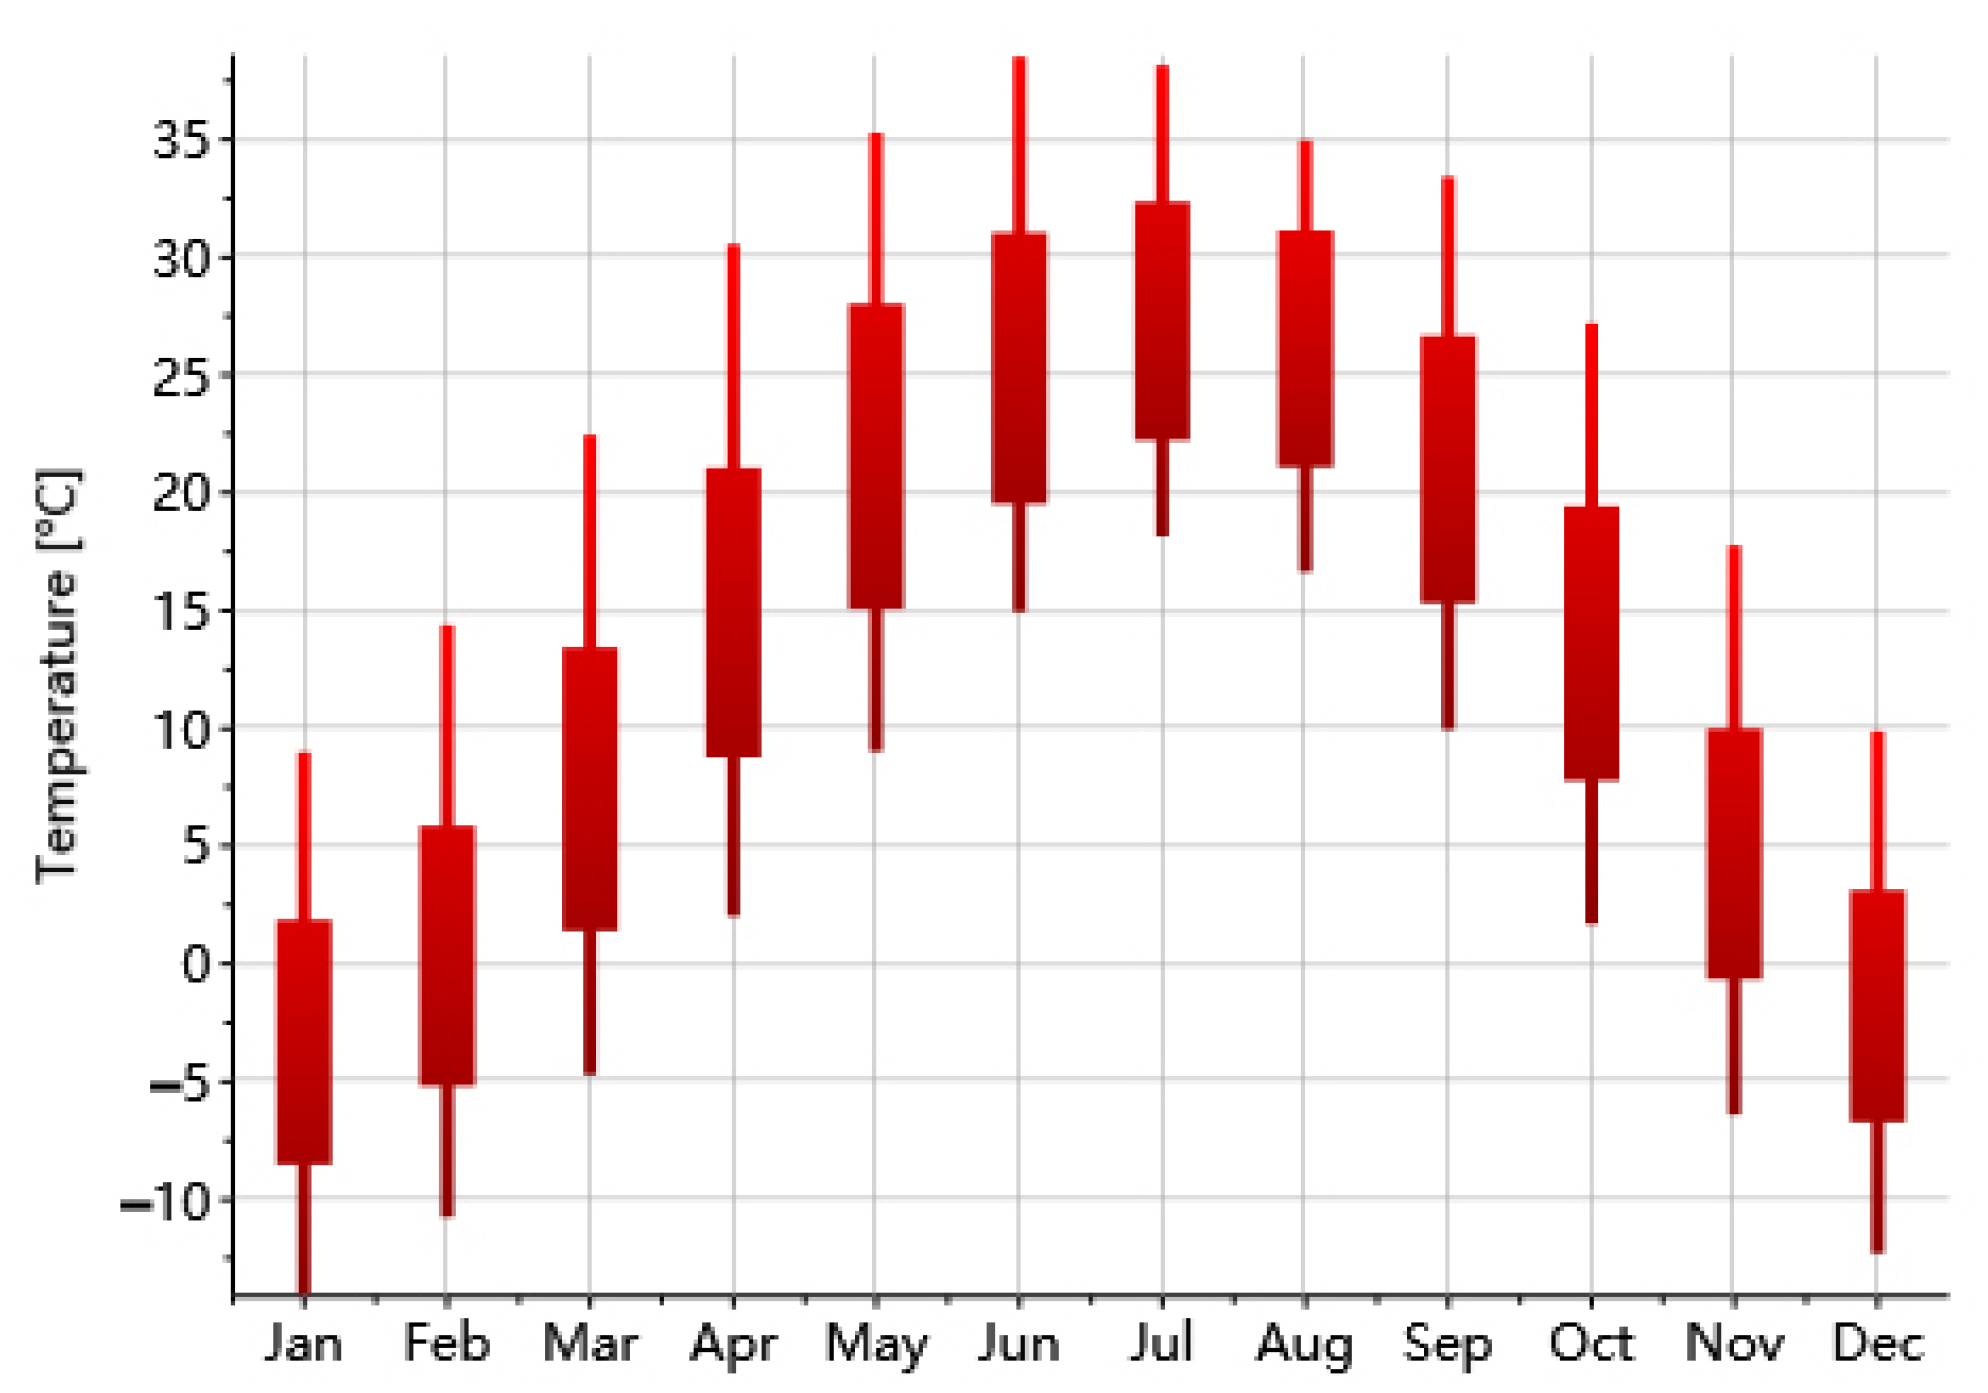
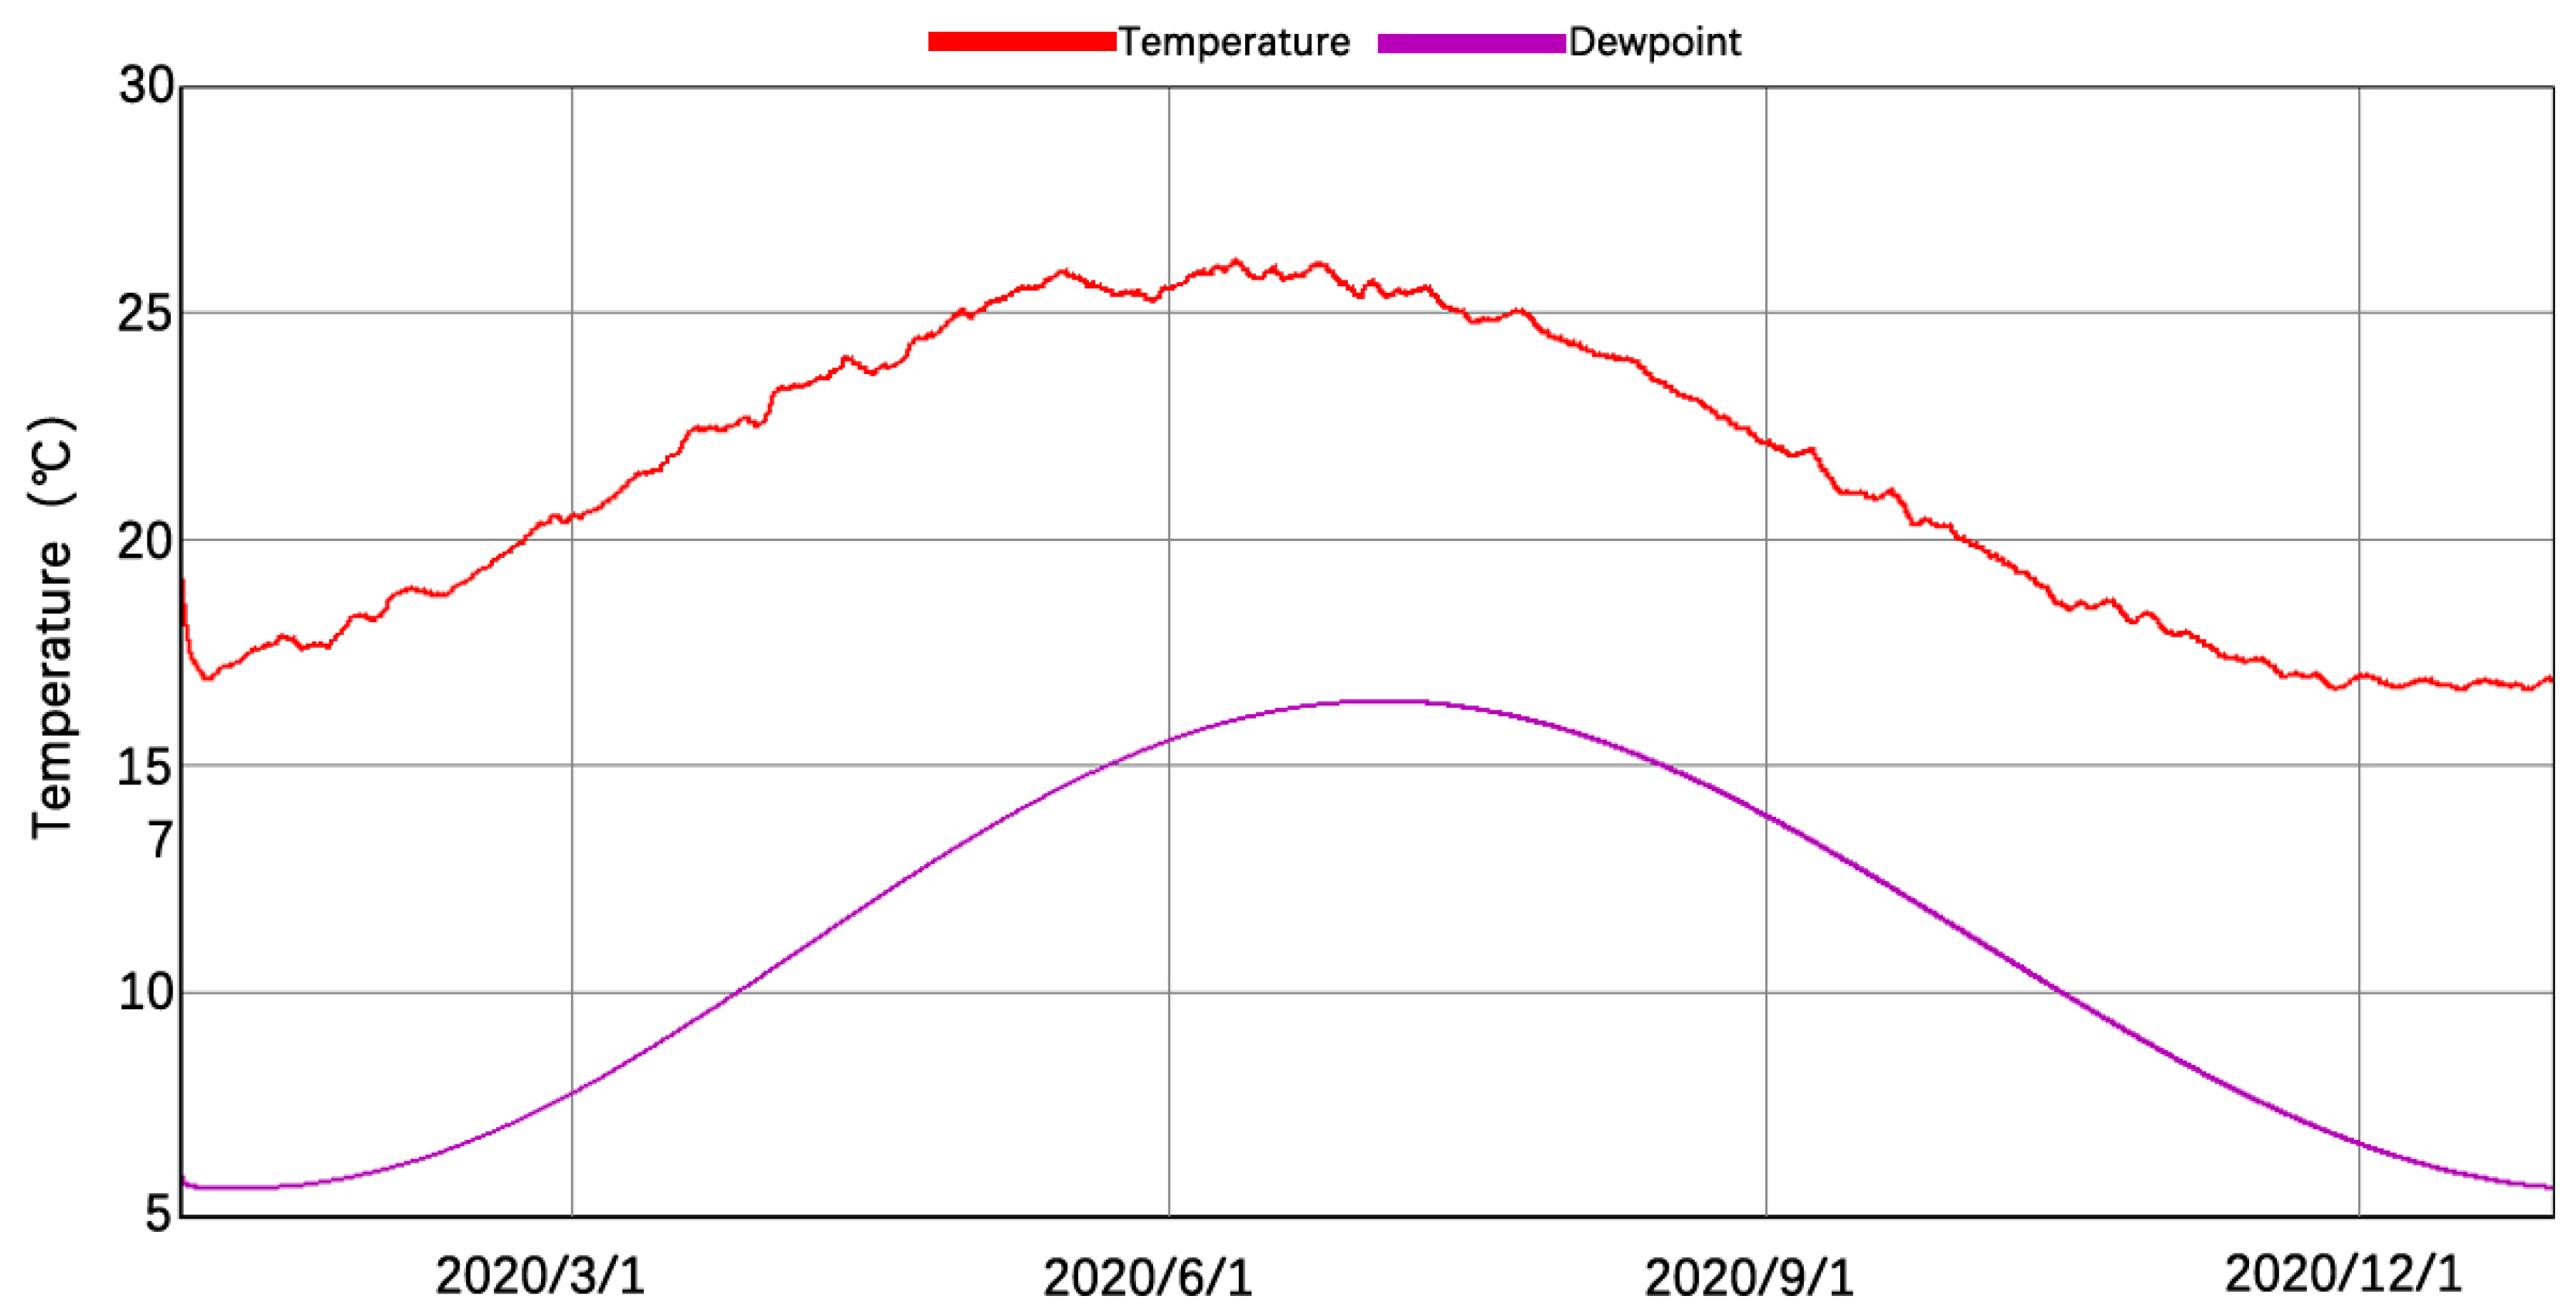
In this work, Beijing was selected as a typical city in the cold region of China. It is the nation’s capital and is located in the northern part of the North China Plain, backed by Yanshan Mountain and adjacent to Tianjin city and Hebei Province. According to an analysis of certain weather tools (see
Figure 2), the summer in Beijing is hot and the winter cold and dry. The annual average temperature is about 12.9 °C, requiring indoor heating for up to four months. Thus, in this region, building insulation is an important component of building energy savings.
2.2. Research Materials
Earthen materials taken from Erlitou, Luoyang, and Henan were screened according to the engineering classifications outlined in the “Test Methods of Soils for Highway Engineering” JTG 3430—2020 [
27]. Particle size was determined as shown in
Table 1. The experimental results showed that 90% of the earthen particles were less than 8 mm in diameter.
2.3. Parameter Testing
The ratio of the test blocks of soil, sand, and gravel was 5:3:2, and the size was 300 mm × 300 mm × 30 mm. A model DRCD-3030 flat thermal conductivity tester was used to test the thermal conductivity of the blocks according to the method specified in the “Thermal insulation—Determination of steady-state thermal resistance and related properties—heat flow meter apparatus” GB/T10295-2008 [
28]. The physical parameters of the text blocks were tested sequentially. The results are outlined below (see
Table 2).
2.4. Building Prototype
The scale of RE buildings in China is small, and the building shape coefficient generally does not exceed 0.3. This research used a demonstration project in Datong County, Qinghai Province, as a research prototype. An energy consumption model was established, and the impacts of different structural forms of composite RE walls on building energy demand were analyzed.
As seen in
Figure 3, the length, width, and height of the building were 12.9 m, 7.7 m, and 6.3 m, respectively. The height of the ground floor was 3.6 m and the first floor was 3.3 m. The exterior walls of the building were made of RE, and the interior walls were brick. In addition, structural columns were used to increase the seismic performance of the building.
2.5. Settings of WUFI Plus/Pro Models
The specifications of the base case model are seen in
Table 3 [
29].
3. Numerical Analysis
As a porous material, the internal heat transfer of RE construction comes in three types: heat conduction, convection heat transfer, and radiation heat transfer. Among these, radiation heat transfer is only obvious when the temperature difference between solids is substantial and the pores are occupied by gas. In the present research, the earthen material was regarded as isotropic porous, and the effect of moisture migration on heat transfer was neglected. The formulation is only presented as a factor correlation analysis.
3.1. Heat Transfer
According to the Fourier formula, the heat flow
qcond for heat conduction and transfer within an RE construction can be written as:
where
λ is the thermal conductivity of raw earth materials, (W/mK); W is the relative humidity; and
T is the temperature, °C. From Equation (1), it can be seen that the thermal conductivity of the material was related to the moisture content and temperature. Since the effect of temperature on the thermal conductivity of the material was very small, it was ignored here.
The convective heat flow
qconv within the RE construction includes both sensible and latent heat flows, expressed as follows:
where v is the airflow rate inside the wall, m/s;
air is the density of dry air, kg/m
3;
cair is the specific heat capacity of dry air, KJ/(kg·K); JV is the water vapor flow rate, m
3/s;
Lv is the evaporation/condensation enthalpy, kJ/kg; and
cv is the specific heat capacity of water vapor, KJ/(kg·K). As the airflow rate inside the earthen wall was very low, the water vapor sensible heat was neglected here, and Equation (2) can be simplified as:
where
δV is the water vapor penetration coefficient, kg/(m·s·Pa); and ∇
PV is the water vapor pressure, Pa. Combined with Equation (1), the heat transfer equation of the RE walls can then be described as in Equation (4):
Processing Equation (4) led to the following results:
From Equation (5), it was determined that the heat transfer of RE walls could be divided into two main parts, one caused by the parameters related to thermal insulation (λ) and the other related to thermal mass (LV). This led to the conclusion that it would be unscientific not to consider thermal mass when measuring the thermal performance of the walls.
3.2. Subfactors
As is commonly understood, thermal conductivity and the heat storage coefficient are used to evaluate the thermal insulation and mass of walls, where thermal conductivity affects the steady-state heat transfer of the wall as affected by the difference between indoor and outdoor temperatures, and the larger the thermal conductivity, the more unfavorable it is for the RE walls. The thermal storage coefficient positively affects the additional heat transfer caused by fluctuations of the outdoor environment. For the same material, the thermal conductivity thermal storage coefficients are constant. Thus, in the present research, it was necessary to convert the above two evaluation indicators into more detailed parameters to analyze how thermal insulation and mass affect building performance.
3.2.1. Thermal Insulation
This section reviews the related parameters of thermal insulation and mass in terms of their influence on the thermal performance of buildings. The relationship between the two was constructed in the form of the flow chart shown in
Figure 4. The thermal insulation performance of walls mainly depends on the resistance of the material; the greater the thermal resistance, the better the insulation performance. Wall insulation performance is also affected by environmental humidity, wind speed, and solar radiation, so the measurement parameters of wall insulation performance require the heat transfer coefficient, which takes into account both the physical properties of the material and impact of the climate on the thermal performance of building walls.
3.2.2. Thermal Mass
The factor most affecting thermal mass performance is the thermal storage coefficient. For the same wall materials, differences in thermal storage performance can be distinguished by the thermal inertia index, attenuation degree, and phase detention time. The greater the thermal inertia index and attenuation of the outdoor temperature wave, the longer the phase detention time and the better the thermal mass performance.
Therefore, using the wall thickness as the only variable, a comprehensive evaluation index was established to analyze the thermal performance of RE walls. Four parameters were employed: heat transfer coefficient, thermal inertia index, attenuation degree, and phase detention time.
3.3. Nondimensionalized Subfactors
To ensure the validity of the comprehensive evaluation index, it was necessary to reverse the value of a certain type of index through steered inversion, unifying the forms of all subfactors. In this research, we adopted the “quotient” transformation method to deal with the inverse indexes (U). After the transformation, all subfactors were isotropic, which was conducive to analyzing the composite index values. In addition, this section of the research adopted the mean value method for dimensionless evaluation indexes of RE walls to eliminate the adverse effects of the differences in physical meaning and scale units on the accuracy of evaluation results and to ensure comparability between subfactors.
4. Calculation and Analysis
As the thickness of the wall increases, the thermal insulation and mass increase. However, an increase in wall thickness seriously reduces the usable space and seismic performance of a building, especially since RE walls are heavy-weight structures. In real-world projects, it would be impractical to blindly increase the thickness of the exterior wall to improve the level of indoor thermal comfort. In the present research, WUFI Pro was used to dynamically simulate the heat and moisture transfer process of RE walls. Then, the variation tendency of the parameters (i.e., heat transfer coefficient, thermal inertia index, attenuation degree, and phase detention time) were fitted to the wall thickness to analyze the optimum effective thickness of the RE walls.
4.1. Thickness and Heat Transfer Coefficient
By analyzing the influential mechanism of wall heat transfer (as shown in
Figure 5), it can be seen that heat transfer in RE walls can be described according to two aspects. From the macroscopic perspective, heat conduction and transfer occurring inside the wall are influenced by the temperature and humidity of the environment within which the internal and external surfaces of the wall are located. From the microscopic perspective, there is convective heat transfer occurring inside the RE wall under the action of air and vapor pressure. These two wall heat transfer processes are also influenced by solar radiation, as well as radiative heat transfer between objects. Therefore, measuring the thermal insulation performance of walls only from the perspective of thermal resistance would not be rigorous enough to accurately quantify the heat transfer mechanism of real-world RE walls. WUFI Pro software (Department Hygrothermics at the Fraunhofer IBP, Holzkirchen, Germany) was used to simulate and calculate the heat transfer coefficients of different thicknesses of RE walls, based on the climatic parameters of the Beijing area.
The heat transfer coefficient was calculated as outlined above. The results are shown in
Table 4, which numerically illustrates the inverse function with thermal resistance.
The internal surface heat transfer resistance was taken to be Ri = 0.11 (m
2·K)/W, and the external surface heat transfer resistance (Re) was about 0.04 (m
2·K)/W [
30].
With an increase in thickness, the heat transfer coefficient decreases and the insulation performance of the wall improves. Based on these data, U = 112.9 × d^(−0.735) was obtained by fitting the heat transfer coefficient to the wall thickness. The influence factor of the heat transfer coefficient in the comprehensive evaluation index was about 0.7354. Moreover, to ensure the isotropy of the index, the heat transfer coefficient was converted using the quotient. The rotation parameters are shown in
Table 4.
4.2. Thickness and Heat Storage Coefficient
As illustrated in Equation (6), the magnitude of the thermal storage coefficient depends on the specific heat capacity, density, and thermal conductivity of the material. For the same material, the effect of wall thickness on the thermal storage performance cannot be accurately interpreted through the study of S alone. Thus, in this research, indicators related to the thermal storage performance of walls were derived to assist with measurement.
As shown in
Figure 6 (“-” here are minus signs), the indicator most directly related to the thermal storage coefficient is thermal inertia, which becomes larger with increases in wall thickness. Indirectly related to the thermal storage coefficient are the attenuation degree and delay time. Frequently, the larger the thermal inertia of the wall, the more remarkable the performance of the two indirect indicators. In addition, thermal inertia, temperature wave attenuation degree, and phase detention time can each be used to establish a direct relationship with wall thickness, and all showed a positive correlation.
4.2.1. Thickness and Thermal Inertia
The thermal inertia index (D) is a dimensionless index that reflects the decay rate of the fluctuating heat transfer process of the external wall. The larger the D value, the faster the surface temperature wave attenuates in the wall and the better the thermal stability of the wall. The thermal inertia index of an RE wall is numerically equal to the product of the material’s heat storage coefficient and thermal resistance.
A thermal inertia index of earthen walls of different thicknesses could thus be calculated. The fitting function is shown in
Figure 7. From the correlation of the functions, it can be seen that the thermal inertia index of earthen walls was directly proportional to wall thickness, and the influence factor of thermal inertia in the comprehensive evaluation index was 0.016.
4.2.2. Thickness and Attenuation Degree
WUFI Pro was used to simulate the heat and moisture transfer process of the walls under different thicknesses. The external climate conditions set by the software were obtained from the weather tool (Beijing-hour.epw, Meteotest AG, Bern, Switzerland), Indoor ambient temperature was set at 18–26 °C, and relative humidity was 50%. The annual variation range of the internal and external surface temperatures of the walls were obtained by simulation (see
Table 5, “-” in this table are minus signs). Here, the ratio of the harmonic amplitudes of the internal and external surface temperatures was used to measure the attenuation effect of the earthen walls of different thicknesses on the temperature wave. The value was defined as the average annual attenuation of the temperature wave
V0 (see Equation (7)).
where
A0 is the annual temperature amplitude of the external surface of the wall,
A0 = 41.8 °C, and
Ad represents the annual temperature amplitude of the internal surface of the wall.
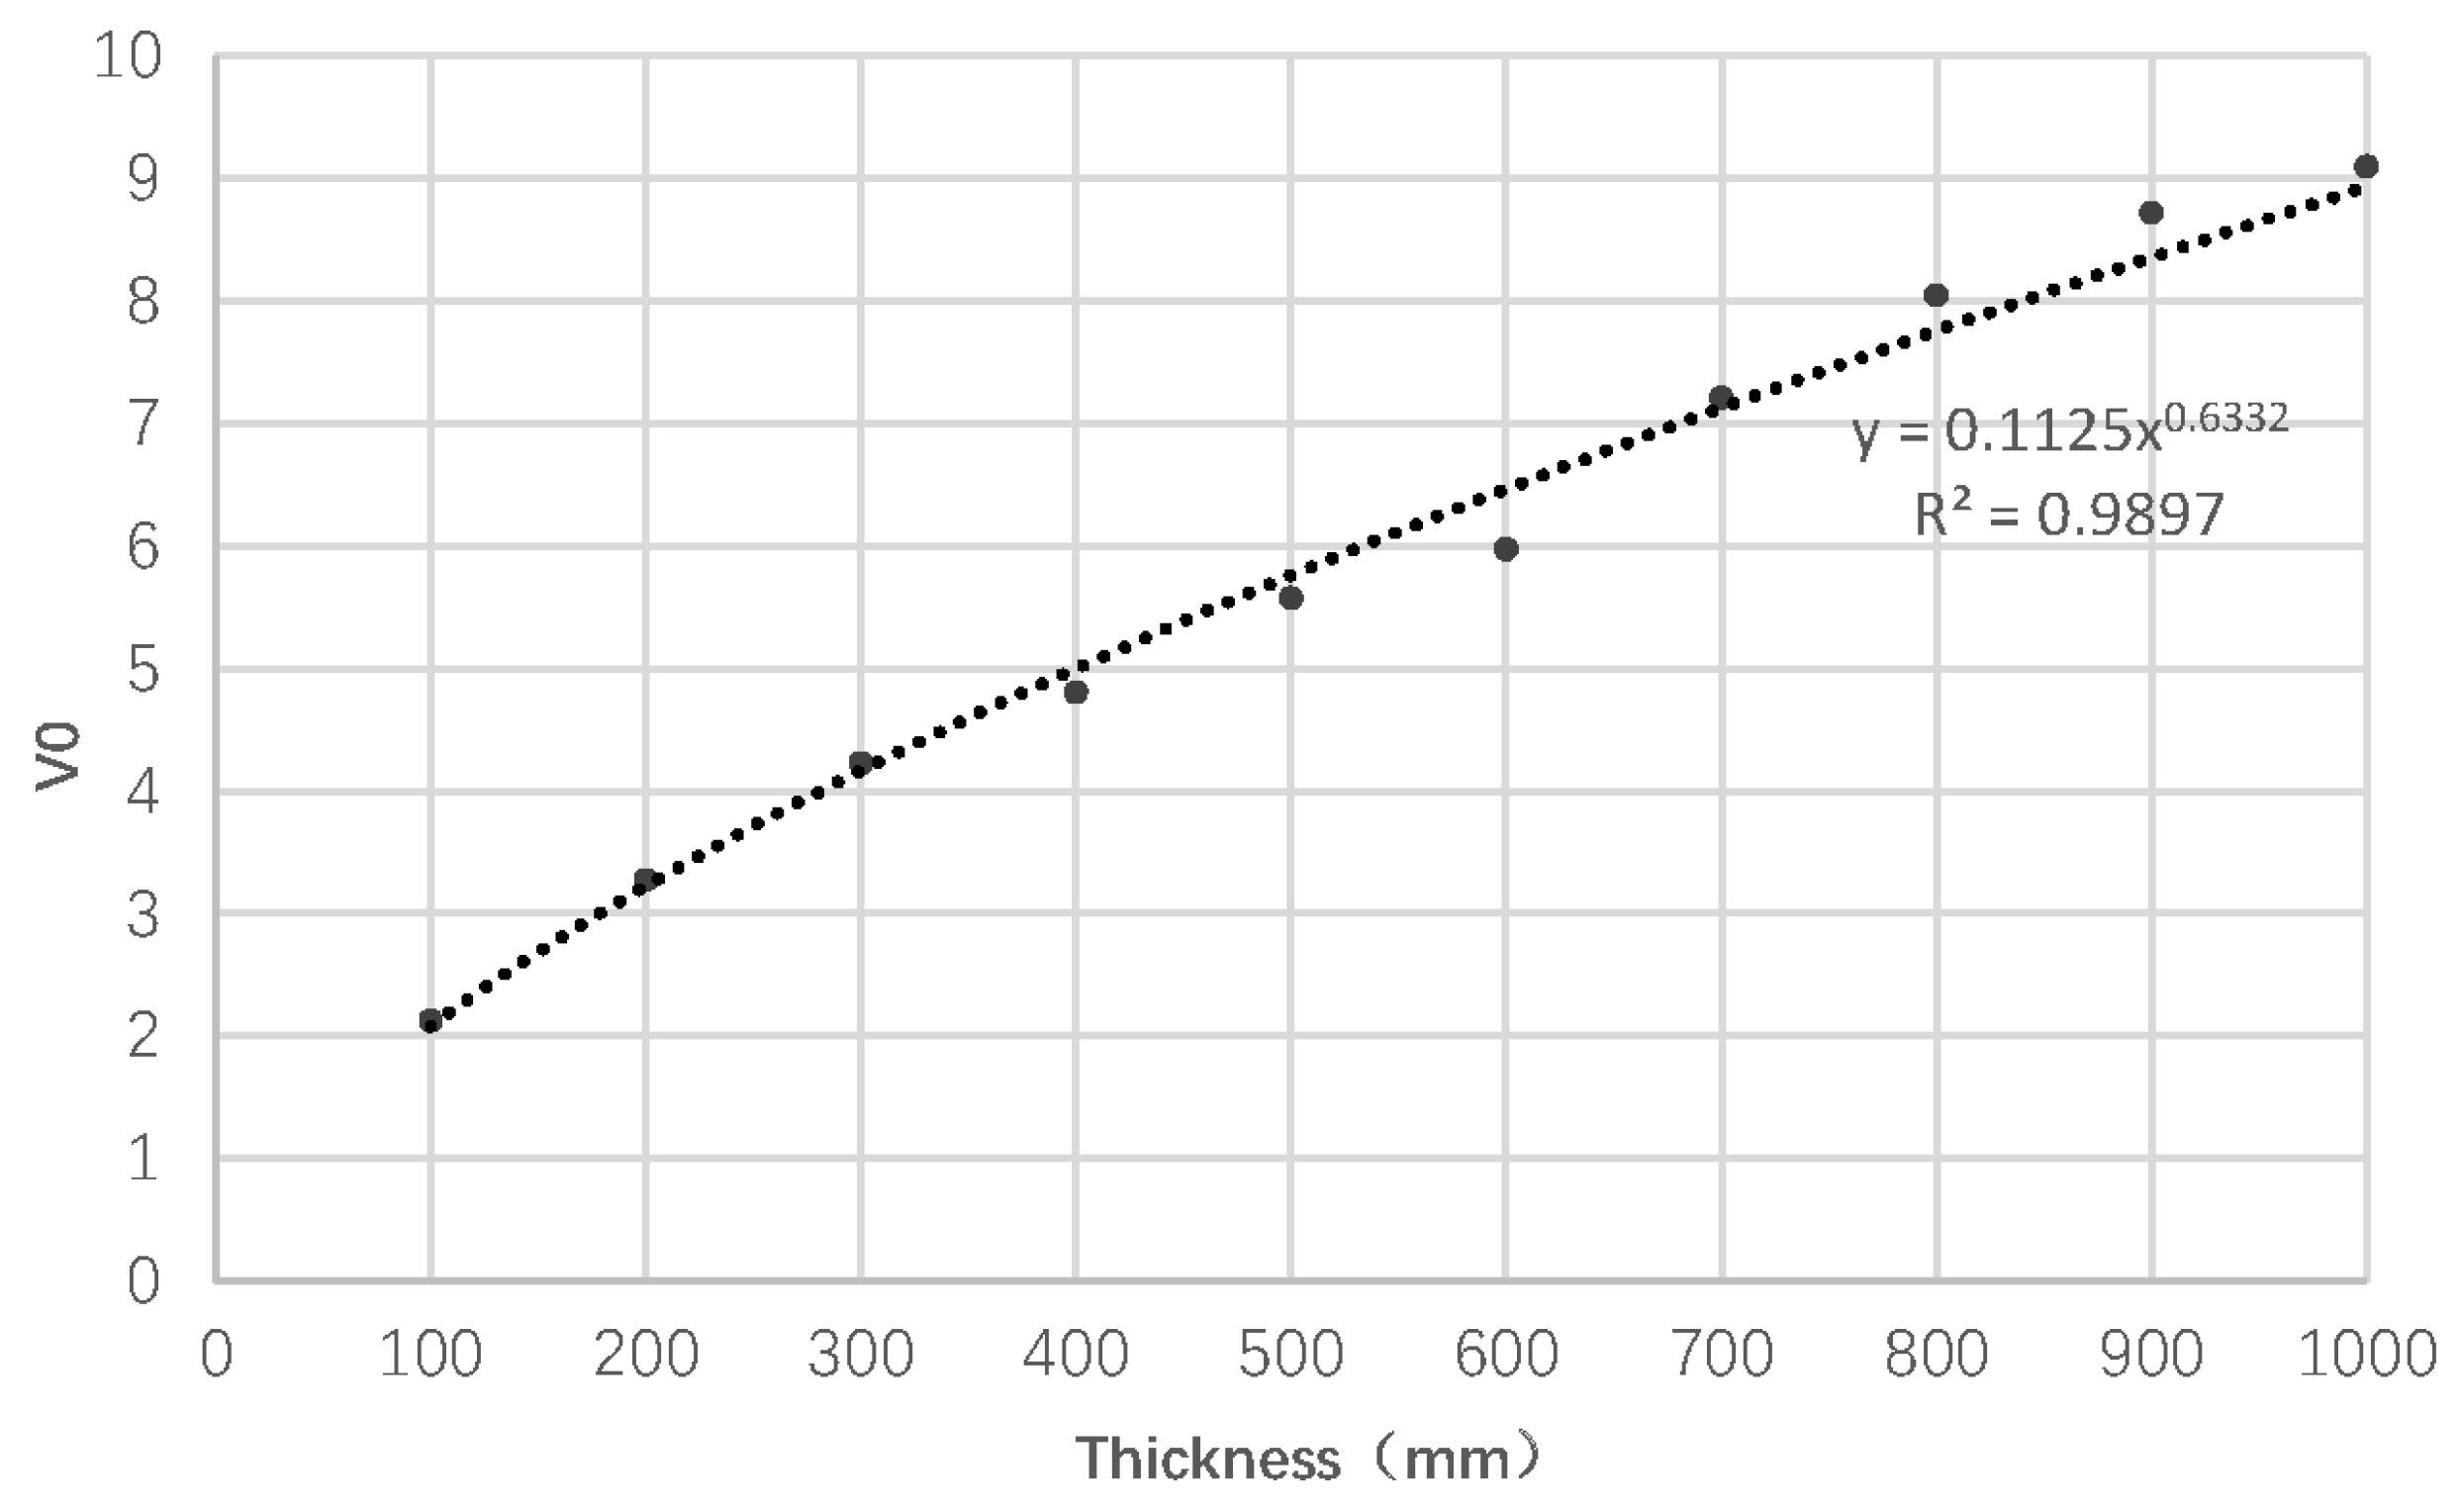
The values were fitted, and the results are shown in
Figure 8. The correlation coefficient (R
2) between the attenuation and wall thickness was about 0.9932. It can be concluded that as the wall thickness increased, the attenuation degree increased, and the indoor environment fluctuation and temperature fluctuation range inside the wall became smaller. However, the growth trend of
V0 became slower, meaning that
V0 tended to stabilize regardless of the increase in thickness. The increase in wall thickness gradually reached saturation for the attenuation gain. According to the fitting function, the influence factor of
V0 was about 0.6332.
4.2.3. Thickness and Time Lag
The time lag (ξ) refers to the interval between the appearance of the peak outdoor temperature wave and appearance of the peak temperature of the inner surface of the external wall. The larger the delay time, the smaller the impact of the outdoor temperature on the building’s indoor environment. The delay times for the RE walls of different thicknesses were calculated, and a linear fit was performed, as shown in
Figure 9 (“-” in here are minus signs).
The calculation period of the delay time was chosen to be 24 h. The image shows that the thicker the wall, the greater the delay time. However, when the delay time was greater than 24 h, it became meaningless to continue enhancing the delay time for building indoor environmental stability. The sensitivity factor of the delay time in the comprehensive evaluation index was calculated as 0.0434.
4.2.4. Thickness and Comprehensive Evaluation Index
The comprehensive evaluation index was established according to the four-parameter influence factor fitted above, as shown in Equation (8). The comprehensive evaluation index under each wall thickness was then calculated and is shown in
Figure 10.
From the data distribution pattern of the comprehensive evaluation index, it can be seen that the comprehensive thermal performance continued to increase with the increase in wall thickness. As the thickness increased, the thermal performance gain of the wall gradually decreased. Further, the calculation of the comprehensive index improvement rate revealed that it tended to be stable when the thickness of the rammed earth wall reached 600 mm. Increasing the wall thickness was not found to be significant for improving thermal performance.
4.3. Defining Boundaries
This section describes the relationship between the wall thickness and thermal performance from the perspective of interior design temperature, building energy demand, and economic efficiency; it was used as a qualification for the wall thickness interval.
4.3.1. Design Temperature
Article 3.0.1 of the Code for Design of Heating, Ventilation, and Air Conditioning of Civil Buildings: GB 50736-2012 stipulates that the main room in cold and severely cold areas (e.g., in Beijing) should be 18–24 °C [
31]. Here, the lower limit of the thickness interval of the RE wall was defined as the thickness that could meet the minimum heating temperature requirement in winter considering economic factors.
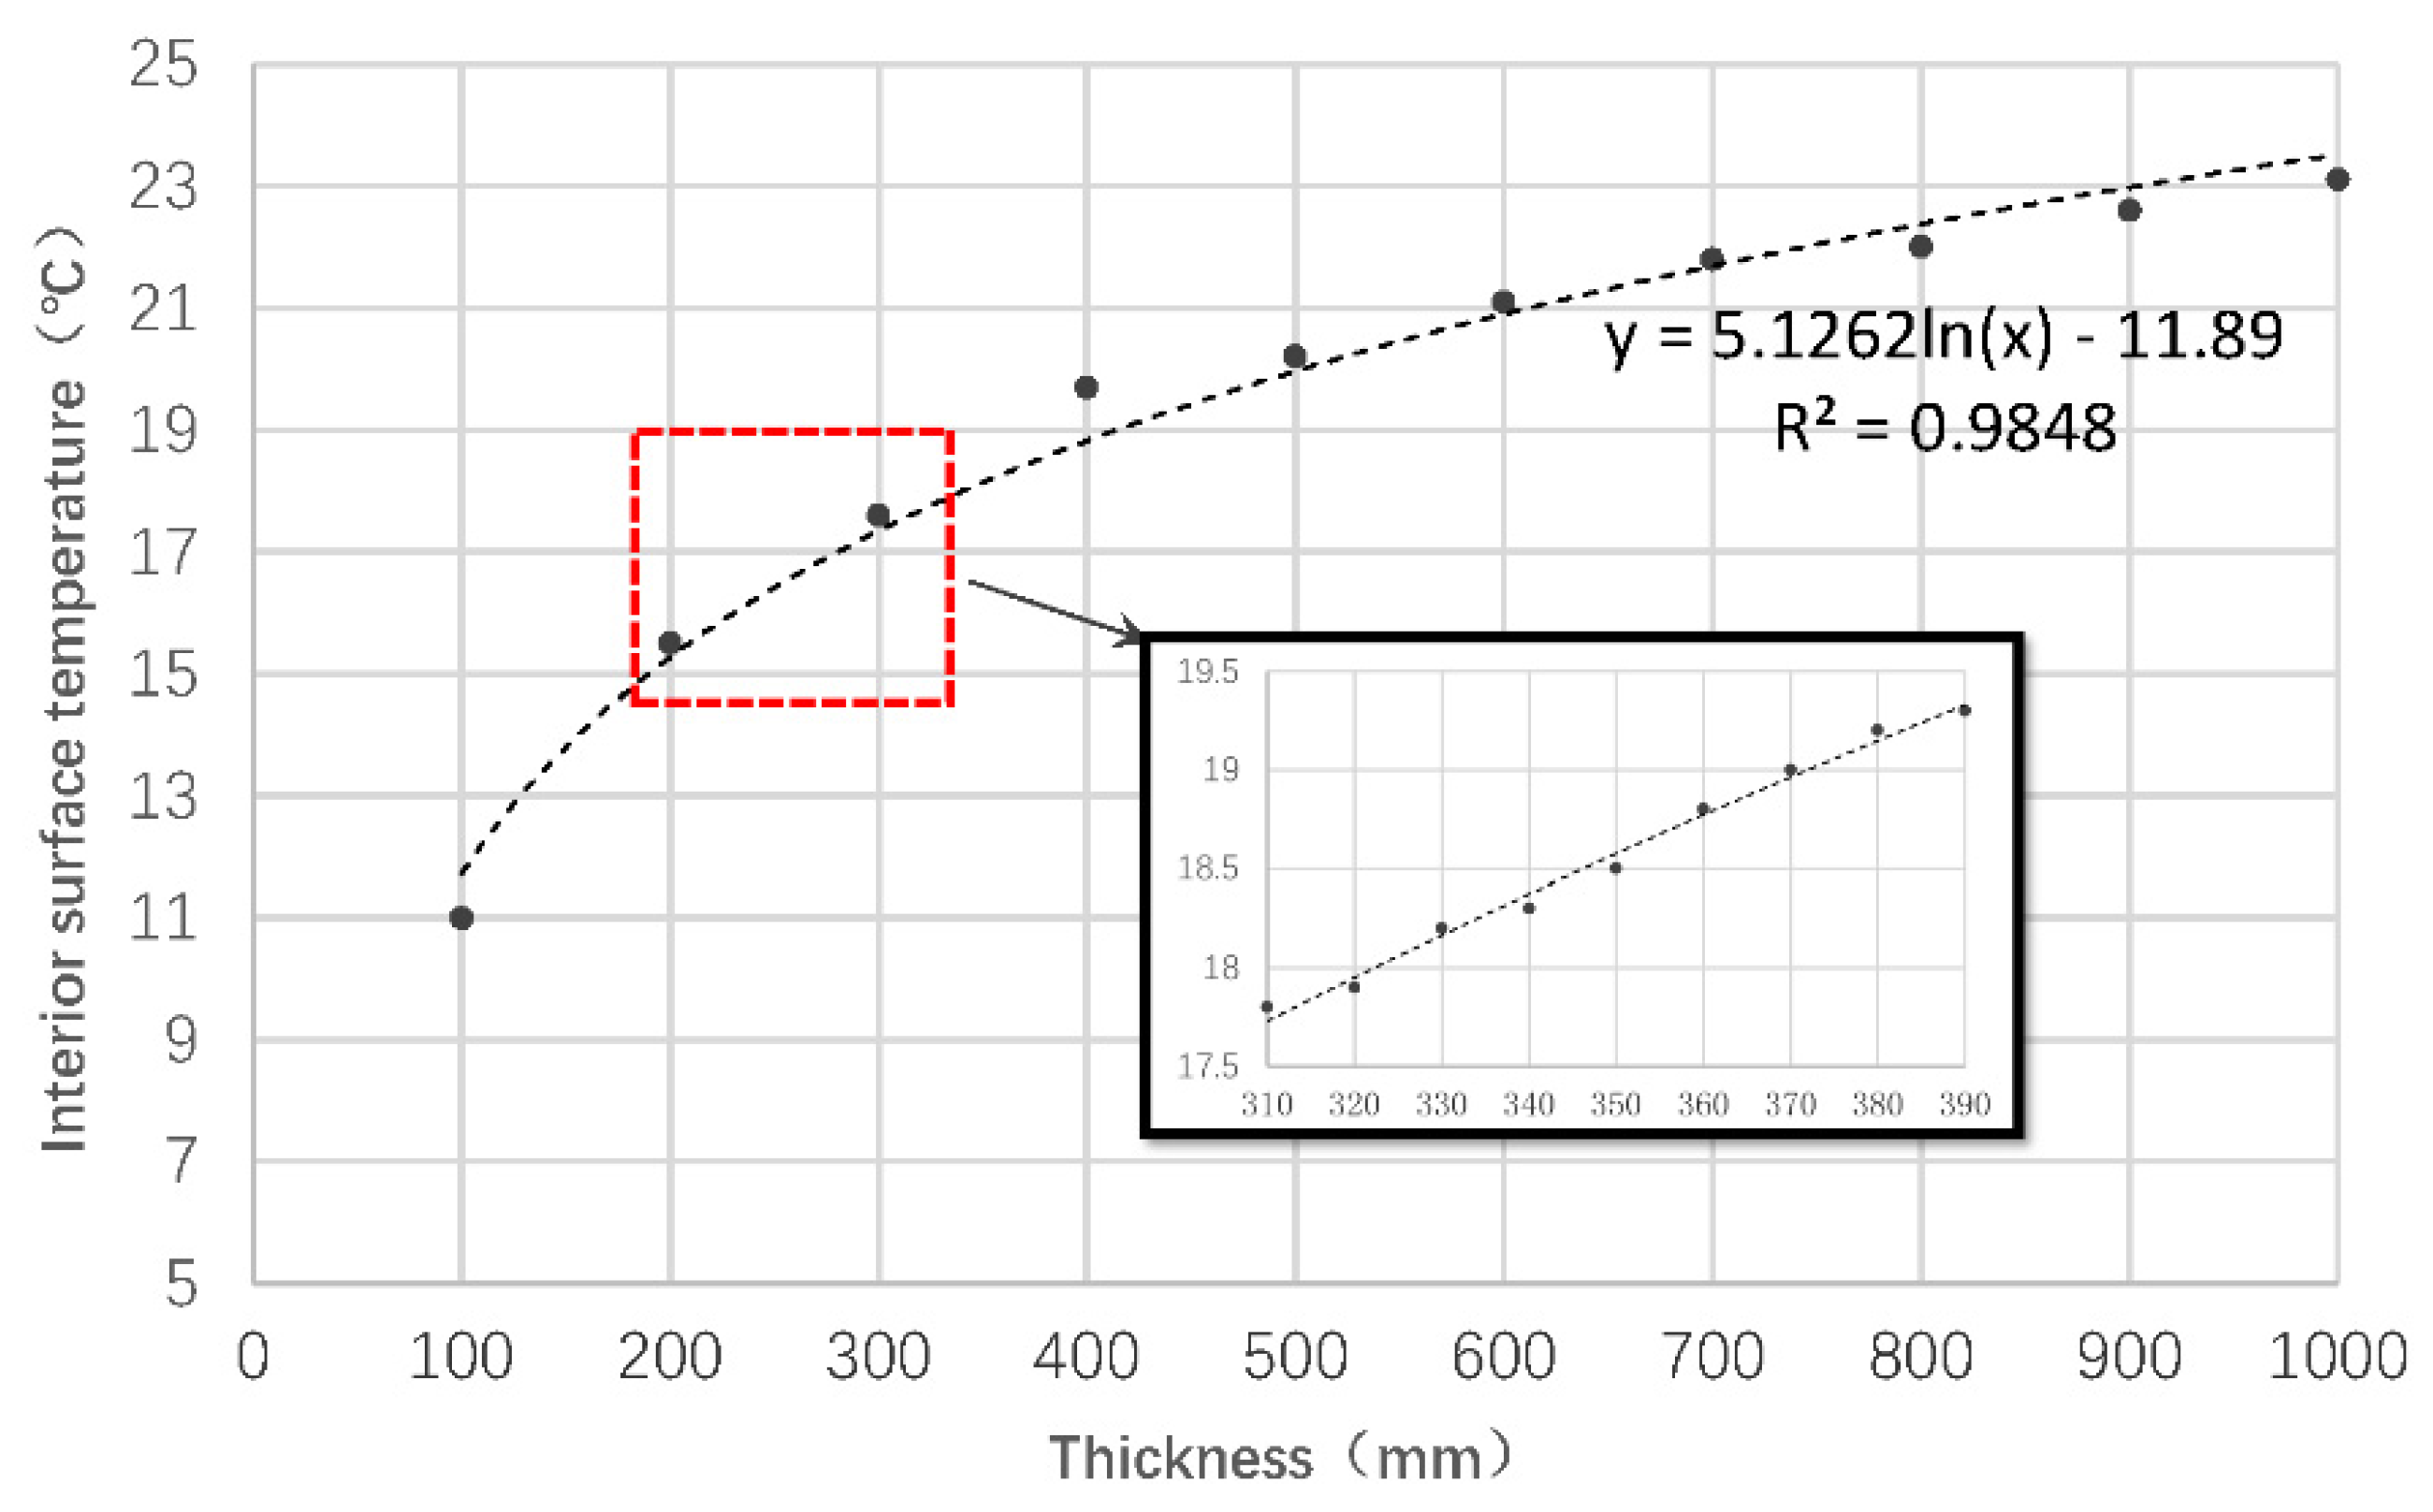
The effects of different thicknesses of RE walls on the lowest temperatures of the inner surface were simulated. The results are outlined in
Table 6. As the wall thickness increased from 100 mm to 600 mm, the minimum temperatures on the inner surface of the RE walls were 11 °C, 15.5 °C, 17.6 °C, 19.7 °C, 20.3 °C, and 21.0 °C, respectively. From the data rules, it can be seen that as the thickness increased, the thermal performance improvement gain gradually decreased. In addition, when 18 °C was used as the thickness filter standard, the thickness of the RE wall needed to be between 300 mm and 400 mm.
To further study the optimum thickness of RE walls for the Beijing area, the temperature variation range of the inner surfaces of walls of different thicknesses was simulated and the minimum temperature was numerically fitted (see
Figure 11, “-” are minus signs). According to the restrictions put forth by local regulations and the fitting formula, the lower limit of the optimized wall thickness in Beijing was calculated to be about 325 mm, which is similar to Chen Mang’s experimental tests of heavy clay walls in the cold region of China, with an error of 3.69% [
32].
In summary, the thickness interval of RE walls with a density of 2000 kg/m³ in the Beijing area was determined to be approximately 325 mm to 600 mm, meeting the requirement of minimum heat transfer resistance for enclosures.
4.3.2. Energy Consumption
The thermal performance of RE walls can be visualized by the energy demand of the building. Therefore, the thickness of the RE wall was used as the only variable for studying the building energy demand under different conditions. Then, the effects of different thicknesses of RE walls (ranging from 100 mm to 1000 mm) on the energy demand of the building were simulated using WUFI Plus software (Department Hygrothermics at the Fraunhofer IBP, Holzkirchen, Germany). The results are shown in
Figure 12. The energy consumption data were processed to derive energy savings rates for different thicknesses of walls and were compared with the index performance improvement rates. The following conclusions were drawn.
As the comprehensive performance of the RE wall improved, the rate of energy savings and energy consumption returns gradually decreased.
The performance improvement rate of the RE wall was defined as the investment and the energy savings rate as the benefit. It can be seen from the value change law that the investment benefit reached a balance when the wall thickness reached 360 mm; this was also when the wall performance benefit was the best.
Combined with the above research on the lower limits of wall thickness, the optimization interval of RE wall thickness in Beijing was found to be 325 mm to 360 mm.
The building energy consumption and construction economy were analyzed; the results are shown in
Table 7. With an increase in wall thickness, the initial investment in construction increased, but the energy consumption demand of the building decreased under the gradient change of thickness. The payback period was about eight years, regardless of the increase in thickness (as compared to 325 mm), so the optimal wall thickness of RE walls in Beijing was determined to be about 360 mm.
5. Optimization and Development
As described above, the optimum thickness of an RE wall was about 360 mm, but the heat transfer coefficient did not meet the requirements of local energy conservation regulations in Beijing. Therefore, it was necessary to improve the traditional RE wall by adding an insulation layer.
5.1. Basis for Insulation Improvement
This research used XPS to improve the insulation performance of RE walls. The structural layers of a standard composite RE wall is XPS insulation board and RE. The construction form of composite RE walls is mainly divided into three forms: external, internal, and sandwich insulation. The most economical thickness of insulation panels for energy savings was calculated according to the Beijing area specification standard (see
Table 8).
5.2. Energy Demand Simulations
WUFI Plus was used to simulate the building energy demand under different working conditions. The simulation was divided into three categories: external, sandwich, and internal insulation. Commonly used aerated concrete was also simulated for comparison under the same heat transfer coefficient.
Modeling and Simulations
The model was built according to the architectural prototype. Next, the gbXML format file was exported, and the parameters of each part of the building construction were set in the WUFI Plus software (For parameters see
Table 3). Then, more than five cases were simulated, with the construction of the composite RE wall being the only variable for energy demand. The results are shown in
Table 9.
The following conclusions can be drawn from the simulation results:
When the heat transfer coefficient of the external building envelope was the same, RE buildings were found to be more energy efficient than concrete buildings.
By adding a certain thickness of XPS insulation board, the rate of energy savings of public buildings reached 37.3%, and that of residential buildings reached about 41.0%. This shows that the thermal performance of composite RE walls was greatly improved and can be adapted to cold climates.
When the thickness of the RE wall was 360 mm, the effects of different XPS thicknesses on building energy consumption were calculated, and the results are shown in
Figure 13. From the data distribution pattern, it can be concluded that when the form of construction was external insulation, the energy demands of the building were the lowest and those of the internal insulation the highest. Thus, it would be appropriate to adopt the structural form of external insulation for composite RE walls in Beijing.
From the perspective of cooling and heating energy demands, it can be seen that external insulation had a greater impact on building heating energy demand, while internal insulation was more sensitive to building cooling energy consumption.
5.3. Heat Flow Analysis
The results of the energy demand simulations showed that despite the same thermal design parameters of the wall, the influence of different constructions on the energy demand of the building was significantly different. This section focuses on an analysis of the causes of energy consumption variability. It is well known that the main form of energy exchange between a building and its surroundings is heat transfer through walls, expressed in terms of heat flow (kWh).
WUFI Pro was used to simulate the annual cumulative heat flow inside the three composite RE walls described above. The results are shown in
Figure 14 (“-” are minus signs). Building heat loss was defined as a negative value and building heat gain as a positive value. During the period from May to October, the building was in a heat gain state. The rest of the year, the building was in a heat loss state. The annual average building heat loss in Beijing is about 1.85 times that of building heat gain. According to the energy demand simulation results, the following conclusions could be drawn. There was a positive correlation between heat flow size and energy demand. The external insulation wall had a low level of heat flow in winter and a substantial amount of heat flow in summer, while the internal insulation had a sizeable heat flow in winter and less heat flow in summer. This matched the simulation results for cooling and heating loads listed above. Thus, it was concluded that the structural form of internal insulation would be more suitable for areas where cooling is the dominant energy consumption and external insulation is more suitable for cold areas.
5.4. Condensation Risk Assessments
Through the above analysis, the best composite RE wall construction for the Beijing area was determined to be external insulation. For houses in areas with central heat, preventing condensation inside the walls is a priority. In this section, the condensation temperature of the longitudinal section of external insulated composite RE walls was analyzed in combination with WUFI Pro software. The model construction layers are described in
Figure 15 (“-” here are hyphen). Monitoring points such as 1, 2, 3, and 4 were set to determine whether there was a risk of condensation inside the structure.
The dynamic moisture heat transfer process inside the wall was simulated, and the dewpoint and temperature were simulated for each monitoring point. When the temperature of the monitoring point is close to the condensation temperature, condensation is highly prone to occur and erode the building envelope, forming a safety hazard. In addition, wall condensation can also seriously affect the environmental quality of a building interior and thus adversely impact health.
5.4.1. Monitoring Point 1
Monitoring point 1 was placed on the outside of the wall; the simulation results are shown in
Figure 16 (“-” are minus signs). It can be seen from the figure that the condensation temperature was close to the outdoor ambient temperature throughout the year, and the condensation phenomenon very easily occurred on the outside surface of the composite RE wall. This situation was more serious in summer. Therefore, the exterior wall surface needs some waterproofing treatment.
5.4.2. Monitoring Point 2
Monitoring point 2 was placed between the cement mortar and the XPS insulation board. As shown in
Figure 17 (“-” are minus signs), there is a risk of condensation at this point, so a water-proof layer must be placed there.
5.4.3. Monitoring Point 3
Monitoring point 3 was placed at the boundary between the insulation board and RE wall. The simulation results are shown in
Figure 18 (“-” are minus signs). From the data distribution pattern of the intersection of winter (when there was no risk of condensation) and summer (when the ambient humidity was high), it can be seen that there was a certain risk of condensation (temperature and dewpoint differences of 3–5 °C), but given the high moisture adjustment capacity of the RE materials, no water-proofing measures are required at monitoring point 3.
5.4.4. Monitoring Point 4
Monitoring point 4 was placed on the inside of the wall; the simulation results are shown in
Figure 19. The statistics show that there was no risk of condensation on the inner surface of the composite RE wall.
5.4.5. Condensation Optimization
According to the results of the above analysis, to prevent condensation in the wall, a waterproof layer would need to be added at monitoring point 2. The risk of condensation was analyzed. The results show that with the damp-proofing treatment, the risk of condensation has been removed at monitoring point 2 (see
Figure 20, “-” are minus signs).
5.5. Strategy and Discussion
Following the above study, the optimized wall construction layers are 5 mm coat-ing, water-proof layer, 20 mm cement plaster, bonding course, XPS insulation layer, bonding course, and RE construction in order (see
Figure 21).
The optimization solutions are also argued. The thickness for only RE walls is generally in the range of 400 mm–600 mm, and here 400 and 600 mm RE walls were selected for comparison to analyze their effects on building energy demands, and the simulation data are shown in
Table 10.
From the data distribution rule, the energy saving rate of the optimized scheme reached 30.69%, and the optimized scheme can save a large amount of energy consumption for cooling and heating loads. Therefore, the optimization method adopted in this paper possesses certain scientificity and feasibility. However, the research in this paper is a preliminary exploration of the applicability of RE materials in the northern region of China, and the final evaluation of the optimized solution is still needed later in conjunction with actual construction and environmental measurements.
5.6. Applications
The research presented above suggests an optimized solution for the application of RE materials in the Beijing area. It also provides a reference for related applications in other cold regions. The overall application approach is designed with the regional climate in the context of the material’s self thermal performance and the green building standards as the boundary conditions in order to find the optimal design strategy for RE materials under specific climate zones and working conditions. As shown in
Figure 22 (“-” here are hyphen), the design of the application of RE materials is optimized on two main levels, one of which is the comprehensive thermal performance of the material itself and the other is the national and local design codes.
6. Conclusions
This research used the mathematical model of heat transfer in porous material envelopes as a theoretical basis to study the influence of thermal insulation on the indoor thermal environment. This work also composed and derived the relationships among parameters affecting the thermal performance of buildings and constructed a comprehensive evaluation index for the thermal performance of RE walls. The findings suggest that after the thickness of an RE wall in Beijing exceeds 600 mm, the thermal performance improvement gradually decreases. The interior design temperature, energy consumption demand, and economic factors were used as boundary conditions to confine the thickness of the RE wall. It was found that the optimal thickness in Beijing would be about 360 mm. In addition, to meet China’s building energy codes, an energy savings design for RE walls was presented in which XPS insulation board was added. Per the calculations, the final thickness of the insulation board for a public building with a building shape coefficient ≤0.3 was about 50 mm; for residential buildings, it was about 70 mm.
This study also found that external building insulation is conducive to reducing the winter heat flow in the envelope structure and plays a positive role in saving building heating energy. Internal building insulation has a greater impact on cooling energy consumption. Therefore, the external insulation composite RE wall was determined to be more suitable for the Beijing area. Moreover, this research evaluated the risk of condensation on composite RE walls, and a structural scheme applicable to the Beijing area was derived.
Author Contributions
Software, M.Z.; resources, J.M.; writing—original draft preparation, S.Y.; writing—review and editing, S.H.; data curation, D.T. All authors have read and agreed to the published version of the manuscript.
Funding
This research was funded by the State Key Project of National Natural Science of China (Grant number 51938002), the National Natural Science Foundation of China (Grant number 51878021), the General Project of Beijing Municipal Science & Technology Commission (Grant number KM201910016016),and the State Key Laboratory of Subtropical Building Science (2019ZB09).
Institutional Review Board Statement
Not applicable.
Informed Consent Statement
Not applicable.
Data Availability Statement
Not applicable.
Conflicts of Interest
The authors declare that they have no known competing financial interests or personal relationships that could have appeared to influence the work reported in this paper.
References
- Reddy, B.V.; Kumar, P.P. Embodied energy in cement stabilised rammed earth walls. Energy Build. 2010, 42, 380–385. [Google Scholar] [CrossRef]
- Bribián, I.Z.; Capilla, A.V.; Usón, A.A. Life cycle assessment of building materials: Comparative analysis of energy and environmental impacts and evaluation of the eco-efficiency improvement potential. Build. Environ. 2011, 46, 1133–1140. [Google Scholar] [CrossRef]
- Blengini, G.A. Life cycle of buildings, demolition and recycling potential: A case study in Turin, Italy. Build. Environ. 2009, 44, 319–330. [Google Scholar] [CrossRef]
- Soebarto, V. Analysis of indoor performance of houses using rammed earth walls. In Proceedings of the Eleventh International IBPSA Conference, Glasgow, UK, 27–30 July 2009; p. 1530e7. [Google Scholar]
- Hall, M.; Djerbib, Y. Rammed earth sample production: Context, recommendations and consistency. Constr. Build. Mater. 2004, 18, 281–286. [Google Scholar] [CrossRef]
- Allinson, D.; Hall, M. Hygrothermal analysis of a stabilised rammed earth test building in the UK. Energy Build. 2010, 42, 845–852. [Google Scholar] [CrossRef]
- Soudani, L.; Woloszyn, M.; Fabbri, A.; Morel, J.C.; Grillet, A.C. Energy evaluation of rammed earth walls using long term in-situ measurements. Sol. Energy 2017, 141, 70–80. [Google Scholar] [CrossRef]
- Givoni, B. Characteristics, design implications, and applicability of passive solar heating systems for buildings. Sol. Energy 1991, 47, 425–435. [Google Scholar] [CrossRef]
- Serrano, S.; de Gracia, A.; Cabeza, L.F. Adaptation of rammed earth to modern construction systems: Comparative study of thermal behavior under summer conditions. Appl. Energy 2016, 175, 180–188. [Google Scholar] [CrossRef] [Green Version]
- El Fgaier, F.; Lafhaj, Z.; Brachelet, F.; Antczak, E.; Chapiseau, C. Thermal performance of unfired clay bricks used in construction in the north of France: Case study. Case Stud. Constr. Mater. 2015, 3, 102–111. [Google Scholar] [CrossRef]
- Paul, W.; Taylor, P.A. A comparison of occupant comfort and satisfaction between a green building and a conventional building. Build. Environ. 2008, 43, 1858–1870. [Google Scholar] [CrossRef]
- Taylor, P.; Fuller, R.; Luther, M. Energy use and thermal comfort in a rammed earth office building. Energy Build. 2007, 40, 793–800. [Google Scholar] [CrossRef]
- Adam, E.; Jones, P. Thermophysical properties of stabilised soil building blocks. Build. Environ. 1995, 30, 245–253. [Google Scholar] [CrossRef]
- Goodhew, S.; Griffiths, R. Sustainable earth walls to meet the building regulations. Energy Build. 2005, 37, 451–459. [Google Scholar] [CrossRef]
- Goodary, R.; Lecomte-Nana, G.L.; Petit, C.; Smith, D.S. Investigation of the strength development in cement-stabilised soils of volcanic origin. Constr. Build. Mater. 2012, 28, 592–598. [Google Scholar] [CrossRef]
- Zak, P.; Ashour, T.; Korjenic, A.; Korjenic, S.; Wu, W. The influence of natural reinforcement fibers, gypsum and cement on compressive strength of earth bricks materials. Constr. Build. Mater. 2016, 106, 179–188. [Google Scholar] [CrossRef]
- Yusoff, M.Z.M.; Salit, M.S.; Ismail, N.; Wirawan, R. Mechanical properties of short random oil palm fibre reinforced epoxy composites. Sains Malays. 2010, 39, 87–92. [Google Scholar]
- Achenza, M.; Fenu, L. On earth stabilization with natural polymers for earth masonry construction. Mater. Struct. 2006, 39, 21–27. [Google Scholar] [CrossRef]
- Ciancio, D.; Beckett, C.T.S.; Carraro, J.A.H. Optimum lime content identification for lime-stabilised rammed earth. Constr. Build. Mater. 2014, 53, 59–65. [Google Scholar] [CrossRef] [Green Version]
- Kariyawasam, K.K.G.K.D.; Jayasinghe, C. Cement stabilized rammed earth as a sustainable construction material. Constr. Build. Mater. 2016, 105, 519–527. [Google Scholar] [CrossRef]
- Danso, H.; Martinson, D.B.; Ali, M.; Williams, J.B. Physical, mechanical and durability properties of soil building blocks reinforced with natural fibres. Constr. Build. Mater. 2015, 101, 797–809. [Google Scholar] [CrossRef] [Green Version]
- Reddy, B.V.; Leuzinger, G.; Sreeram, V.S. Low embodied energy cement stabilised rammed earth building—A case study. Energy Build. 2014, 68, 541–546. [Google Scholar] [CrossRef]
- Li, Q.; You, R.; Chen, C.; Yang, X. A field investigation and comparative study of indoor environmental quality in heritage Chinese rural buildings with thick rammed earth wall. Energy Build. 2013, 62, 286–293. [Google Scholar] [CrossRef]
- Liu, J.; Hu, R.; Wang, R.; Yang, L. Regeneration of vernacular architecture: New rammed earth houses on the upper reaches of the Yangtze River. Front. Energy Power Eng. China 2009, 4, 93–99. [Google Scholar] [CrossRef]
- Brambilla, A.; Jusselme, T. Preventing overheating in offices through thermal inertial properties of compressed earth bricks: A study on a real scale prototype. Energy Build. 2017, 156, 281–292. [Google Scholar] [CrossRef]
- Lu, S.; Wang, Z.; Zhang, T. Quantitative analysis and multi-index evaluation of the green building envelope performance in the cold area of China. Sustainability 2020, 12, 437. [Google Scholar] [CrossRef] [Green Version]
- Research Institute of Highway Ministry of Transport. Test Methods of Soils for Highway Engineering (JTG 3430—2020); China Communications Press: Beijing, China, 2020. (In Chinese) [Google Scholar]
- Nanjing Fiberglass Research and Design Institute Co., Ltd. Thermal Insulation—Determination of Steady-State Thermal Resistance and Related Properties—Heat Flow Meter Apparatus (GB/T10295-2008); Standards Press of China: Beijing, China, 2008. (In Chinese) [Google Scholar]
- Yu, S.; Hao, S.; Mu, J.; Tian, D. Optimization of Wall Thickness Based on a Comprehensive Evaluation Index of Thermal Mass and Insulation. Sustainability 2022, 14, 1143. [Google Scholar] [CrossRef]
- Ministry of Housing and Urban-Rural Development of the People’s Republic of China (MOHURD). Code for Thermal Design of Civil Building (GB 50176-2016); China Architecture & Building Press: Beijing, China, 2016. (In Chinese)
- Ministry of Housing and Urban-Rural Development of the People’s Republic of China (MOHURD). Design Code for Heating Ventilation and Air Conditioning of Civil Buildings (GB50736-2012); China Architecture & Building Press: Beijing, China, 2012. (In Chinese)
- Chen, M. Thermal Performance of Rammed Earth Wall; Xi’an University of Architecture and Technology: Xi’an, China, 2017; Available online: https://kns.cnki.net/kcms/detail/detail.aspx?dbcode=CMFD&dbname=CMFD201901&filename=1018862061.nh&uniplatform=NZKPT&v=OPCxDjrz2B8pwdws4epbIGmOYwDe2xc1itEthiTkmONznMfGudEdqtuLJ0L4e5S0 (accessed on 26 October 2017).
Figure 1.
Technical route of the paper.
Figure 1.
Technical route of the paper.
Figure 2.
Annual temperatures in Beijing.
Figure 2.
Annual temperatures in Beijing.
Figure 3.
Metric of the building prototype.
Figure 3.
Metric of the building prototype.
Figure 4.
Relevance of the material’s thermal parameters.
Figure 4.
Relevance of the material’s thermal parameters.
Figure 5.
Analysis of heat transfer forms.
Figure 5.
Analysis of heat transfer forms.
Figure 6.
Relationships among the parameters of thermal storage performance.
Figure 6.
Relationships among the parameters of thermal storage performance.
Figure 7.
Thickness and thermal lag.
Figure 7.
Thickness and thermal lag.
Figure 8.
Fitting of the decay degree function.
Figure 8.
Fitting of the decay degree function.
Figure 9.
Fitting of the time lag.
Figure 9.
Fitting of the time lag.
Figure 10.
The relationship between thickness and M.
Figure 10.
The relationship between thickness and M.
Figure 11.
Relationship between the thickness and interior surface temperature.
Figure 11.
Relationship between the thickness and interior surface temperature.
Figure 12.
Energy demands of different wall thicknesses.
Figure 12.
Energy demands of different wall thicknesses.
Figure 13.
Energy demands of different XPS thicknesses.
Figure 13.
Energy demands of different XPS thicknesses.
Figure 14.
Average monthly heat flow for walls of different construction forms.
Figure 14.
Average monthly heat flow for walls of different construction forms.
Figure 15.
Schematic of the wall construction.
Figure 15.
Schematic of the wall construction.
Figure 16.
Dewpoint and temperature of monitoring point 1.
Figure 16.
Dewpoint and temperature of monitoring point 1.
Figure 17.
Dewpoint and temperature of monitoring point 2.
Figure 17.
Dewpoint and temperature of monitoring point 2.
Figure 18.
Dewpoint and temperature of monitoring point 3.
Figure 18.
Dewpoint and temperature of monitoring point 3.
Figure 19.
Dewpoint and temperature of monitoring point 4.
Figure 19.
Dewpoint and temperature of monitoring point 4.
Figure 20.
Optimized wall dewpoint and temperature of monitoring point 2.
Figure 20.
Optimized wall dewpoint and temperature of monitoring point 2.
Figure 21.
Schematic diagram of the composite RE wall construction.
Figure 21.
Schematic diagram of the composite RE wall construction.
Figure 22.
Applications ideas for RE materials.
Figure 22.
Applications ideas for RE materials.
Table 1.
Granulometric Analysis: Sieving.
Table 1.
Granulometric Analysis: Sieving.
| Diameter (mm) | 1 | 0.4 | 0.2 | 0.08 | <0.08 | Waste | Total |
|---|
Dry Weight with
tare dwt (g) | 1.44 | 1.44 | 5.44 | 33.93 | 390.46 | 1.35 | 436.02 |
| Percentage (%) | 0.33 | 0.33 | 1.25 | 7.78 | 90 | 0.31 | 100 |
Table 2.
Physical Parameters of the Test Blocks.
Table 2.
Physical Parameters of the Test Blocks.
| Name | Dry Density
(kg/m3) | Specific Heat
Capacity
KJ/(kg·K) | Thermal
Conductivity
λ (W/mK) | Thermal Storage
Conductivity
S (W/(m2·K)) |
|---|
| RE | 2034 | 1.28 | 0.74 | 11.85 |
| Aerated Concrete | 700 | 1.05 | 0.18 | 3.10 |
| Concrete | 2500 | 0.92 | 1.74 | 17.20 |
Table 3.
The specifications of the base case model.
Table 3.
The specifications of the base case model.
| Residential Houses |
|---|
| Window-to-wall ratio (%) | South: 28.0 | North: 10.8 | East: 0.0 | West: 0.0 |
| People density (people/m2) | 0.025 |
| Wall U-value (W/m2·K) | Value varies with thickness |
| Window U-value (W/m2·K) | 2.0 |
| Floor U-value (W/m2·K) | 0.2 |
| Roof U-value (W/m2·K) | 0.25 |
| Heating setpoint (°C) | 18 |
| Cooling setpoint (°C) | 26 |
| HVAC schedule | Mon.–Fri.: 17:00–9:00; weekend: 0:00–24:00 |
| Ventilation (1/h) | 0.8 |
Table 4.
Relationship between Thickness and the Heat Transfer Coefficient.
Table 4.
Relationship between Thickness and the Heat Transfer Coefficient.
d
mm | 100 | 200 | 300 | 400 | 500 | 600 | 700 | 800 | 900 | 1000 |
|---|
U
W/(m2·K) | 3.507 | 2.379 | 1.8 | 1.448 | 1.211 | 1.041 | 0.912 | 0.812 | 0.732 | 0.666 |
| 1/U | 0.285 | 0.420 | 0.556 | 0.691 | 0.826 | 0.961 | 1.096 | 1.232 | 1.366 | 1.502 |
Table 5.
Thickness and Attenuation Degree.
Table 6.
Minimum Temperatures of Inner Surfaces of Rammed Earth Walls of Different Thicknesses.
Table 6.
Minimum Temperatures of Inner Surfaces of Rammed Earth Walls of Different Thicknesses.
| d (mm) | 100 | 200 | 300 | 400 | 500 | 600 |
|---|
| Minimum inner surface temperature (°C) | 11.0 | 15.5 | 17.6 | 19.7 | 20.3 | 21.0 |
Table 7.
Economic Analysis of Energy Consumption and Construction.
Table 7.
Economic Analysis of Energy Consumption and Construction.
| Thickness (mm) | Energy Demand
(kWh/m2) | Electricity
Consumption
(¥0.72/ kWh) | Construction Cost
(¥800/m³) | Total Cost
(¥/m2) | Gain
Payback
(Years) |
|---|
| 325 | 131.3 | 94.5 | 260 | 354.5 | - |
| 335 | 129.8 | 93.5 | 268 | 361.5 | 8 |
| 345 | 128.4 | 92.4 | 276 | 368.4 | 8 |
| 360 | 126.4 | 91.0 | 288 | 379.0 | 8 |
Table 8.
Thickness of XPS Insulation Board.
Table 8.
Thickness of XPS Insulation Board.
| Normative Standard | U [W/m2·K] | Building Shape Coefficient | Thickness |
|---|
| Design Standard for Energy Efficiency of Public Buildings: DB11/687-2015 | 0.45 | ≤0.3 | 50 mm |
| Design Standard for Energy Efficiency of Residential Buildings: DB11/891-2012 | 0.35 | ≤0.3 | 70 mm |
Table 9.
Energy Demands of Different Constructions.
Table 9.
Energy Demands of Different Constructions.
| Types | Structural Forms | Construction Details
(U Is the Same) | Energy Demand (kWh) |
|---|
| Heating | Cooling | All |
|---|
| RE-1 | External insulated rammed earth wall | 50 mm + 360 mm | 14,291.9 | 5512.0 | 19,803.9 |
| 70 mm + 360 mm | 13,306.4 | 5332.7 | 18,639.1 |
| RE-2 | Internal insulated rammed earth wall | 360 mm + 50 mm | 14,407.0 | 5466.1 | 19,873.0 |
| 360 mm + 70 mm | 13,402.1 | 5310.2 | 18,712.3 |
| RE-3 | Sandwich insulated rammed earth wall | 180 mm + 50 mm + 180 mm | 14,340.0 | 5492.0 | 19,832.0 |
| 180 mm + 70 mm + 180 mm | 13,339.2 | 5315.1 | 18,654.3 |
| Aerated concrete | External insulated aerated concrete wall | 15 mm + 200 mm | 14,982.5 | 5698.6 | 20,681.1 |
| 35 mm + 200 mm | 13,709.9 | 5446.8 | 19,156.7 |
| RE | Rammed earth wall | 360 mm | 24,247.7 | 7329.5 | 31,577.2 |
| Concrete | Concrete wall | 850 mm | 31,045.7 | 3739.4 | 34,785.1 |
| Aerated concrete | Aerated concrete wall | 90 mm | 29,676.0 | 4674.1 | 34,350.1 |
Table 10.
Comparative analysis of optimization strategies.
Table 10.
Comparative analysis of optimization strategies.
| Types | Heating
(kWh) | Cooling
(kWh) | Energy Demand
(kWh) | Energy
Efficiency |
|---|
| RE-400 | 25,243.7 | 7470.3 | 32,714.0 | - |
| RE-600 | 21,762.2 | 6812.1 | 28,574.3 | 12.66% |
Optimization strategies
(50 mm XPS) | 14,291.9 | 5512.0 | 19,803.9 | 30.69% |
| Publisher’s Note: MDPI stays neutral with regard to jurisdictional claims in published maps and institutional affiliations. |
© 2022 by the authors. Licensee MDPI, Basel, Switzerland. This article is an open access article distributed under the terms and conditions of the Creative Commons Attribution (CC BY) license (https://creativecommons.org/licenses/by/4.0/).


