Article

Investigation on the Ammonia Boiling Heat Transfer Coefficient in Plate Heat Exchangers

Department of Thermodynamic Sciences, Faculty of Building Services, Technical University of Civil Engineering Bucharest, 66 Pache Protopopescu Blvd., 020396 Bucharest, Romania
*
Author to whom correspondence should be addressed.
Energies 2022, 15(4), 1503; https://doi.org/10.3390/en15041503
Submission received: 5 January 2022 / Revised: 27 January 2022 / Accepted: 14 February 2022 / Published: 17 February 2022

Abstract

:
This investigation aims to compare the experimental and theoretical ammonia boiling heat transfer coefficient in a plate heat exchanger (PHE). Measured data were gathered during functioning of a single stage vapor mechanical compression refrigeration system placed in the Thermal Systems Research Center of the Technical University of Civil Buildings Bucharest (TUCEB). Experimental values fall within the range of 1377–3050 W/m2K. Theoretical values were obtained from 12 correlations confirmed by the literature to date, developed for similar working conditions. The experimental values are close to the theoretical ones for Shah and Jokar correlations applied for a vapor quality of 0.5. The theoretical values are in the range of 1440–2076 W/m2K and 1558–2318 W/m2K, respectively. Shah correlation predicted 82.35% of all data within the ±30% error band at an MAE value of 14.23%, and Jokar et al. predicted 76.47% of all data within the ±30% error band with an MAE value of 17.7%.

1. Introduction

1.1. General Aspects

The requirements imposed by the concept of sustainable development and standards regarding energy consumption reduction oblige that building installations should have the highest possible energy efficiency for the same cooling capacity. Refrigeration systems are energy consuming and they participate in the global warming process (directly by refrigerant and indirectly by the CO2 emissions during operation).
Ammonia is one of the main refrigeration agents used in industrial cooling systems. Due to the fact that it is a natural refrigerant with zero Global Warming Potential and Ozone Depletion Potential, efforts are ceaselessly made in order to use ammonia on a large scale in residential applications, through indirect cooling systems. The main negative aspect is the possible leakage, which can be counteracted by modern facilities design and adapted in order not to endanger the inhabitants.
To improve energy efficiency, one important aspect is related to the heat exchangers used in the refrigeration process. Some main aspects should be considered when choosing their type: providing a small temperature difference between working agents, with implications on minimizing the generated entropy; using compact equipment; and using materials with high thermal conductivity which convert into increased heat transfer coefficients and into lowered energy consumption, in order to achieve the same performance.
Given all this, this paper aims to address the following issues: experimental approach of the heat transfer in the channels of a compact construction ammonia evaporator plate type, PHE, by comparing experimental data to all available correlations up to date. The comparison is made to validate the existing correlations for the geometry and the given working conditions of the evaporator. The research was carried out by the Thermal Science Laboratory, part of the Technical University of Civil Engineering Bucharest.

1.2. Review of Significant Research in the Field

The ammonia evaporation process in PHE has been studied in different papers, and each of them has made a special contribution to the level of knowledge. Our study makes important contributions in the field, as it covers a very wide range of criteria equations provided by researchers, including the most recent ones. In this study, experimental data and results were gathered to highlight which of the available correlations can be applied to evaluate the ammonia boiling in the experimental working conditions.
Djordjevic and Kabelac [1] analyzed ammonia boiling in PHE by using as secondary agent a mixture of water and ethylene-glycol. The heat transfer coefficient was evaluated as a function of mass flux, heat flux and refrigerant type. The saturation temperature recorded values between 268–283 K and the saturation pressure between 3.55–5.73 bar. One important conclusion related to the current study, which was conducted for a vapor quality of x = 0.5 , is that the heat transfer coefficient increases when the mass flux is high and vice versa.
Khan [2] studied the heat transfer in an un-symmetric 30°/60° Chevron plate configuration PHE and proposed a correlation depending on the Chevron angle value. Extensive experimental research has been performed with saturation temperatures between 25   ° C ( 2 )   ° C . In comparison, our research was targeted in a 10 ( 1.5 )   interval. When reaching the maximum temperature limit of ( 2 )   ° C the study stresses that the plate configuration has an important influence on the heat transfer coefficient value. Therefore, for lower angles, 30°/30°, the values were between 2 and 2.5 times lower than in 30°/60° and 60°/60° plate configurations. The decision to implement in the experimental stand a heat exchanger with a 60° Chevron angle and to investigate its working performance was based on those findings.
Sterner [3] assessed ammonia heat transfer in plate heat exchangers having different plate patterns. The authors obtained three equations which have given acceptable results when applied in the range for which they were intended. The correlations were used further in the present article in the process of comparing experimental values with calculated values.
Arima et al. [4] concluded that local boiling heat transfer coefficients for a vertical PHE increased vapor quality and relied on the Lockhart–Martinelli parameter for identifying a correlation, which is used further in this study.
Amalfi et al. [5,6] used an experimental database to establish a methodology for examining the local values of ammonia boiling coefficients. The most important findings which are in full agreement with the results presented above, are that the heat transfer coefficient increases with plate angle and, at the same time, decreases when the hydraulic diameter is augmented. This conclusion is in accordance with [2] and reinforces that, for a 60° Chevron angle, higher heat transfer coefficients are obtained.
The available correlations for phase-change heat transfer in PHE were investigated by Garcia-Cascales et al. [7]. They highlighted the fact that, when using evaporation temperature in the heat transfer coefficient evaluation, one can avoid relying on COP or cooling load, which can have deceiving fluctuations.
A review study written by Eldeeb R. et al. [8] targeted a comparative evaluation for correlations available in the open sources, and their relevancy when being applied for different refrigerants and fluid-flow characteristics. In our study, the authors considered some of the correlations reported in [7,8] which framed in terms of input data with the data corresponding to the present study.
Zhang Ji et al. [9] reviewed the heat transfer enhancement methods particularly for PHE. The research results suggested that the plate angle especially affects the convective boiling heat transfer coefficient and has a smaller influence as regards the nucleate boiling. Panchal C.B. et al. in [10] conducted several experiments using ammonia as the working fluid in a PHE. The authors investigated different plate arrangements in PHE, while varying the plate Chevron angle. The purpose was to determine the optimum plate combination for Ocean Thermal Energy Conversion applications.
In accordance with the experimental data for several refrigerants boiling in PHE, Huang et al. [11] developed correlations which can be used, according to their study, in ammonia boiling heat transfer evaluation.
Recently, in 2018, Ayub Z. et al. [12] made a literature review on evaporation correlations for plate type heat exchangers. Even though the literature provides an important database for correlations related to two-phase flow of ammonia in PHE, most of the studies are valid and applicable to a limited range of values. As stated in [13], general correlations should be like those available for circular circuits in which different coefficients and variables are necessary to be implied in order to consider the plate geometry.
Jokar et al. in [14] put forward a correlation obtained after conducting a dimensional analysis on refrigerant evaporation in heat exchangers with mini channels. An interesting aspect is the fact that, even though the correlation proposed by Joker is intended for narrow spaces, in view of the general applicability of this equation, the authors decided to use it among the verified correlations. By applying it in the conditions in which the experimental research was performed it was discovered that it provides some of the smallest relative errors when compared to experimental values.

1.3. Selection of Correlations Used in the Article

In the following, in Table 1, the authors present the correlations which were selected from the literature, following a thorough study. For the investigation, the authors selected correlations that are recommended for conditions close to the experimental ones, namely: plates with a Chevron angle of 60°, hydraulic diameter of 10 mm, 43 < Re < 63 and mass flow 1.8 G 2.6   kg / m 2 · s .
Even though one of the correlations was developed for boiling in microchannels, such as the one suggested by Mahmoud M. et al. in [15], the authors checked their applicability in the present study as long as the hydraulic diameter calculated for the flow in the PHE falls within the permissible diameter limits in the respective research.
Table 1. Selected correlations for the study.
Investigator Correlation / Comments
G   [ kg /   ( m 2   s ) ] ,   q   [ kW / m 2 ] ,   p   [ Pa ] ,
x [ ] ,   p r   [ Pa ] ,   D h [mm]
1. Kandlikar (1983) h 2 P h = max ( h n b , h c b ) h n b = 0.6683 · C o 0.2 · ( 1 x ) 0.8 · f 2 ( F r l ) · h l + 1058 · B o 0.7 · ( 1 x ) 0.8 · F F l · h l ,
h c b = 1.136 · C o 0.9 · ( 1 x ) 0.8 · f 2 ( F r l ) · h l + 667.2 · B o 0.7 · ( 1 x ) 0.8 · F F l · h l ,
C o = ( ρ g ρ l ) 0.5 · ( 1 x x ) 0.8 ;   B o = q G · h l g ;   R e l = G · ( 1 x ) · D h μ l ;   f = [ 1.58 · l n ( R e l ) 3.28 ] 2
f 2 ( F r l ) = 1   [ ] , F F l = 1   f o r   stainless   steel   plate   *
h l = R e l · P r l · ( f 2 ) · k l D h 1 + 12.7 · ( P r l 2 3 1 ) · ( f 2 ) 0.5     f o r       10 4 R e l 5 · 10 6 ;     h l = ( R e l 1000 ) · P r l · ( f 2 ) · k l D h 1 + 12.7 · ( P r l 2 / 3 1 ) · ( f 2 ) 0.5     f o r   3000 R e l 10 4
Validity: G = 13–8179; q″ = 0.3–2280; p = 0.4–64; 30° < β < 65°, 4000 ≤ Re < 16,000; Ammonia, R22.
2. Ayub (2003) h = C · ( k l D h ) · ( R e l 2 · h l g L p ) 0.4124 · ( p s a t p c r ) 0.12 · ( 65 β ) 0.35
C = 0.1121 for flooded and thermosyphon
Validity: Ammonia, R22; 30° < β < 65°; 4000 ≤ Re < 16,000.
3. Shah (1976, 1982) h 2 P h = max ( h n b , h c b )
h c b = 1.8 · [ C o · ( 0.38 F r l 0.3   ) n ] 0.8 · h l
h n b = F · exp { 2.74 · [ C o · ( 0.38 F r l 0.3   ) n ] 0.1 } · h l
ϕ = { 230   · Bo 0.5   for     Bo > 3 · 10 4   1 + 46 · Bo 0.5   for   Bo < 3 · 10 4 ;   C o = ( ρ g ρ l ) 0.5 · ( 1 x x ) 0.8 ;   B o = q G · h l g ;   F r l = G 2 ρ l · g · D h
n = {   0   i f   F r l > 0.4 1   i f   F r l     0.4                                     F = { 14.7   for     Bo > 1.1 · 10 3   15.43   for   Bo < 1.1 · 10 3 h l = 0.023 · ( k l D h ) · [ G · ( 1 x ) · D h μ l ] 0.8 · P r l 0.4
V a l i d i t y :   0.0053       p r     0.78 ;   10       G < 11 , 000 ;   0.22 < B o · 10 4 < 74.2 ;   0.01       D h     27.1 ;     f o r   30   f l u i d s .  
4. Sterner and Taborek (1992) h = [ ( h n b 0 · F n b ) 3 + ( h l · F 2 P h ) 3 ] 1 / 3
h l = ( Re l 1000 ) · P r l · ( f 8 ) · k l D h 1 + 12.7 · ( P r l 2 / 3 1 ) · ( f 8 ) 0.5
F n b = F p l · ( q q 0 ) n l · ( D h 0.01 ) 0.4 · ( R p 0.000001 ) 0.133 · F ( M )
F p l = 2.816 · ( p s a t p c r ) 0.45 + ( 3.4 + 1.7 1 ( p s a t p c r ) 7 ) · ( p s a t p c r ) 3.7
n l = { 0.8 0.1 · e 1.75 · ( p s a t p c r )   for   all   fluids   except   cryogenic   fluids 0.7 13 · e 1.105 · ( p s a t p c r )   for   cryogenic   fluids
F ( M ) = 0.38 + 0.2 · ln ( M ) + 2.84 · 10 5 · M 2
    F 2 P h = { [ ( 1 x ) 1.5 + 1.9 · x 0.6 · ( ρ l ρ g ) 0.35 ] 1.1   0 x 0.6 { [ ( 1 x ) 1.5 + 1.9 · x 0.6 ( 1 x ) 0.01 · ( ρ l ρ g ) 0.35 ] 2.2 + { ( h g 0 h l ) · x 0.01 [ 1 + 8 · ( 1 x ) 0.7 · ( ρ l ρ g ) 0.67 ] } 2 } 0.5   0.6 x 1
Validity :   0.1 < p < 1100 ;   0.8 < q < 4600 ;   3.9 < G < 4850 ;   0.01 < x < 1.0 ;   q 0 = 150   for   ammonia ;   h n b 0 = 36 , 640   W / m 2 K   for ammonia.
5. Sterner and Sunden (2006) h = C · ( k l D h ) · R e l m · J a n · C o p ;   J a = ρ l · c p , l · ( t w a l l t s a t ) ρ g · h l g   ;   C o = ( 1 x x ) 0.8 · ( ρ g ρ l ) 0.5
C = 18.5 ,   m = 1.05 ,   n = 0.452 ,   p = 2.76   **
Validity :   A m m o n i a   β = 65 ° ;
50 < R e l < 225 ;   12 < q < 185 ;   0.5 < G < 0.9 ;   0.05 < x < 1.0 ; 6   < t s a t < 3   .
6. Arima et al. (2010) h = 16.4 · h l , e q · ( 1 X v v ) 1.08 ;   h l , e q = 0.023 · ( k l D h ) · [ G · ( 1 x ) · D h μ l ] 0.8 · P r l 0.4
X v v = ( 1 x x ) 0.5 · ( ρ g ρ l ) 0.5 · ( μ l μ g ) 0.5   laminar - laminar
Validity :   can   be   utilized   for   evaluating   local   heat   transfer   coefficient   for   ammonia ;   40 < R e l < 3600 ;   15.4     q   24.5 ;   7.4     G     15 ;   0.1     x     0.9 ;   0.7       p     0.9 .
7. Khan, Chyu (2010) and Khan et al. (2014) h = ( 173.5 · β 60 + 257.1 ) · ( k l D h ) · ( R e e q · B o e q ) ( 0.09 · β 60 + 0.0005 ) · p r e d ( 0.624 · β 60 0.822 )
p r e d = p s a t p c r ;   R e e q = G e q · D h μ l
G e q = G · [ ( 1 x m ) + x m · ( ρ l ρ g ) ] 1 / 2 ;   B o e q = q G e q · h l g
Validity :   Ammonia ,   30 ° < β < 60 ° ;   500 < R e l < 2500 ;   3.5 < P r l < 6 ;   1225 < R e e q < 3000 ;
20   q   70 ;   5.5 < G < 27 ;   0.1 < x < 0.9 ; 2         t s a t       25   .
8. Huang et al. (2012) h = 1.87 · 10 3 · ( k l D h ) · ( q · d 0 k l · T s a t ) 0.56 · ( h l g · d 0 a l 2 ) · P r l 0.33
a l = k l ρ l · c p , l ;   d 0 = 0.015 · θ · [ 2 · σ g · ( ρ l ρ g ) ] 0.5   for   a   θ   of   35 ° .
Validity :   28 ° < β < 60 ° ;   1.8   q     6.9 ;   5.6 < G < 52.3 ;   5.9         t s a t       13   .
9. Almalfi et al. (2015) h = 18.495 · ( k l D h ) · ( β β m a x ) 0.248 · ( x · G · D h μ g ) 0.135 · ( G · D h μ l ) 0.351 · ( ρ l ρ g ) 0.223 · B d 0.235 · B o 0.198 ;   for   B d 4
B d = ( ρ l ρ g ) · g · D h 2 σ ;   B o = q G · h l g   ;   β m a x = 70 °
Validity: These correlations are derived from a dimensional analysis, and it has a broad spectrum of applicability in the matter of refrigerant, including ammonia, and plate geometry.
10. Danilova et al. (1981) N u 2 P h = 3 · R e g 0.3 · B d 0.33 ,   0.025 < R e   * < 0.25 ;
R e g = G · x · D h μ g ;   R e   * = B o R e l = q · x · D h μ l · Δ h l g · ;   B d = ( ρ l ρ g ) · g · D h 2 σ
Validity: As this experimental study was conducted in 1981 it includes some of the refrigerants that have been banned from the market, such as R11 or R22. However, at the same time, ammonia was one of the agents investigated during the assessment.
11. Koyama et al. (2014) h l = 0.023 · ( k l D h ) · [ G · ( 1 x ) · D h μ l ] 0.8 · P r l 0.4
h h l = 52.2 · ( 1 X v v ) 0.9 ,   δ = 1   mm ;   h h l = 48.6 · ( 1 X v v ) 0.79 , δ = 2.5 mm
Validity: According to the authors, this is applicable to ammonia boiling local and average (mean) heat transfer coefficient.
12. Jokar et al. (2006) h = 0.603 · ( k l D h ) · R e l 0.5 · p r e d 0 , 1 · x 2 · ( G 2 ρ l 2 · c p , l · ( t w a l l t s a t ) ) 0.1 · ( ρ l 2 · Δ h l g G 2 ) 0.5 · ( ρ l · σ μ l · G ) 1.1 · ( ρ l ρ l ρ g ) 2
p r e d = p s a t p c r
Validity :   Flow   boiling   data ,   D h = 4.0 mm, β = 60°.
* According to [16]. ** According to [17].

2. Materials and Methods

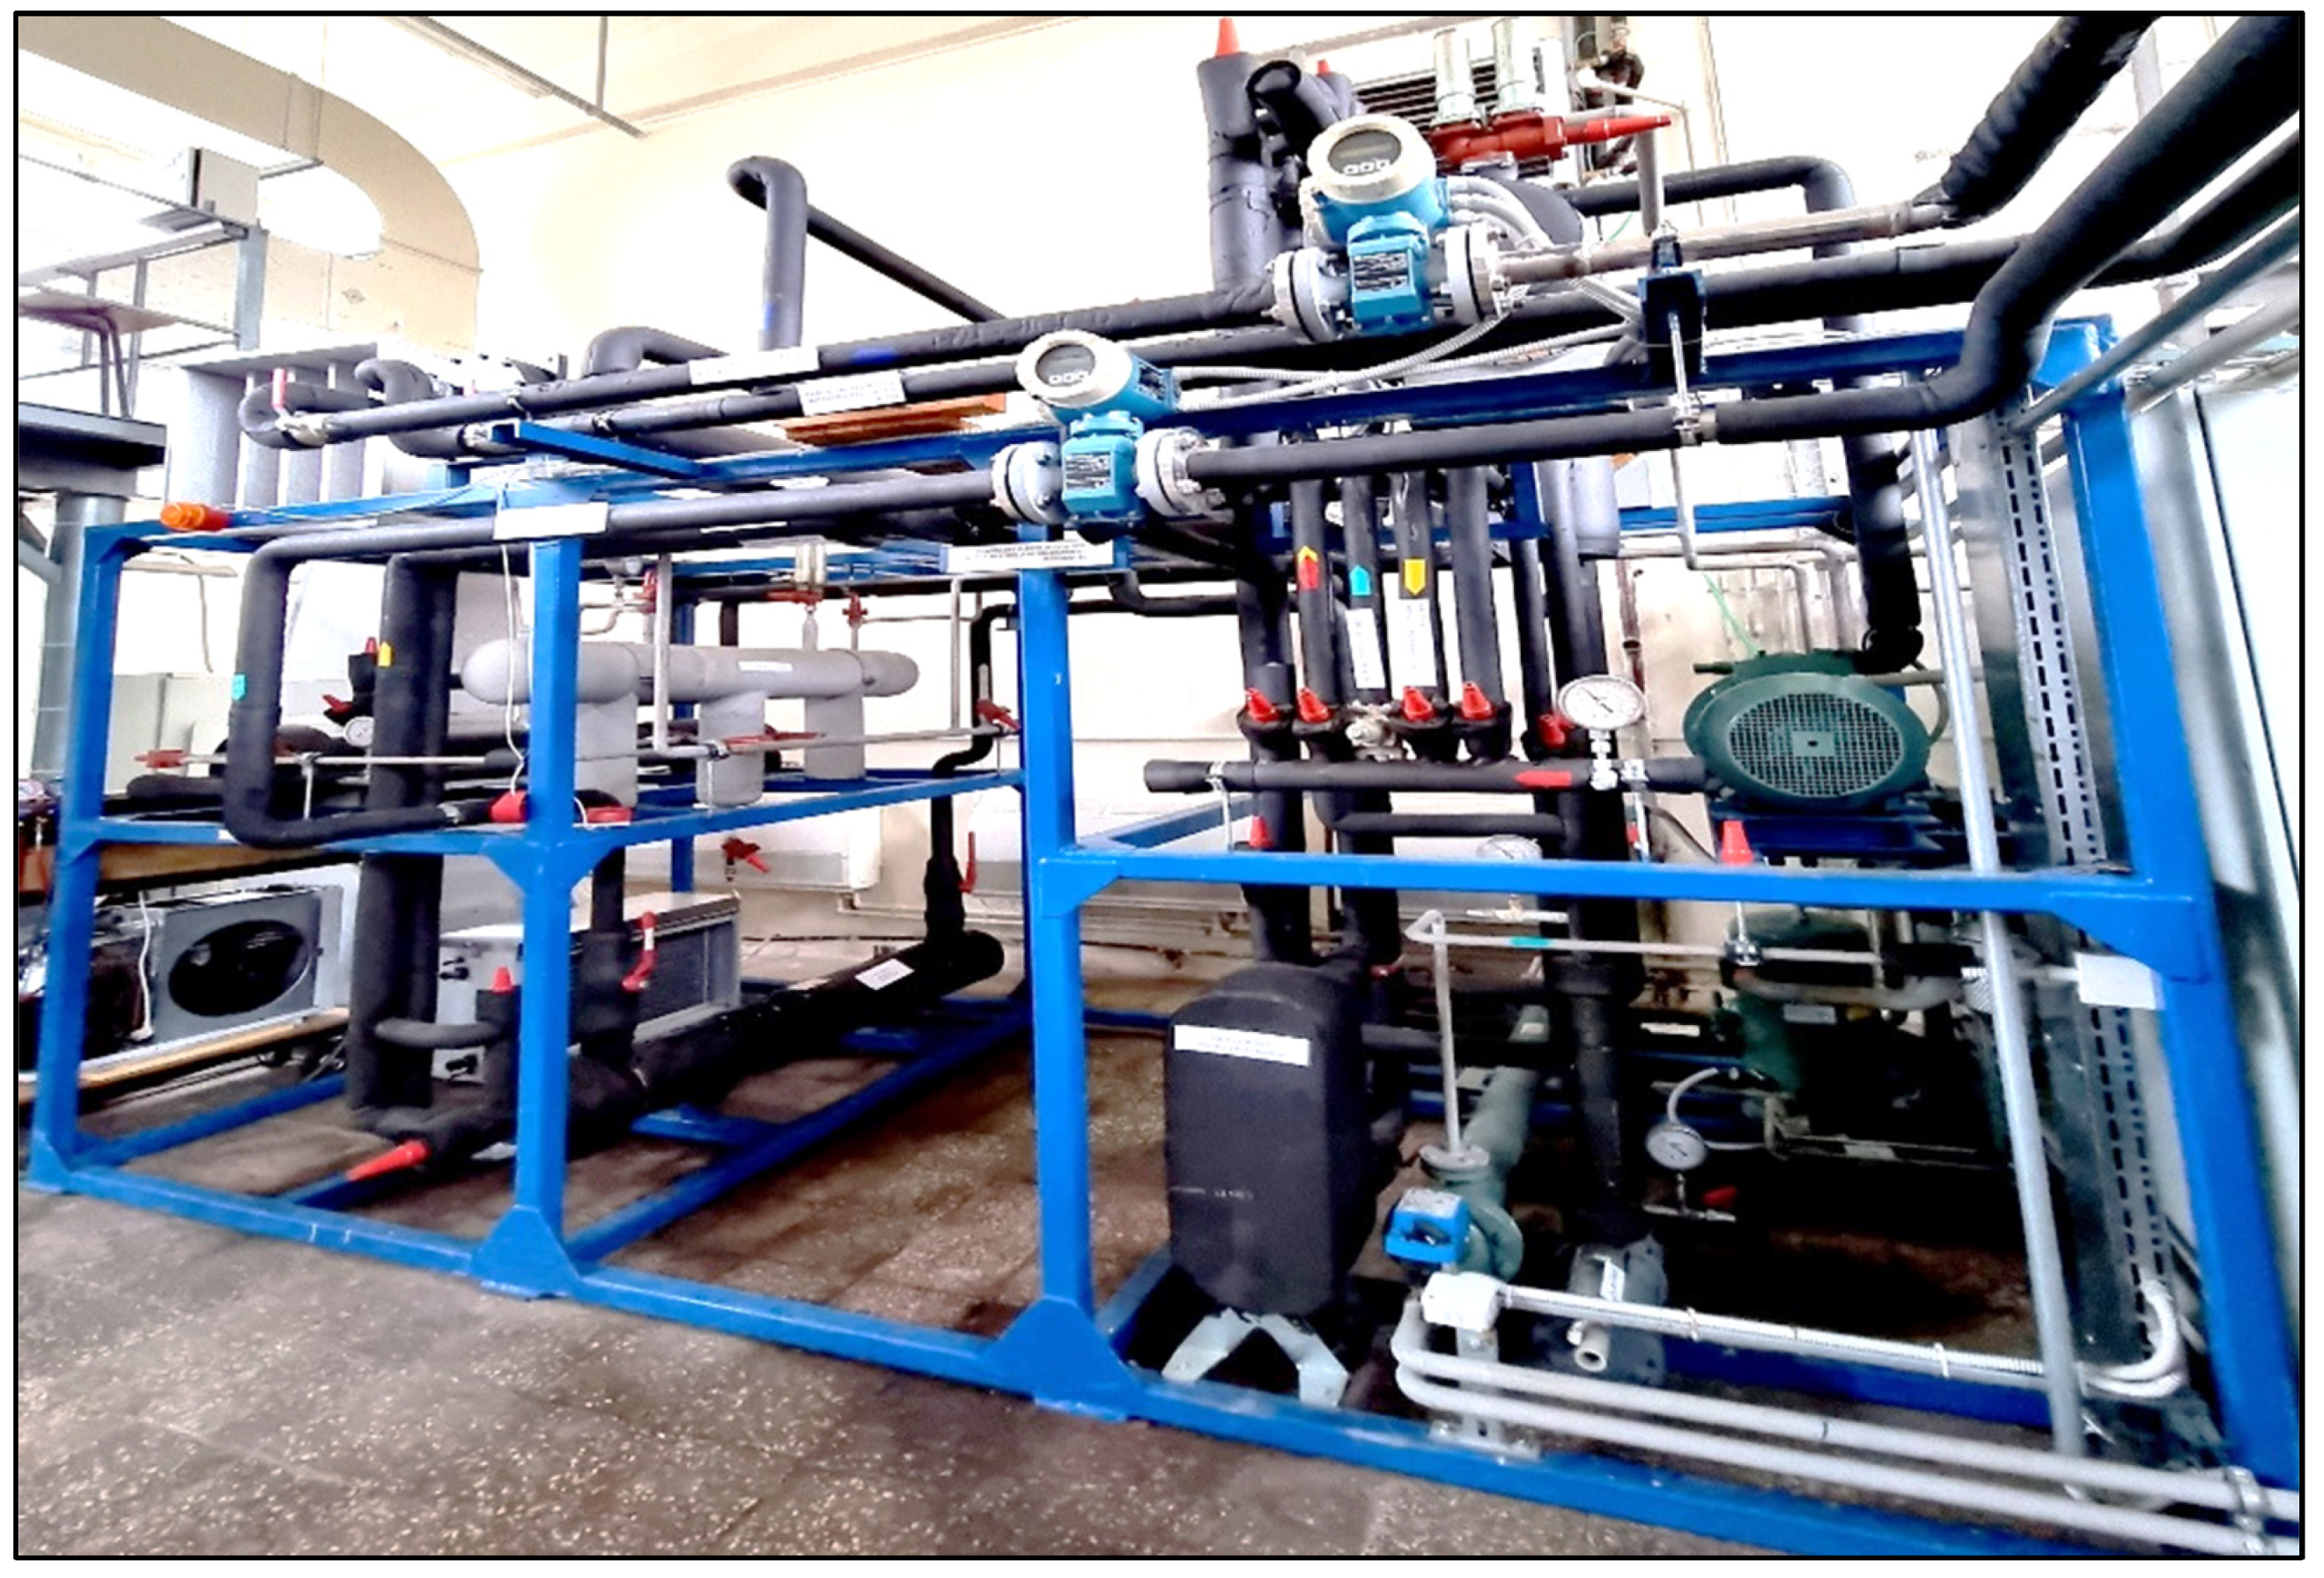
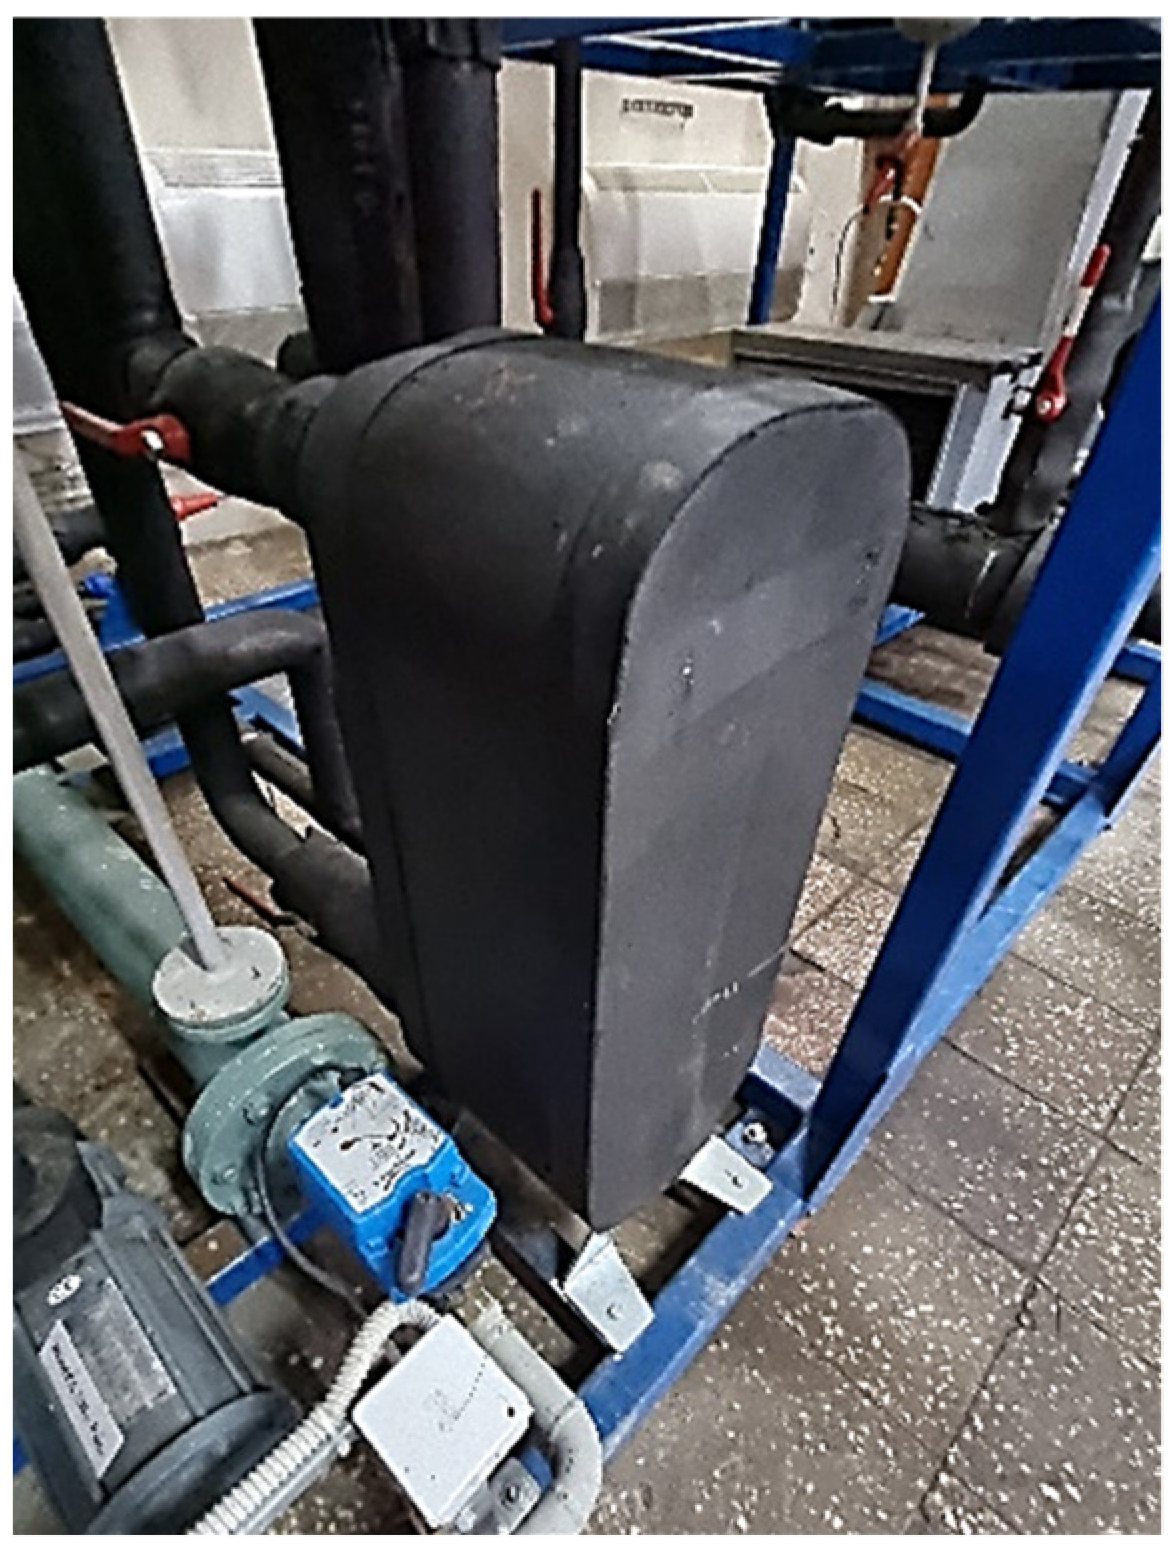
To carry out this study the authors considered measuring the data gathered during the operation of a single stage vapor mechanical compression refrigeration system—Figure 1 and Figure 2, placed in the Thermal Systems Research Center of the Technical University of Civil Buildings Bucharest (TUCEB). This installation was designed with the goal of researching the process of ammonia boiling and condensation and offers the possibility of using shell and tube heat exchangers, as well as the possibility of using plate heat exchangers. In the experimental research carried out by the authors, both evaporator and condenser were plate type, while the shell and tube exchangers were insulated by shut-off valves from the refrigeration circuit. The refrigeration plant is presented in Figure 1 and Figure 2. The cooling load may be adjusted depending on the cooled medium temperature required by the consumer.
As a brief presentation of the working principle, the vapors generated in the evaporator are driven into the liquid separator, and the resulting dry ammonia vapors are directed subsequently to the screw compressor. The cooling capacity of 60 kW corresponds to the evaporation temperature of −10 °C and the condensing temperature of +25 °C. Following the compression process, the vapors are directed to the condenser through an oil separator. The resulted liquid ammonia, following the condensing process, is collected in the liquid storage tank and sent to the subcooler.
Given the fact that this analysis main point of interest is the study of the boiling process which takes place in the PHE, the temperatures at the ammonia inlet and outlet of the evaporator were monitored, as well as the inlet and outlet temperature of the secondary working fluid, a 30/70 ethylene-glycol and water solution.
The plate heat exchanger, Figure 3 and Figure 4 and Table 2, is well insulated and thus it can be assumed that the heat flux given off by the secondary coolant is used entirely for ammonia boiling, the heat losses outside being negligible. The geometrical characteristics were noted as recommended in [13].
The monitoring of the operating parameters is performed by means of the pressure, flow and temperature sensors which are connected to an automation panel. Regarding the heat exchanger which represents the subject of this work, namely the plate evaporator, temperature sensors were used in order to supervise and record the working agent’s temperatures. The sensors are NiCr-Ni type sensors, with a working interval between −25–400 °C and ±0.3 K accuracy. The secondary coolant and the cooling water flow were measured with ±3% accuracy Danfoss electronic flow meters and the ammonia flow rates with a ±1% accuracy Coriolis flow meter.
In the following methodology the experimental ammonia boiling coefficient is calculated by using the experimental evaporator cooling load and the PHE wall temperature, which results from the measured parameters in different working conditions of the stand presented in Figure 1 and Figure 2. This study aims to determine which of the literature available correlations best cover the experimental results. By using the measured data regarding temperature and mass flow on the secondary coolant side, the evaporator’s cooling load was determined. The measured parameters which were taken into consideration correspond to a quasi-steady state operating regime of the system characterized by a maximum ±3% variation of the measured parameters, during 30 min of data monitoring.
Since this plate heat exchanger is very well insulated, the simplifying hypothesis that the flux needed for ammonia boiling is taken up by the secondary agent, the mixture of 30/70 ethylene-glycol/water, can be used. Thus, by applying the energy balance equation on the evaporator PHE we obtain Equation (1). The specific heat was taken at the average cooled solution temperature.
Q ˙ e , e x p . = Q ˙ W + E G = m ˙ W + E G · c p , W + E G · Δ T W + E G   [ W ]
At the same time, by monitoring the condenser water circuit working parameters, and using Equation (2), the heat flux transferred in the condenser was found.
Q ˙ C , e x p . = Q ˙ W = m ˙ W · c p , W · Δ T W   [ W ]
The electrical power consumed by the compressor during operation was measured (including heat losses) with a Fluke 434 analyzer. This analyzer has a nominal voltage range between 1 V to 1000 V, and an input impedance of 4 MΩ/5 pF.
Applying the energy balance on the entire refrigeration system, it was possible to perform a verification of the experimental values calculated with Equations (1) and (2). Taking into consideration that the error obtained was less than 4%, which is the requirement found in most legislation, such as in [19], the above values were considered valid for the next steps. The values obtained for the errors resulting from the energy balance are shown in Figure 5.
According to Equation (3), the specific heat flux transferred to the evaporator is calculated by dividing the total flux necessary for ammonia boiling to the total surface of heat transfer extracted from Table 2.
q ˙ e , e x p . = Q ˙ e , e x p . S   [ W m 2 ]
Experimental ammonia boiling coefficient is calculated by using a simplified form of the conservation Equation of energy (4) which results by taking into account the next statements. The influence of conductive thermal resistance is insignificant, given the fact that the thermal conductivity of the metal is high; the plate thickness is low (1 mm), and there are no sediments on the heat exchanger plate sides.
q ˙ e , e x p . = h N H 3 , e x p . · ( T s a t ,   a m m o n i a T w a l l ¯ ) = h W + E G   · ( T w a l l ¯ T W + E G ¯ ) [ W m 2 ]
The average temperature of the secondary working fluid, T W + E G ¯ , was considered the average between the inlet and outlet in the heat exchanger, both measured by the authors.
The wall (plate) average temperature, T w a l l ¯ results from Equation (5) were derived from the second part of Equation (4).
T w a l l ¯ = T W + E G ¯ q ˙ e , e x p . h W + E G
The convective heat transfer coefficient for the mixture of 30/70 ethylene-glycol/water, h W + E G was evaluated with Equation (6) proposed by [20]. This is the most up to date study regarding the single-phase flow of ethylene-glycol/water solution in PHE valid for Reynolds numbers 50 R e W + E G 8000 and 2 P r W + E G 290 .
h W + E G = D h k W + E G · ( 1.342 · 10 4 · β 2 + 1.808 · 10 2 · β 0.0075 ) · R e W + E G ( 7.96 · 10 5 · β 2 + 9.69 · 10 3 · β + 0.316 ) · R e W + E G φ / β · R e W + E G γ / β · P r W + E G 1 / 3 · ( μ W + E G μ w a l l ) 0.14   [ W m 2 K ]
Experimental ammonia boiling coefficient results from Equation (7) were derived from the first part of Equation (4).
h N H 3 , e x p . = q ˙ e , e x p . ( T s a t ,   a m m o n i a   T w a l l ¯ )   [ W m 2 K ]
The range for the quantities measured on the experimental stand during the study are presented in Table 3.
The range for calculated values on the base of measured data, using the above methodology, are presented in Table 4.

3. Results

In the following section the authors compare the experimental values obtained for the boiling coefficient on the ammonia side in a PHE, in the operating conditions reported in Table 3, with the results obtained from 12 correlations confirmed by the literature, presented in Table 1.
The mean refrigerant vapor quality was considered x = 0.5 in all studied empirical correlations.
By using the obtained values for the mean relative and absolute errors, in Equations (8) and (9) a statistic comparison of correlations with experimental results was conducted:
MRE = 1 N · N h c a l c . h N H 3 . e x p . h N H 3 . e x p .
MAE = 1 N · N | h c a l c . h N H 3 . e x p . | h N H 3 . e x p .
where h c a l c . represents the calculated value with the 12 correlations that were evaluated.
The statistic comparison is highlighted in Table 5. For the present study, the database has n = 51 sets of measurements.
The authors considered that MAE values less than 30% can be viewed as reliable and consequently these are highlighted in bold in Table 5. By analyzing the results, a first conclusion could be extracted, namely, the correlations given by Arima, Khan, Almalfi, Danilova, Huang and Koyama deliver results far outside the range of values obtained by experimental data modelling. To have a clear view on the distribution of values, for the rest of the correlations, the authors introduced the results in Figure 6 and Figure 7.
As considered by similar studies such as [14,21,22,23,
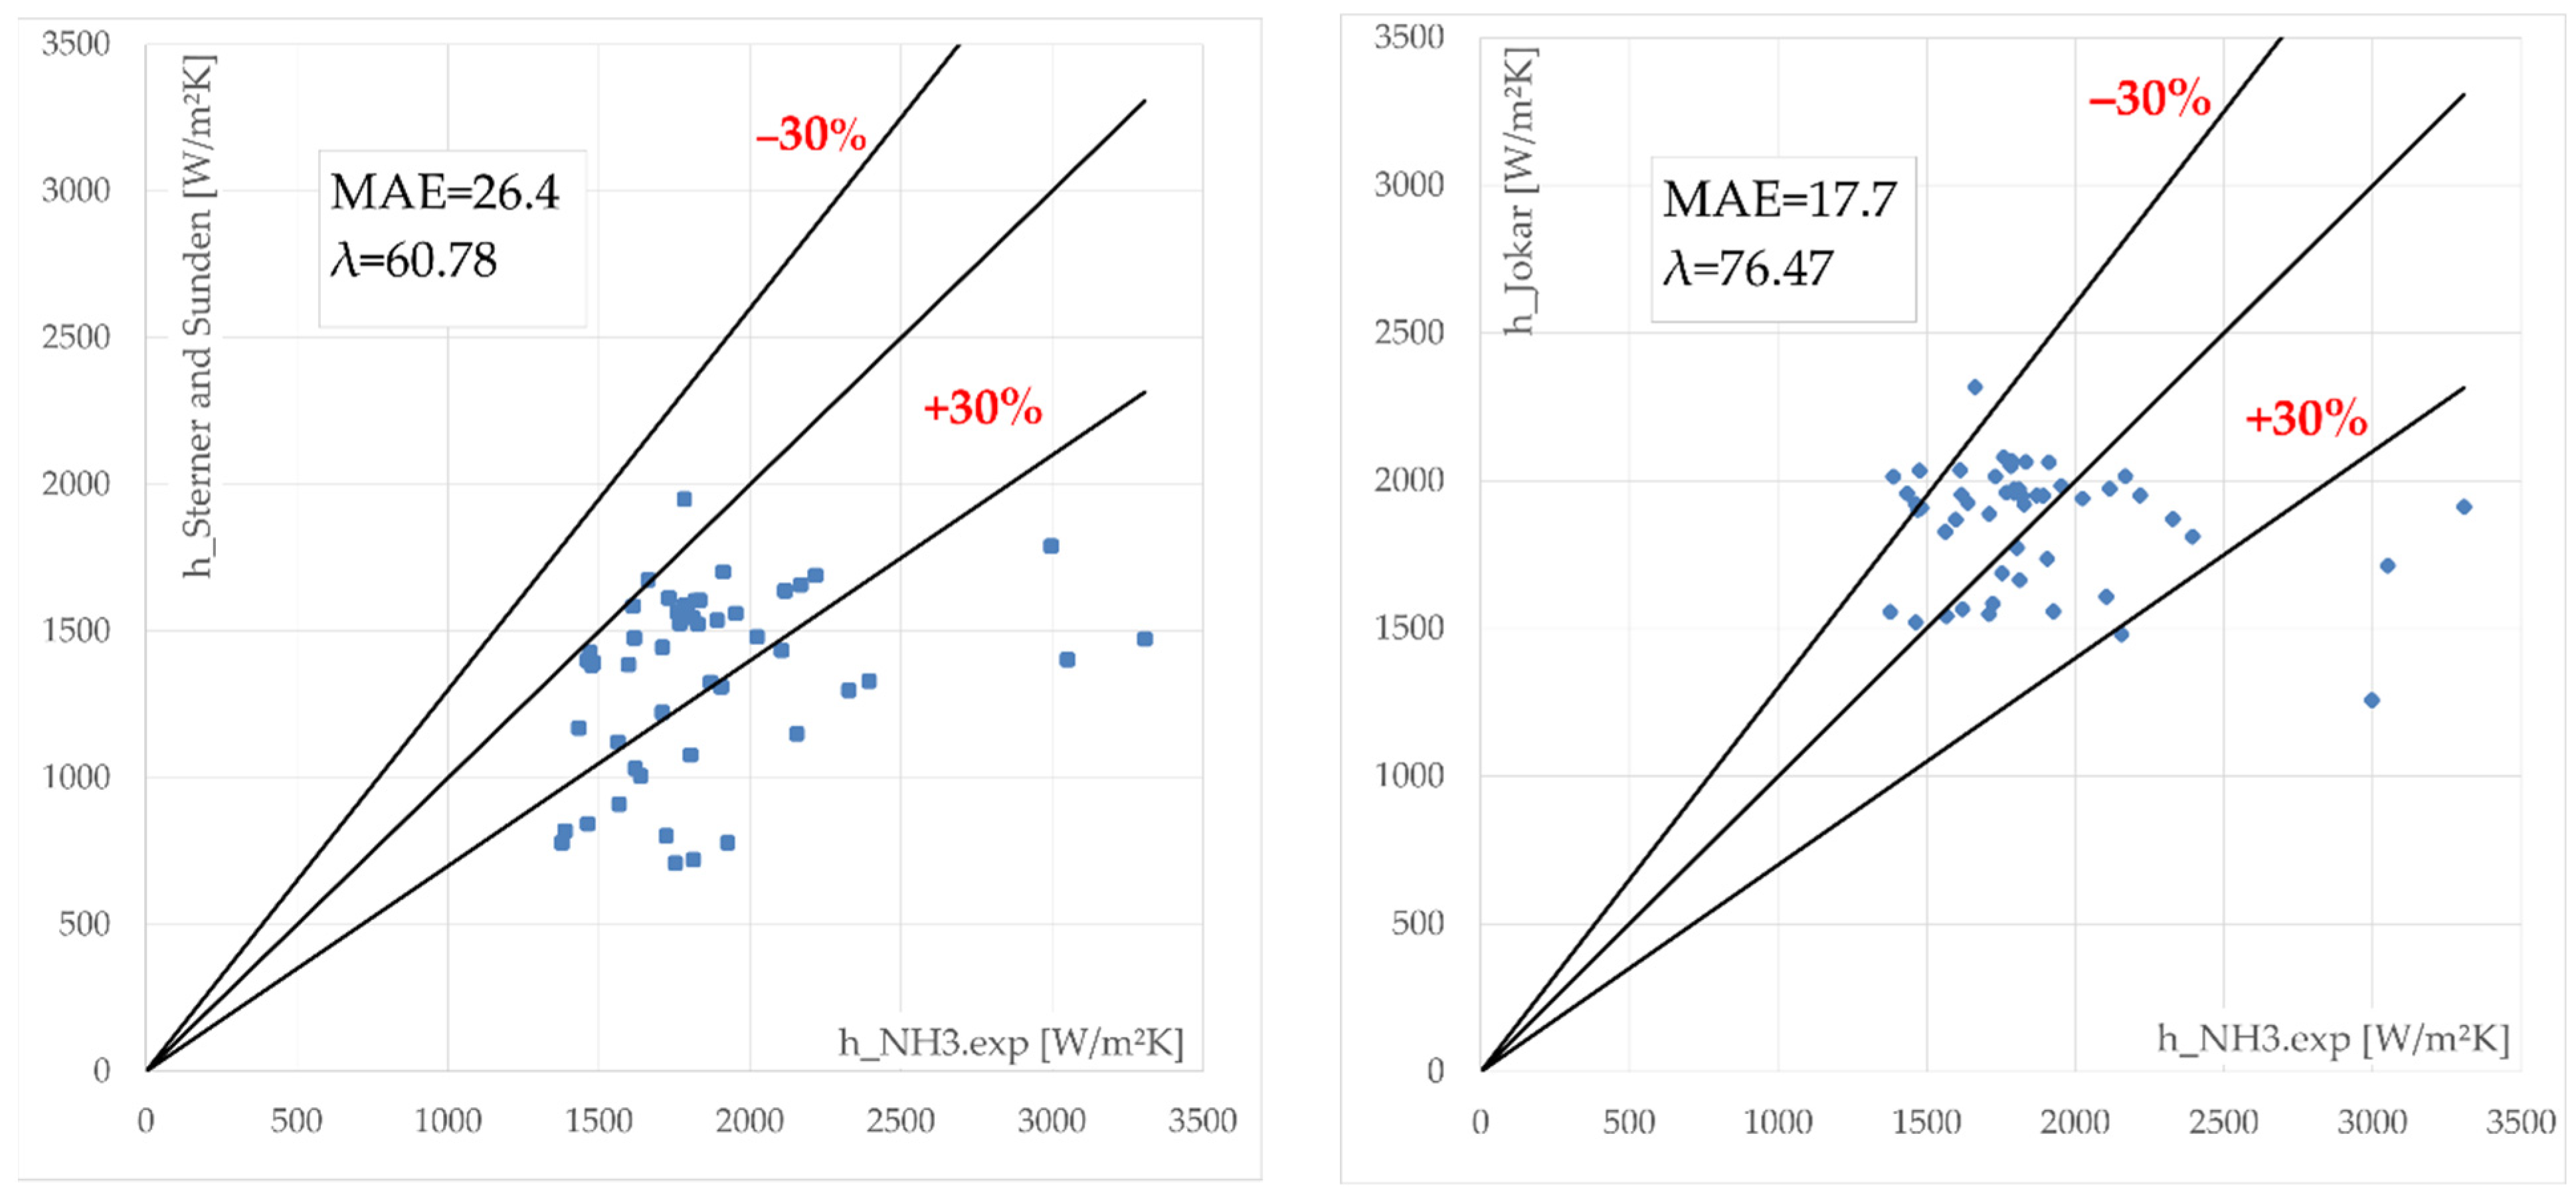
24], the attention is focused on the range of ±30% as against the trendline of the experimental values in Figure 6, and directly against the experimental values in Figure 7, respectively.

4. Discussion

The thermal performance of PHE operating as evaporators is directly related to ammonia boiling heat transfer coefficient values. The first step of the study consists of the evaluation of the experimental ammonia boiling coefficient by considering 51 data points.
This process, which takes place inside PHE, is made up by two mechanisms: nucleate and convective boiling [25]. As considered by similar studies such as [14,21,22,23,24], we decided to focus the attention on the range of ±30% of the experimental values.
The first step of the study was the determination of global boiling heat transfer coefficient experimental value, based on 51 different sets of measurements obtained in real working conditions. Experimental values fall within the range of 1377–3050 W/m2K. It was noticed that, when specific heat flux increases, the same trend is followed by the ammonia boiling heat transfer coefficient.
Regarding the bibliography analyzed for this article, two of the papers present experimental findings on ammonia vaporization in PHE, Khan et al. [2] and Arima et al. [14]. Nevertheless, the testing conditions were significantly different.
For [2] the specific heat flux was in the range of 6.5 8.5   kg / m 2 · s and the specific heat flux between 21 44   kW / m 2 , both corresponding to saturation temperatures between −25 and −2 °C. For [4] the specific heat flux was in the range of 7.5 15   kg / m 2 · s and the specific heat flux in the range of 15 20   kW / m 2 , both corresponding to positive saturation temperatures between 13.5 and 21.6 °C.
The 12 heat transfer correlations for the theoretical study were selected on the following criteria: to be recommended for ammonia, to be applicable to PHE, and to satisfy the validity range both from the geometrical configuration and flow characteristics point of view. The theoretical study shows that the values obtained using the above-mentioned correlations are largely scattered.
However, for these correlations, most often the secondary agent in the heat exchanger is water and in situations where water–ethylene-glycol solution is used, its concentration in the solution is not specified.
By investigating Table 4 and Figure 6 and Figure 7 important conclusions could be drawn. Shah correlation [24] predicted 82.35% of the experimental values into an ±30% error band, at a 14.23% MAE and −3.06% MRE value. The second-best results were given by the Jokar correlation [14]. It predicted 76.47% of the experimental values into an ±30% error band with a 17.7% MAE value and 4.51% MRE value. The Sterner and Taborek [21] correlation predicted 70.59% of all data at an MAE value of 21.05% and at an MRE value of −18.26%. The last correlation considered is Sterner and Sunden [3], which predicted 60.78% of all data having an MAE value of 26.4% and MRE value of −26%.
If we decrease the accepted range of errors even more, at ±20% required for design calculations, only Shah and Jokar correlations predicted 64.71% and 62.75%, respectively.
At the same time, two of the considered correlations, Kandlikar [16] and Ayub [12], gave results close to the ±30% error band, with MAE values of 43.89% and 37.29%, respectively.
In addition to the discussion of the most relevant correlation for estimating experimental data, the authors made an analysis of the dependence between certain important quantities in assessing the heat transfer.
The experimental value of the convection heat transfer coefficient versus the ammonia mass flux at different specific heat flux, q , is described in Figure 8. The trend of the experimental data from our study shows a slight increase in the boiling ammonia coefficient with the mass flux. This confirms the results of Djordjevic et al. [1].
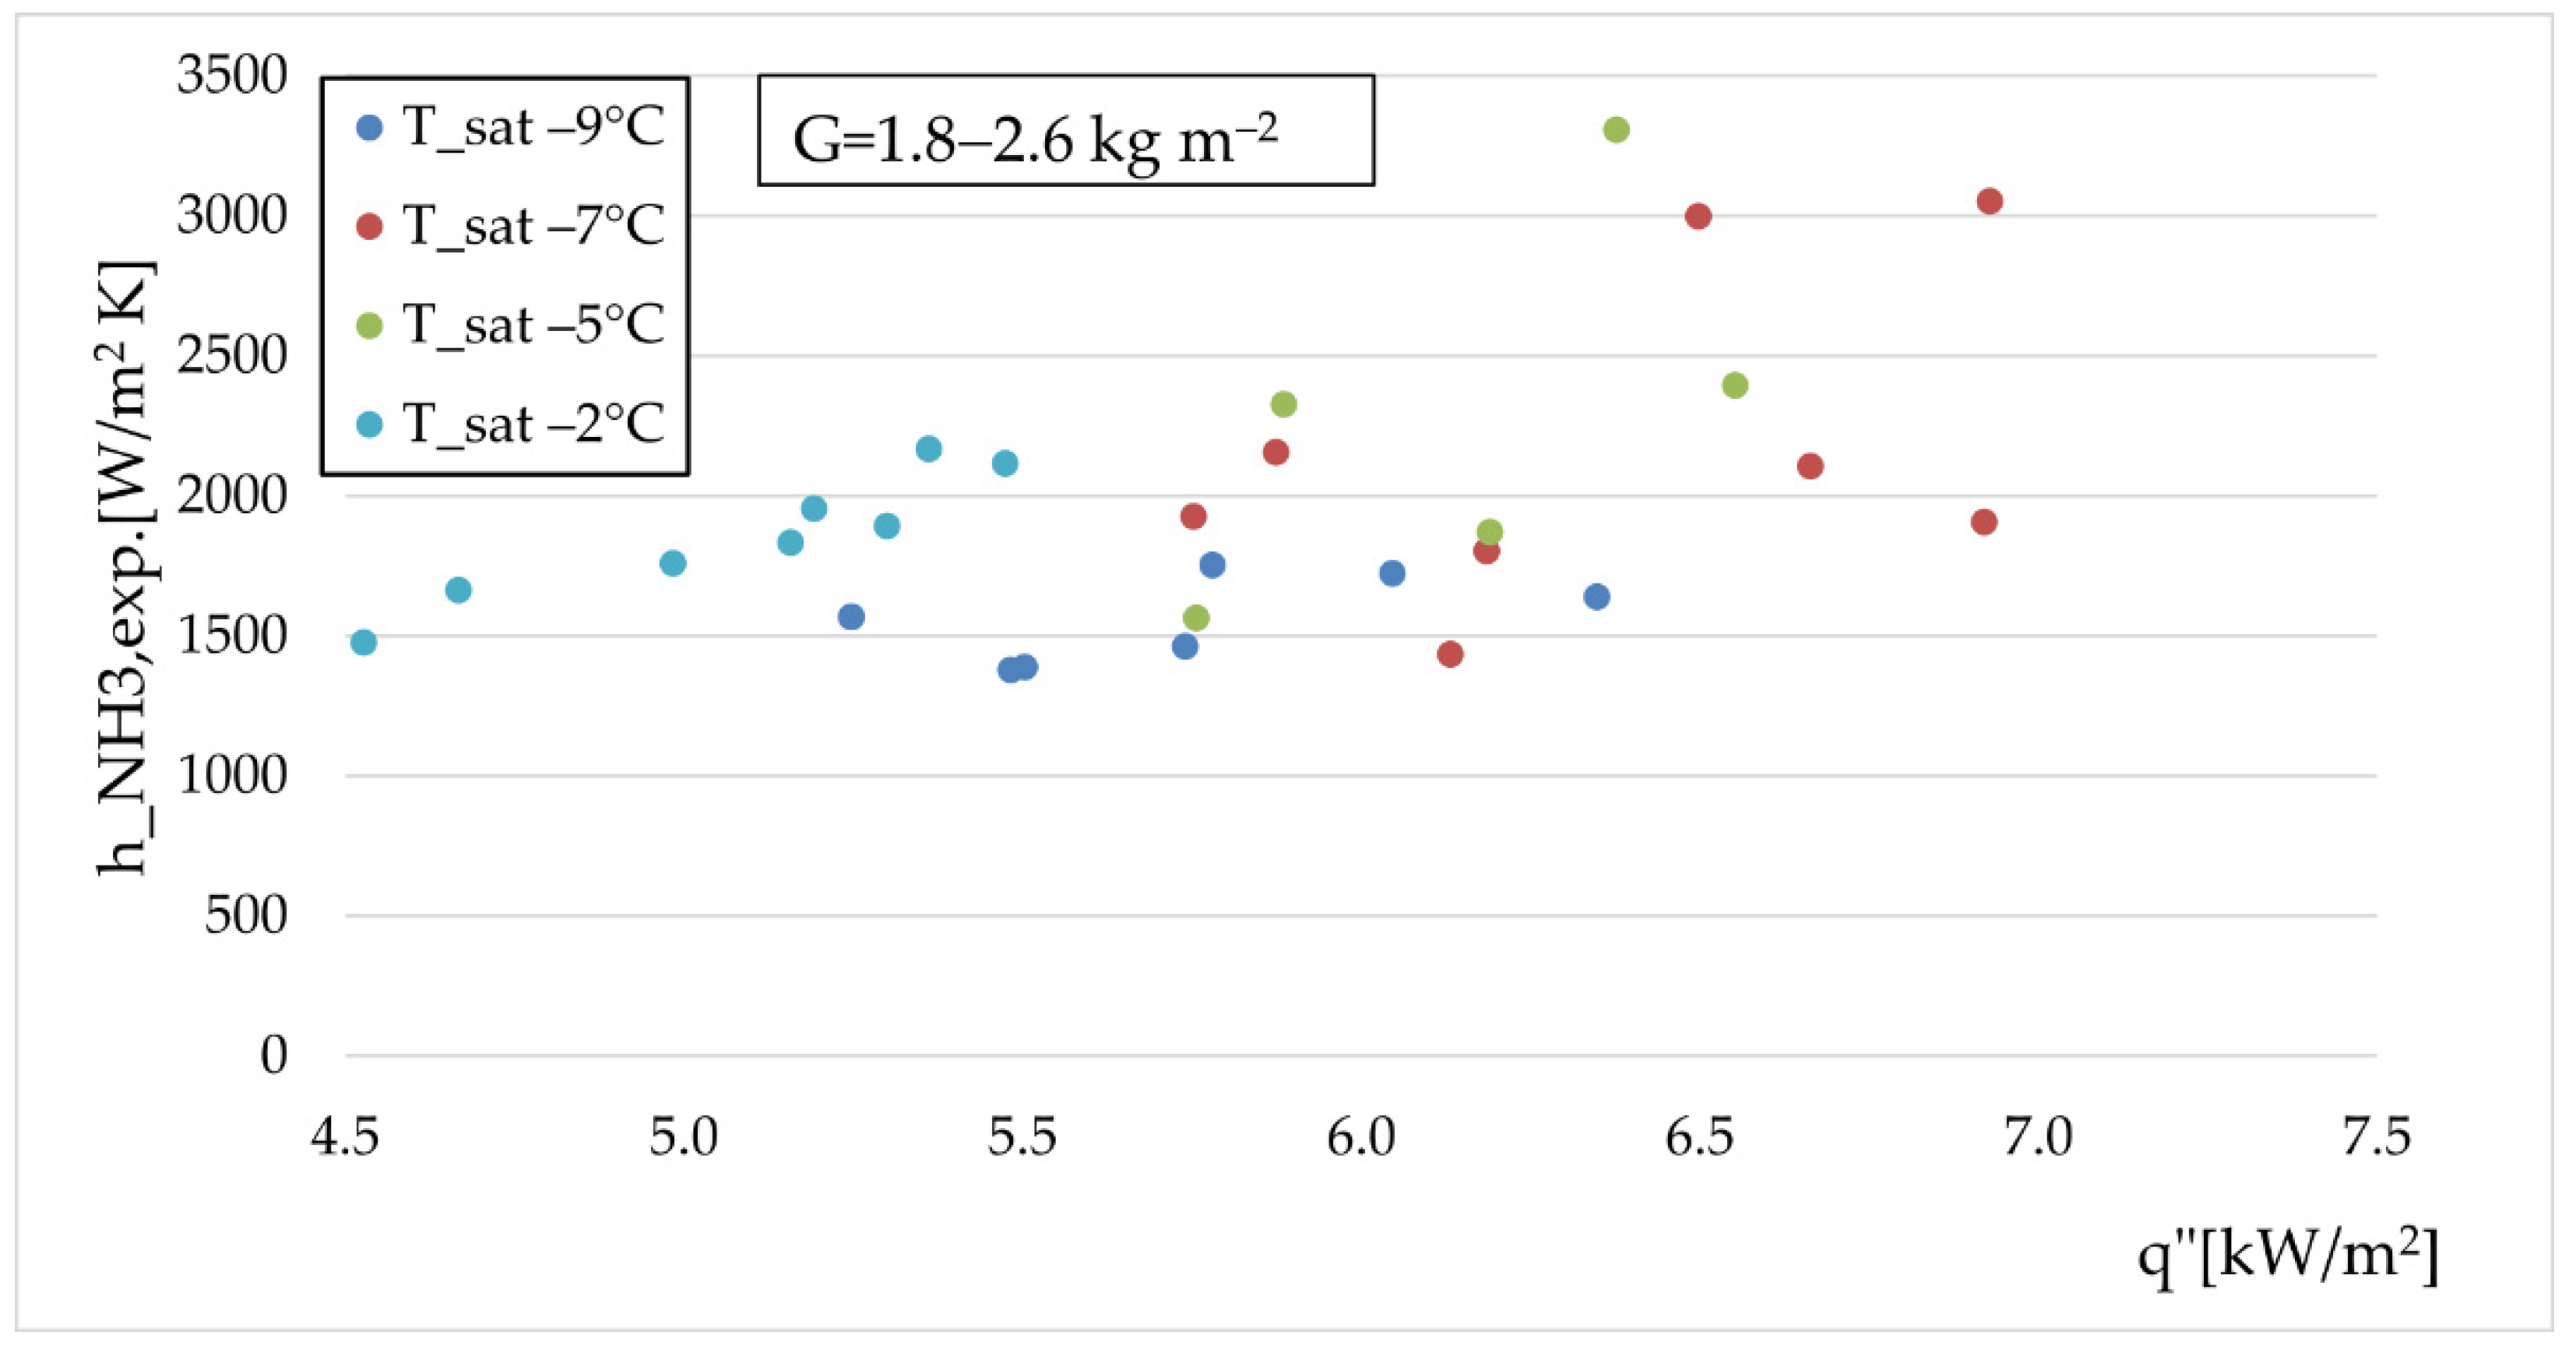
The experimental value of the ammonia boiling heat transfer coefficient vs. heat flux at various temperatures is presented in Figure 9.
Figure 9 shows that, although the effect of specific heat flux is not considerable, the heat transfer coefficient is rising with an increase of a fixed mass flux in the evaporation temperature. Khan [2] emphasized the same trend. The slight upward trend of the heat transfer coefficient can be visible up to 7   kW / m 2 , following a gradual decrease when increasing the heat flux further.

5. Conclusions

A plate heat exchanger evaporator operating in a single stage ammonia refrigeration plant was investigated. A theoretical and experimental study was developed under the following operating conditions: ammonia mass flow rate within the range 0.0227–0.0387 kg/s; condensing temperature of 25 °C; evaporating temperature between −10 and −1.5 °C; and cooling brine temperature between 4.1 and 6.4 °C. The best predictions in terms of ammonia boiling heat transfer coefficient experimental value were made by applying Shah and Jokar correlations having an MAE of 14.23% and 17.7%, respectively. The other ten correlations analyzed, namely Khan [2], Sterner and Sunden [3], Arima [4], Almalfi [5], Huang [11], Ayub [12], Kandlikar [16], Koyama [26], Danilova [27], and Sterner and Taborek [28], lead to unacceptably large deviations compared to the experimental values, under the specified conditions related to the system operating conditions. The novelty of our study focused on the following main ideas:
To date, ammonia boiling in PHE has been less approached in Romania. The experimental stand used for the present study integrates compact heat exchangers and a screw compressor. The experimental results can be considered reliable because of the high accuracy sensors used, and the values were verified by applying the energy balance both for each piece of equipment and together with the entire system.
The convection coefficient on the ammonia side in a PHE evaporator determination is a very complex process and the information available in the literature is still not extensive enough for the extended range of all the parameters involved. The contribution to the development of knowledge in the field consists of using determinations made on an experimental stand especially built for these types of investigations, using lower ammonia mass flux than in other similar studies, in the range of 1.8 2.6   kg / m 2 · s and a lower specific flux, having the values inside a 4 7.3   kW / m 2 interval.
Another novelty is implementing in the Methodology Section the Yang J., Jacobi A., and Liu W. [20] correlations for the convective coefficient which were designed especially for water–ethylene-glycol mixtures. The previous studies considered the criterial correlations developed for water for this evaluation. Future efforts should be made to adapt the correlations to the altered constant coefficients to decrease the MAE for the working ranges investigated in our study.

Author Contributions

Conceptualization, A.G., R.C. and A.I.; Methodology, A.I., A.C. and R.C.; Investigation, A.I., R.C. and A.G.; Writing—Original Draft Preparation, R.C.; Writing—Review and editing, A.I. and A.G.; Visualization, R.C.; Supervision, A.I. All authors have read and agreed to the published version of the manuscript.

Funding

This research received no external funding.

Institutional Review Board Statement

Not applicable.

Informed Consent Statement

Not applicable.

Data Availability Statement

Not applicable.

Conflicts of Interest

The authors declare no conflict of interest.

Abbreviations

Symbols
A Heat transfer area [ m 2 ] M —Molecular mass [ kg / kmol ]
a—Thermal diffusivity [ m 2 / s ] m ˙ —Mass flow rate [ kg / m 2 · s ]
b —Corrugation depth [ m ] MAE—Mean absolute error [%]
Bd —Bond number [ ] MRE—Mean relative error [%]
Bo —Boiling number [ ] N—Number from data base
c p —Specific heat [ J / kgK ] Nu —Nusselt number [ ]
Co —Convection number [ ] p —Pressure [ MPa ]
Dh —hydraulic diameter [ m ] Pr —Prandtl number [ ]
e Euler number   [ ] P—electrical power [W]
f —Darcy friction factor [ ] Pc—Corrugation pitch [m]
F—Enhancement factor for convective boiling [−] Q ˙ —Heat transfer rate [W]
F fl —Fluid dependent factor [ ] q —Specific heat flux [ W / m 2 ]
g —Gravitational acceleration [ m / s 2 ] Re —Reynolds number [ ]
G —Specific mass flux [ kg / m 2 · s ] R p —Surface roughness [ m ]
h —Convective heat transfer coef. [ W / m 2 K ] T Temperature   [ K ]
H —Height [ m ] U—Overall heat transfer coefficient for the plate [W/m2 K]
Δ h l g —Latent heat of vaporization [ J / kg ] t —Thickness [ m ]
Ja —Jacob number [ ] X vv Lockhart Martinelli   parameter   [ ]
k—Thermal conductivity [ W / mK ] x—Vapor quality [ ]
L —Length [ m ] W —Width [ m ]
Greek letters
β —Chevron angle [ ° ] μ —Dynamic viscosity [ Pa · s ]
ε —Arithmetic mean roughness [ μ m ] ν —Cinematic viscosity [ m 2 / s ]
ϕ —Two phase multipliers [ ] ρ —Density [ kg / m 3 ]
φ —Surface enlargement factor [ ] σ —Superficial tension [ J / m 2 ]
λ—Statistical parameter [ ] ξ—Statistical parameter [ ]
Subscript
C—Condenser n b —Nucleate boiling
calc.—CalculatedNH3—Ammonia
c b —Convective boilingout—Outlet
c r Critical p —Port
e—Evaporator r e d —Reduced
EG—Ethylene-glycol s a t —Saturation
exp—Experimental s b —Sub-critical boiling
g —Vapor 2 P h —Biphasic
in—Inlet 0 —Reference value
K—Compressorwall—Wall
l Liquidw—Water
m —Mean

References

  1. Djordjevic, E.; Kabelac, S. Flow boiling of R134a and ammonia in a plate heat exchanger. Int. J. Heat Mass Transf. 2008, 51, 6235–6242. [Google Scholar] [CrossRef]
  2. Khan, M.S.; Khan, T.S.; Chyu, M.-C.; Ayub, Z.H. Evaporation heat transfer and pressure drop of ammonia in a mixed configuration chevron plate heat exchanger. Int. J. Refrig. 2014, 41, 92–102. [Google Scholar] [CrossRef]
  3. Sterner, D.; Sunden, B. Performance of Plate Heat Exchangers for Evaporation of Ammonia. Heat Transf. Eng. 2006, 27, 45–55. [Google Scholar] [CrossRef]
  4. Arima, H.; Kim, J.; Okamoto, A.; Ikegami, Y. Local boiling heat transfer characteristics of ammonia in a vertical plate evaporator. Int. J. Refrig. 2010, 33, 359–370. [Google Scholar] [CrossRef]
  5. Amalfi, R.L.; Vakili-Farahani, F.; Thome, J.R. Flow boiling and frictional pressure gradients in plate heat exchangers. Part 1: Review and experimental database. Int. J. Refrig. 2016, 61, 166–184. [Google Scholar] [CrossRef]
  6. Amalfi, R.L.; Vakili-Farahani, F.; Thome, J.R. Flow boiling and frictional pressure gradients in plate heat exchangers. Part 2: Comparison of literature methods to database and new prediction methods. Int. J. Refrig. 2016, 61, 185–203. [Google Scholar] [CrossRef] [Green Version]
  7. García-Cascales, J.R.; Vera-García, F.; Corberan, J.M.; Maciá, J.G. Assessment of boiling and condensation heat transfer correlations in the modelling of plate heat exchangers. Int. J. Refrig. 2007, 30, 1029–1041. [Google Scholar] [CrossRef]
  8. Eldeeb, R.; Aute, V.; Radermacher, R. A survey of correlations for heat transfer and pressure drop for evaporation and condensation in plate heat exchangers. Int. J. Refrig. 2016, 65, 12–26. [Google Scholar] [CrossRef]
  9. Zhang, J.; Zhu, X.; Mondejar, M.E.; Haglind, F. A review of heat transfer enhancement techniques in plate heat exchangers. Renew. Sustain. Energy Rev. 2019, 101, 305–328. [Google Scholar] [CrossRef]
  10. Panchal, C.B.; Hills, D.L.; Thomas, A. Convective Boiling of Ammonia and Freon 22 in Plate Heat Exchangers. In Proceedings of the ASME-JSME Thermal Engineering Joint Conference, Honolulu, HI, USA, 20 March 1983. [Google Scholar]
  11. Huang, J.; Sheer, T.J.; Bailey-McEwan, M. Heat transfer and pressure drop in plate heat exchanger refrigerant evaporators. Int. J. Refrig. 2012, 35, 325–335. [Google Scholar] [CrossRef]
  12. Ayub, Z.H.; Khan, T.S.; Salam, S.; Nawaz, K.; Ayub, A.H.; Khan, M. Literature survey and a universal evaporation correlation for plate type heat exchangers. Int. J. Refrig. 2019, 99, 408–418. [Google Scholar] [CrossRef]
  13. Tullie Circle, N.E. (Ed.) ASHRAE Fundamentals; ASHRAE Publishing House: Atlanta, GA, USA, 2021; ISBN 978-1-947192-90-4. [Google Scholar]
  14. Jokar, A.; Hosni, M.H.; Eckels, S.J. Dimensional analysis on the evaporation and condensation of refrigerant R-134a in minichannel plate heat exchangers. Appl. Therm. Eng. 2006, 26, 2287–2300. [Google Scholar] [CrossRef]
  15. Mahmoud, M.; Karayiannis, T. Heat transfer correlation for flow boiling in small to micro tubes. Int. J. Heat Mass Transf. 2013, 66, 553–574. [Google Scholar] [CrossRef] [Green Version]
  16. Kandlikar, S.G.; Balasubramanian, P. An Extension of the Flow Boiling Correlation to Transition, Laminar, and Deep Laminar Flows in Minichannels and Microchannels. Heat Transf. Eng. 2004, 25, 86–93. [Google Scholar] [CrossRef]
  17. Bertsch, S.S.; Groll, E.A.; Garimella, S.V. Review and Comparative Analysis of Studies on Saturated Flow Boiling in Small Channels. Nanoscale Microscale Thermophys. Eng. 2008, 12, 187–227. [Google Scholar] [CrossRef]
  18. Heavner, R.L.; Kumar, H.; Wanniarachchi, A.S. Performance of an Industrial Heat Exchanger: Effect of Chevron Angle. In AIChE Symposium Series; American Institute of Chemical Engineers: New York, NY, USA, 1993; Volume 89, pp. 262–267. [Google Scholar]
  19. EN 442-1 Radiators and Convectors—Part 1: Technical Specifications and Requirements. Available online: https://magazin.asro.ro/ro/standard/232614 (accessed on 15 November 2021).
  20. Yang, J.; Jacobi, A.; Liu, W. Heat transfer correlations for single-phase flow in plate heat exchangers based on experimental data. Appl. Therm. Eng. 2017, 113, 1547–1557. [Google Scholar] [CrossRef]
  21. Chen, G.F.; Gong, M.Q.; Wang, S.; Wu, J.F.; Zou, X. New flow boiling heat transfer model for hydrocarbons evaporating inside horizontal tubes. In Proceedings of the AIP Conference Proceedings, Anchorage, AK, USA, 17–21 June 2013; Volume 1573, p. 1092. [Google Scholar]
  22. Tao, X.; Ferreira, C.A.I. Heat transfer and frictional pressure drop during condensation in plate heat exchangers: Assessment of correlations and a new method. Int. J. Heat Mass Transf. 2019, 135, 996–1012. [Google Scholar] [CrossRef]
  23. Zhang, J.; Haglind, F. Experimental analysis of high temperature flow boiling heat transfer and pressure drop in a plate heat exchanger. Appl. Therm. Eng. 2021, 196, 117269. [Google Scholar] [CrossRef]
  24. Shah, M. A general correlation for heat transfer during film condensation inside pipes. Int. J. Heat Mass Transf. 1979, 22, 547–556. [Google Scholar] [CrossRef]
  25. Longo, G.; Mancin, S.; Righetti, G.; Zilio, C. A new model for refrigerant boiling inside Brazed Plate Heat Exchangers (BPHEs). Int. J. Heat Mass Transf. 2015, 91, 144–149. [Google Scholar] [CrossRef]
  26. Koyama, K.; Chiyoda, H.; Arima, H.; Ikegami, Y. Experimental study on thermal characteristics of ammonia flow boiling in a plate evaporator at low mass flux. Int. J. Refrig. 2014, 38, 227–235. [Google Scholar] [CrossRef]
  27. Danilova, G.N.; Azarskov, V.M.; Zemskov, B.B. Heat transfer in plate evaporators of different geometry. Kholod. Tek. 1981, 4, 25–31. [Google Scholar]
  28. Steiner, D.; Taborek, J. Flow Boiling Heat Transfer in Vertical Tubes Correlated by an Asymptotic Model. Heat Transf. Eng. 1992, 13, 43–69. [Google Scholar] [CrossRef]
Figure 1. The experimental stand scheme. Source: own elaboration.
Energies 15 01503 g001
Figure 2. The experimental stand image. Source: own elaboration.
Energies 15 01503 g002
Figure 3. The plate evaporator positioning in the system. Source: own elaboration.
Energies 15 01503 g003
Figure 4. The plate evaporator plate technical scheme. Source: own elaboration.
Energies 15 01503 g004
Figure 5. Energy balance deviation.
Energies 15 01503 g005
Figure 6. Calculated ammonia boiling coefficients related to trendlines of experimental values.
Energies 15 01503 g006
Figure 7. Calculated ammonia boiling coefficients (Shah et al., Sterner and Taborek, Sterner and Sunden and Jokar et al.) related to experimental values.
Energies 15 01503 g007aEnergies 15 01503 g007b
Figure 8. Experimental heat transfer coefficient vs. mass flux.
Energies 15 01503 g008
Figure 9. Experimental ammonia heat transfer coefficient for several evaporation temperatures.
Energies 15 01503 g009
Table 2. Geometrical characteristics of the PHE.
Alfa Laval-Nova 76-64-H
Chevron angle, β60°
Corrugation depth, b6 mm
Corrugation pitch, Pc16 mm
Plate thickness, t0.4 mm
Total plate length, L0.618 m
Total plate width, W0.191 m
Port length, Lp0.519 m
Port width, Wp0.092 m
Diameter port60 mm
Plates number 30
Plates number (active regarding heat transfer)28
Channels number on ammonia part14
Channels number on secondary fluid part15
Evaporator heat transfer surface, S6.2 m2
Surface enlargement factor, φ1.17
Hydraulic diameter Dh = 2b/φ [18]0.01 mm
Plate materialAISI 316
Table 3. Variation intervals for measured data.
ParameterRange
m ˙ N H 3 0.0227 0.0387     kg / s
m ˙ W + E G 1.8 2     kg / s
T W + E G ,   i n 1 7.1    
T W + E G ,   o u t 4.8 2.8    
T s u c t i o n ,   K 1.4 8  
T s a t ,   a m m o n i a 10 ( 1.5 )    
T s u p e r h e a t ,   a m m o n i a 6.2 4.8    
p e (Absolute value) 3.9 5.1     bar
P K 6.45 11     kW
Table 4. Variation intervals for calculated data.
ParameterRange
Q ˙ e , e x p . 21.8 47     kW
Q ˙ C , e x p . 29 48.2     kW
T w a l l ¯ 6.4 1.7  
h W + E G 4437 6751   W / m 2 K
h N H 3 , e x p . 1377 3050   W / m 2 K
Table 5. Statistic comparison between experimental results and correlations.
CorrelationMREMAE λ   * ξ   **
Kandlikar42.6643.8923.5315.69
Ayub35.1537.2931.3717.65
Shah−3.0614.2382.3564.71
Sterner and Taborek−18.2621.0570.5943.14
Sterner and Sunden−26.0026.4060.7845.10
Arima et al.410.64410.640.000.00
Khan et al.424.72424.720.000.00
Huang et al.154.84154.845.885.88
Almalfi et al.162.16162.160.000.00
Danilova et al.−83.3483.340.000.00
Koyama et al. 92.4792.4711.767.84
Jokar et al. 4.5117.7076.4762.75
λ * is the percentage in which the predict deviation is within ±30%. ξ ** is the percentage in which the predict deviation is within ±20%.
Publisher’s Note: MDPI stays neutral with regard to jurisdictional claims in published maps and institutional affiliations.

