1. Introduction
The establishment of distribution system investment plans in many countries, including South Korea, applies a method of putting investment priorities based on the annual maximum load of DLs. In the case of South Korea, for example, based on the maximum loads of the DLs in the previous year, priorities and costs of investment target DLs are calculated considering whether there are sections which the load cannot be transferred, and whether there are sections which the load cannot be powered in faulted situations [
1]. The problem with this method is that when calculating the maximum load, it could use abnormal data, and thus it could lead the low efficiency of the investment plans. In general, the abnormal data refer to data distorted due to problem that occurs in data measurement devices, data reception devices, or communication processes. In power system view of aspects, however, it may include load data that is rapidly decreased/increased due to temporary load transfers, etc. In other words, in the case of generally defined abnormal data, various technologies have been developed and applied to remove or correct it; however, temporary load decrease/increase due to the load transfers can actually last from tens of minutes to days, making it very difficult to detect and eliminate with conventional abnormal data detection methods. Particularly, even if abnormal data are defined based on a specific standard, as load characteristics of the DL and characteristics of the connected DLs are different for each DL, it may be very difficult to apply to all DLs collectively.
In addition, if the maximum load is excessively selected due to a temporary load increase due to load transfers and distribution system investment plans are established based on this, it would significantly reduce efficiency as well as economic feasibility. Examples related to this are shown in
Table 1. In order to solve this problem, additional consideration of information of switching operation for the switches in a Distribution Automation System (DAS) at the time of maximum load occurrences are sometimes used; however, this also has limitations due to the possibilities of human errors. In addition, subjectivity may be reflected due to the high dependence of the person in charge. Therefore, this study proposes a power system data-specialized preprocessing method using polynomial-based standard patterns that can automatically detect load transfers. The differences and important contributions of the proposed study are as follows.
Presentation of a specialized load transfer detection algorithm for the power system;
Tuning and verifying the proposed algorithm using large-scale actual power system loads data;
Proposal for systematization of the power system data preprocessing and load transfers detection method considering collective application for ten-thousand DLs;
The effect of reducing the maximum load of the DLs by applying the proposed method.
The remainder of this paper is organized as follows.
Section 2 introduces related works.
Section 3 describes proposed polynomial based abnormal data, including load transfer detection model.
Section 4 describes the result of verification for the appropriateness of the proposed model. The conclusion is then given in
Section 5.
2. Related Works
Research on the preprocessing of highly volatile time series has been conducted over the past 60 years and is still ongoing. In 2005, the first attempt was made to compare the existing preprocessing methods [
2,
3]. As data generation and utilization increases, various uses for preprocessing and abnormal data detection have been studied. In [
4,
5], it was well organized in terms of practical application. Examples include credit card fraud detection [
6,
7], intrusion detection [
8], defect detection [
9], sensor data defect detection [
10], time series data anomaly detection [
11,
12], detection of the abnormal data in terms of energy consumption [
13], data quality improvement and cleaning [
14,
15], detection of the abnormal characters [
16], and big data analysis [
17,
18].
These time series data-related studies can be divided into studies on detecting outliers of time series data [
11,
19] and studies on data pattern detection [
20,
21,
22,
23,
24]. However, in the case of studies related to power system data, most of the studies are more focused on the detection of abnormal data as preliminary stages for analyzing and forecasting of electric load of the power system or power generation of distributed generations (DGs) [
3,
25,
26,
27].
In [
3], after regression analysis was performed based on the linear relationship between radiant illuminance and PV power generation, abnormal data criteria were derived. In addition, the BOXPLOT rule was applied to detect outliers by comparing the outputs of multiple inverters. Reference [
25] proposes a real-time anomaly detection method for electric load for very short-term load forecasting (VSTLF). The proposed method consists of two components: a dynamic regression model and an adaptive abnormal threshold. In addition, the proposed method was developed and verified using data from ISO New England. Reference [
26] proposed a preprocessing method for forecasting power demand during the weekdays for planning. For this purpose, the moving average and k-sliding window filtering were proposed, and outliers were detected by comparing the results of k-sliding window filtering to the forecasted load which is conducted by the moving average. The proposed method was developed and verified for power system data in Thailand. [
27] proposed a probabilistic deep autoencoder to reconstruct the measurement data of the power system. To reflect the uncertainty of the measured data, a nonparametric distribution estimation method was applied, and multilayer encoding and decoding processes were additionally used to detect abnormal data.
Previous studies are meaningful in that they have proposed and verified preprocessing methods in their own way. For use of those methods in power systems such as DLs, however, the data measured and collected in the field should be sufficiently reflected the characteristics of the loads. In addition, preprocessing methods should be proposed in consideration of the rapid increase or decrease of the loads due to load transfers with different characteristics from noises in general. Therefore, in this study, the research was conducted using load data measured on about 11,000 DLs, and the proposed method was derived and verified. However, it should be mentioned in advance that as the previous methods performed using data of similar scale from the massive actual DLs were extremely limited, direct comparison could not be performed.
3. Proposed Method
3.1. Overview of the Proposed Method
The key to the proposed method is to classify data with similar characteristics through clustering, and to derive daily and annual standard patterns for each classified data. The abnormal data was then detected based on those.
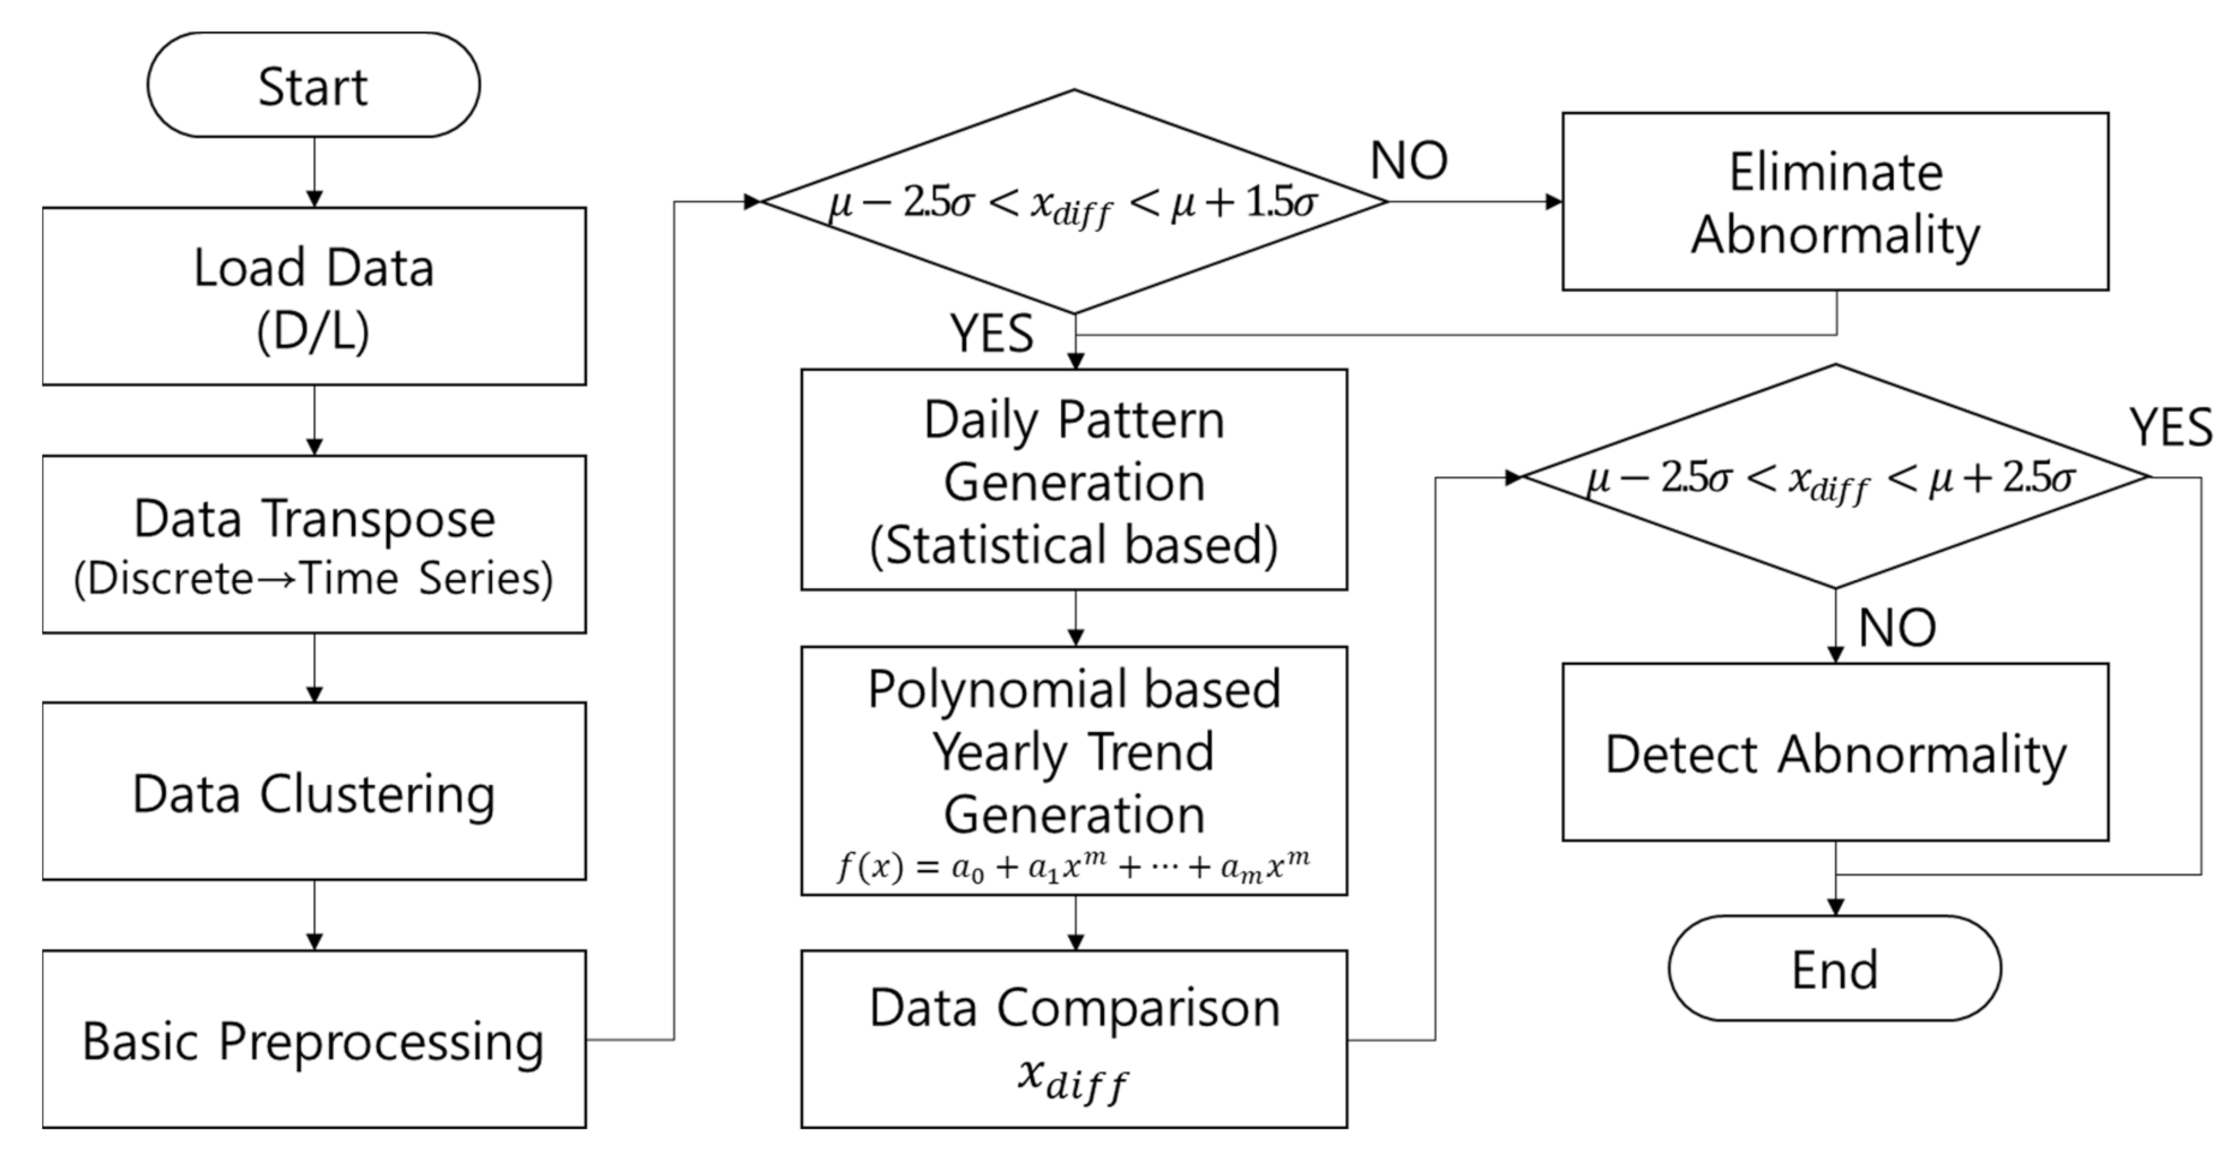
Figure 1 shows a series of abnormal data detection flows for the proposed method, and the main parts of the proposed method are described below in detail.
3.2. Input Data and Conversion
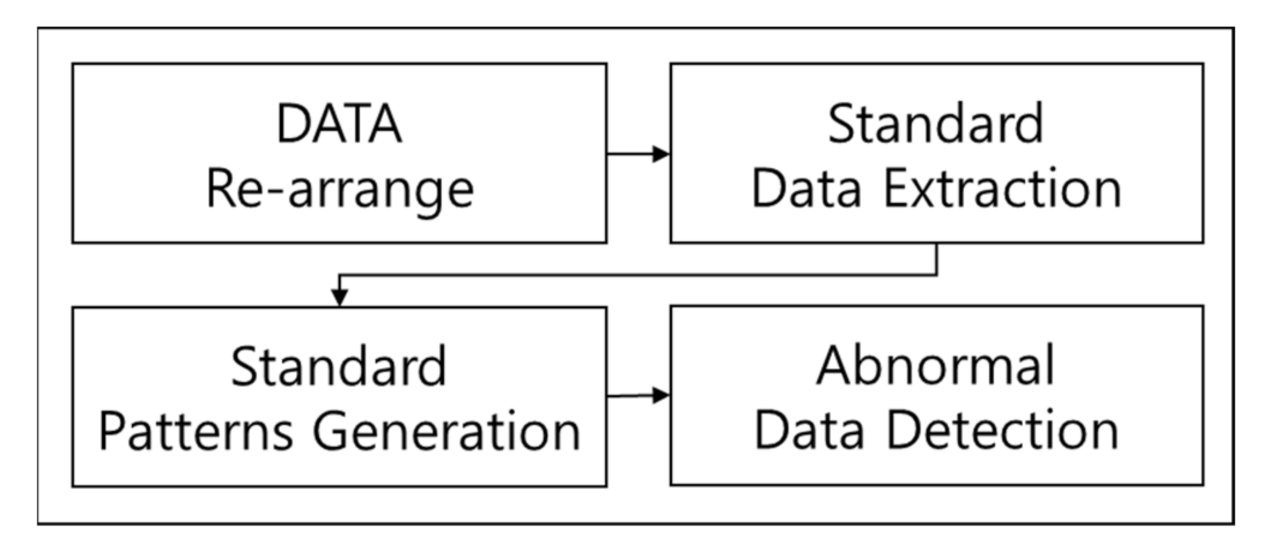
Figure 2 shows the flow of the power system data preprocessing for load transfers and abnormal data removal proposed in this study. As shown in
Figure 2, the proposed preprocessing method includes data rearrangement, standard data calculation, standard pattern generation, and data final preprocessing. In data rearrangement, the power system data is converted into a form that is easy to further processes, and also defected data such as Null and Nan may be removed. Here, the load data of the DLs were extracted from the Substation Operation Management System (SOMAS) managed by KEPCO, a Korean power utility company. The data were measured from CB, which was installed in the withdrawal part of the DL, in the substation. Thus, it is indicated the load of the entire DL. The sample form is shown in
Table 2 below.
In terms of data conversion, the main issue is to convert general power system data into time series data as these data contain all the data, including defect data, abnormal data, and save data, as the form of a string. Power system data in the form of discrete data that do not have the characteristics of a time series not only have difficulty grasping changes in demand power over time, but also find it difficult to handle the aforementioned defect data. These data are also not suitable for the use of time series forecasting and analysis in the future.
3.3. Data Clustering
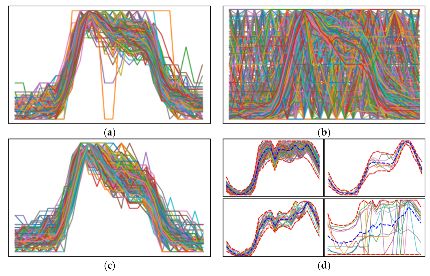
The first step that is performed in the process of calculating standard data and generating standard patterns is classification of similar data through clustering. As mentioned above, in the case of DLs, the characteristics of load data differ depending on the electric load itself or the environment of the connected DLs. For this reason, it is essential to propose and apply an optimized preprocessing method for each DL. However, when looking at the example of the Republic of Korea, there are a total of about 11,000 DLs, so it is practically difficult to propose and apply individual preprocessing methods for all DLs. Accordingly, the proposed method reflects the characteristics of each DL by forming a group of DLs with similar load data characteristics through clustering, and minimizes the calculation time and resources that may be required. In this study, the Gaussian mixture model (GMM) that can clearly perform clustering of power system data was applied by comparing and analyzing the widely known methods such as K-means, DBSCAN, and GMM. An example of clustering by applying the GMM model is shown in
Figure 3 below. In addition, in this process, abnormal data such as spikes that may be clearly identified were removed in priority by applying the clustering method.
3.4. Daily and Yearly Standard Patterns
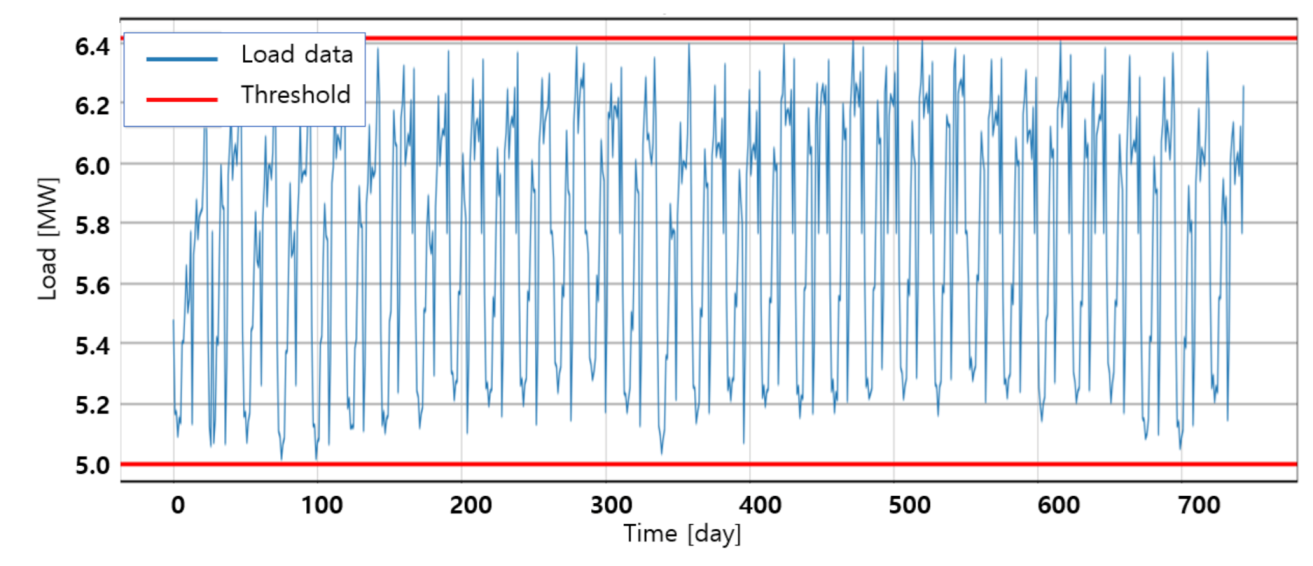
As the next step, the daily and yearly standard patterns were extracted. The purpose of deriving the daily and yearly standard patterns was to detect abnormal data by comparing them with the actual measured power system data. After deriving the daily standard pattern, the yearly standard pattern was sequentially derived. The details of each step are described in detail below. In the daily standard pattern derivation step, it was derived by refining abnormal data. The refinement of electric load data utilized the average and standard deviation of the daily load value, which is as shown in Equation (1). The mean and standard deviation are generally performed in a known manner.
where
: average load,
: standard deviations of load, and
: load data
As an empirical rule, it is common to use 2
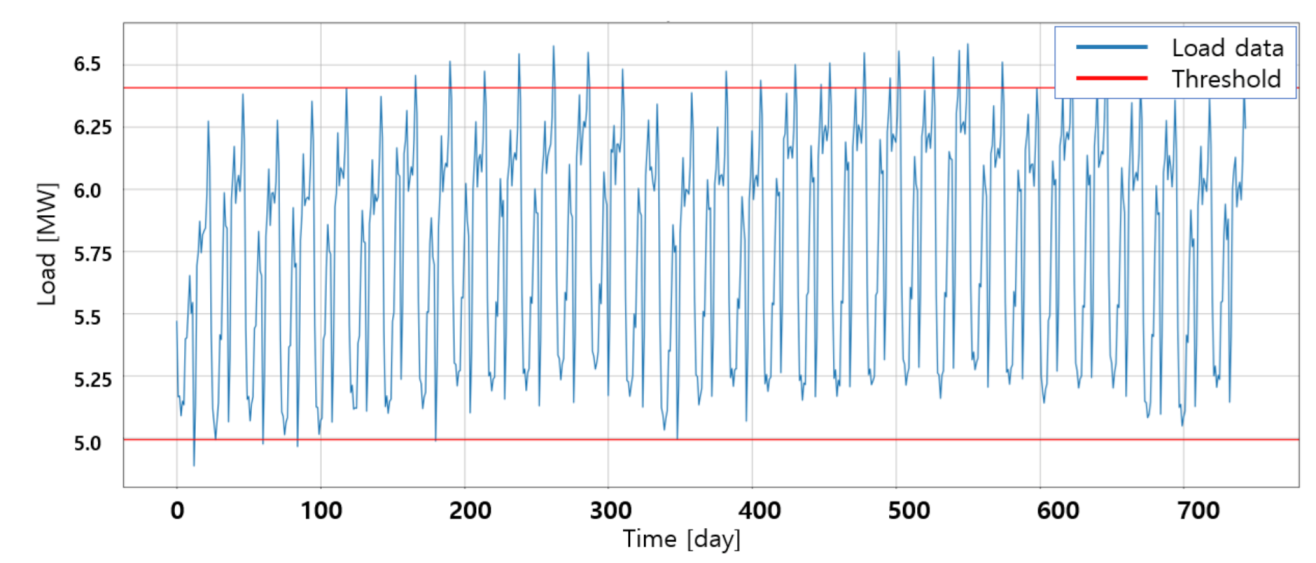
as it includes 95% of all data. In this study, however, in the consideration of characteristics of power system data, a lower limit value of −2.5
and an upper limit value of 1.5
were set with more conservative perspective. When the data exceeded the defined range, they were replaced with a threshold value. The results shown in
Figure 4 and
Figure 5 below.
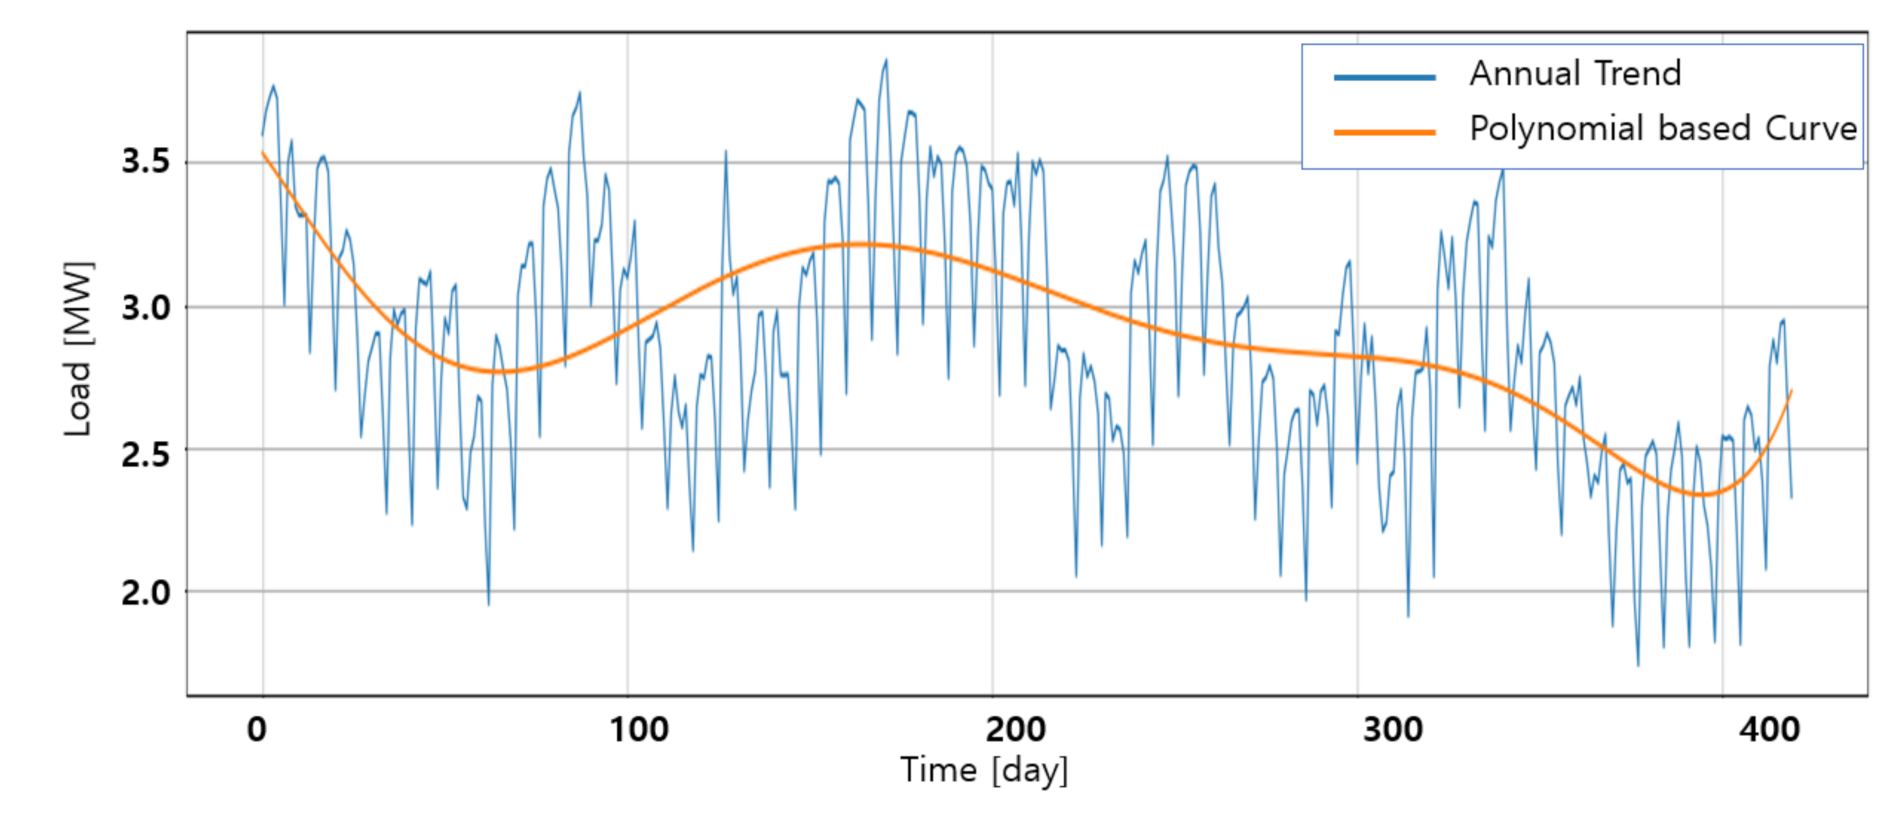
The annual standard pattern was derived by applying a polynomial to the previously processed daily standard pattern data. Polynomial smoothing is conducted by Equation (2) below.
where
: polynomials of the load and
: coefficients of the polynomials
It is necessary to apply Equation (3) below so that the optimal features of each electric load data can be extracted by Equation (2). In addition, this can be written in a matrix type as shown in Equation (4).
where
: the optimal polynomial of the load and
: load data of the DL.
The final degrees of the polynomial can be obtained from Equation (4) above. By applying the obtained order, the annual polynomial curve of the DLs can be calculated, which can be used as standard patterns. An example of applying the series of processes described above to specific DL is shown in
Figure 6.
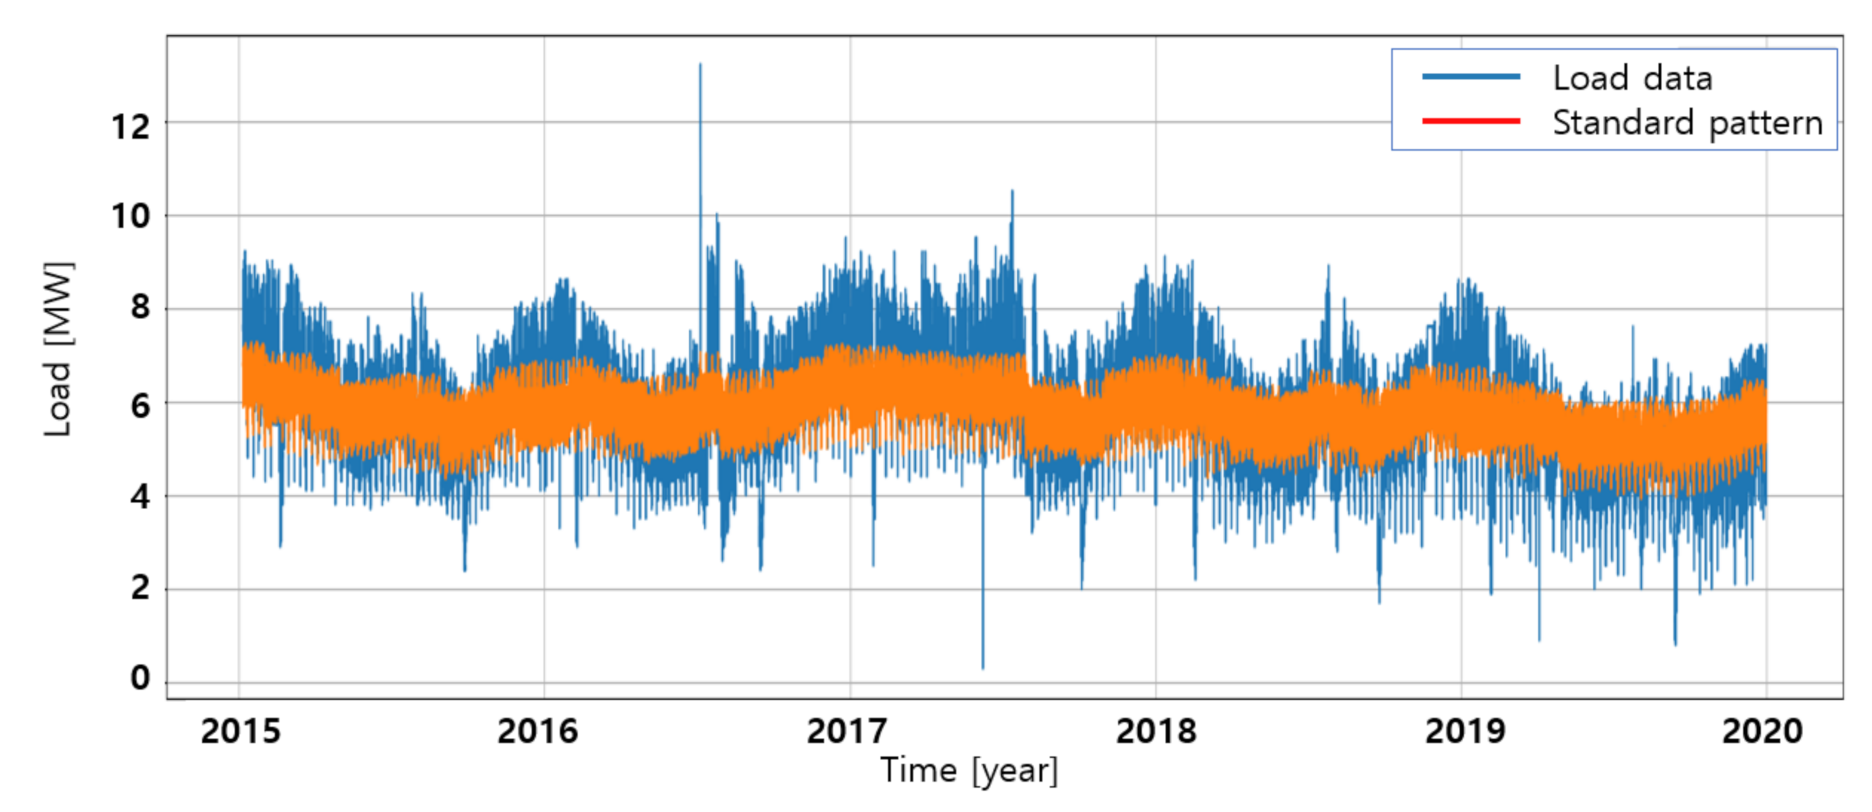
3.5. Detection of Abnormal Data
As can be seen in
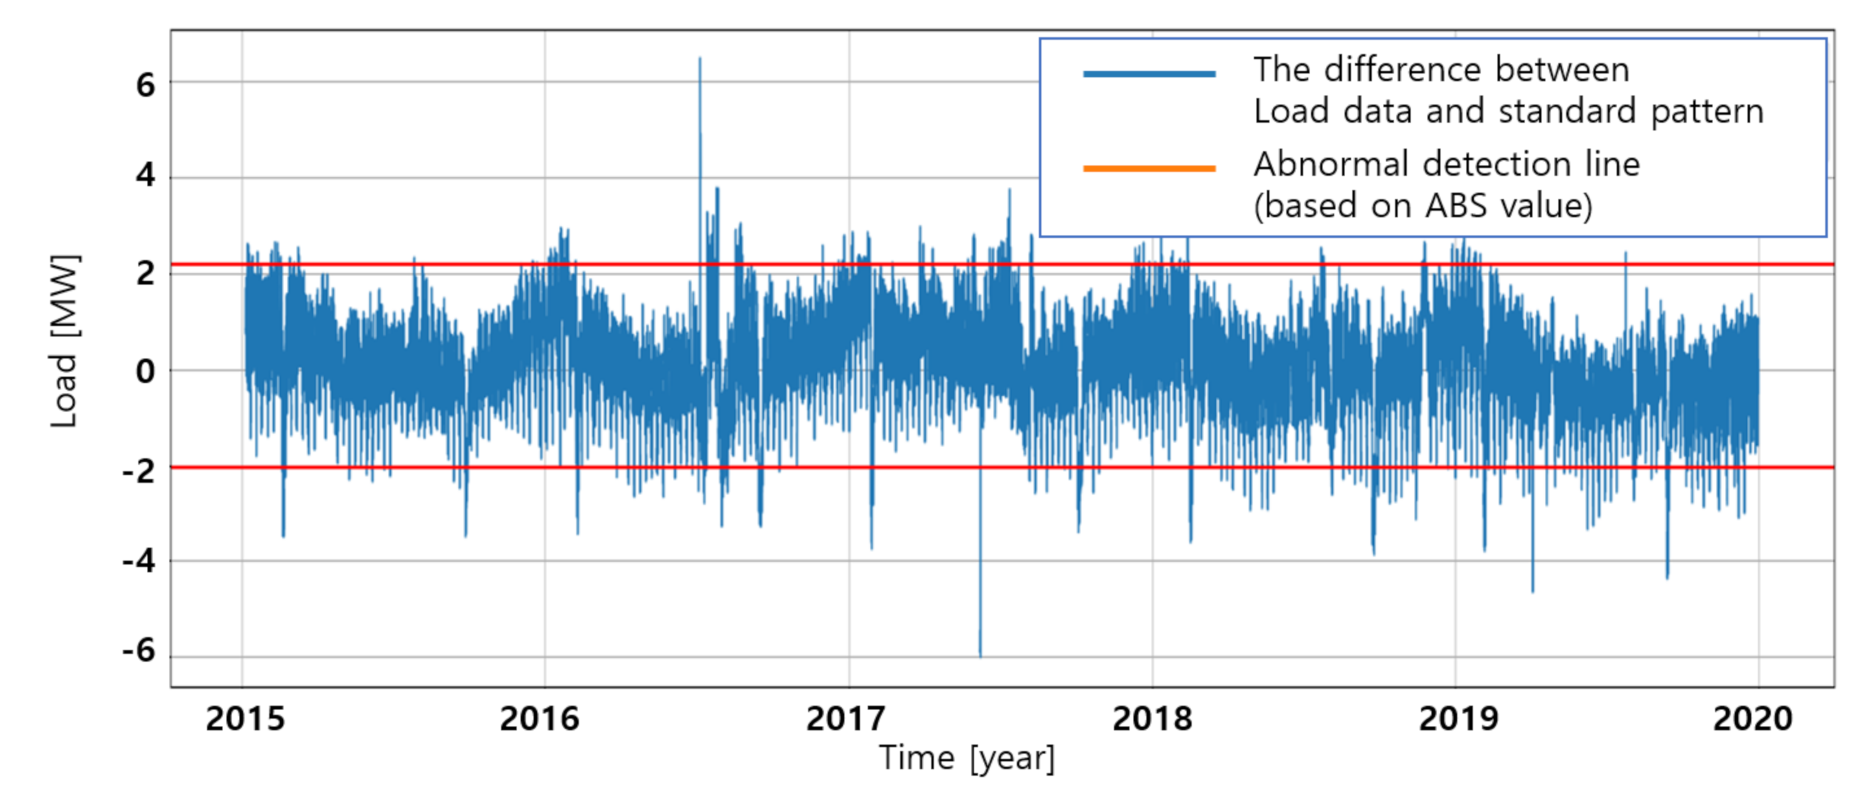
Figure 6, in the case of standard patterns, the overall trend of electric load data can be reflected; however, there were some limits regarding using it directly, as there were some gaps between derived standard patterns and actual electric load data in terms of the magnitude. In this study, therefore, statistical analysis was additionally performed on the difference between the derived standard pattern and actual electric load data. In the proposed method, the abnormal data were detected by applying Equation (5) to the absolute value for the difference between the standard patterns and the actual electric load data.
where
: average load,
: standard deviations of load, and
: load data
Based on the above equation, data that exceeded from this were considered as abnormal data, including load transfer.
Figure 7,
Figure 8 and
Figure 9 below show the example of abnormal data detection criteria for the difference between the standard pattern and the actual electric load data and the results of preprocessing of the abnormal data applying these data.
4. Verification
In order to verify the appropriateness of the proposed method, a comparative analysis was conducted to see if the proposed method reasonably detects abnormal data. In particular, the detection accuracies of the load transfers that often occurs in the actual distribution system were verified. The verification of the load transfers was targeted at Kimhwa DL and Cheongyang DL, which are in Gangwon Province of South Korea (2019). The actual histories of the load transfer occurred on each DL are shown in
Table 3 below.
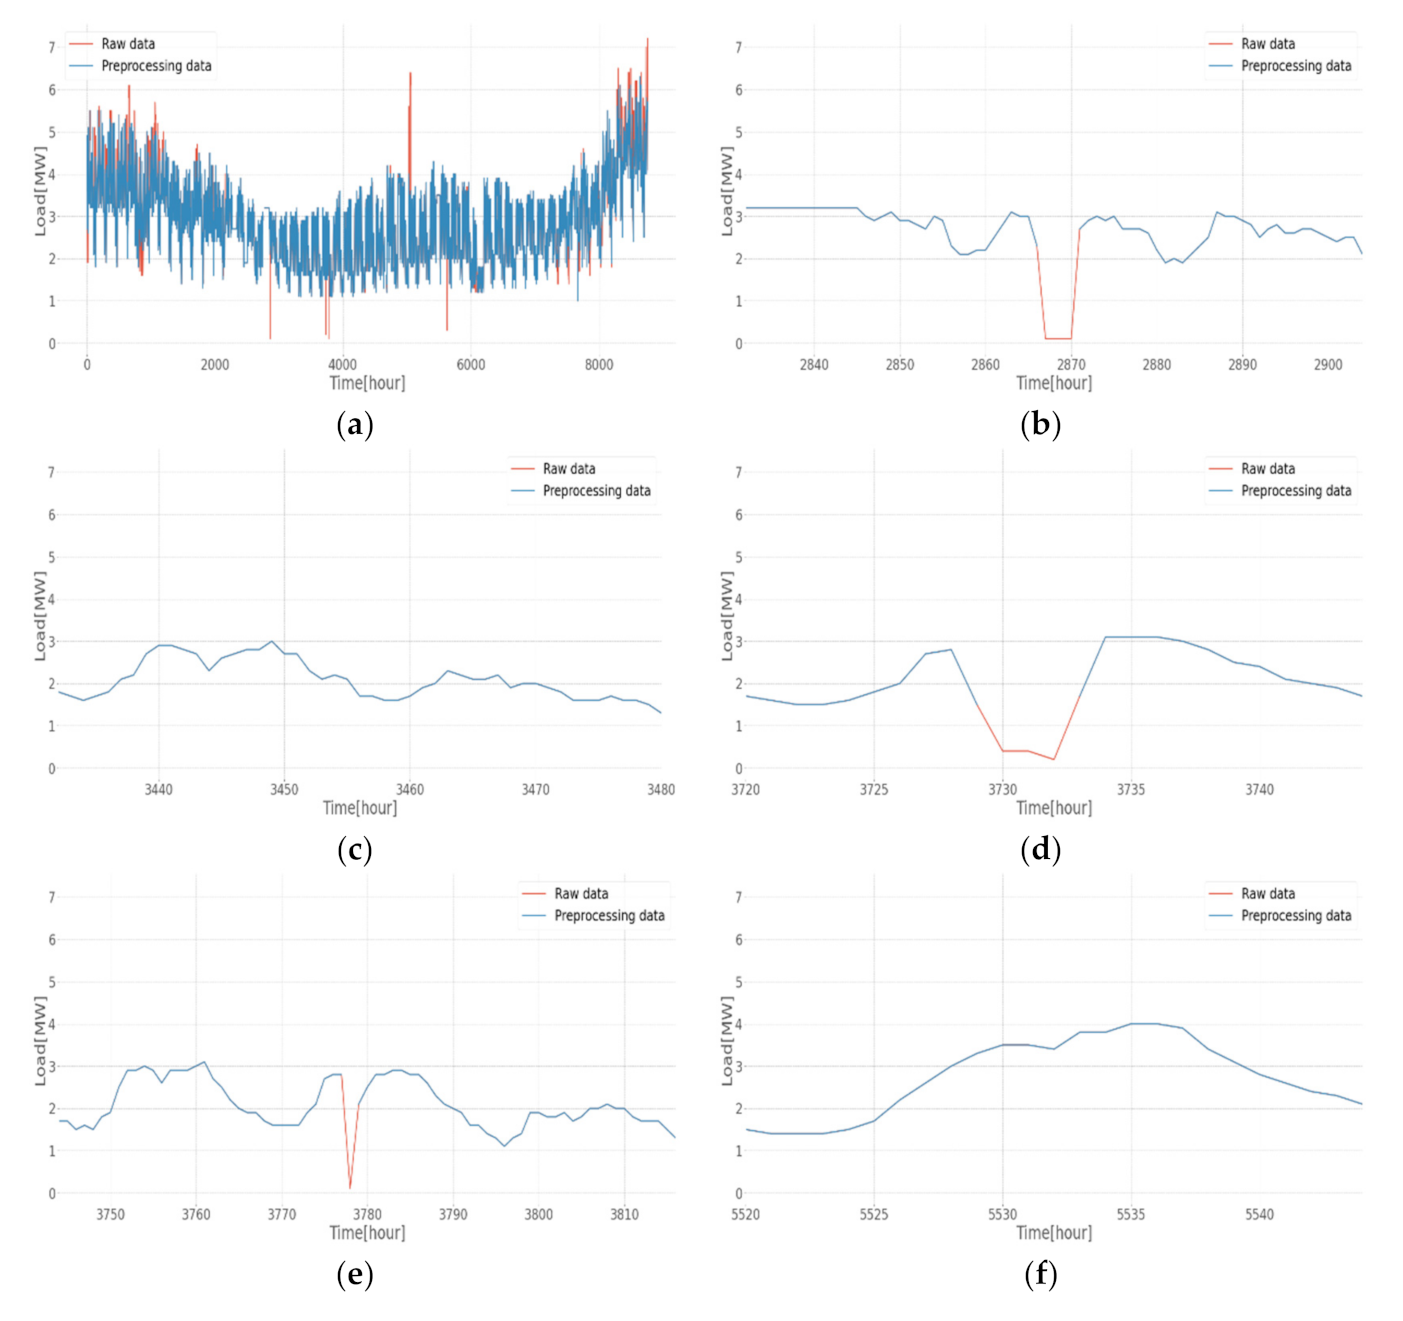
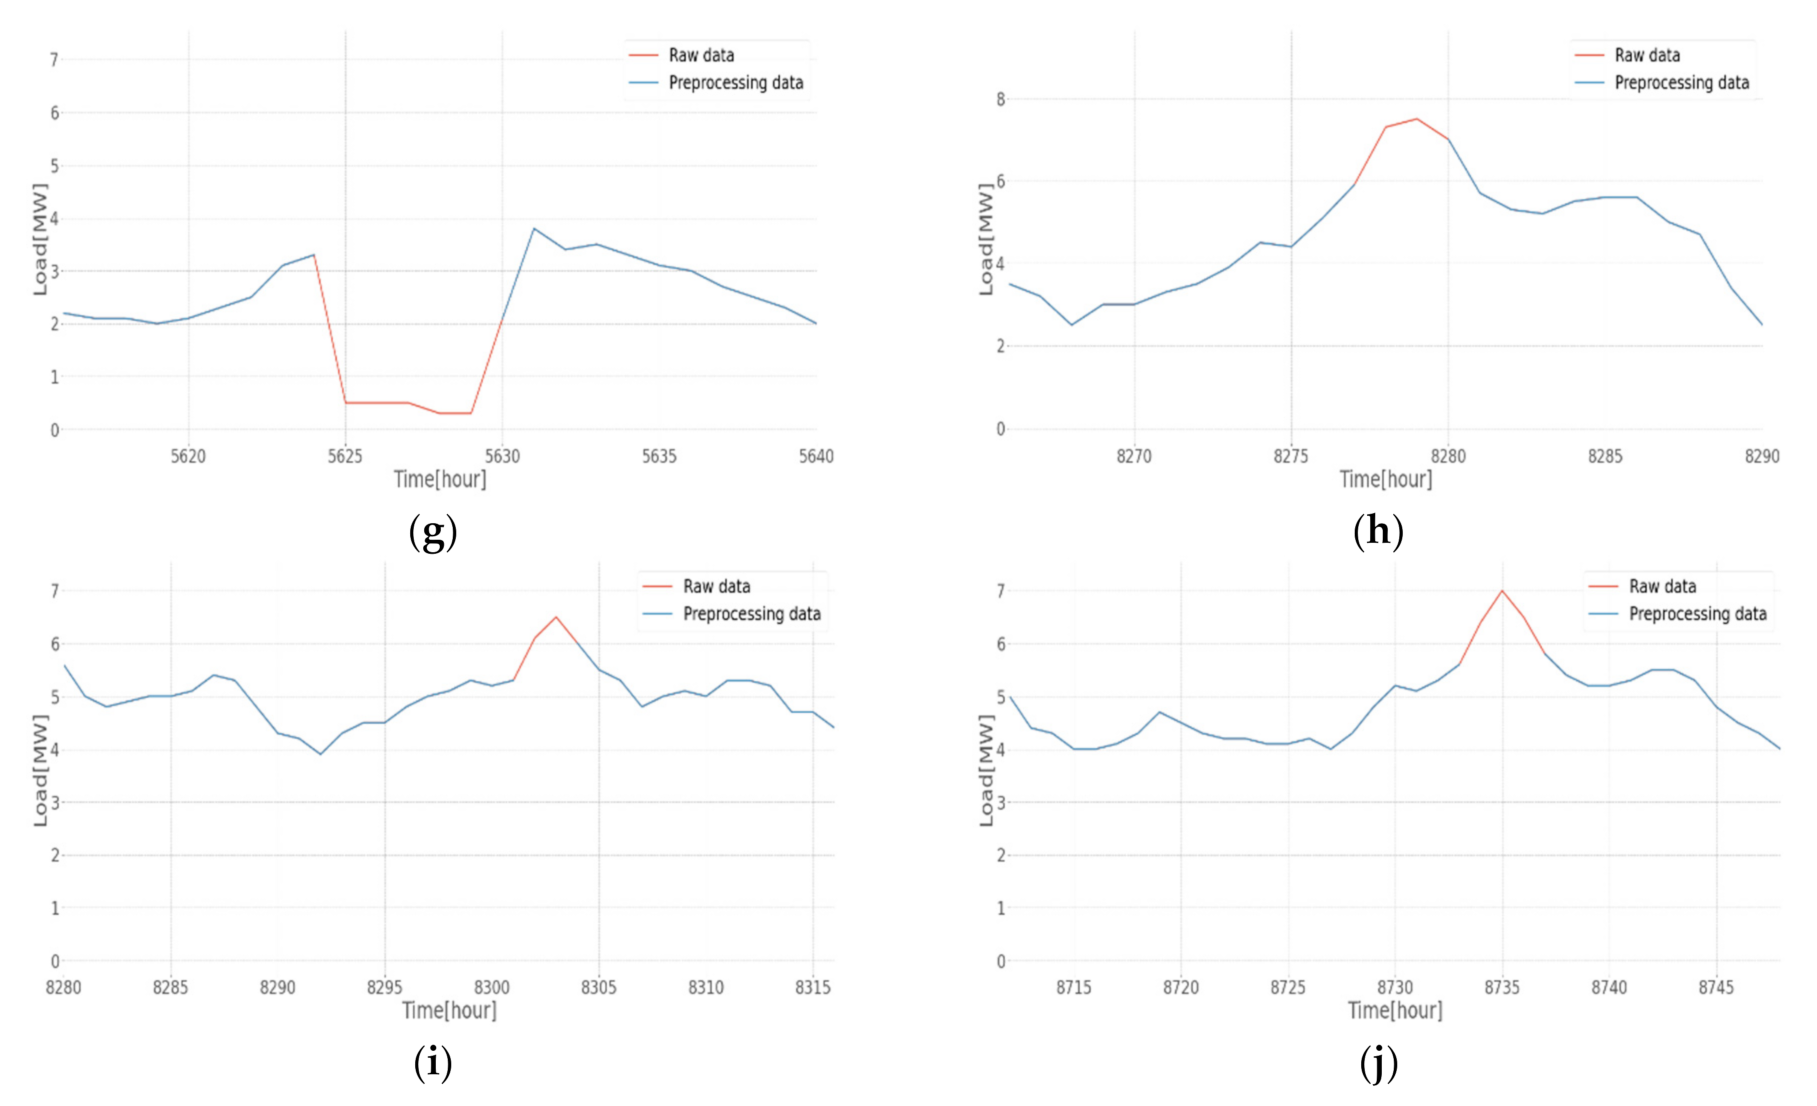
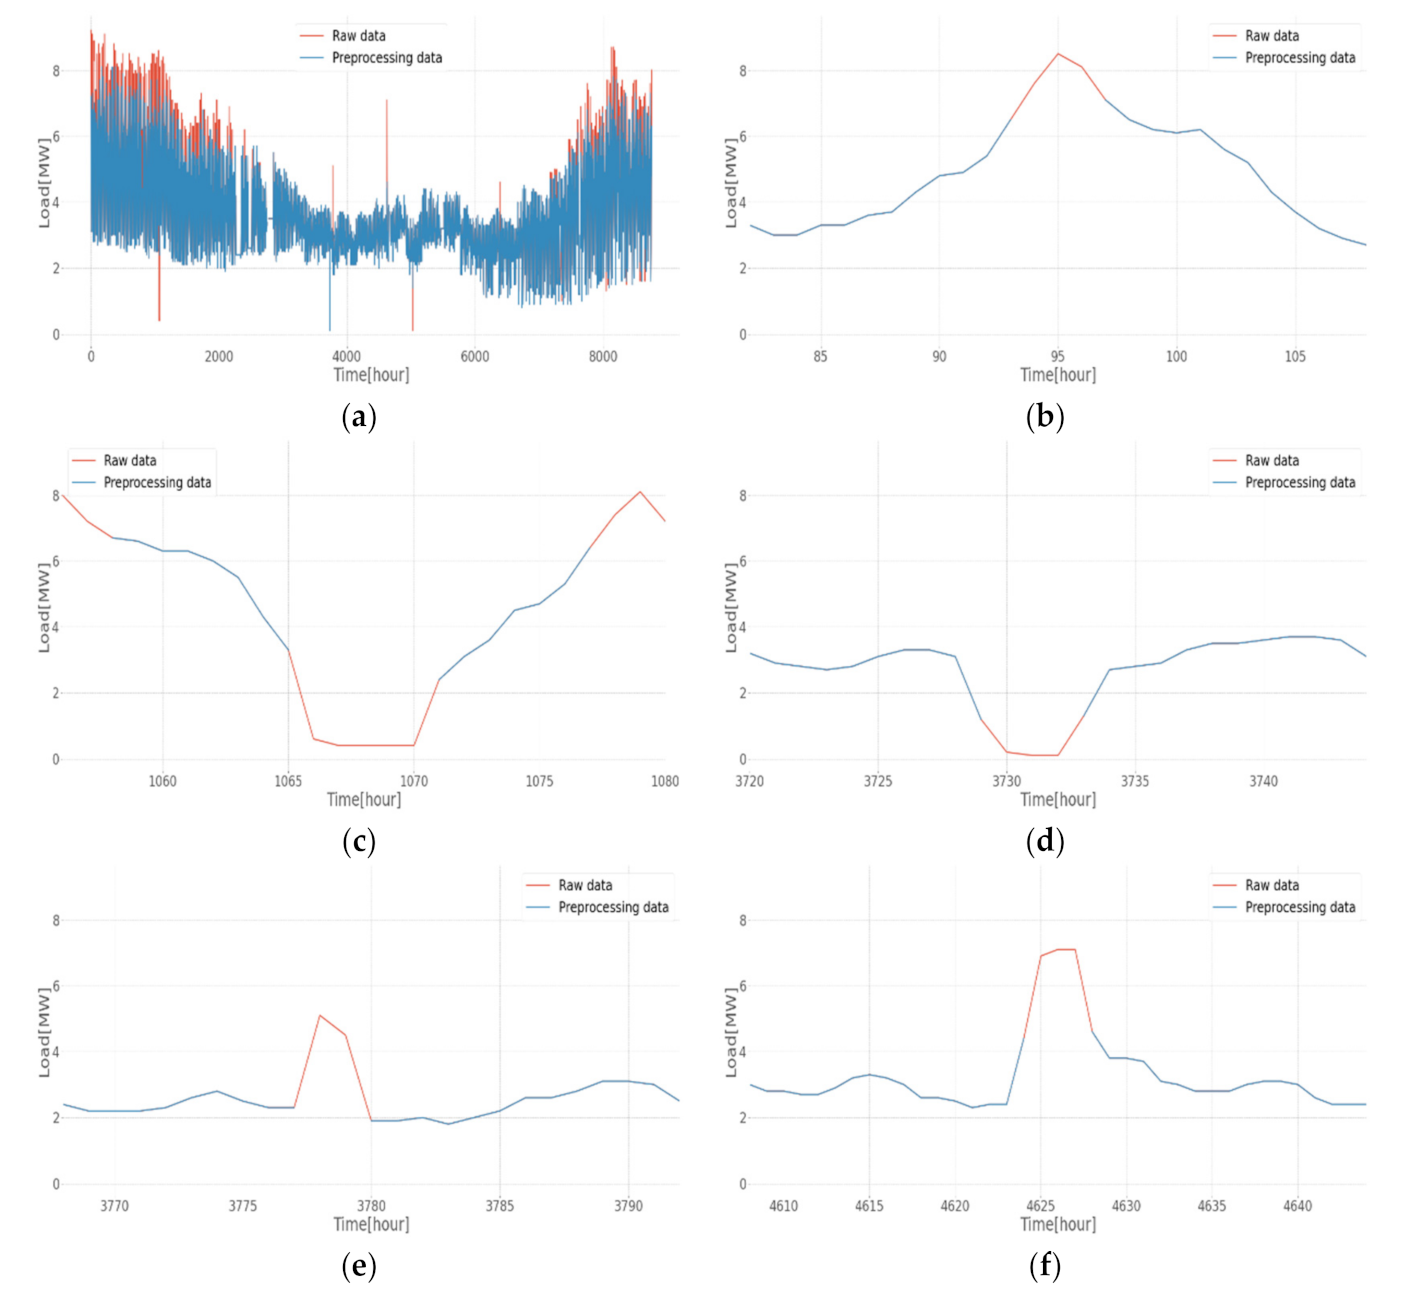
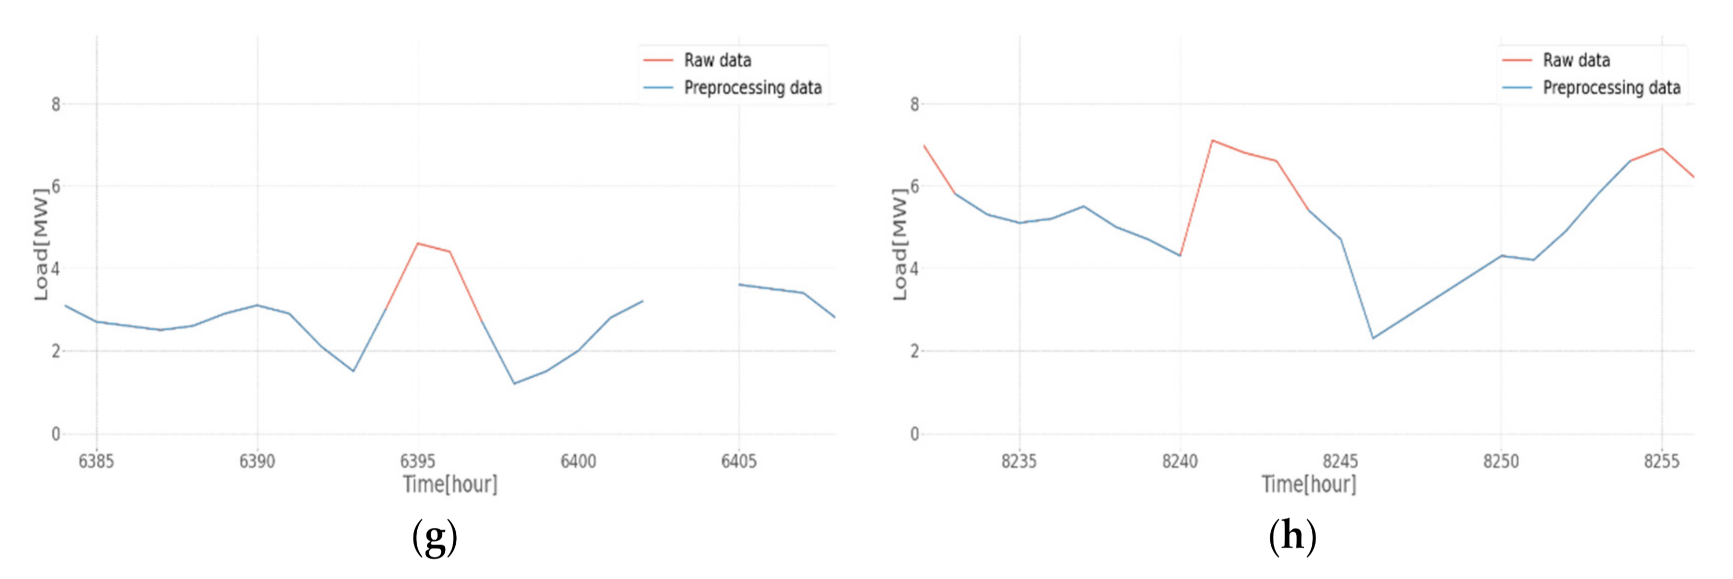
As a result of applying proposed method for those periods, it was confirmed that 7 cases out of a total of 9 load transfers were detected in the case of Kimhwa DL with an accuracy of about 77.78%, and 7 cases out of a total of 7 load transfers were detected in the case of Cheongyang DL with an accuracy of about 100%. The detection results for each load transfer are shown in
Figure 10 and
Figure 11 below.
In the case of Kimhwa DL, however, a total of two load transfers could not be detected by the proposed method. This was because there were no sudden changes in load due to the load transfers which could not easily be checked visually. Recalling that the most fundamental reason for detecting load transfer is to prevent sudden load fluctuations caused by load transfer from being reflected in distribution system investment decisions, load transfers without such sudden load fluctuations could not be considered as important ones. In fact, it can be confirmed that all load transfers were properly detected by the proposed method, except for the two load transfers that do not accompany rapid load fluctuations. In addition, in the case of Cheongyang DL, it was confirmed that all of the load transfers were completely detected.
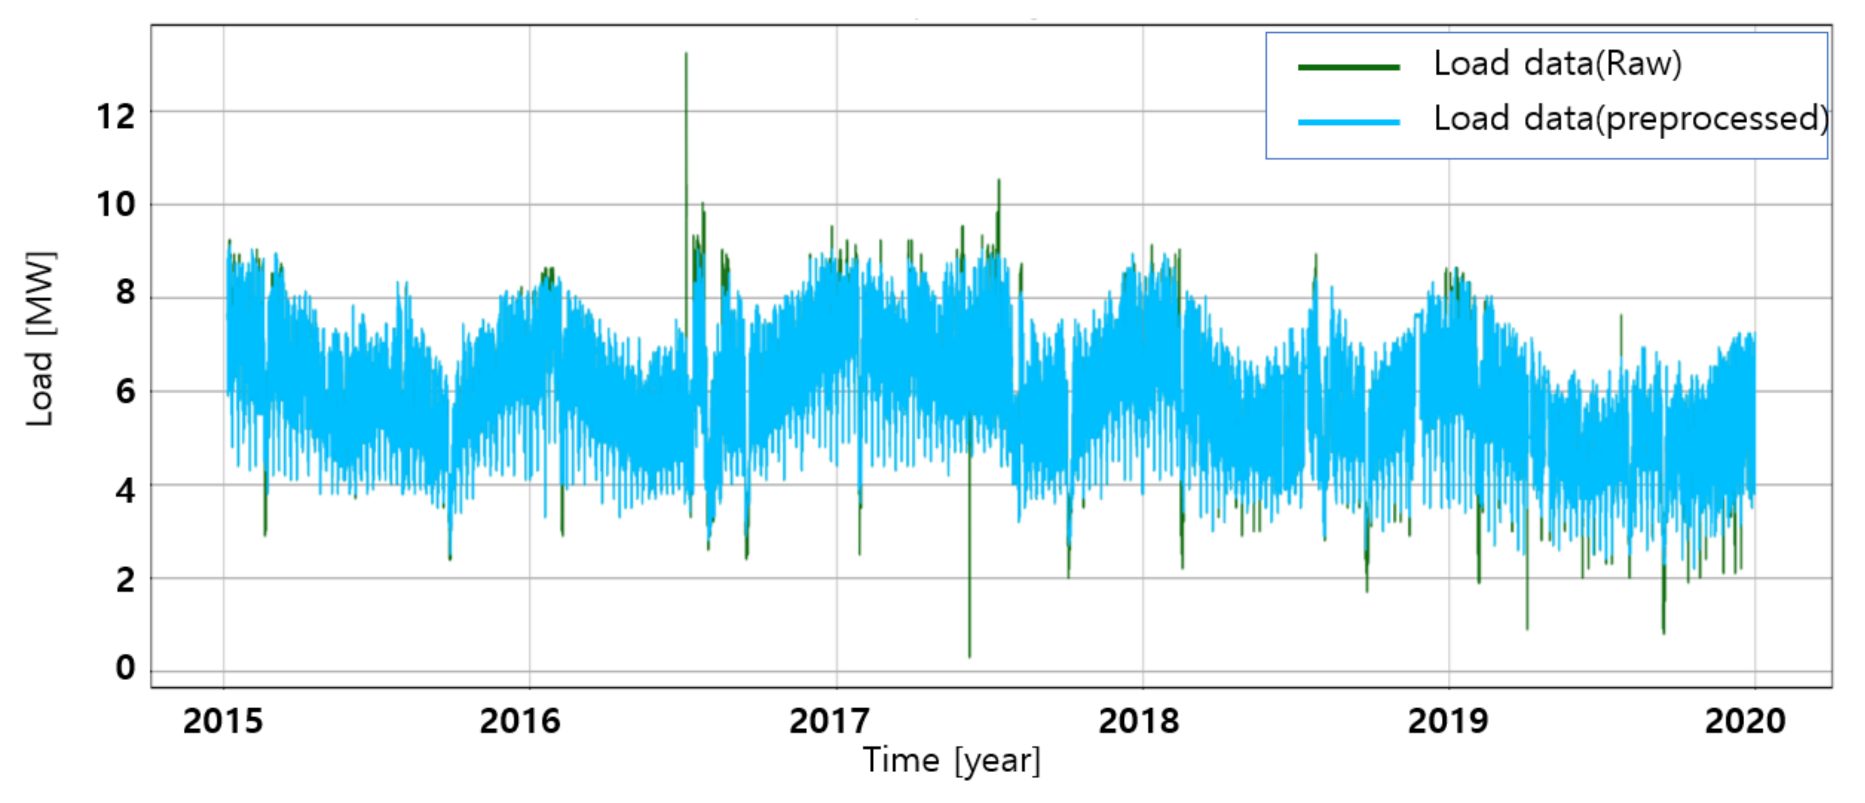
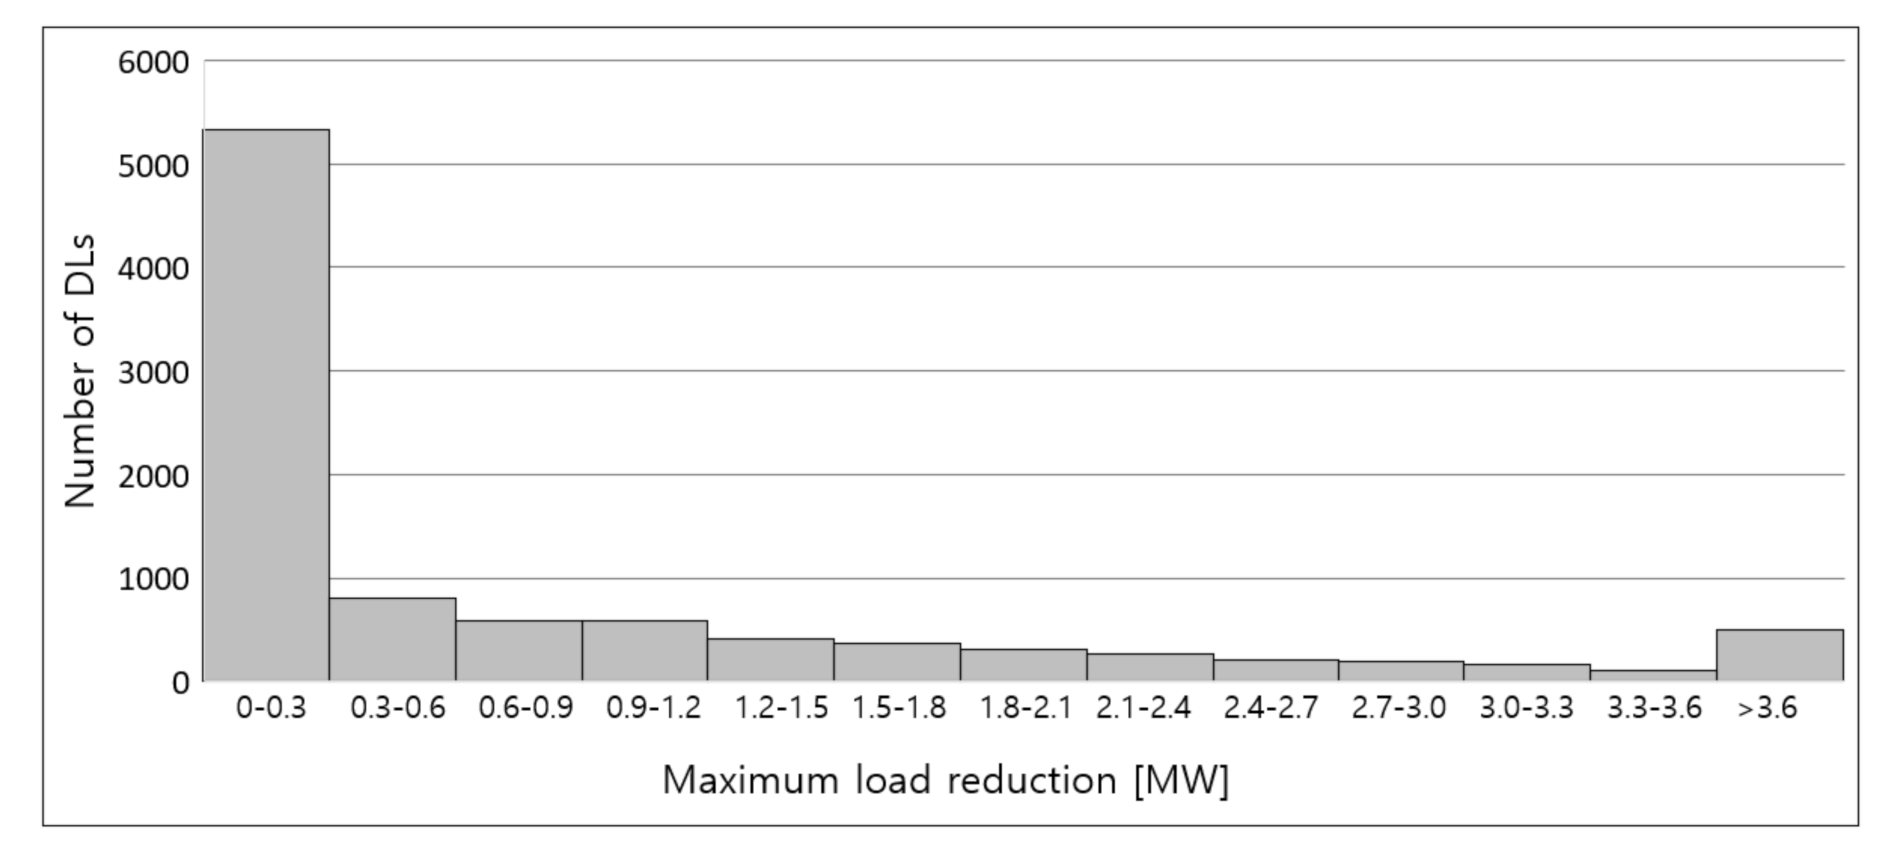
In addition, when abnormal data including load transfer were removed by applying the proposed method, a maximum load reduction effect may be expected through this. In fact, when the proposed method was applied to the hourly load data of 11,000 nationwide DLs in 2020, the maximum load could be reduced by 11.59% as an average. This is shown in
Figure 12 and
Table 4 below.
5. Conclusions
Detection and correction of abnormal electric load data, including load transfer, are among the most important factors in establishing investment plans for distribution systems. Previous studies, however, have focused more on detecting abnormal data itself, and studies related to the detection of load transfer which inevitably occurs for operational purposes at the distribution system are extremely limited.
In this study, a method of using polynomials to detect power system abnormal data including such load transfer was proposed, and the accuracy was confirmed by comparing detected results of the proposed method with actual load transfer histories. The results showed an accuracy of the average 81.74% when the proposed method was applied. In addition, it was also showed that abnormal data or spike data including load transfer can be effectively removed based on statistics while properly reflecting the characteristics of each DL by applying the standard pattern.
This paper has points of difference with previous ones in that it was conducted using massive actual load data of about 11,000 DLs. Therefore, it can be emphasized that the usability was enhanced by reflecting the characteristics of field data. In addition, although it was difficult to perform direct comparisons as previous studies conducted to detect load transfers were quite limited, and studies using large-scale actual DL load data were even more severely limited, the research could be considered meaningful as it showed possibilities in terms of actual field applications.
The proposed method will ensure high-quality power system data by properly eliminating load transfer and abnormal data which can only be handled by expert know-how previously. In addition, it is expected that it will improve the economic efficiency of the distribution plans. For example, as a result of applying the proposed method to nationwide 11,000 DLs, it was confirmed that the maximum load was reduced by 11.59% on average.
If it is assumed that about 20% of 11,000 DLs are operated nearly full operating capacity, it would lead the conclusion that about 2200 DLs need to facility reinforcement or investment. In addition, as mentioned above, if 11.59% of those DLs are excluded due to reduction in maximum load by the proposed method, it would also lead the conclusion that about 254 DLs do not required any urgent investment. It implies that if the average cost of reinforcement for each DL assumed 200 million won, it is possible to save the cost of 50.8 billion won annually.
Estimates of financial benefits may have some errors; however, one clear point is that, by using the proposed method, the load transfer can be properly detected, and the cost-effectiveness of distribution system investment planning can be improved in a broad perspective as well.


