
Transaction Model Based on Stackelberg Game Method for Balancing Supply and Demand Sides of Multi-Energy Microgrid


Abstract
:1. Introduction
- (1)
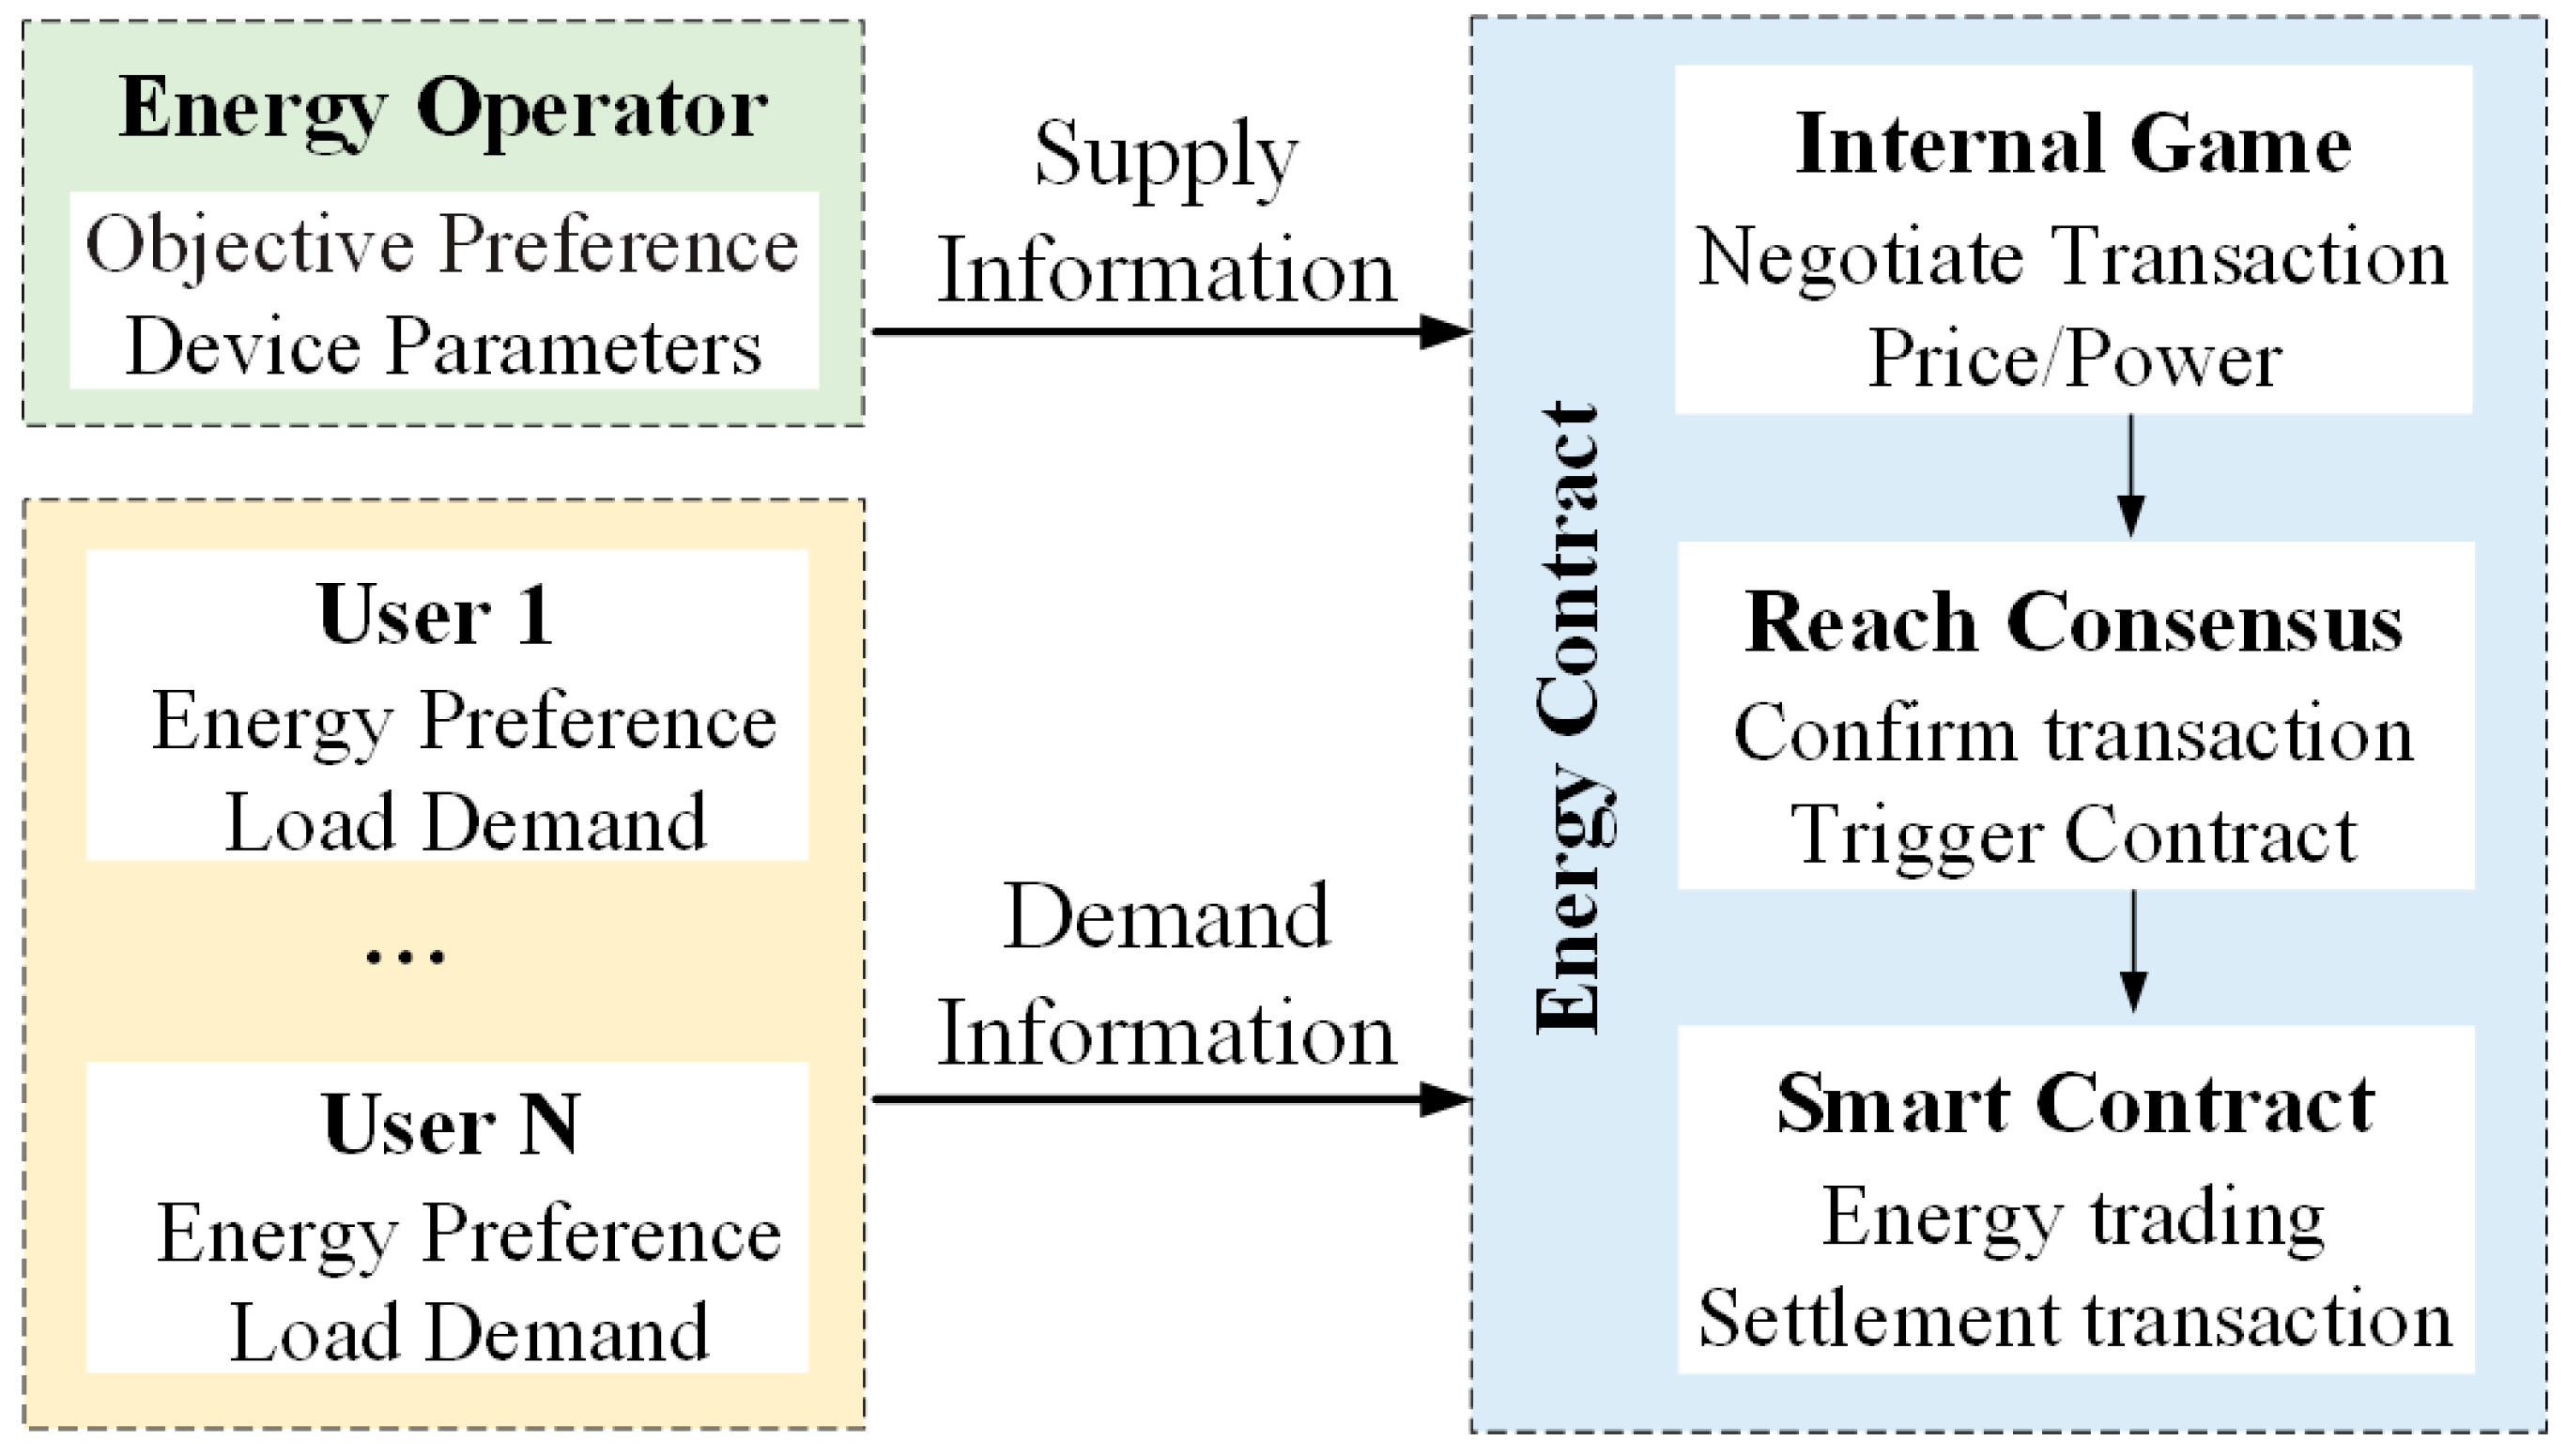
- Based on smart contracts, an energy trading mode for supply side and demand sides is proposed. Firstly, the two sides negotiate different energy transaction prices based on the characteristics of users’ different energy demand through internal game. Then the transaction is automatically completed.
- (2)
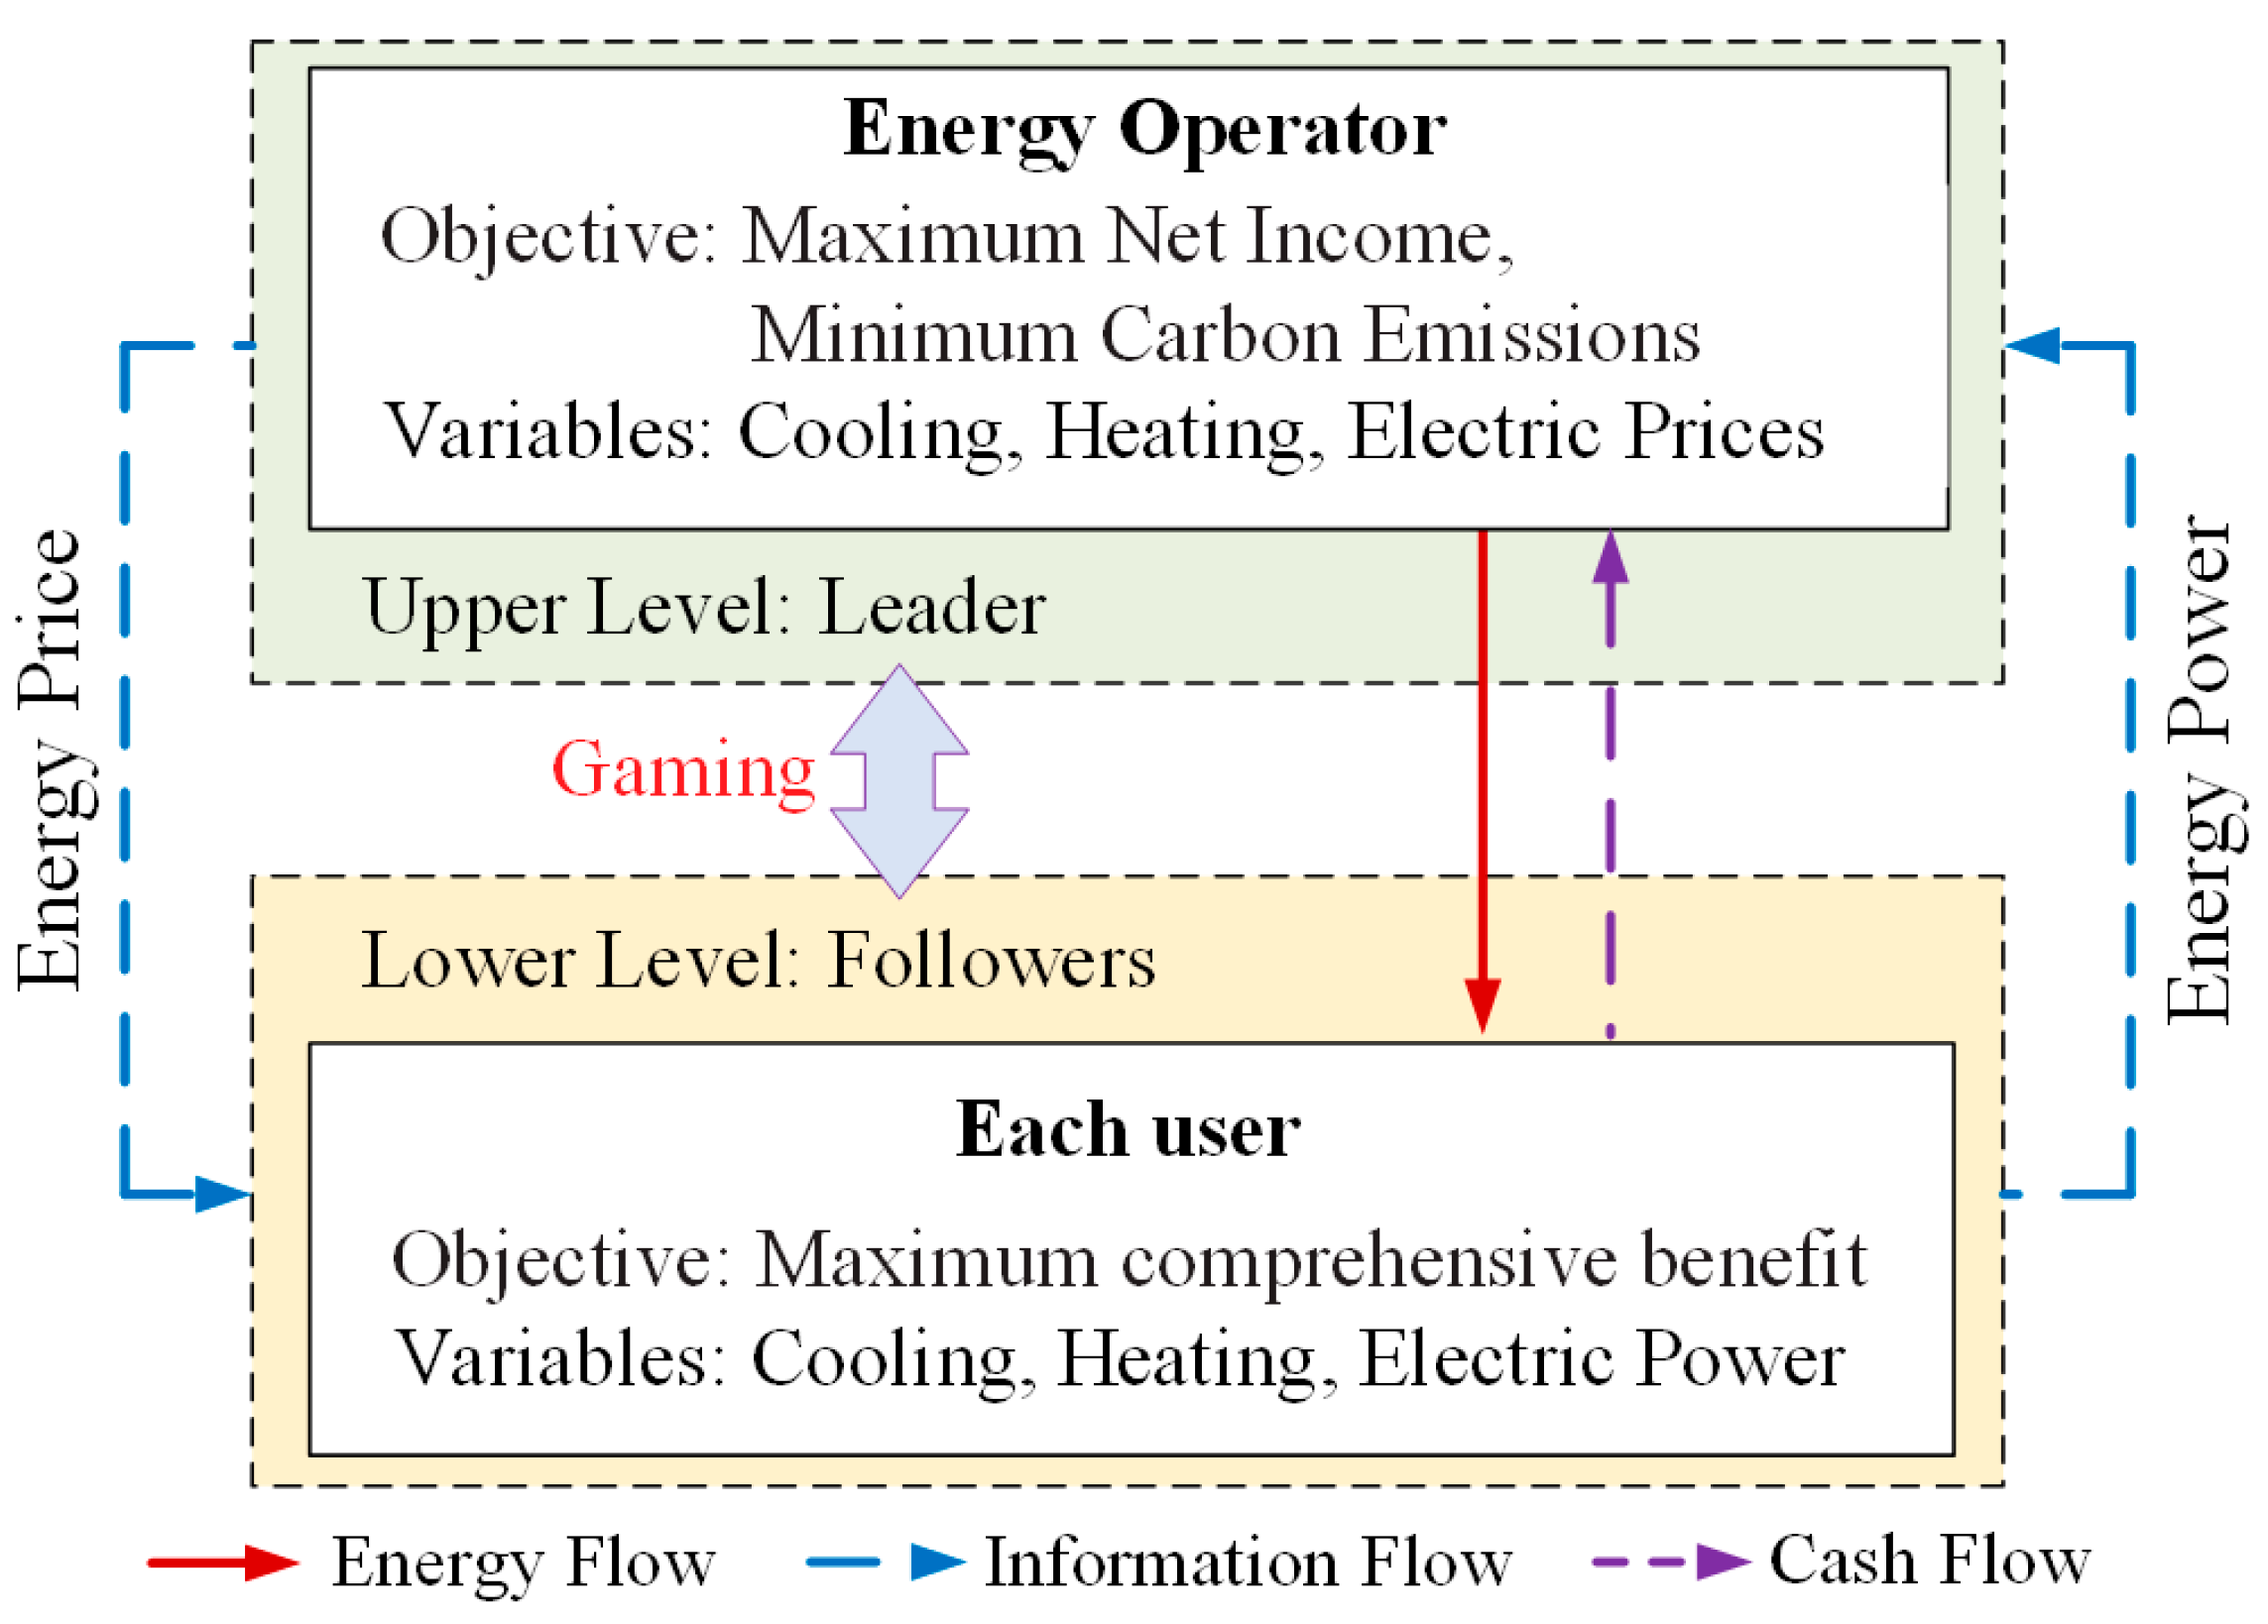
- Considering the users’ initiative, a bilevel optimization model is established based on the Stackelberg game model. The energy operator, as a leader, considers two objectives, i.e., economic net income and carbon emissions, and uses the linear weighting method to convert the two objectives into single objective. Users, as followers, aim to increase the comprehensive benefits, including energy cost and comfort. The rights of users, making decisions on energy use independently, can be as far as possible guaranteed.
- (3)
- KKT optimality condition is used to transform the bilevel optimization model into an equivalent single-level model, which can ensure that the global optimal solution is obtained.
2. Transaction Mode for Supply and Demand Sides of Multi-Energy Microgrid
2.1. Trading Model Based on Stackelberg Game
2.2. Trading Architecture Based on Smart Contracts
3. Mathematical Model
3.1. Energy Operator
3.1.1. Objectives of Operator
3.1.2. Equations and Constraints
3.1.3. Multi-Objective Linear Weighting Processing
3.2. Energy User
3.2.1. Heating Load and Cooling Load
3.2.2. Electric Load
3.2.3. Objective of User
4. Solution Method of Internal Game Model
4.1. Transform the Bilevel Model into Single-Level Model
4.2. Model Solving Steps
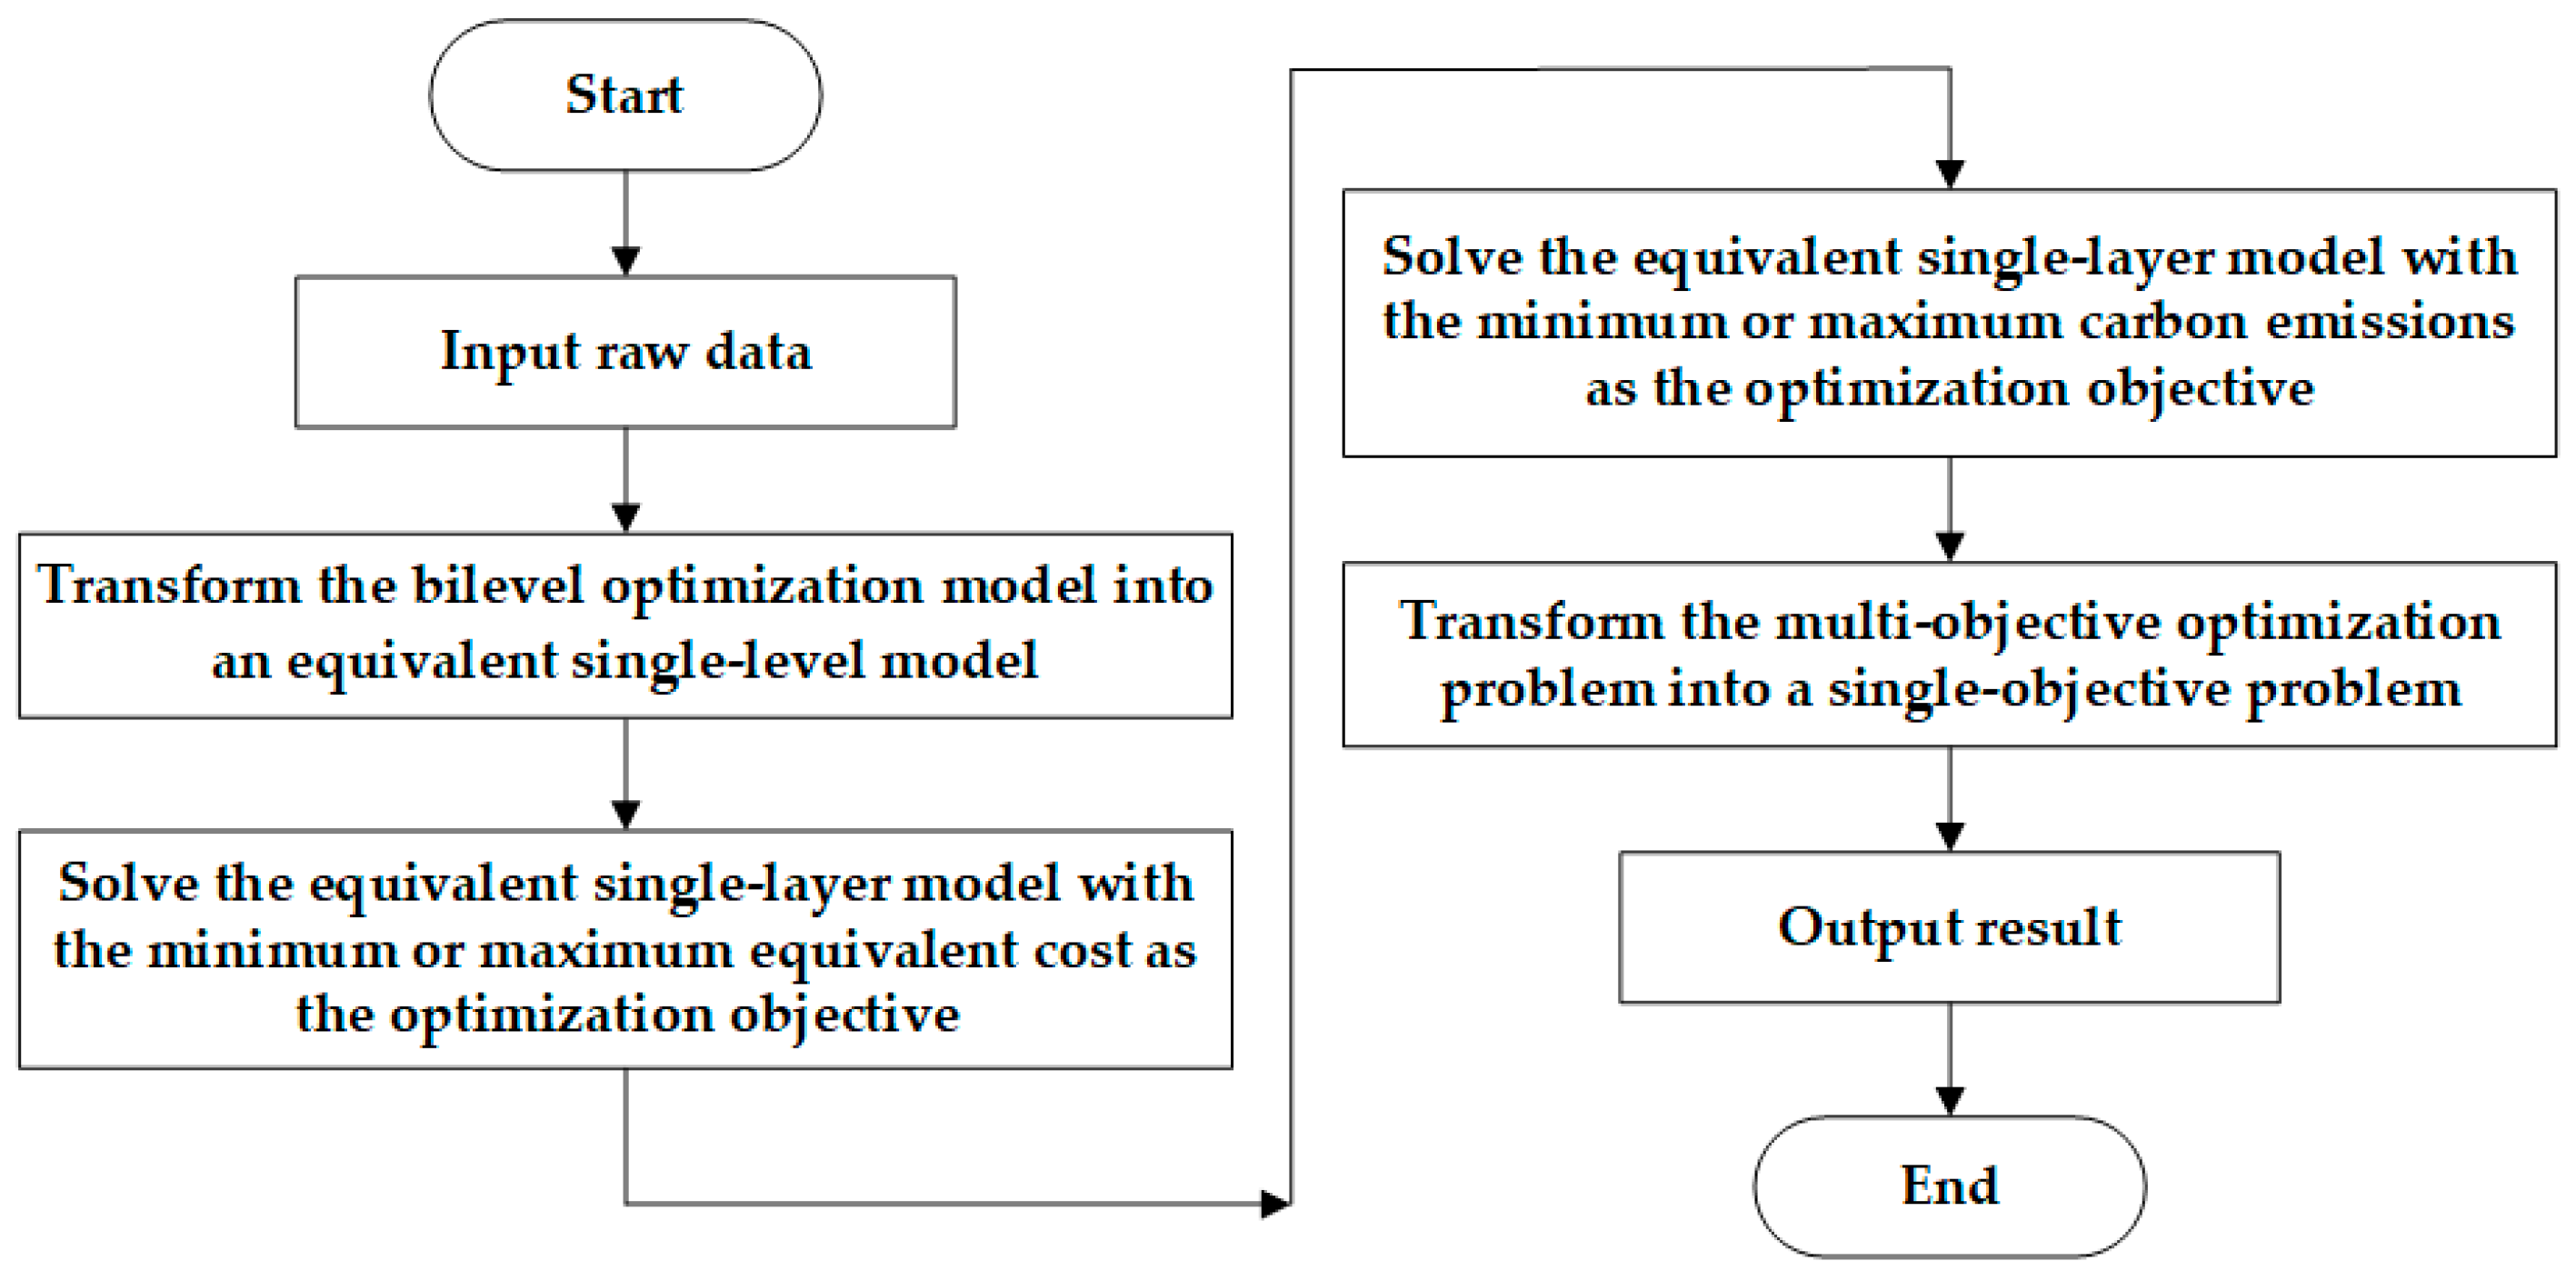
- Raw data is input, including equipment, load, energy preference, weight coefficient, etc.
- KKT optimality condition is used to transform the bilevel optimization model into an equivalent single-level model.
- The equivalent single-layer model is solved with the minimum equivalent cost as the optimization objective and is found. In the same way, the equivalent single-layer model is solved with the maximum equivalent cost as the optimization objective and is found. According to Formula (25), can be found.
- The equivalent single-layer model is solved with minimum carbon emissions as the optimization goal and is found. In the same way, the equivalent single-layer model is solved with maximum carbon emissions as the optimization goal and is found. According to Formula (26), can be found.
- and are substituted into Formula (27) to transform the multi-objective optimization problem into a single-objective problem. Then, the equivalent single-layer model is solved with minimum as the optimization objective.
- The equipment operation status of operator and load adjustment status of users are obtained.
5. Simulation Analysis
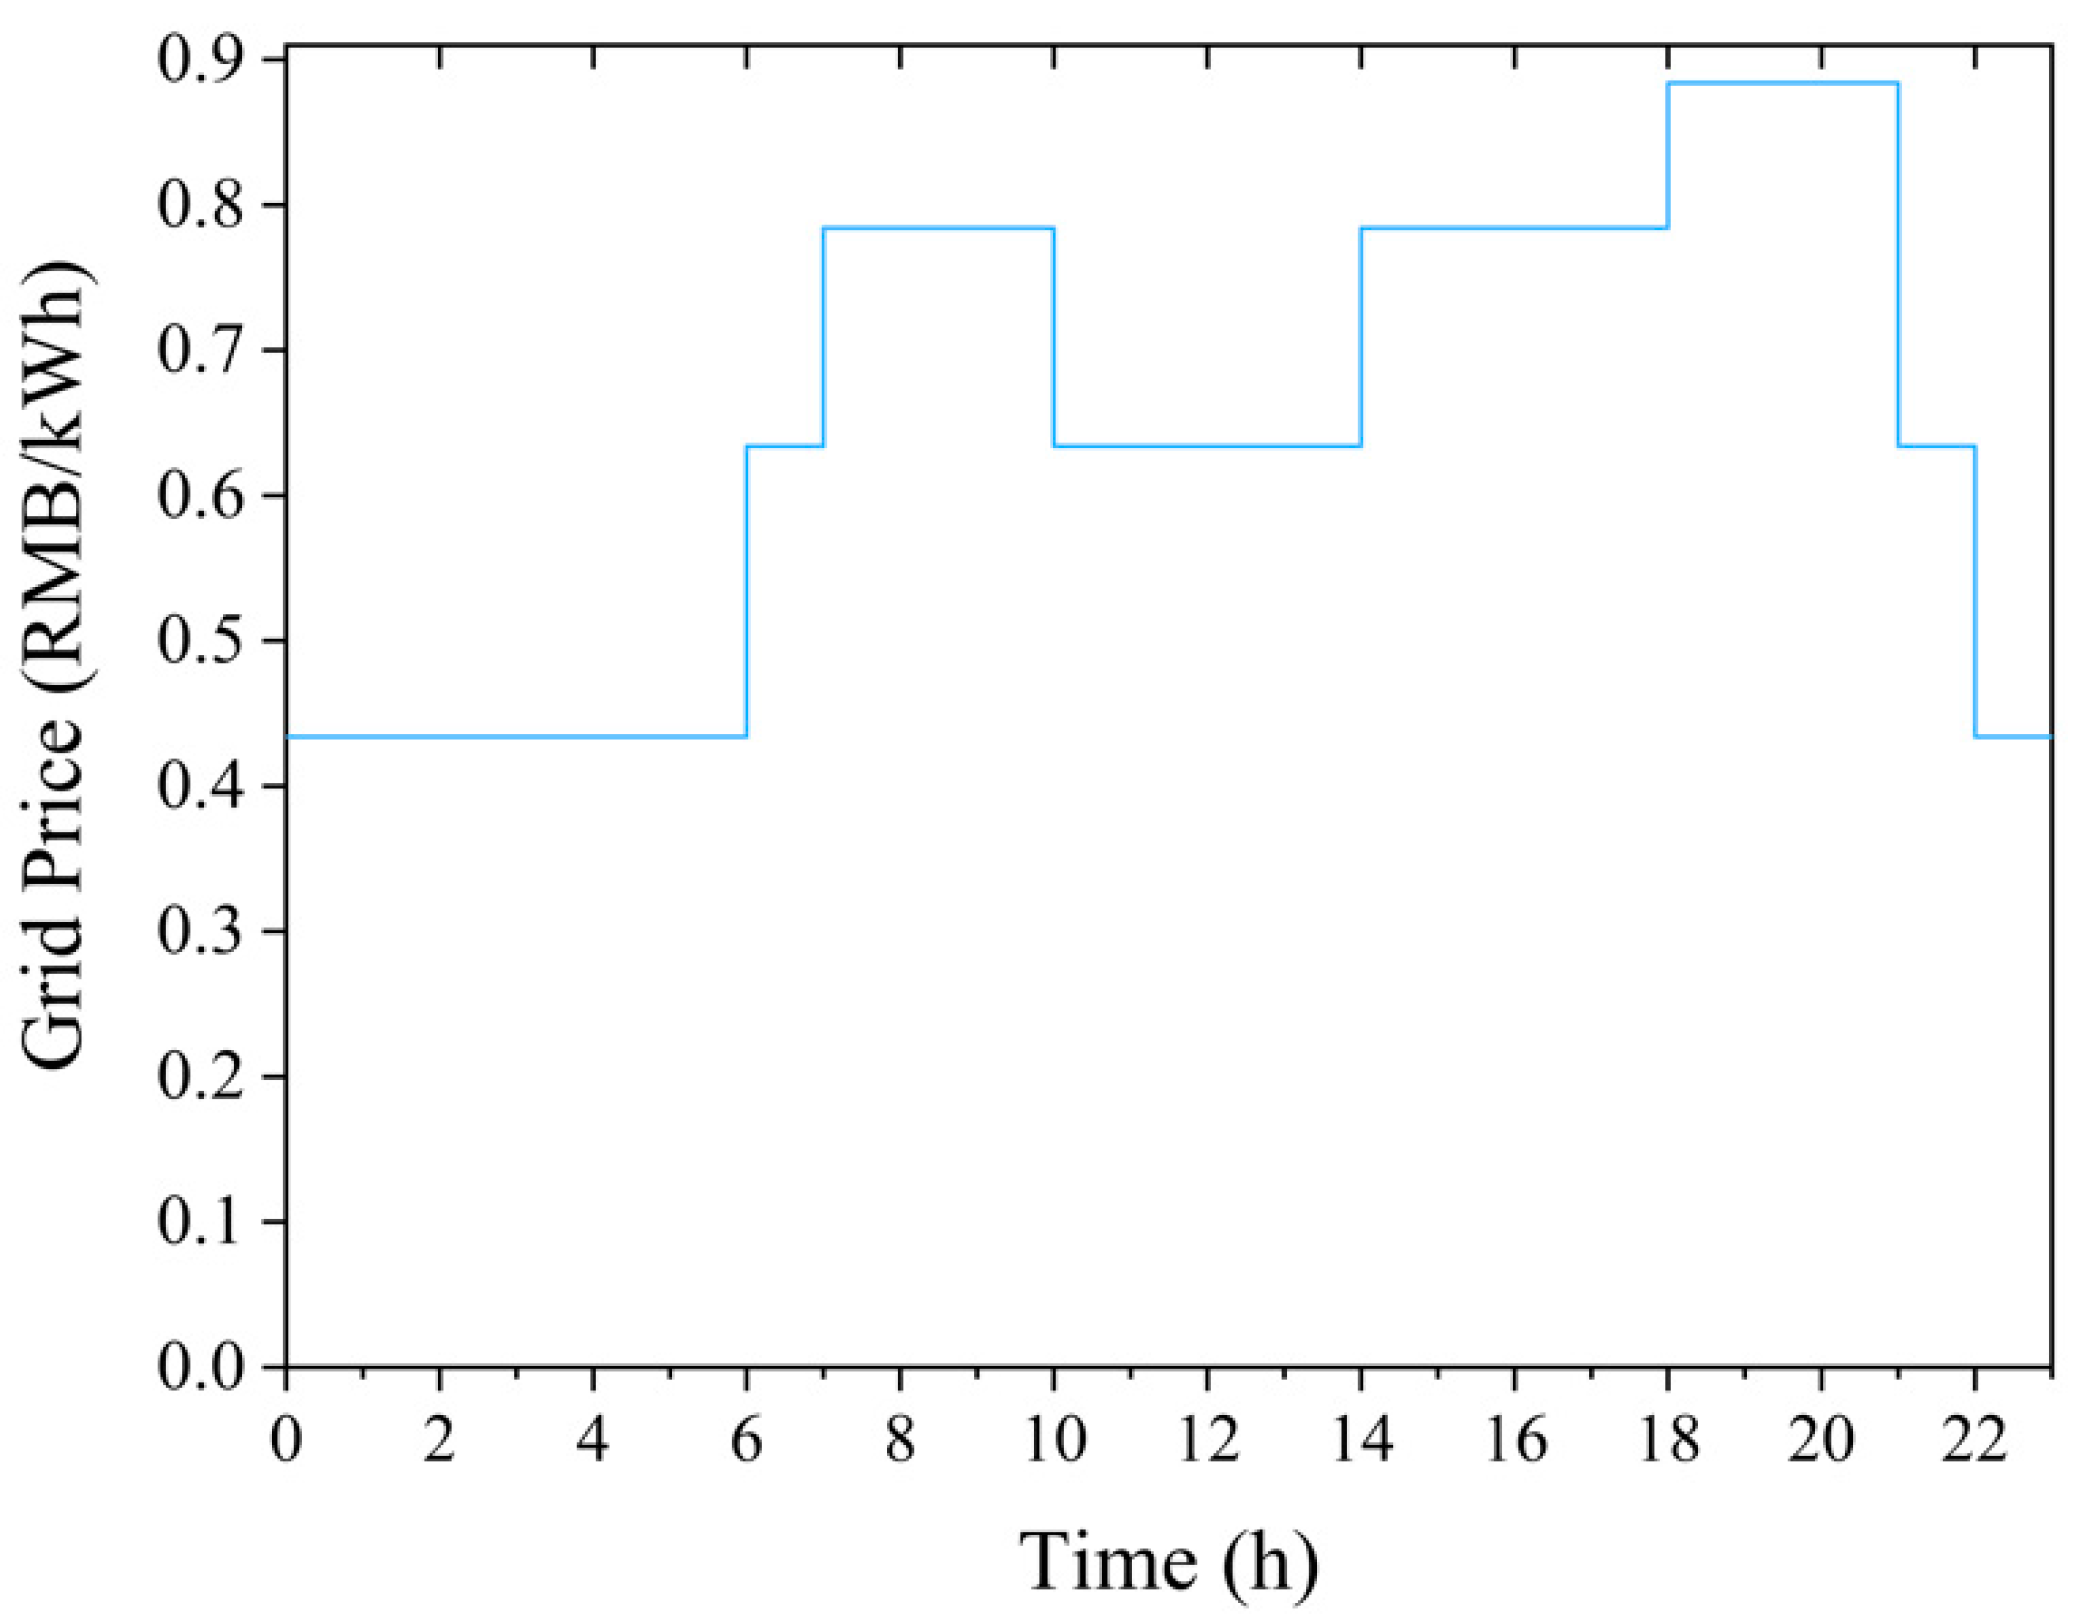
5.1. Data
5.2. Case Study
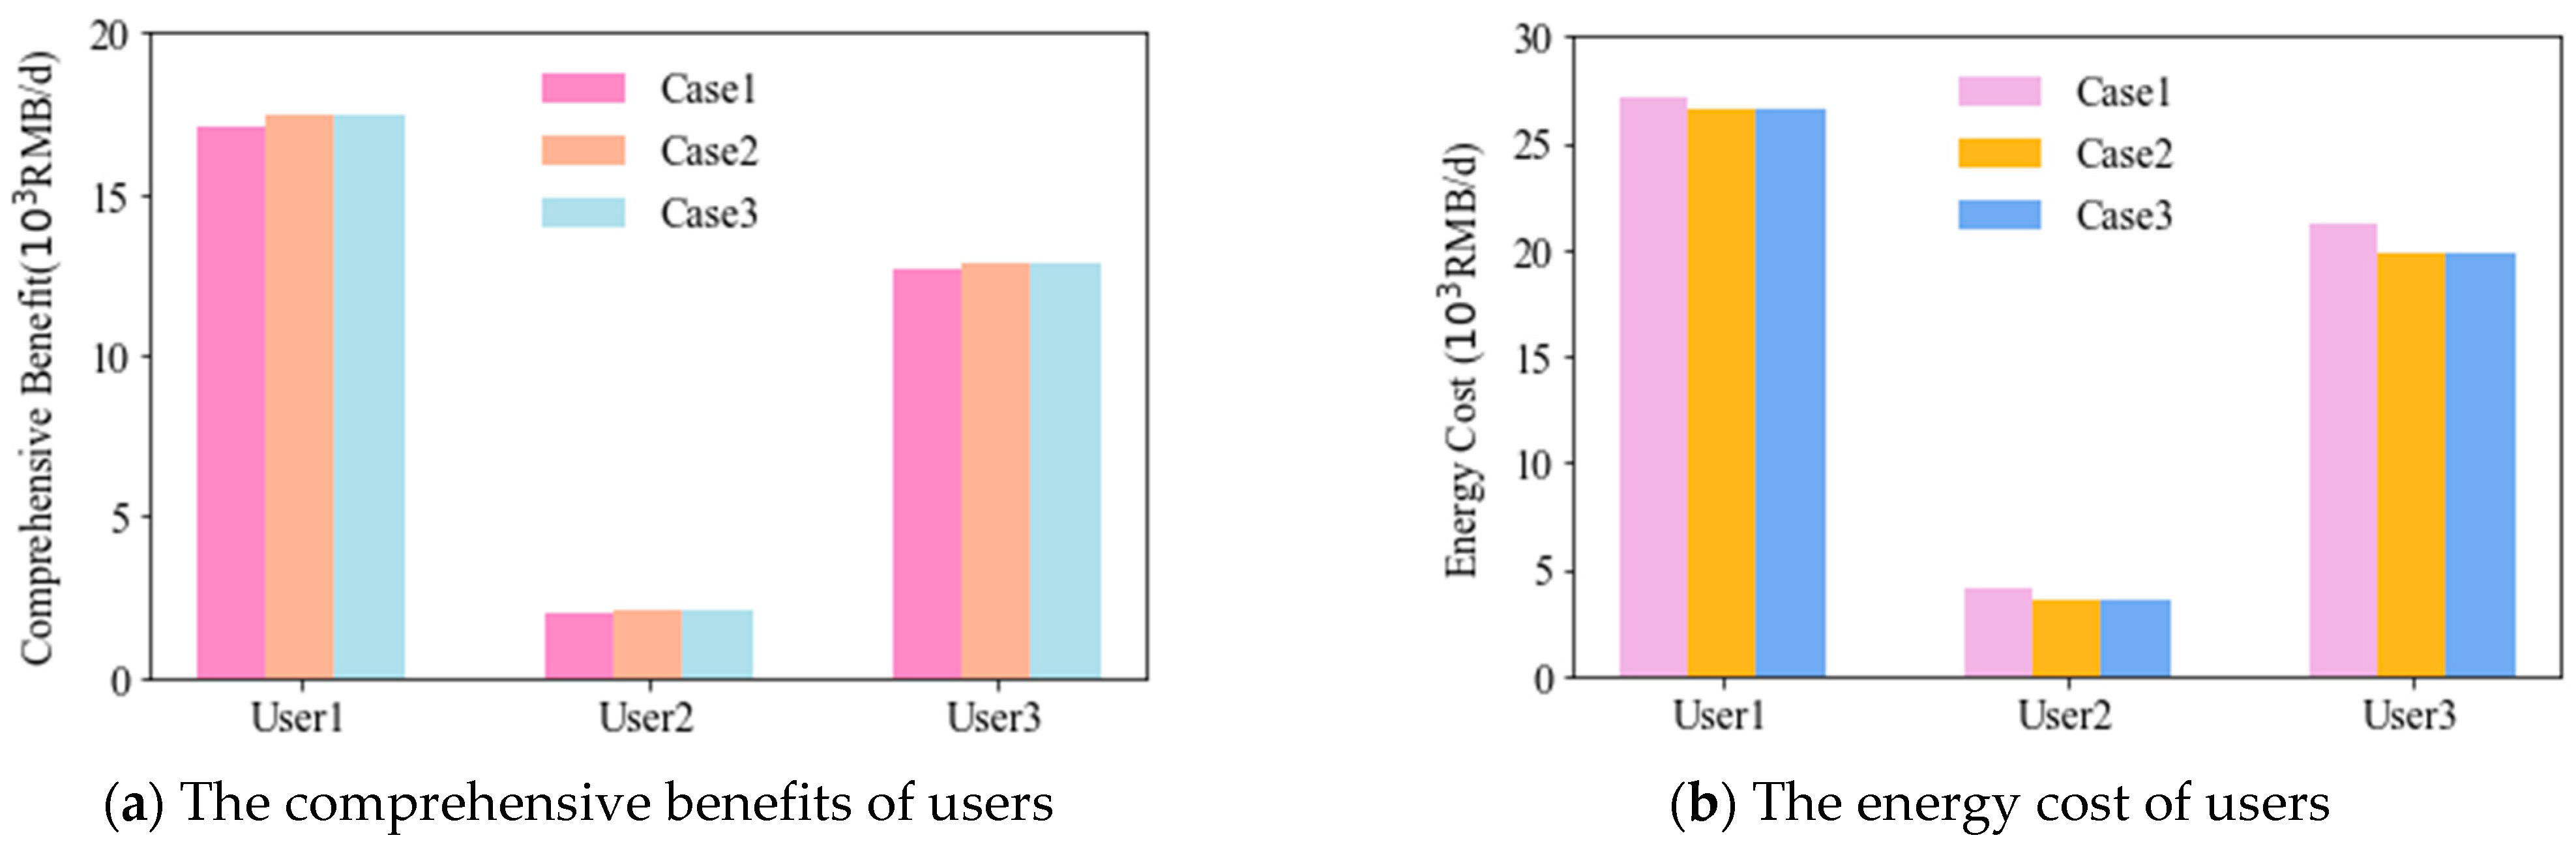
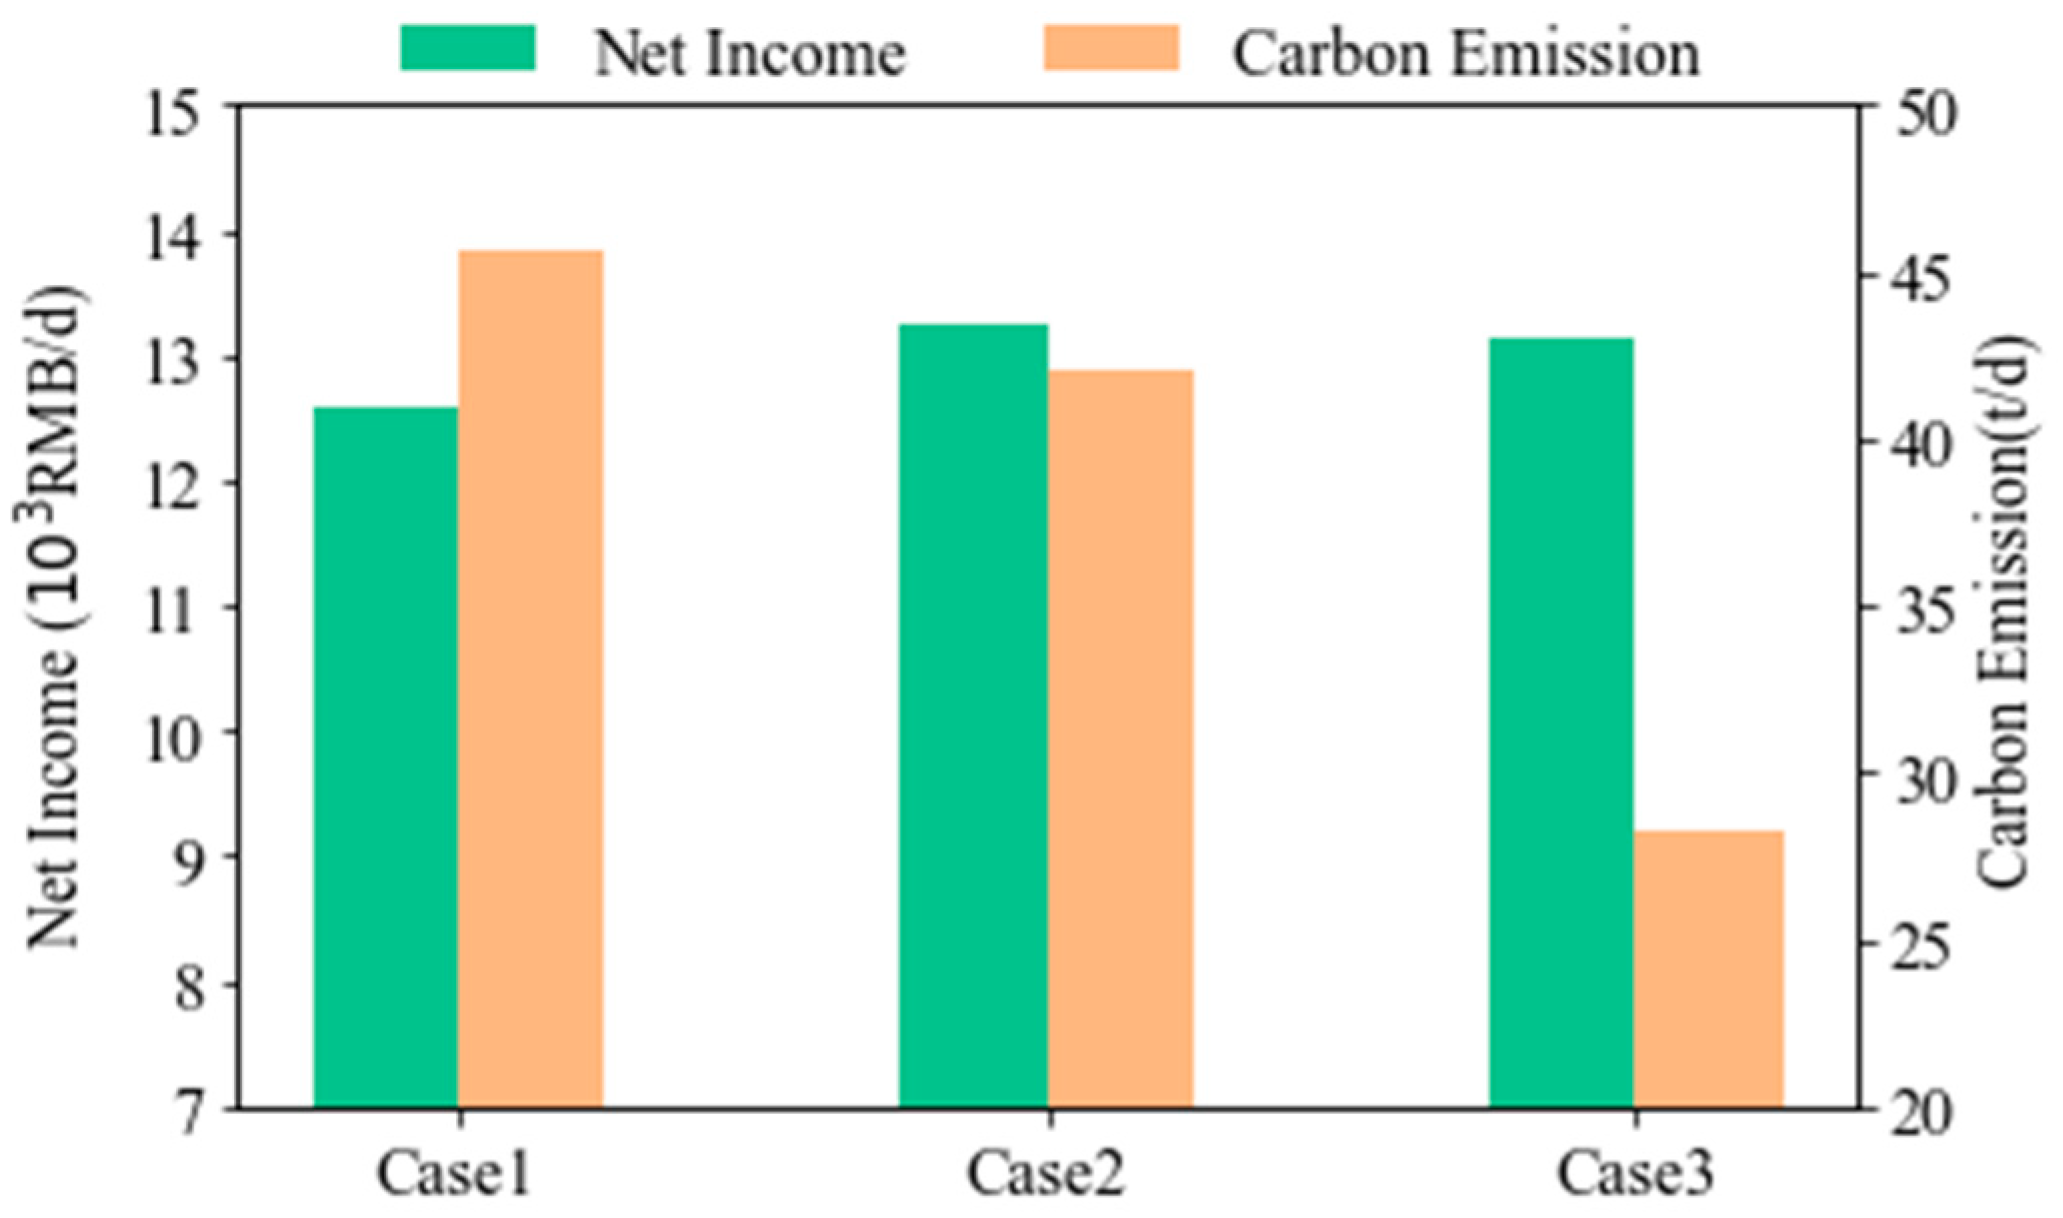
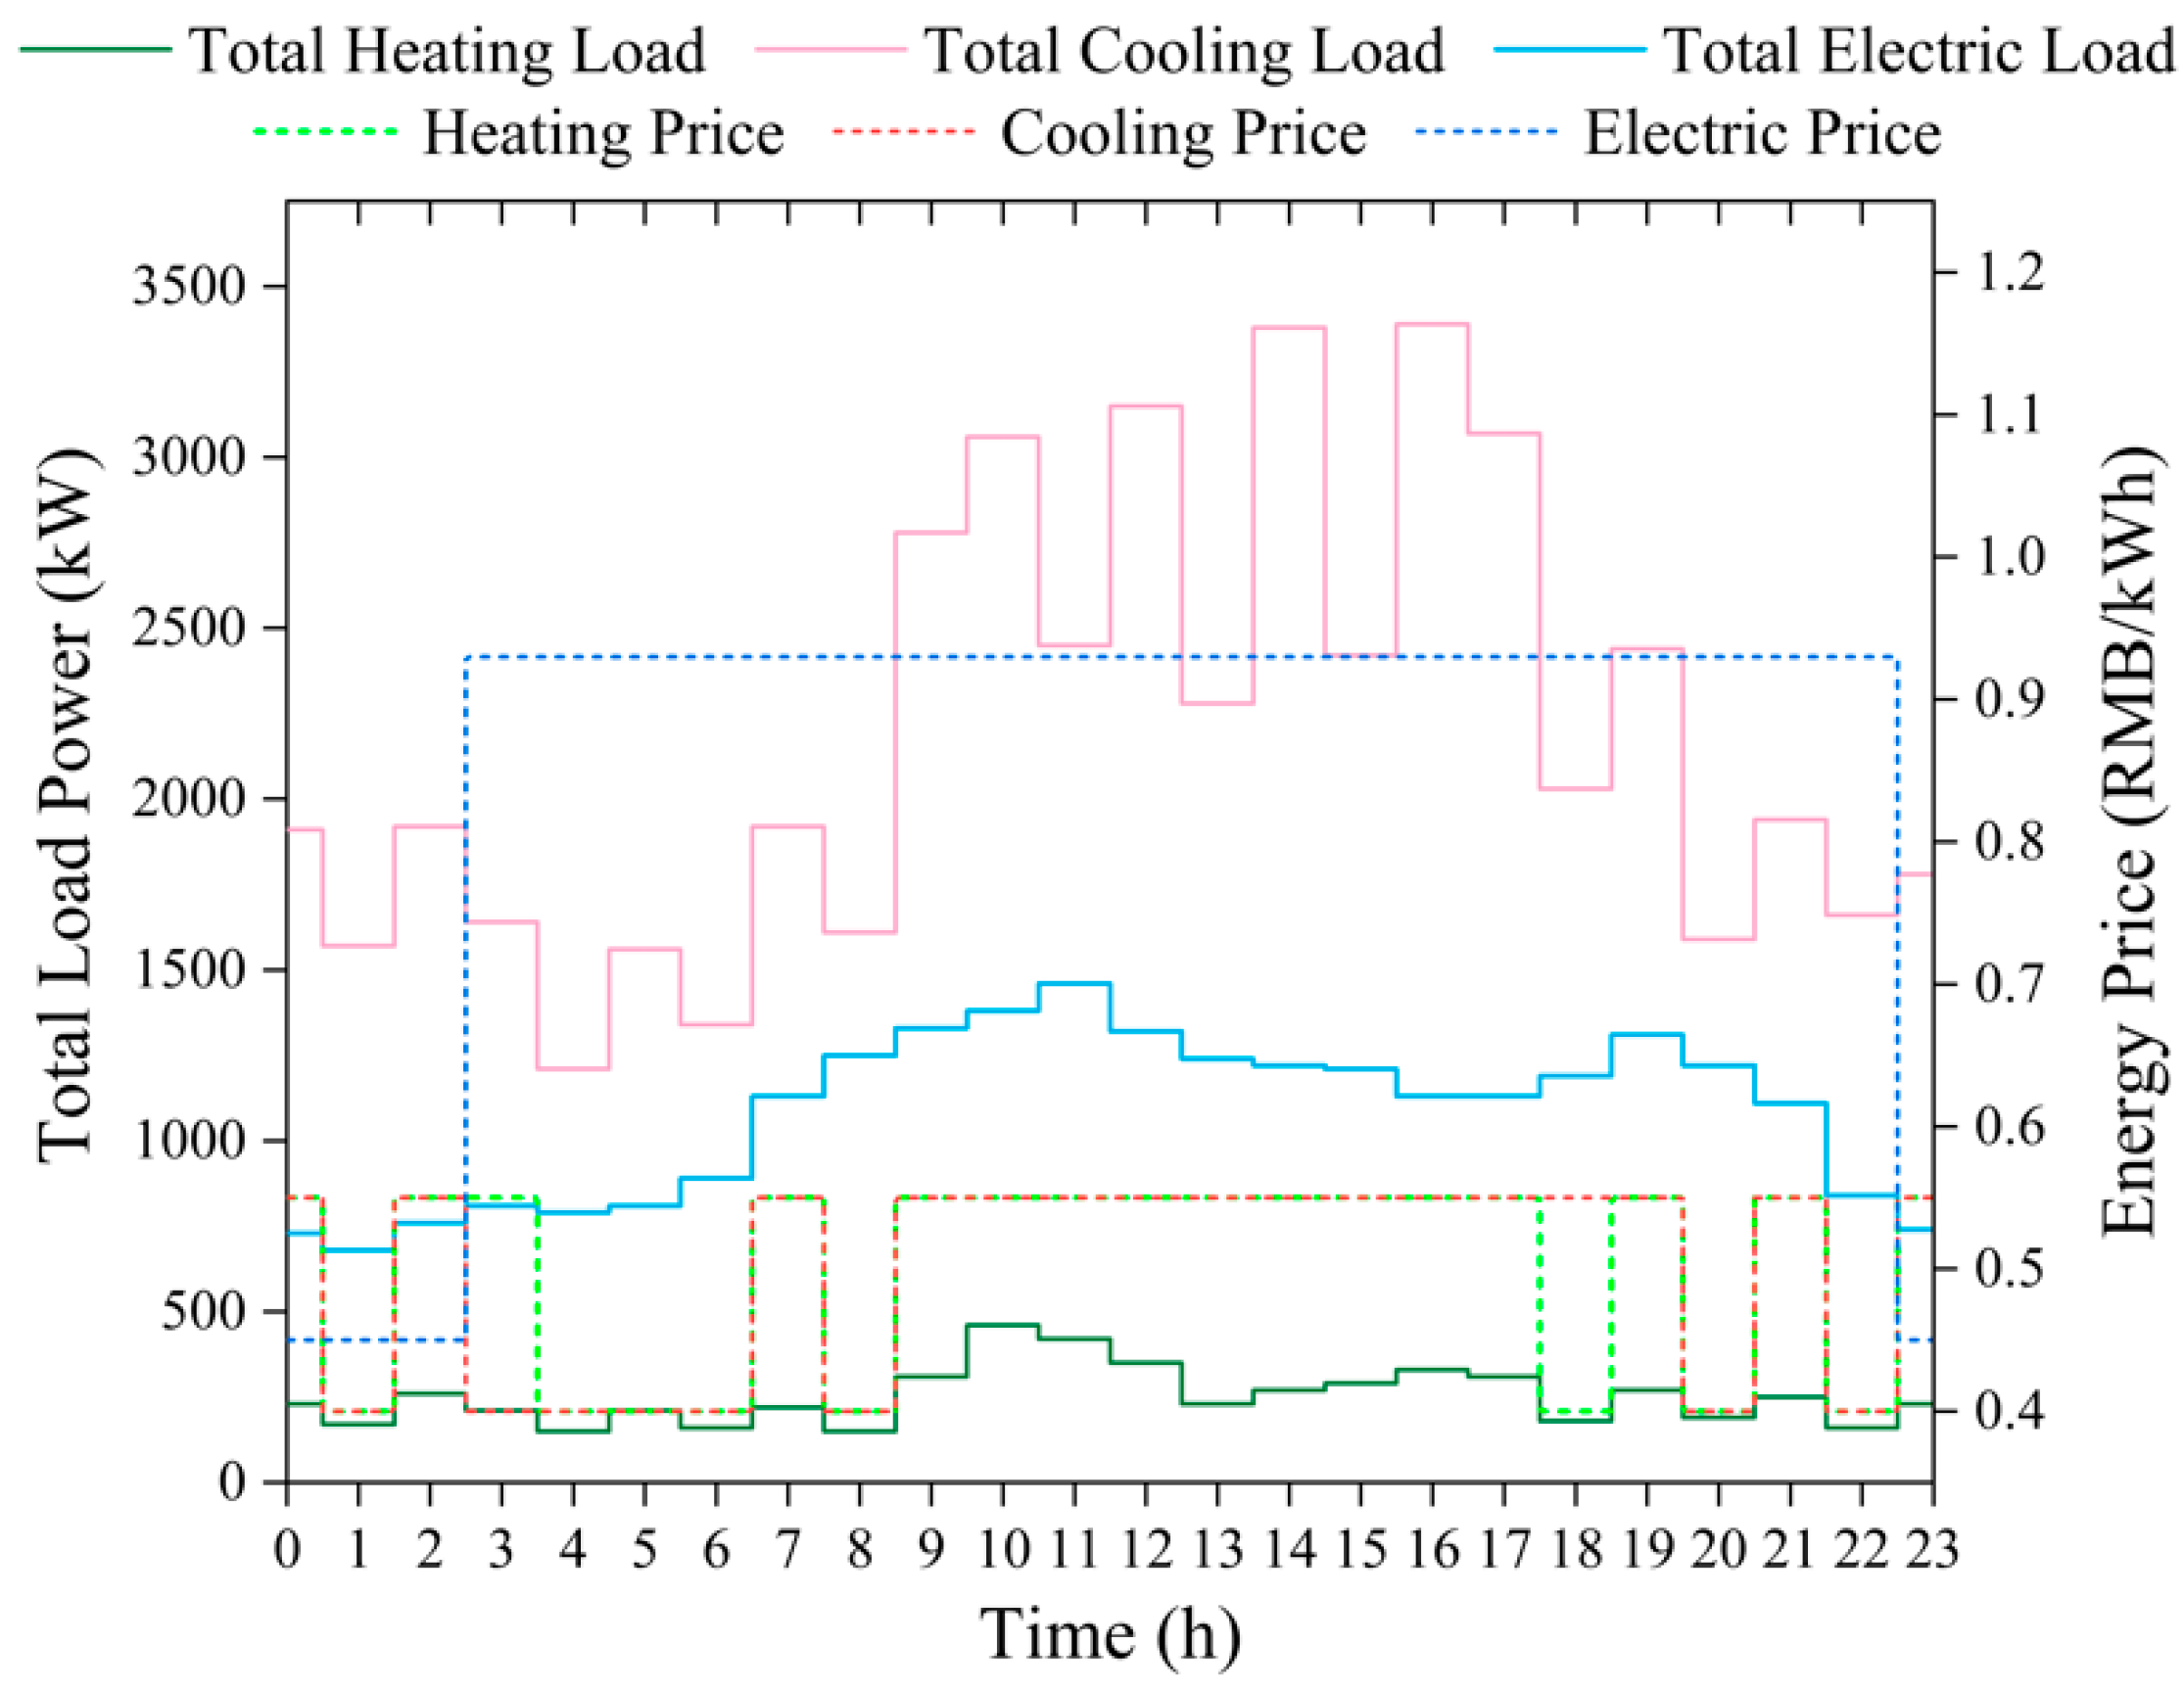
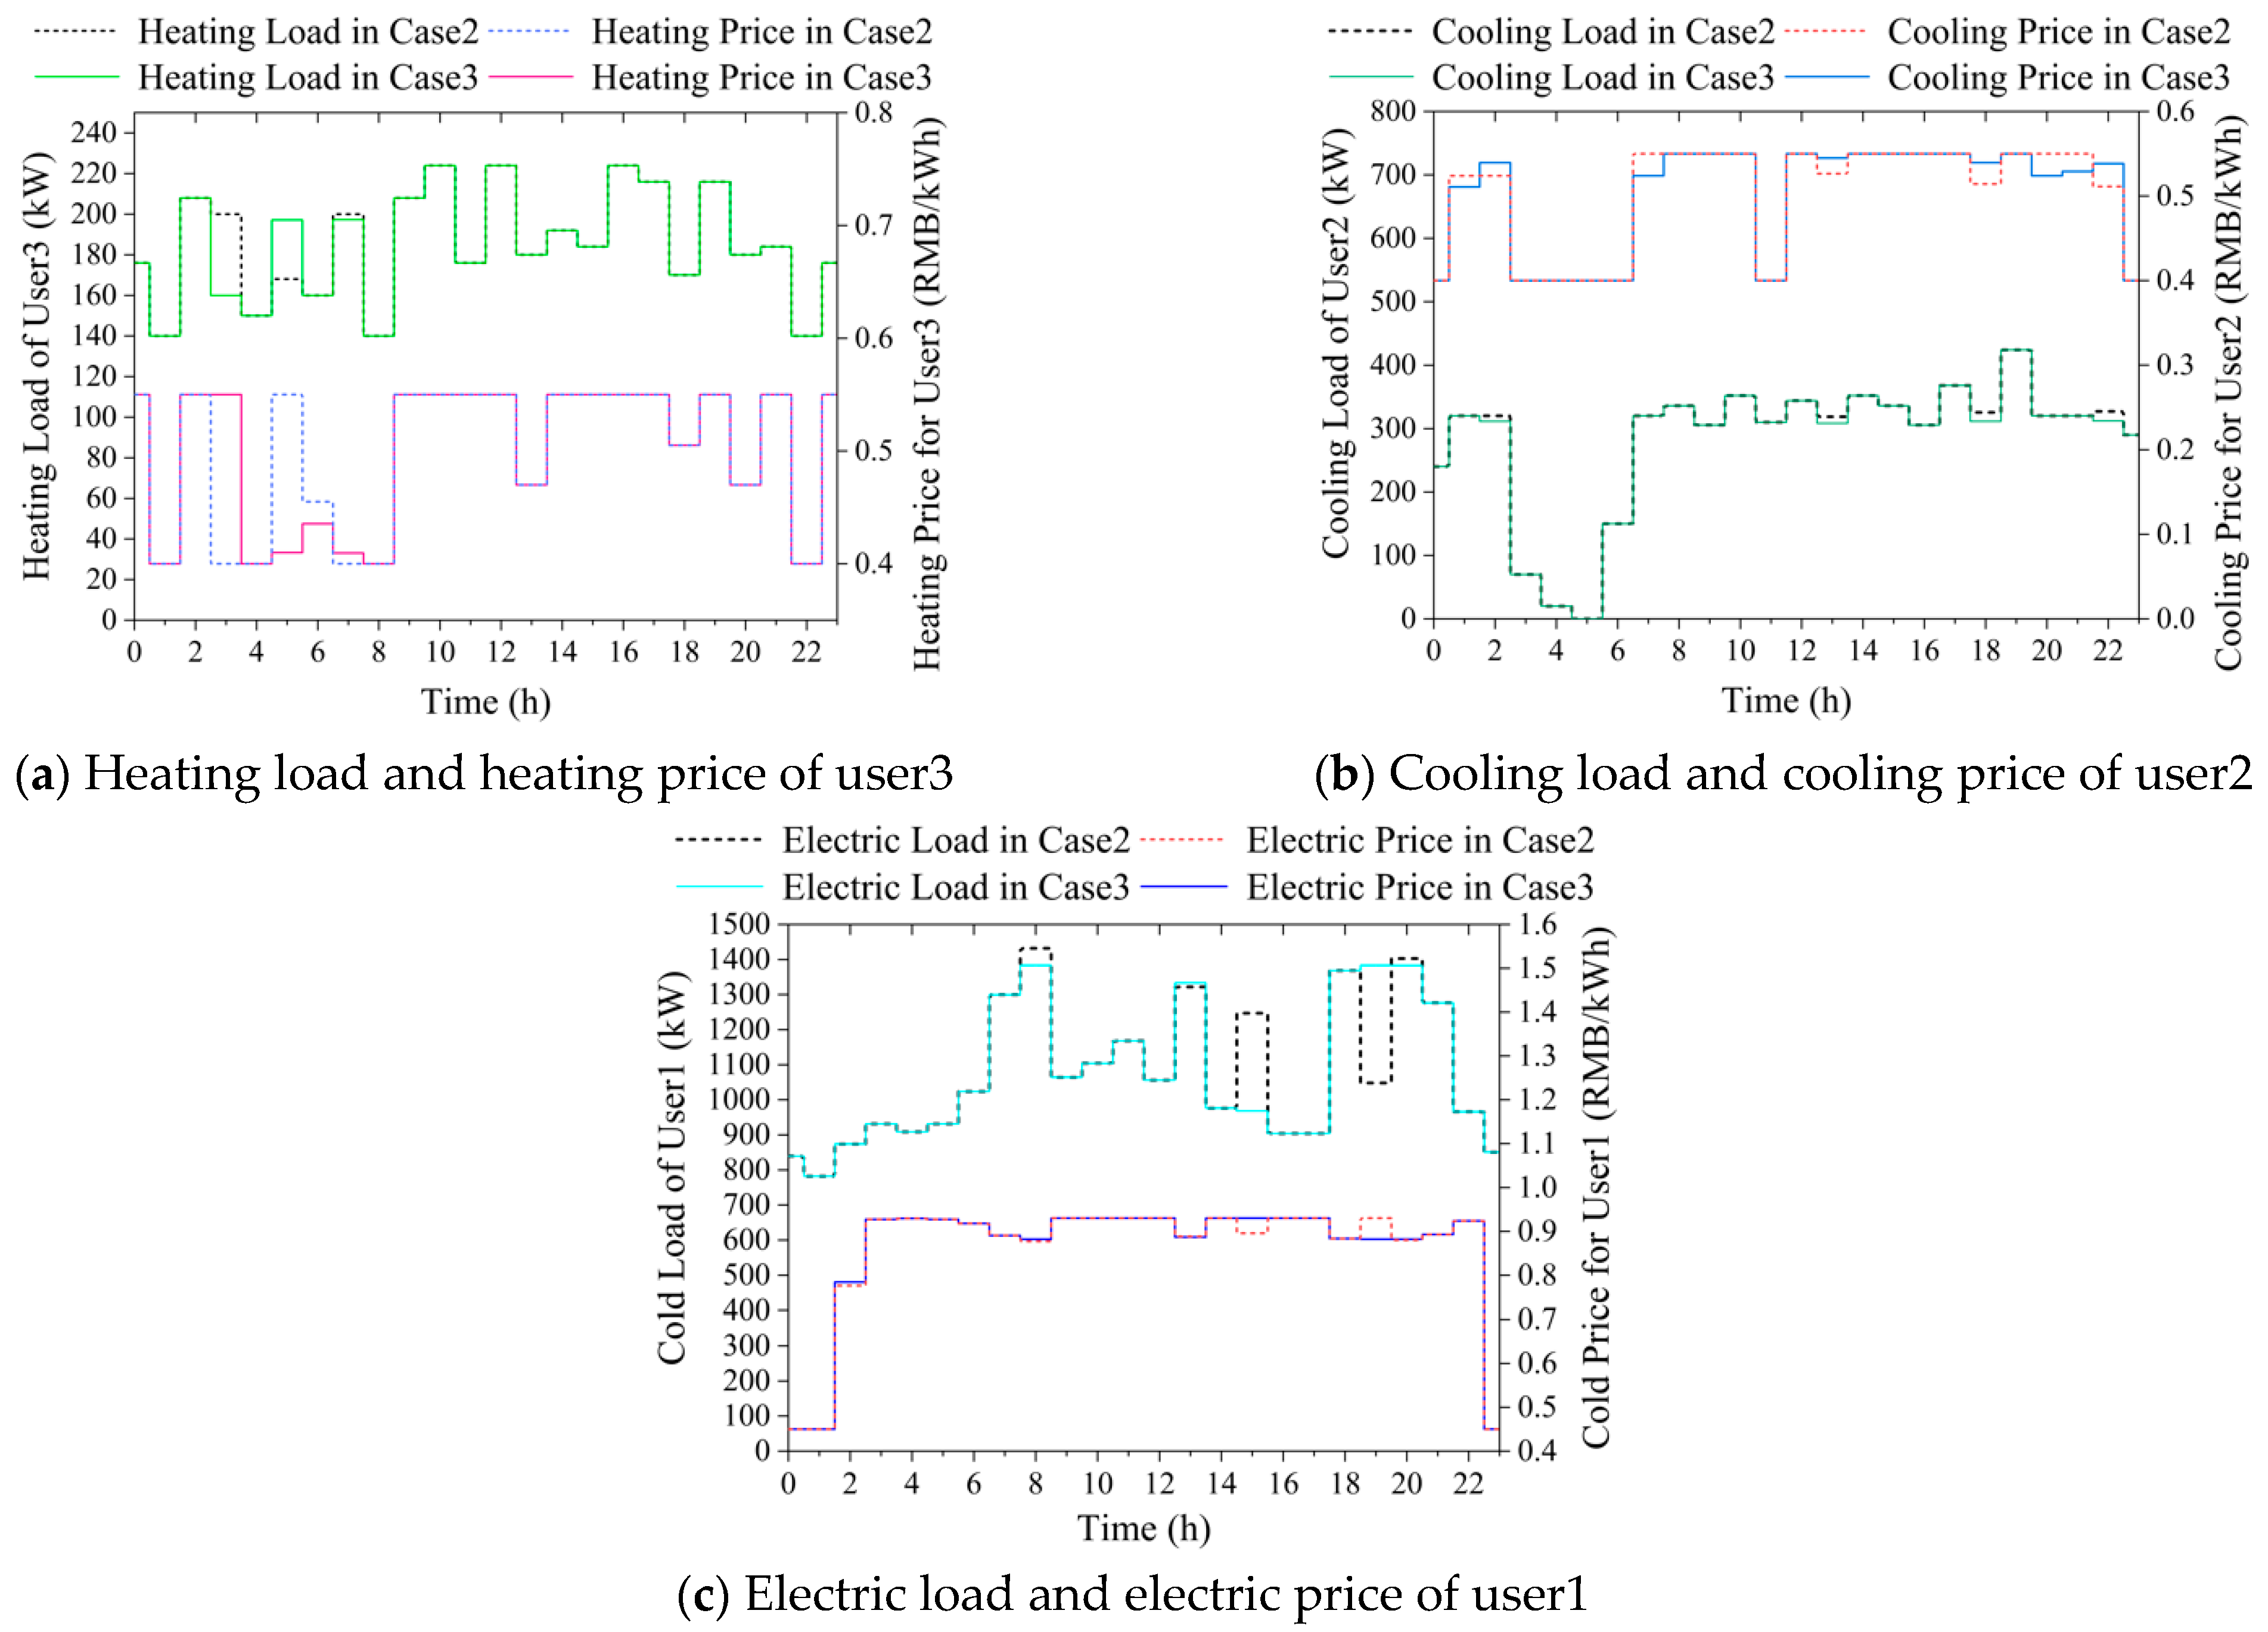
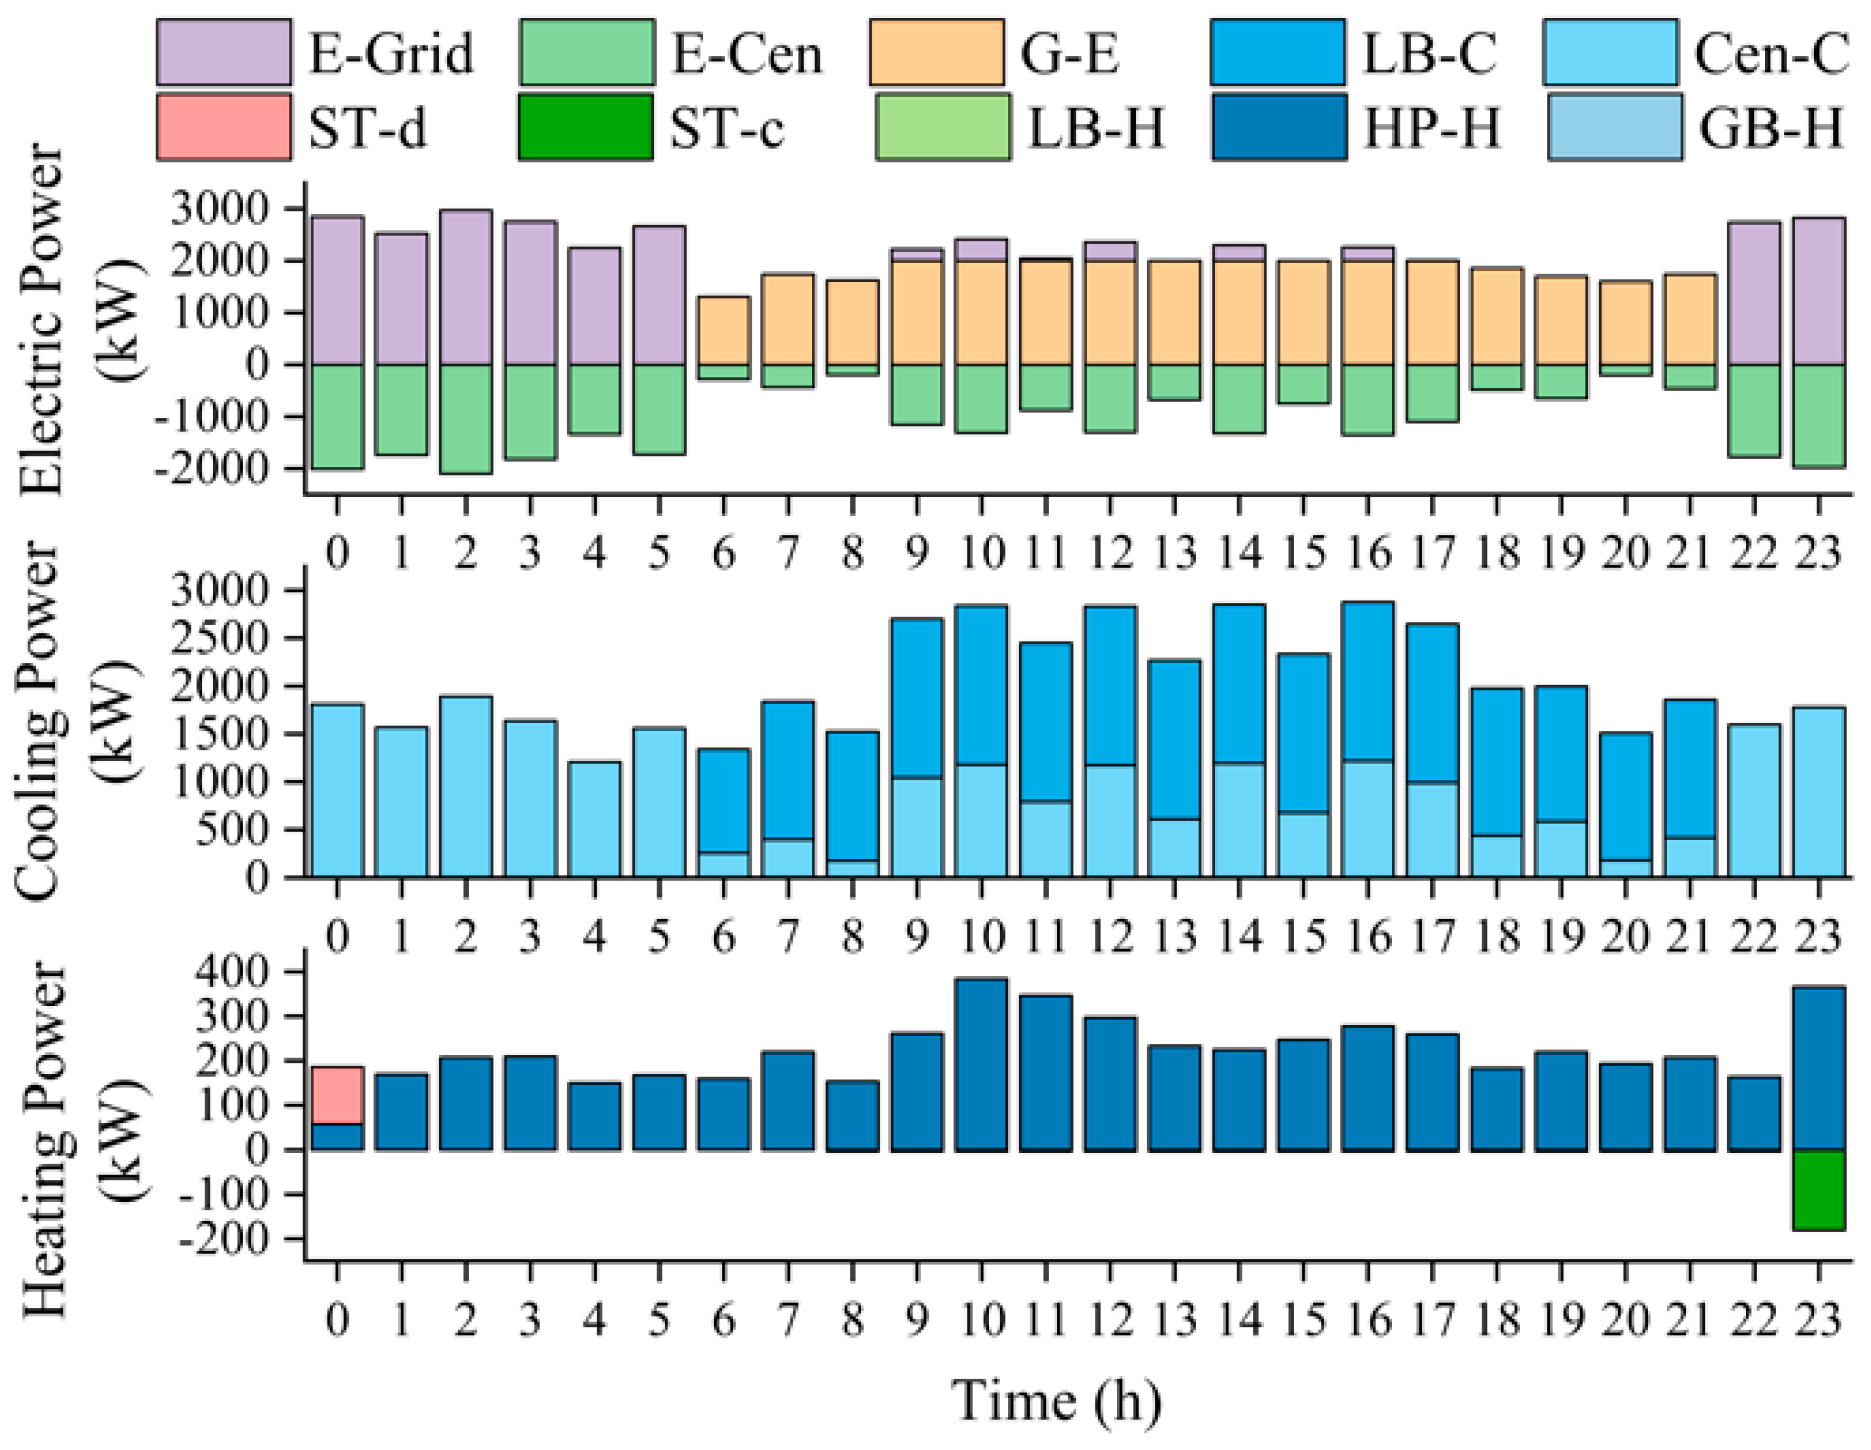
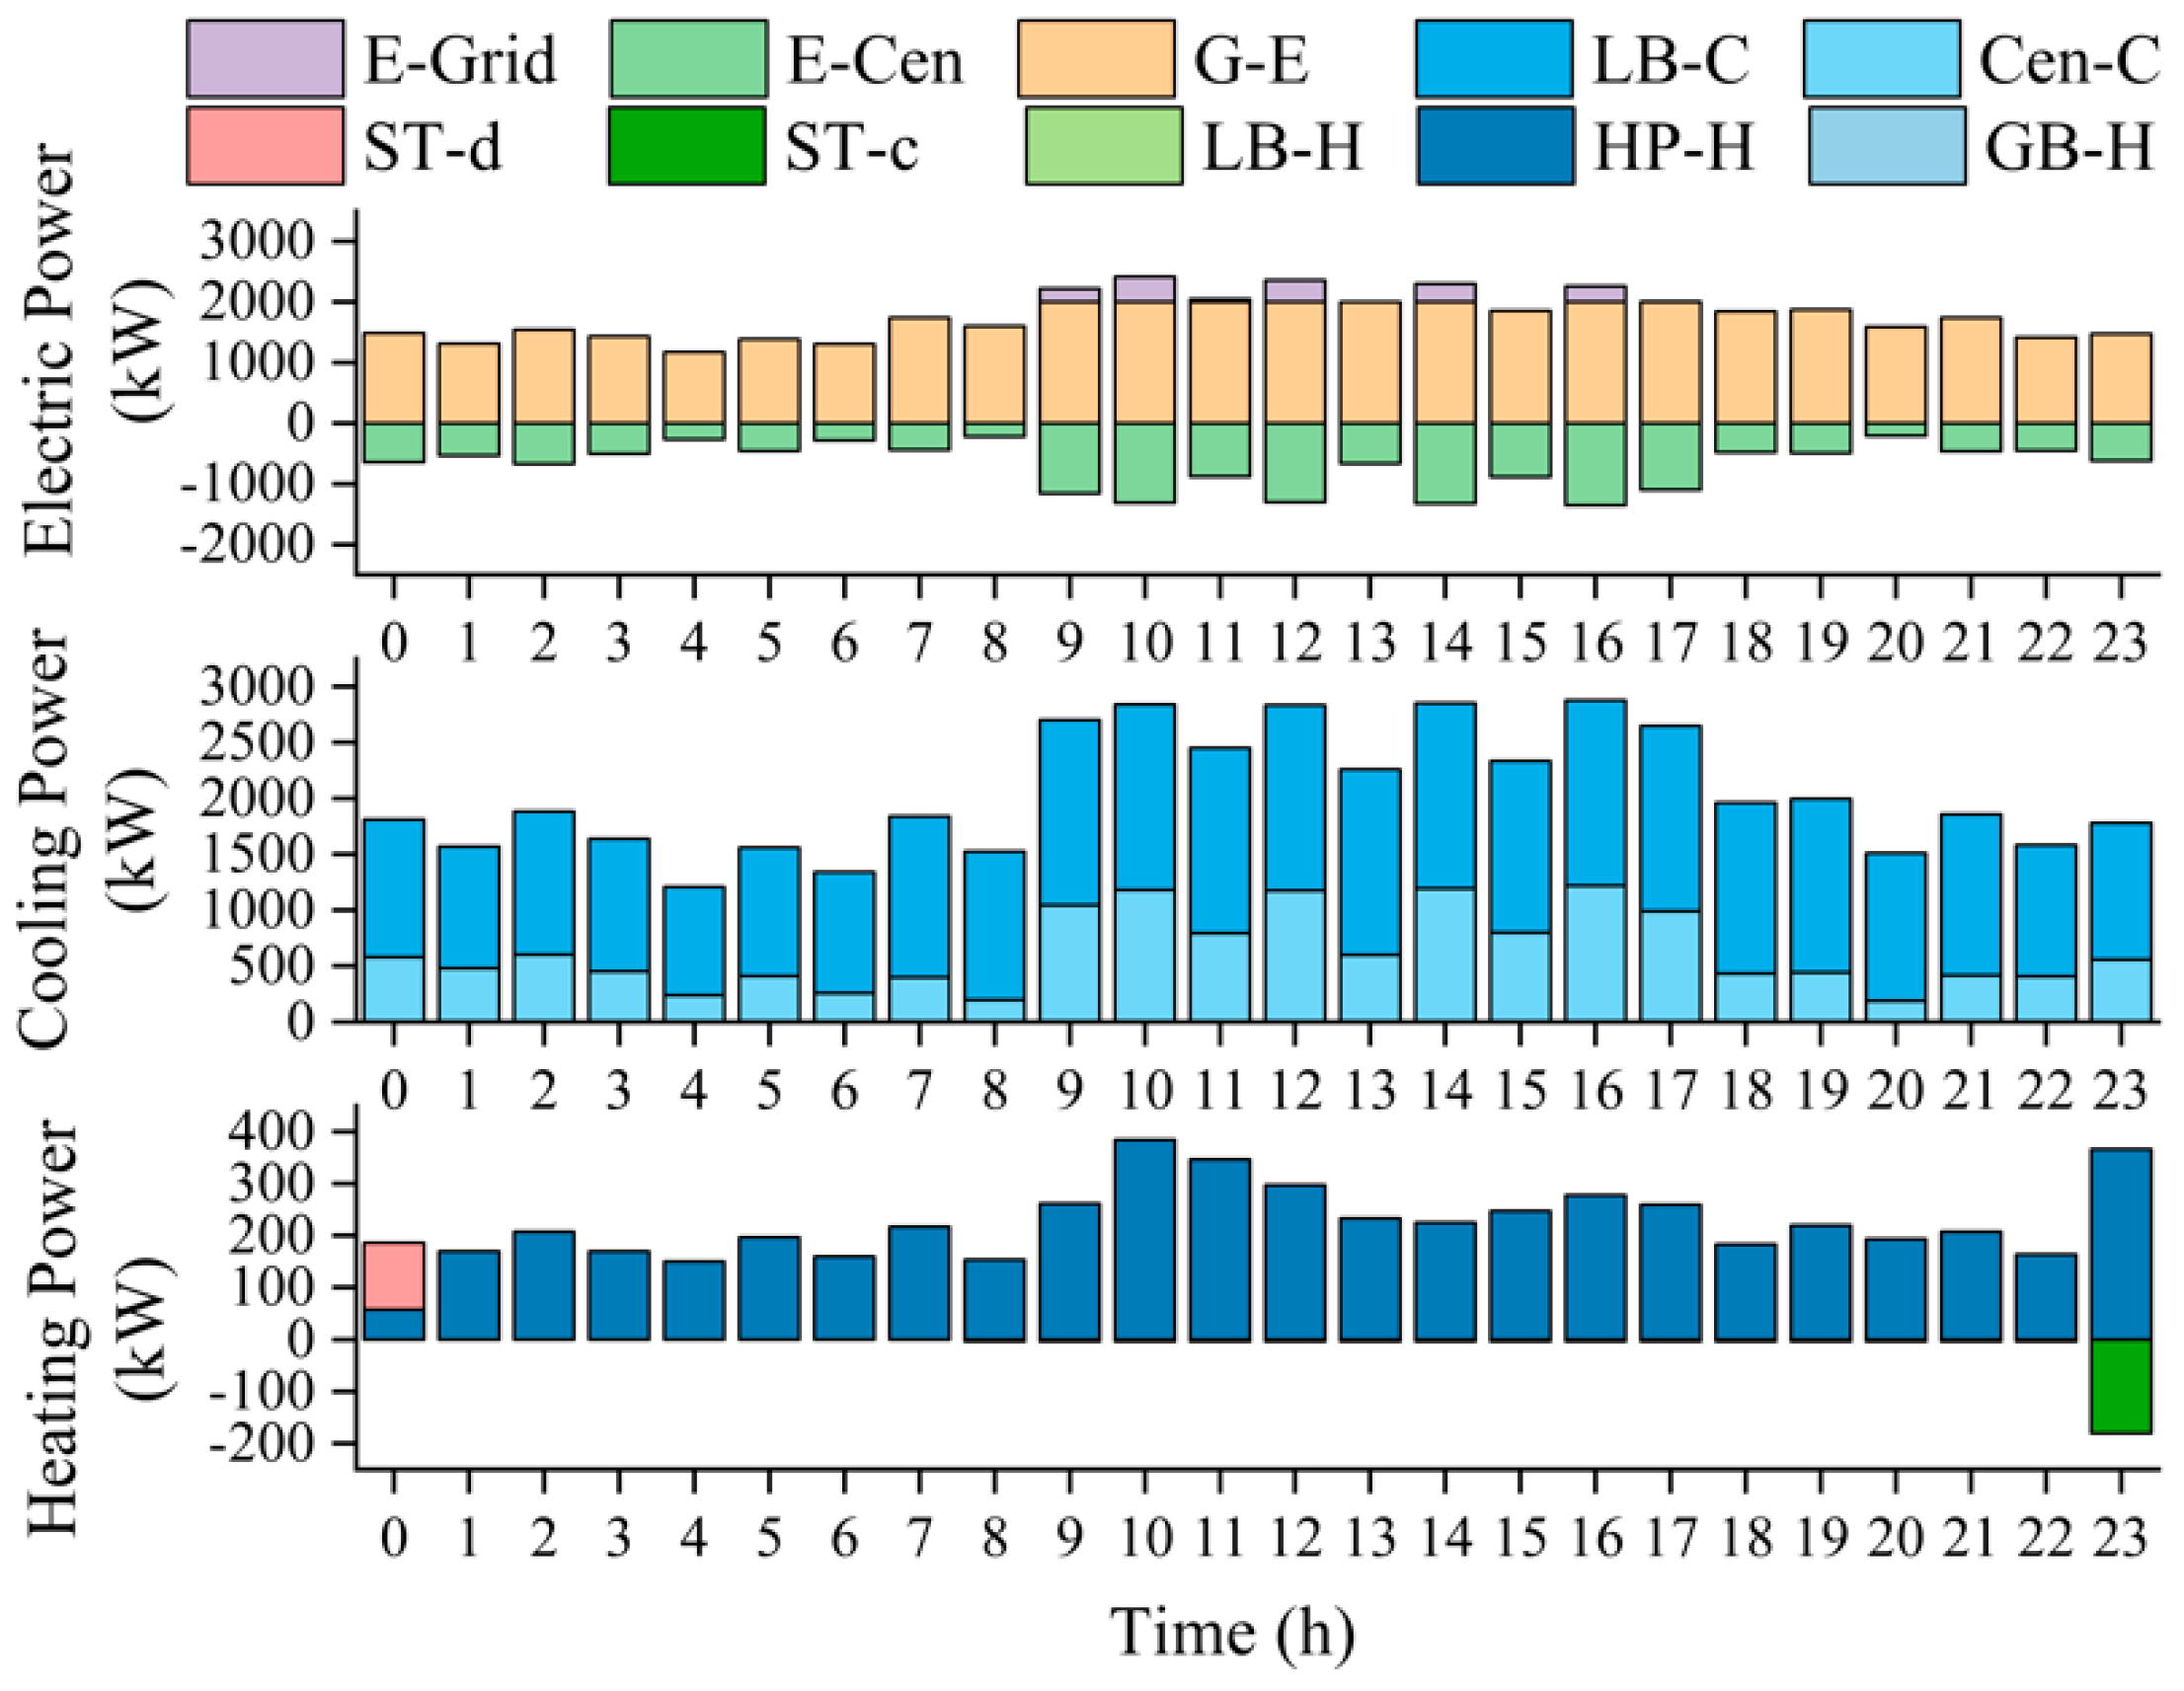
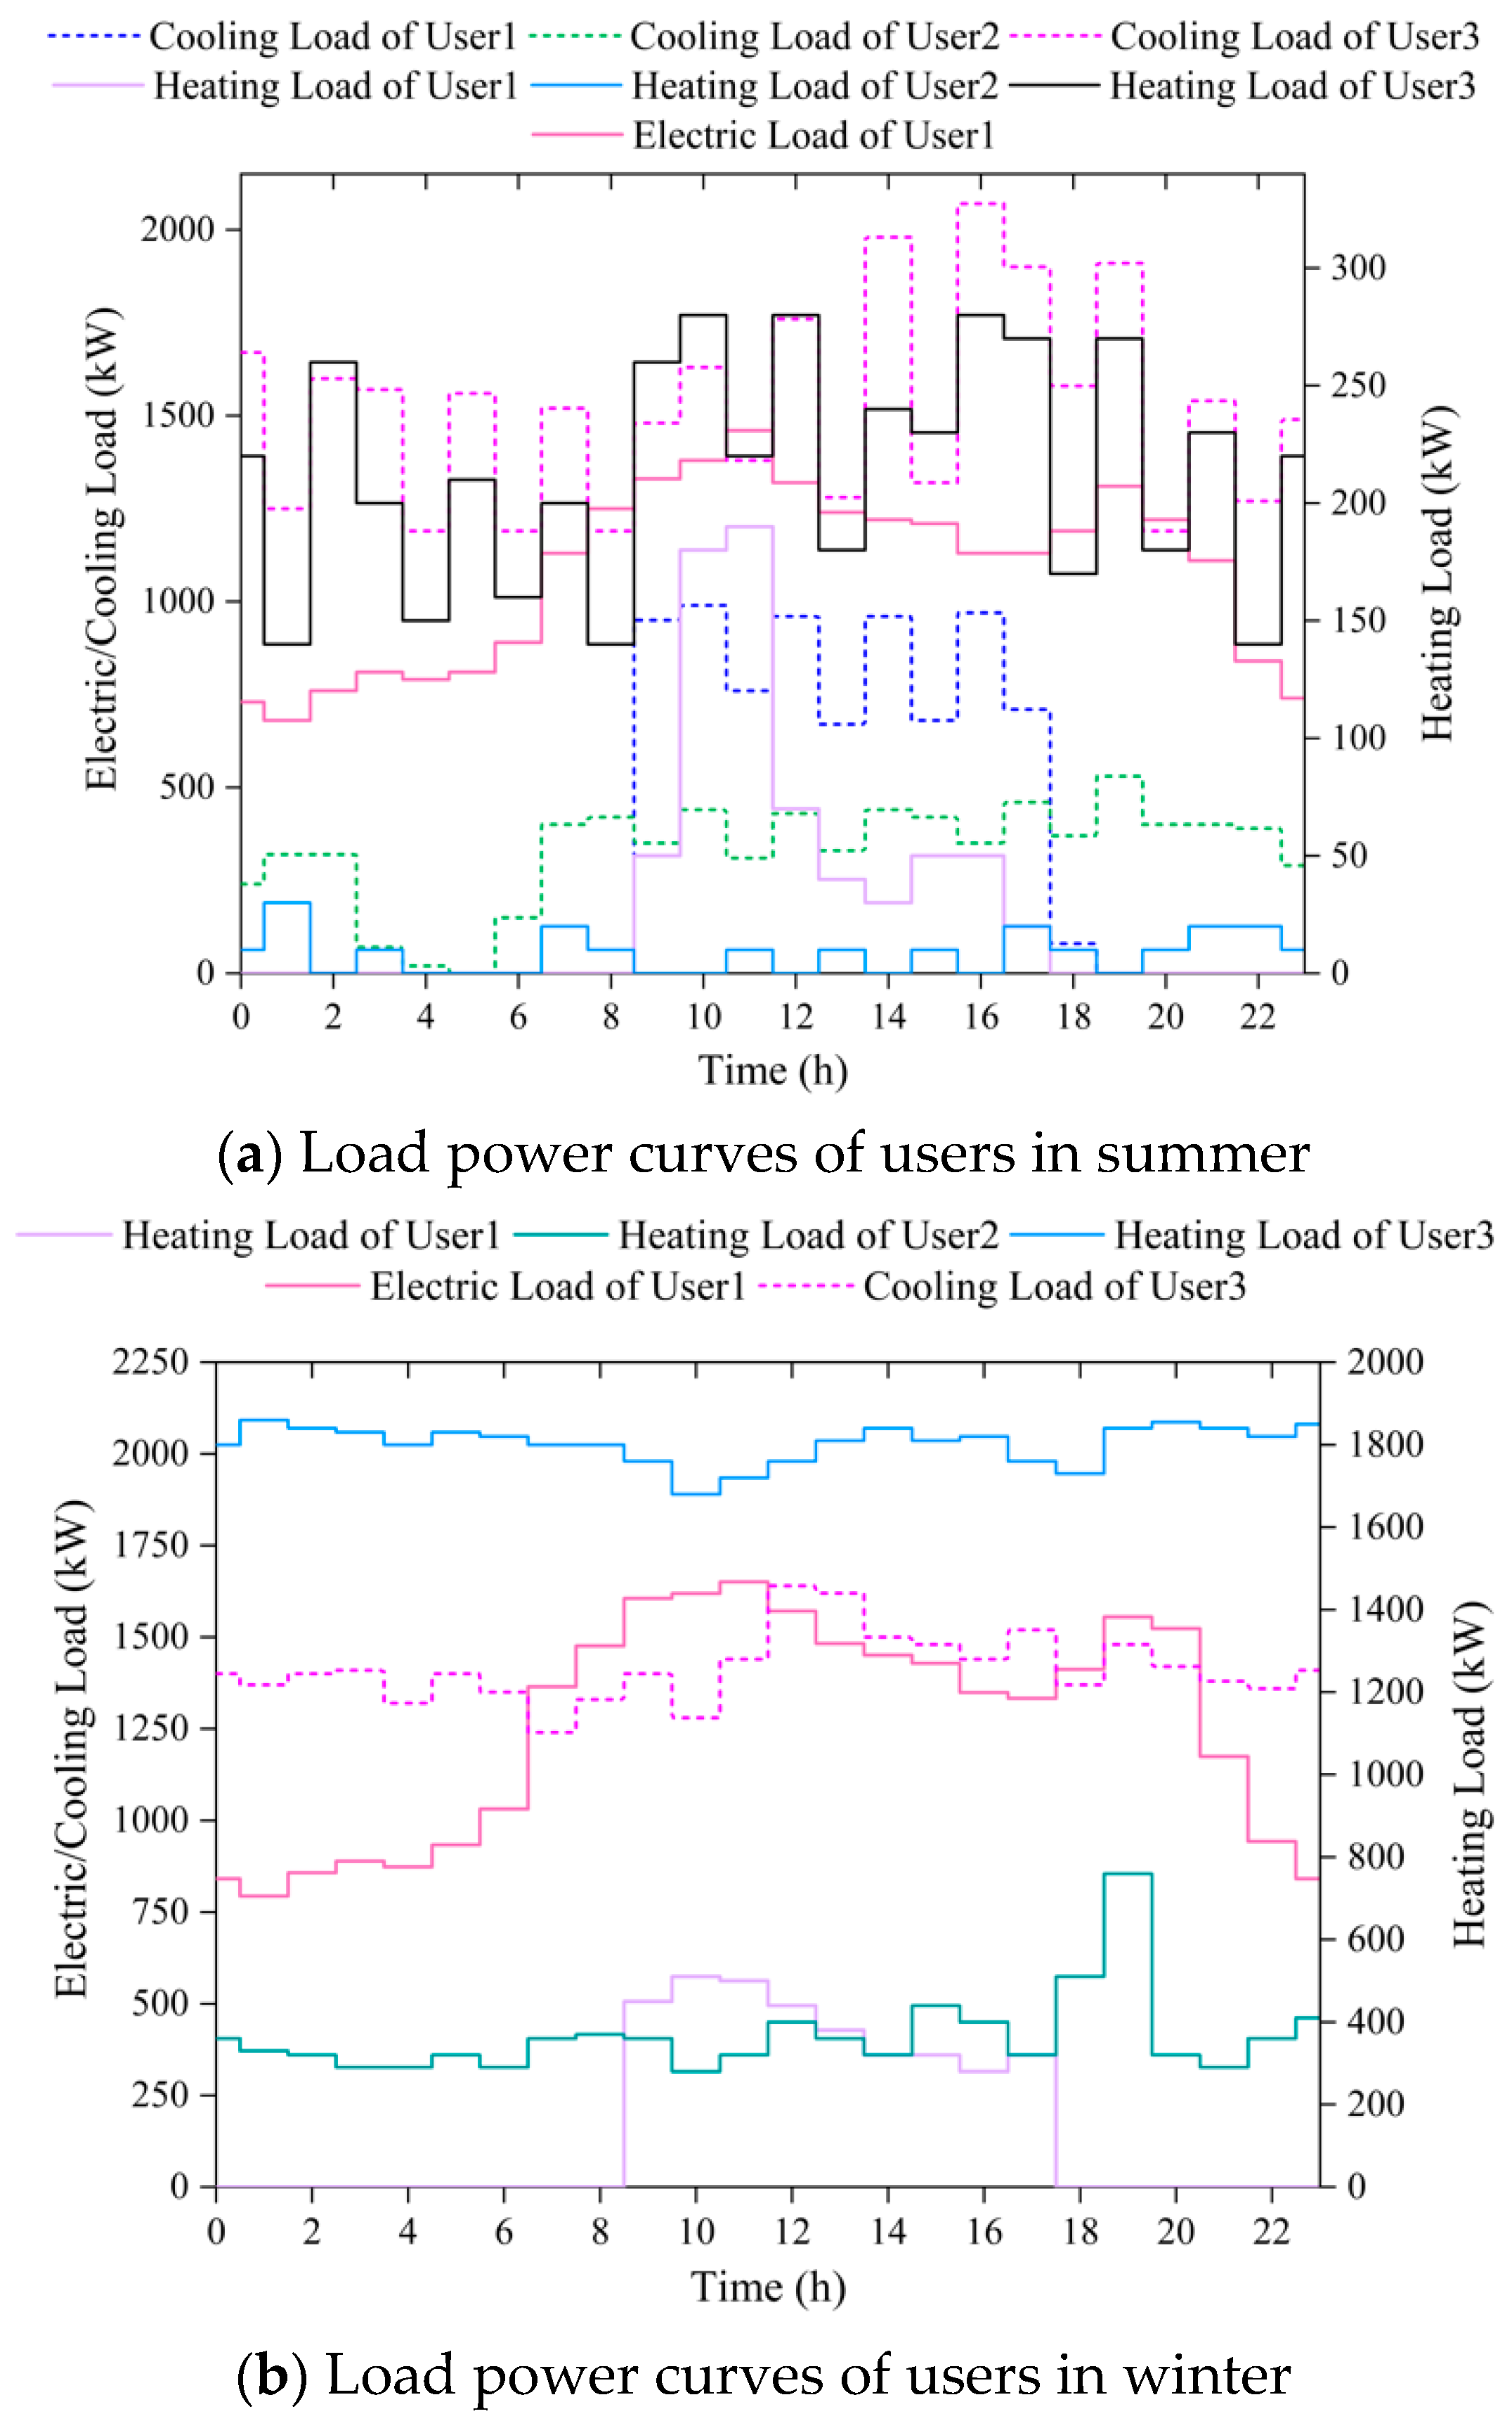
5.2.1. Summer
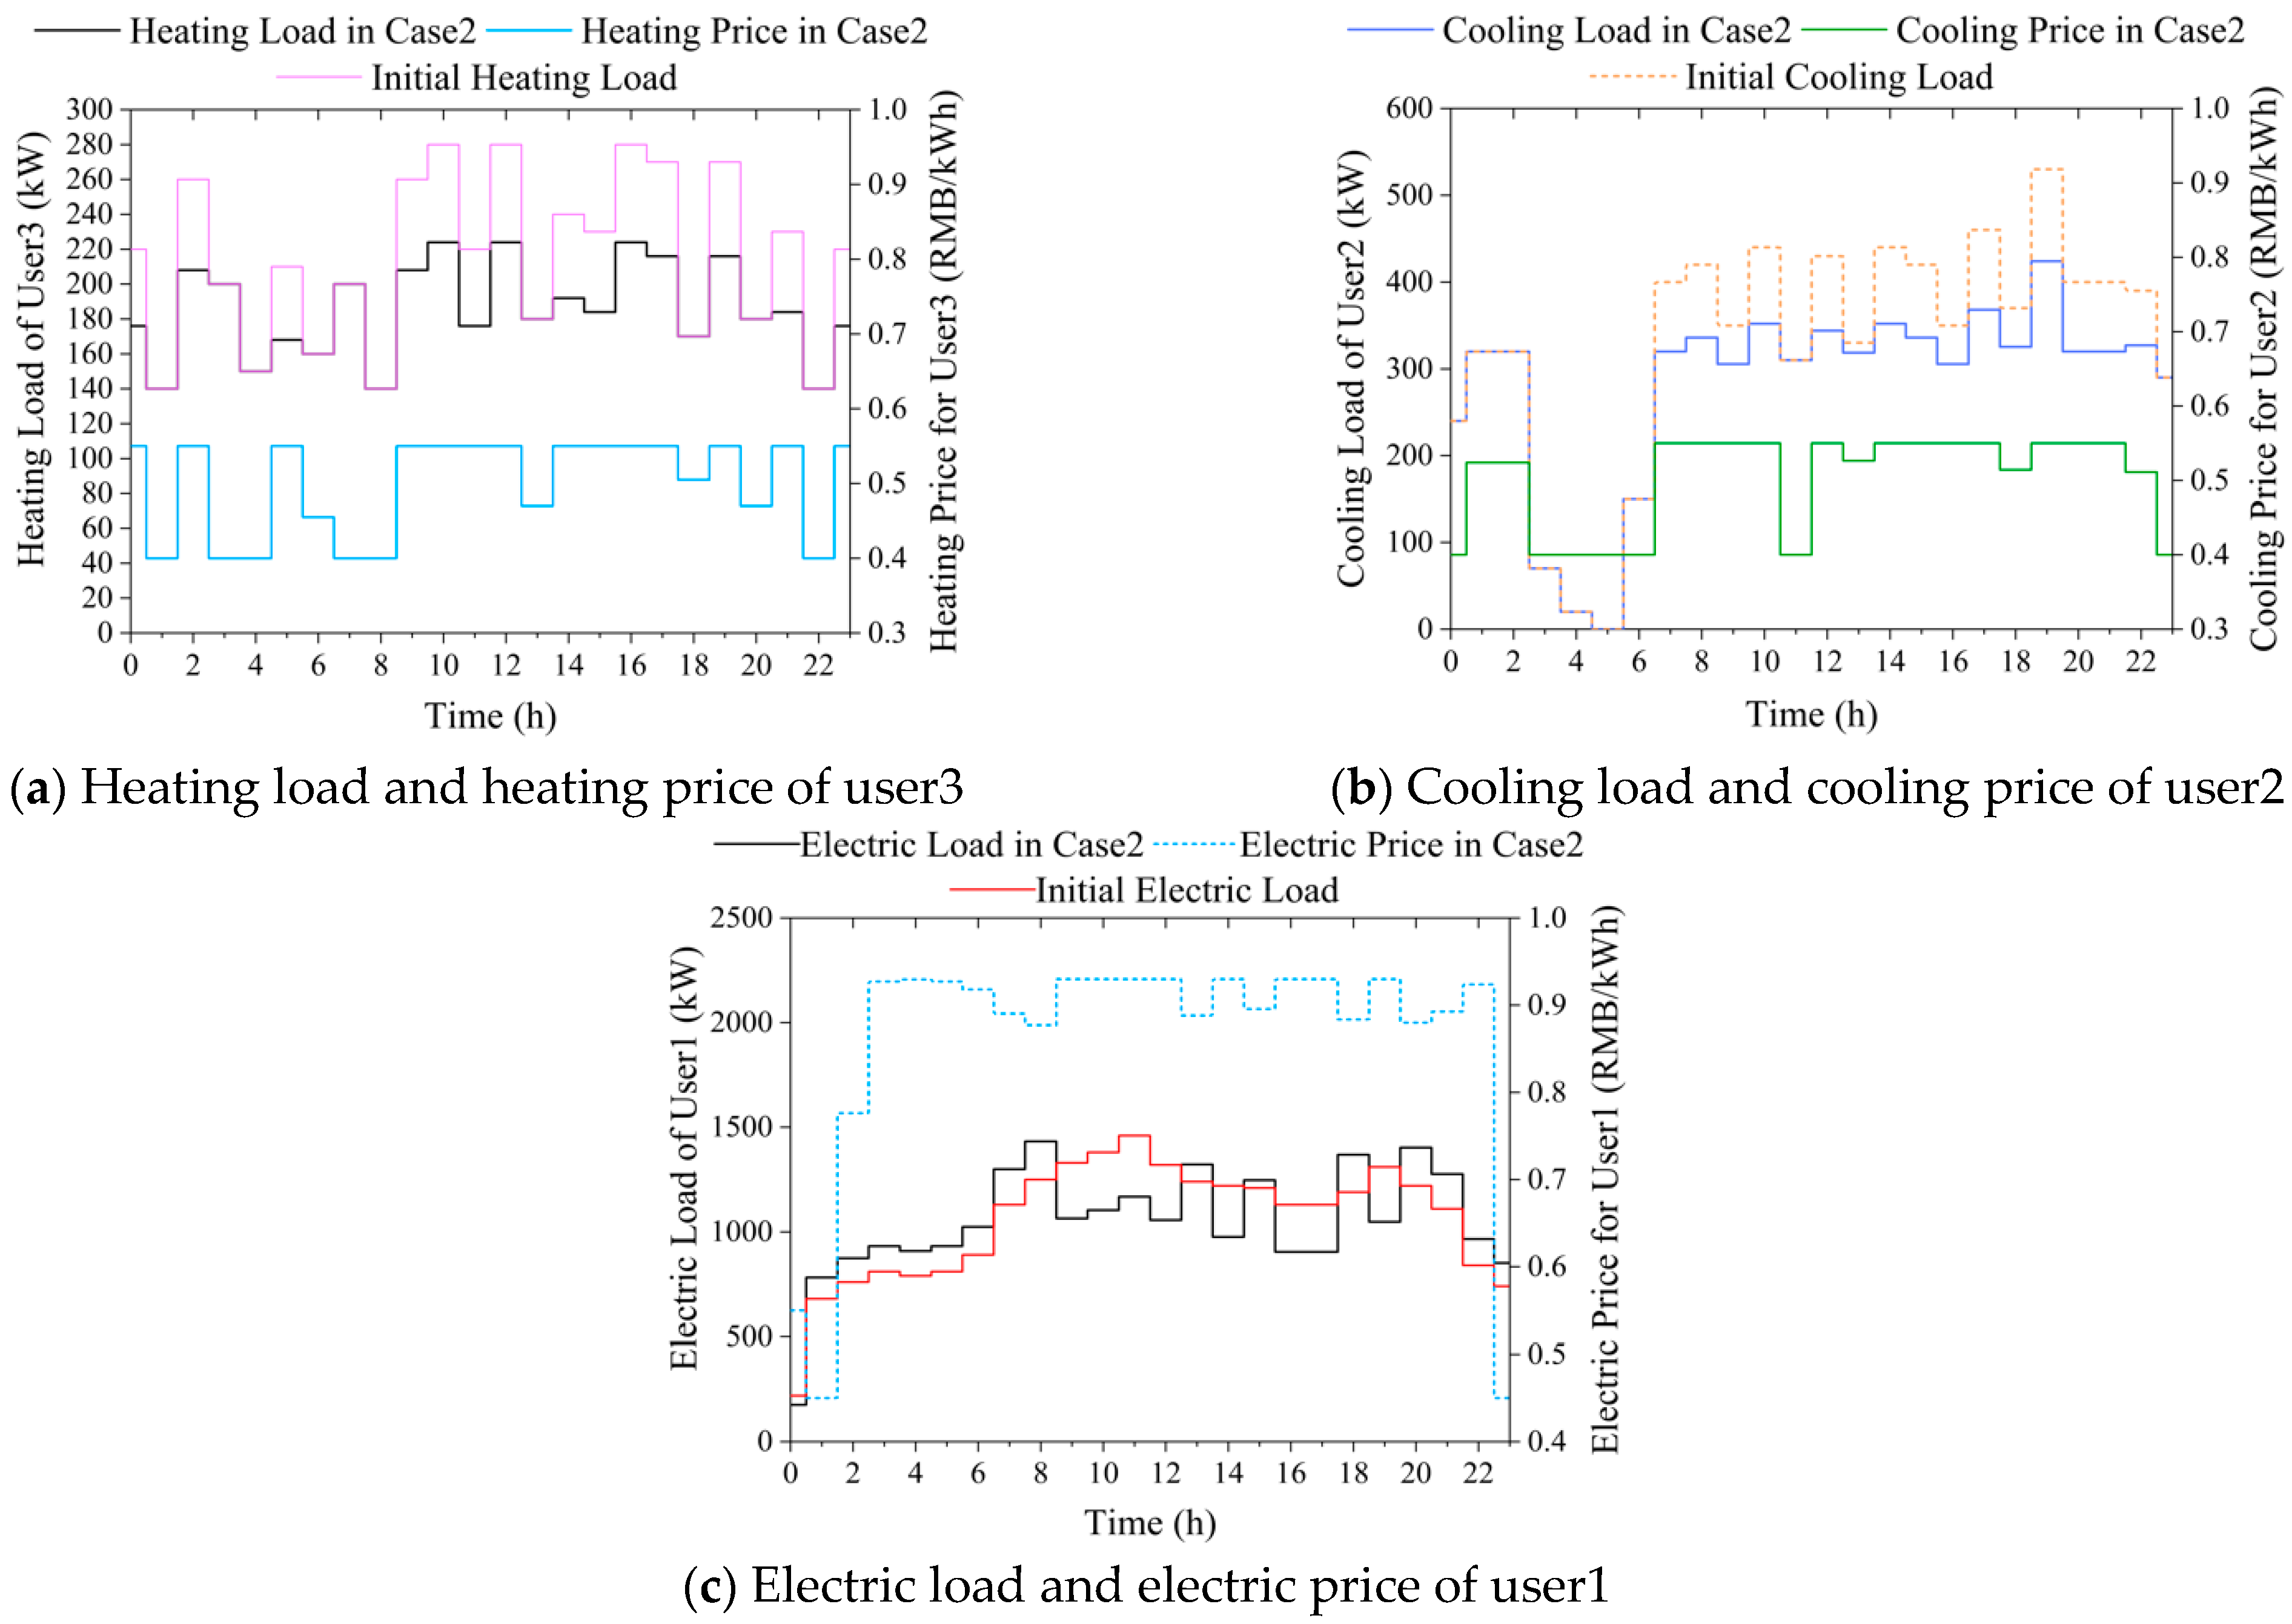
5.2.2. Winter
6. Conclusions
- (1)
- In order to break the pricing monopoly of energy operator, demand-side interests are considered. Additionally, different energy transaction prices are formulated according to different user characteristics, which can guide users to use energy rationally.
- (2)
- In order to obtain the global optimal solution, the KKT condition is used to transform the bilevel optimization model into an equivalent single-level model.
- (3)
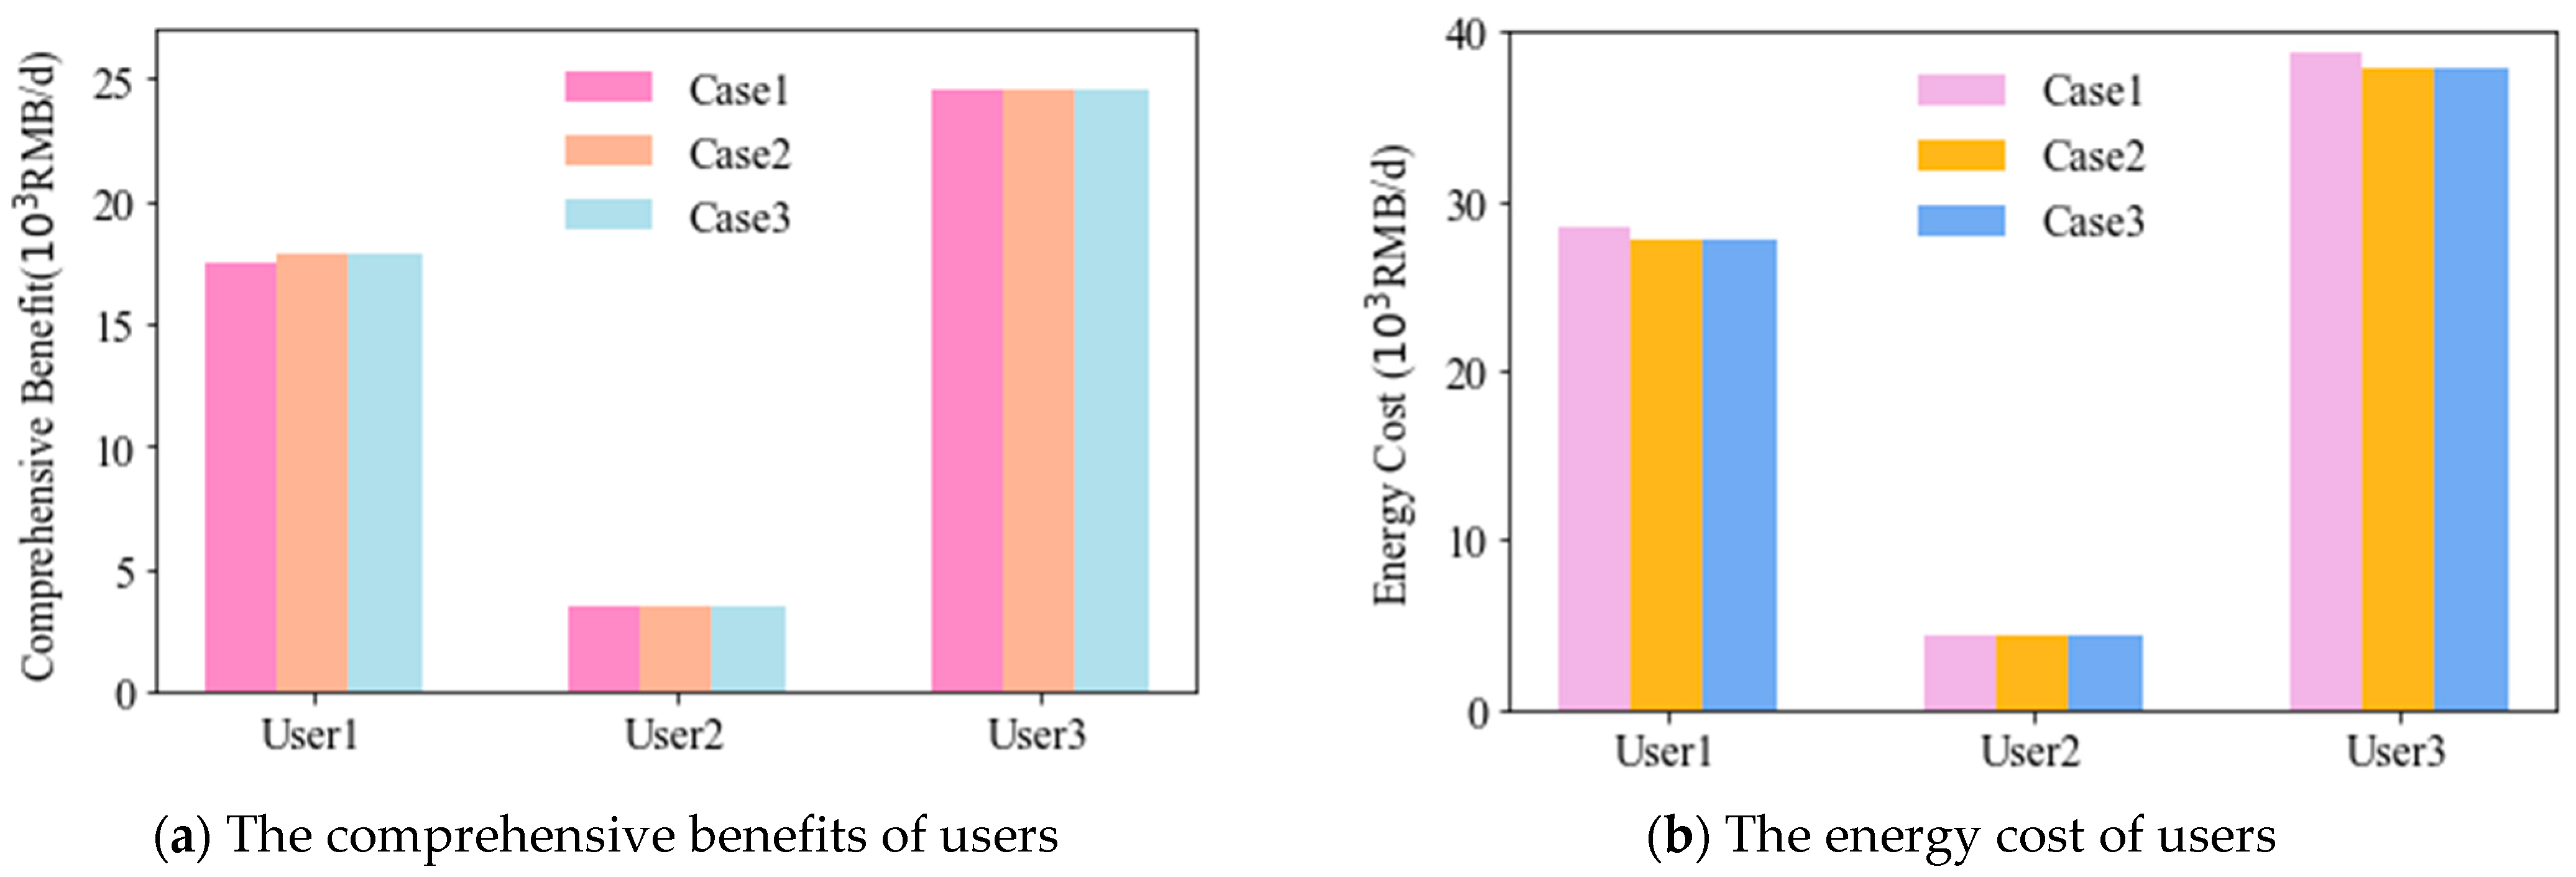
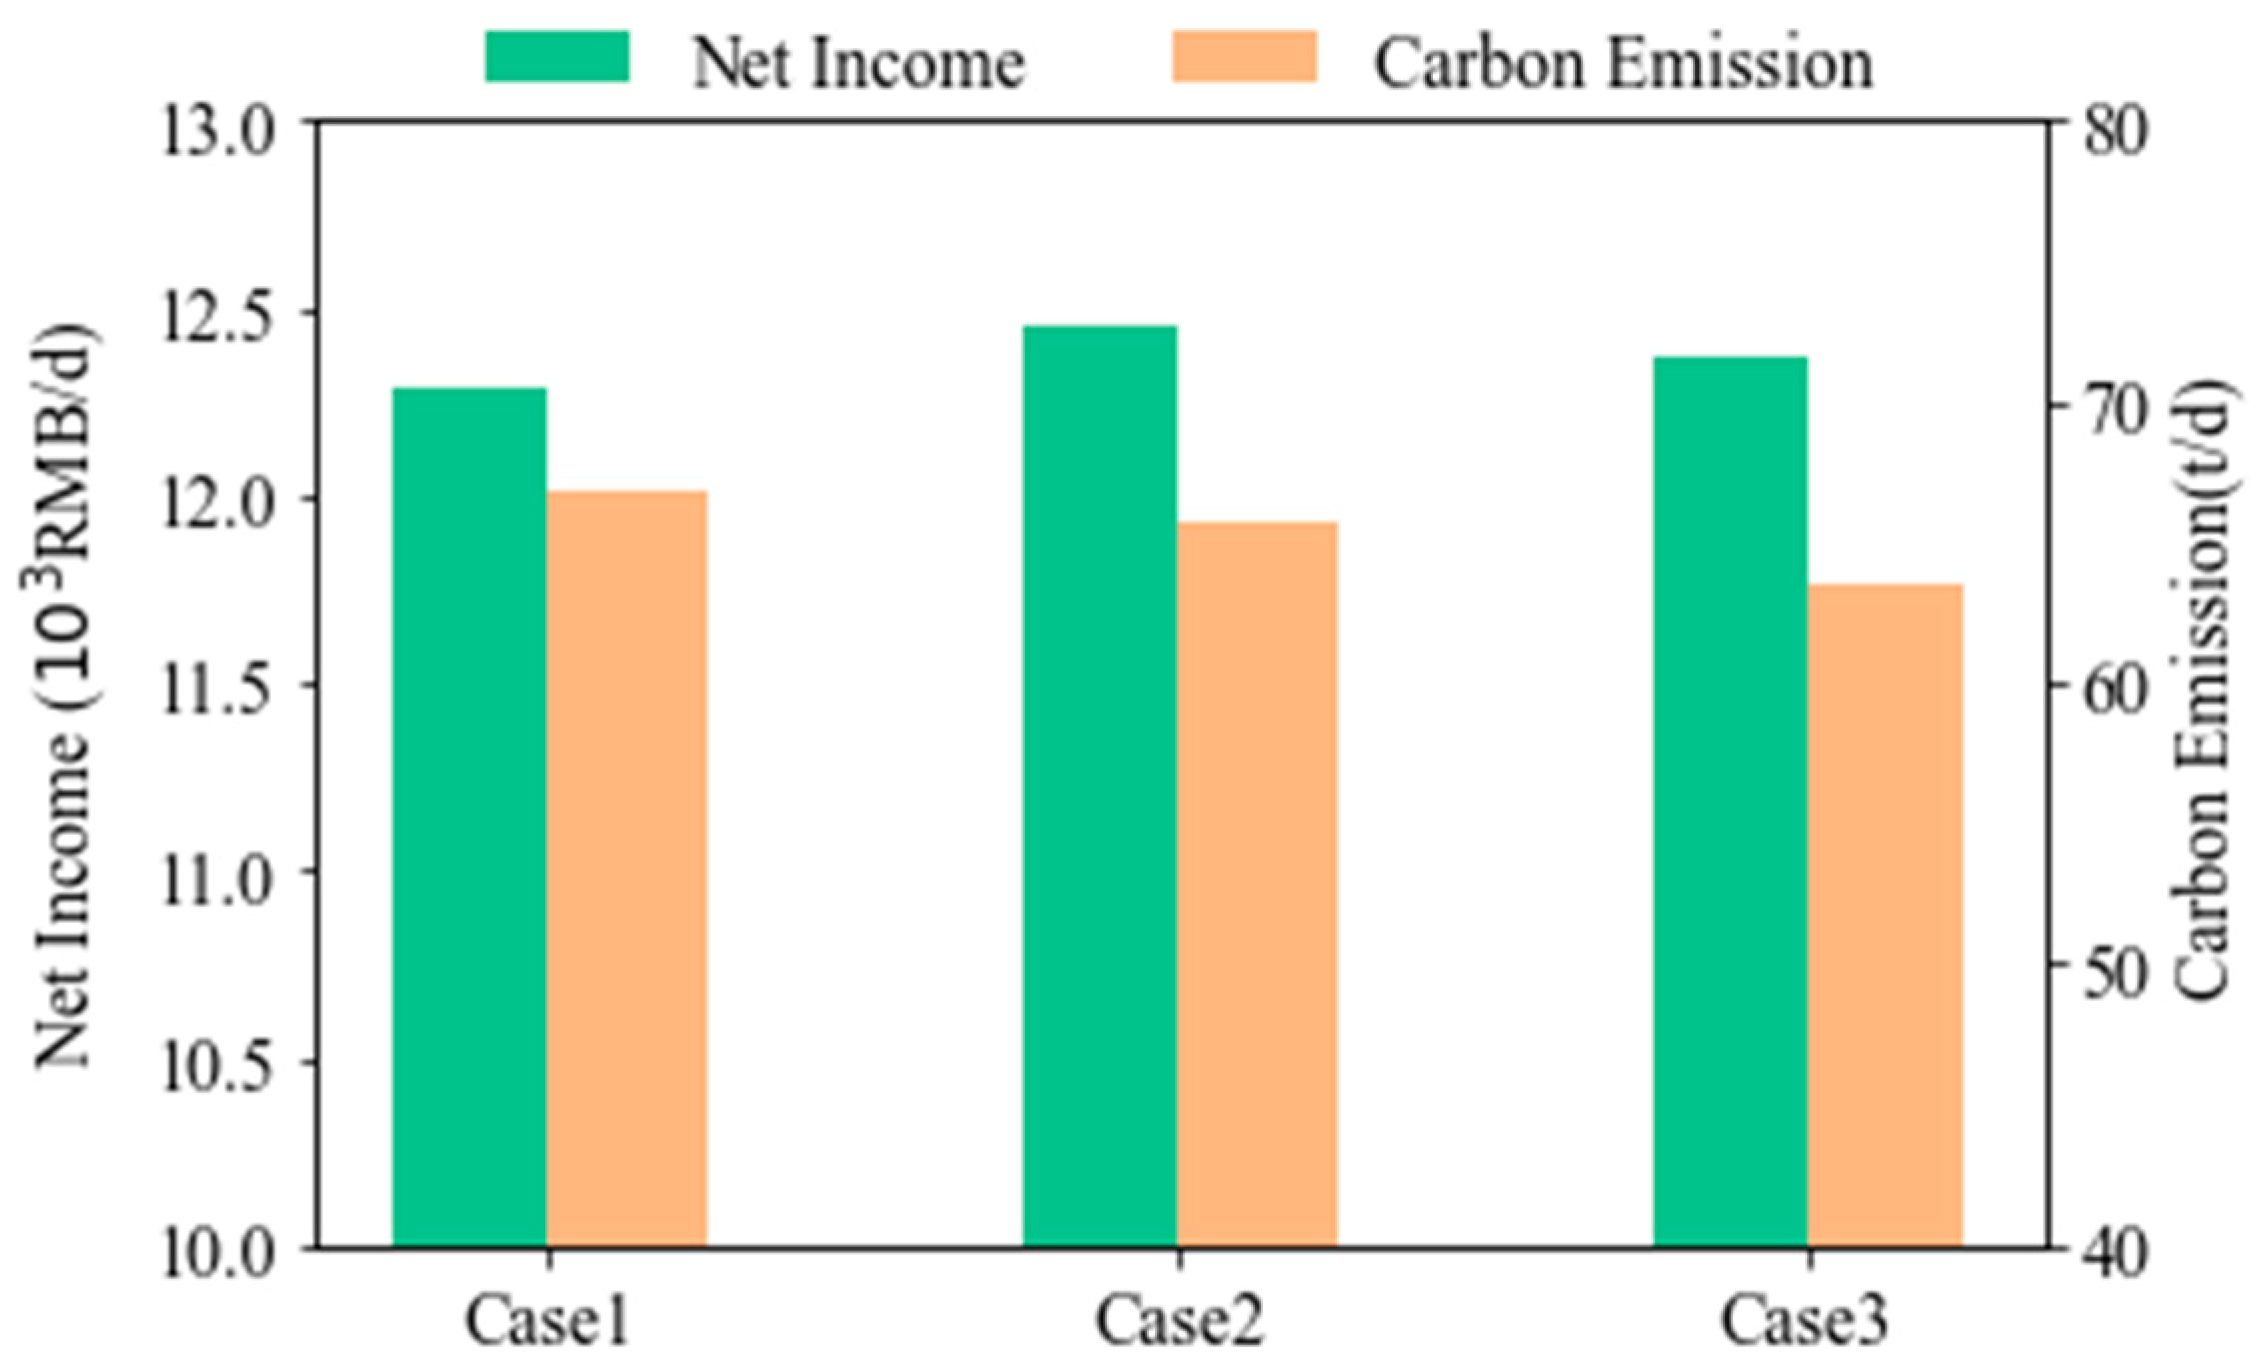
- The simulation results show that the conflict of interests between the supplier and the demanders is mainly reflected in the economic aspect. Additionally, the method proposed can coordinate the economic interests of both parties. Furthermore, compared to the single-objective model, the operator’s multi-objective optimization model can reduce carbon dioxide emissions by 32.96% in summer and 3.2% in winter.
Author Contributions
Funding
Institutional Review Board Statement
Informed Consent Statement
Data Availability Statement
Conflicts of Interest
Appendix A


| Coefficient | Value | Coefficient | Value |
|---|---|---|---|
| 1.1 | 1.5 | ||
| 0.0035 (Summer) 0.00145 (Winter) | 0.0035 (Summer) 0.00034 (Winter) | ||
| 0.0001 | 0.001 | ||
| 0.0006 | 0.0018 | ||
| 0.00035 |
| Parameter | Value (RMB/kWh) | Parameter | Value (RMB/kWh) | ||
|---|---|---|---|---|---|
| Summer | Winter | Summer | Winter | ||
| 0.55 | 0.6 | 0.93 | |||
| 0.4 | 0.43 | 0.45 | |||
| 0.5 | 0.5 | 0.85 | |||

| Equipment | Parameter | Equipment | Parameter | ||
|---|---|---|---|---|---|
| ST | 2% | Cen | 90% | ||
| 0.95 | 6329 kW | ||||
| 0.9 | GB | 85% | |||
| 1680 kW | 12,900 kW | ||||
| 100% | HP | 120% | |||
| 10% | 1632 kW | ||||
| 336 | LB | 60% | |||
| 336 | 64.5% | ||||
| G | 35% | 2164 kW | |||
| 45% | 2326 kW | ||||
| 2000 kW | |||||
References
- Nawaz, A.; Hafeez, G.; Khan, I.; Jan, K.U.; Li, H.; Khan, S.A.; Wadud, Z. An Intelligent Integrated Approach for Efficient Demand Side Management with Forecaster and Advanced Metering Infrastructure Frameworks in Smart Grid. IEEE Access 2020, 8, 132551–132581. [Google Scholar] [CrossRef]
- Feng, P.; He, X. Mixed neurodynamic optimization for the operation of multiple energy systems considering economic and environmental aspects. Energy 2021, 232, 120965. [Google Scholar] [CrossRef]
- He, J.; Li, Y.; Li, H.; Tong, H.; Yuan, Z.; Yang, X.; Huang, W. Application of Game Theory in Integrated Energy System Systems: A Review. IEEE Access 2020, 8, 93380–93397. [Google Scholar] [CrossRef]
- Wang, Y.; Ma, Y.; Song, F.; Ma, Y.; Qi, C.; Huang, F.; Xing, J.; Zhang, F. Economic and efficient multi-objective operation optimization of integrated energy system considering electro-thermal demand response. Energy 2020, 205, 118022. [Google Scholar] [CrossRef]
- Wu, H.; Dong, P.; Liu, M. Optimization of Network-Load Interaction with Multi-Time Period Flexible Random Fuzzy Uncertain Demand Response. IEEE Access 2019, 7, 161630–161640. [Google Scholar] [CrossRef]
- Parizy, E.S.; Bahrami, H.R.; Choi, S. A Low Complexity and Secure Demand Response Technique for Peak Load Reduction. IEEE Trans. Smart Grid 2019, 10, 3259–3268. [Google Scholar] [CrossRef]
- Du, Y.; Zheng, N.; Cai, Q.; Li, Y.; Li, Y.; Shi, P. Research on Key Technologies of User Side Integrated Demand Response for Multi-Energy Coordination. In Proceedings of the 2020 IEEE 4th Conference on Energy Internet and Energy System Integration (EI2), Wuhan, China, 30 October–1 November 2020; pp. 2461–2464. [Google Scholar]
- Gan-yun, L.; Bin, C.; De-xiang, J.; Nan, W.; Jun, L.; Guangyu, C. Optimal scheduling of regional integrated energy system considering integrated demand response. CSEE J. Power Energy Syst. 2021, 1–10. [Google Scholar]
- Jia, Q.; Chen, S.; Yan, Z.; Li, Y. Optimal Incentive Strategy in Cloud-Edge Integrated Demand Response Framework for Residential Air Conditioning Loads. IEEE Trans. Cloud Comput. 2021, 1. [Google Scholar] [CrossRef]
- Gu, J.; Bai, K.; Shi, Y. Optimized Operation of Regional Integrated Energy System Based on Multi-agent Master-slave Game Optimization Interaction Mechanism. Power Syst. Technol. 2019, 43, 3119–3134. [Google Scholar]
- Shuai, X.; Wang, X.; Wu, X. Optimal operation of integrated energy microgrid based on leader-follower game and electricity and heat demand response under user-side limited rationality. Electr. Power Autom. Equip. 2021, 41, 25–31. [Google Scholar]
- Xu, Z.; Sun, H.; Guo, Q. Review and Prospect of Integrated Demand Response. Proc. Chin. Soc. Electr. Eng. 2018, 38, 7194–7205. [Google Scholar]
- Cheng, L.; Yu, T. Game-Theoretic Approaches Applied to Transactions in the Open and Ever-Growing Electricity Markets from the Perspective of Power Demand Response: An Overview. IEEE Access 2019, 7, 25727–25762. [Google Scholar] [CrossRef]
- Gao, L.; Ma, L. A Pricing Method for Demand Response Using Game Theory. In Proceedings of the 2021 3rd Asia Energy and Electrical Engineering Symposium (AEEES), Chengdu, China, 26–29 March 2021; pp. 1024–1029. [Google Scholar]
- Ghorbanian, M.; Dolatabadi, S.H.; Siano, P. Game Theory-Based Energy-Management Method Considering Autonomous Demand Response and Distributed Generation Interactions in Smart Distribution Systems. IEEE Syst. J. 2021, 15, 905–914. [Google Scholar] [CrossRef]
- Dashti, Z.A.; Lotfi, M.M.; Mazidi, M. A Non-Cooperative Game Theoretic Model for Energy Pricing in Smart Distribution Networks Including Multiple Microgrids. In Proceedings of the 2019 27th Iranian Conference on Electrical Engineering (ICEE), Yazd, Iran, 30 April–2 May 2019; pp. 808–812. [Google Scholar]
- Oladejo, I.O.; Folly, K.A. Management of Grid-Connected Micro-grid Using Game Theory Approach. In Proceedings of the 2019 Southern African Universities Power Engineering Conference/Robotics and Mechatronics/Pattern Recognition Association of South Africa (SAUPEC/RobMech/PRASA), Bloemfontein, South Africa, 28–30 January 2019; pp. 1–6. [Google Scholar]
- Cheng, L.; Yin, L.; Wang, J.; Shen, T.; Chen, Y.; Liu, G.; Yu, T. Behavioral decision-making in power demand-side response management: A multi-population evolutionary game dynamics perspective. Int. J. Electr. Power Energy Syst. 2021, 129, 106743. [Google Scholar] [CrossRef]
- Lang, Y. Study on Price Mechanism of Multi Energy System Considering Interaction Between Source and Load. Master’s Thesis, Southeast University, Nanjing, China, 2018. [Google Scholar]
- Zhao, X.; Hua, G. Research on two-stage supply chain to establish the carbon emissions trading alliance. In Proceedings of the 2015 International Conference on Logistics, Informatics and Service Sciences (LISS), Barcelona, Spain, 27–29 July 2015; pp. 1–5. [Google Scholar]
- He, Y.-T.; Tang, Z.-G. Analysis on the Impact of China’s Foreign Trade Pattern in the process of the Reduction of Carbon Emission Intensity in China. In Proceedings of the 2020 16th International Conference on Computational Intelligence and Security (CIS), Guangxi, China, 27–30 November 2020; pp. 179–185. [Google Scholar]
- Cheng, Y.; Zhang, N.; Zhang, B.; Kang, C.; Xi, W.; Feng, M. Low-Carbon Operation of Multiple Energy Systems Based on Energy-Carbon Integrated Prices. IEEE Trans. Smart Grid 2020, 11, 1307–1318. [Google Scholar] [CrossRef]
- Wang, Z.; Li, X.; Li, Y.; Zhao, T.; Xia, X.; Zhang, H. An Optimization Framework for Low-Carbon Oriented Integrated Energy System Management in Commercial Building under Electric Vehicle Demand Response. Processes 2021, 9, 1737. [Google Scholar] [CrossRef]
- Xiang, Y.; Cai, H.; Gu, C.; Shen, X. Cost-benefit analysis of integrated energy system planning considering demand response. Energy 2020, 192, 116632. [Google Scholar] [CrossRef]
- Massrur, H.R.; Niknam, T.; Fotuhi-Firuzabad, M.; Nikoobakht, A. Hourly electricity and heat Demand Response in the OEF of the integrated electricity-heat-natural gas system. IET Renew. Power Gener. 2019, 13, 2853–2863. [Google Scholar] [CrossRef]
- Li, D.; Shi, K.; Zhou, X.; Wu, Y.; Yao, L.; Liao, S. Optimal Dispatch of Integrated Energy System Considering Source-Load-Storage Interaction. In Proceedings of the 2021 3rd Asia Energy and Electrical Engineering Symposium (AEEES), Chengdu, China, 26–29 March 2021; pp. 1165–1169. [Google Scholar]
- Zhou, J.; Wang, C.; Xiao, X.; Zhou, D.; Fan, Y.; Wang, L. Optimal Modeling of Integrated Energy Demand Response under Time-Shared Electricity Price. In Proceedings of the 2020 15th IEEE Conference on Industrial Electronics and Applications (ICIEA), Kristiansand, Norway, 9–13 November 2020; pp. 1214–1219. [Google Scholar]
- Wang, S.; Yin, S.; Bai, H.; Chen, X.; Jin, M.; Yan, J.; Zhang, P. Introduction and Efficiency Evaluation of Multi-storage Regional Integrated Energy System Considering Optimal Operation Integrated Demand Side Response. IOP Conf. Ser. Earth Environ. Sci. 2021, 631, 012109. [Google Scholar] [CrossRef]
- Jiang, P.; Dong, J.; Huang, H. Optimal integrated demand response scheduling in regional integrated energy system with concentrating solar power. Appl. Therm. Eng. 2020, 166, 114754. [Google Scholar] [CrossRef]
- Zhou, C.; Ma, X.; Guo, X.; Lei, J. Leader-Follower Game Based Optimized Operation Method for Interaction of Integrated Energy System in Industrial Park. J. Autom. Electr. Power Syst. 2019, 43, 74–80. [Google Scholar]
- Yang, Z.; Ni, M.; Liu, H. Pricing Strategy of Multi-Energy Provider Considering Integrated Demand Response. IEEE Access 2020, 8, 149041–149051. [Google Scholar] [CrossRef]
- Liu, X.; Gao, H.; Zhang, W.; Yang, F. Co-Simulation of P2P Power Trading Platform and Distribution Network Based on Blockchain Technology. Comput. Syst. Appl. 2021, 30, 54–61. [Google Scholar]
- Wu, X. Research on Energy Management Methods for Household and Community. Master’s Thesis, Hunan University, Changsha, China, 2019. [Google Scholar]
- Zhang, X.; Li, H.; Liu, L.; Bai, C.; Wang, S.; Song, Q.; Zeng, J.; Liu, X.; Zhang, G. Optimization analysis of a novel combined heating and power system based on biomass partial gasification and ground source heat pump. Energy Convers. Manag. 2018, 163, 355–370. [Google Scholar] [CrossRef]
- Bozchalui, M.C.; Sharma, R. Optimal operation of commercial building microgrids using multi-objective optimization to achieve emissions and efficiency targets. In Proceedings of the 2012 IEEE Power and Energy Society General Meeting, San Diego, CA, USA, 22–26 July 2012; pp. 1–8. [Google Scholar]
- Wang, Z.-G.; Liu, J.-Z.; Tan, W.; Yang, G.-J. Multi-objective Optimal Load Distribution Based on Speediness and Economy in Power Plants. Proc. Chin. Soc. Electr. Eng. 2006, 26, 86–92. [Google Scholar]
- Long, J.; Zheng, B.; Guo, X.; Li, Y. Interactive multi-objective optimization of environmental and economic power generation scheduling. Electr. Power Autom. Equip. 2013, 33, 83–88. [Google Scholar]
- He, C.; Li, D. Multi-objective Operation Mode Optimization of Medium Voltage Distribution Networks based on Improved Binary Particle Swarm Optimization. In Proceedings of the 2019 4th International Conference on Intelligent Green Building and Smart Grid (IGBSG), Yichang, China, 6–9 September 2019; pp. 639–644. [Google Scholar]
- Wang, C.; Chen, S.; Mei, S.; Chen, R.; Yu, H. Optimal Scheduling for Integrated Energy System Considering Scheduling Elasticity of Electric and Thermal Loads. IEEE Access 2020, 8, 202933–202945. [Google Scholar] [CrossRef]
- Wang, H.; Li, K.; Zhang, C.; Ma, X. Distributed Coordinative Optimal Operation of Community Integrated Energy System Based on Stackelberg Game. Proc. Chin. Soc. Electr. Eng. 2020, 40, 5435–5445. [Google Scholar]
- Wei, F.; Jing, Z.X.; Wu, P.Z.; Wu, Q.H. A Stackelberg game approach for multiple energies trading in integrated energy systems. Appl. Energy 2017, 200, 315–329. [Google Scholar] [CrossRef]
- Wu, L.; Jing, Z.; Wu, Q.; Deng, S. Equilibrium Strategies for Integrated Energy Systems Based on Stackelberg Game Model. Autom. Electr. Power Syst. 2018, 42, 142–150. [Google Scholar]
- Li, Y.; Wang, C.; Li, G.; Chen, C. Optimal scheduling of integrated demand response-enabled integrated energy systems with uncertain renewable generations: A Stackelberg game approach. Energy Convers. Manag. 2021, 235, 113996. [Google Scholar] [CrossRef]


Publisher’s Note: MDPI stays neutral with regard to jurisdictional claims in published maps and institutional affiliations. |
© 2022 by the authors. Licensee MDPI, Basel, Switzerland. This article is an open access article distributed under the terms and conditions of the Creative Commons Attribution (CC BY) license (https://creativecommons.org/licenses/by/4.0/).
Share and Cite
Wei, M.; Deng, Y.; Long, M.; Wang, Y.; Li, Y. Transaction Model Based on Stackelberg Game Method for Balancing Supply and Demand Sides of Multi-Energy Microgrid. Energies 2022, 15, 1362. https://doi.org/10.3390/en15041362
Wei M, Deng Y, Long M, Wang Y, Li Y. Transaction Model Based on Stackelberg Game Method for Balancing Supply and Demand Sides of Multi-Energy Microgrid. Energies. 2022; 15(4):1362. https://doi.org/10.3390/en15041362
Chicago/Turabian StyleWei, Meifang, Youyue Deng, Min Long, Yahui Wang, and Yong Li. 2022. "Transaction Model Based on Stackelberg Game Method for Balancing Supply and Demand Sides of Multi-Energy Microgrid" Energies 15, no. 4: 1362. https://doi.org/10.3390/en15041362