Article

Survey-Based Assessment of the Preferences in Residential Demand Response on the Island of Mayotte

by
Nikolas Schöne
1,*,
Kathrin Greilmeier
1 and
Boris Heinz
1,2
1
Community Energy and Adaptation to Climate Change, Technical University Berlin, Ackerstr. 76, 13355 Berlin, Germany
2
Hudara gGmbH, Rollbergstr. 26, 12053 Berlin, Germany
*
Author to whom correspondence should be addressed.
Energies 2022, 15(4), 1338; https://doi.org/10.3390/en15041338
Submission received: 17 January 2022 / Revised: 4 February 2022 / Accepted: 8 February 2022 / Published: 12 February 2022
(This article belongs to the Topic Electricity Demand-Side Management)

Abstract

:
As on many other European islands, the energy system of Mayotte suffers from low reliability of supply, low share of renewable energies, and high costs of supply. Residential Demand Response (DR) schemes can significantly increase the flexibility of the inherent weak power grid, increasing the potential for renewable energy integration. Given that active involvement of the population is required to unlock the potential of DR, pre-assessing the population’s preferences in DR is vital to tailor favorable schemes and assure long-term uptake of the solution. As a fundamental study, this paper assesses the population’s preferences on direct load control (DLC), electricity tariffs, major motivation, and remuneration goods by processing findings from a survey of 146 residents on Mayotte. Advanced k-means cluster analysis, multinomial logistic regression, one-way analysis of variance, and Chi-square tests were applied to the survey responses to identify socio-demographic influencers. The results indicate four distinct groups of people concerning their interest in DR schemes, with increasing age being a significant predictor for higher interest. Interest in DLC varies with the device/appliance controlled and socio-demographic characteristics. The preferred tariffs correspond to the results of previous literature. Financial incentives play a subordinate role in the main motivation for participation compared to social and environmental attractions as well as non-monetary remuneration goods, supporting the impression of a high sense of community and suitability of islands as laboratories for energy innovations. Follow-up studies must reflect on the ability/willingness to pay as well as the current state of awareness and knowledge of electricity supply to validate speculations on underlying reasons for DR preferences and flag constraints for the DR scheme implementation.

1. Introduction

1.1. Background and Motivation

In the strive for carbon emission neutrality to be reached by 2050 within the European Union (EU) [1], European islands and their inhabitants take a special seat at the discussion table—being both most vulnerable in terms of energy access at reasonable costs [2], but simultaneously recognized as a favorable place for innovation [3] due to high costs of energy and a strong sense of community/collective action [4]. Despite increasing recognition in research and European funding schemes, many European islands still lag behind in the efforts of the energy transition, as the associated challenges are greater compared to their affiliated inland counterparts [5].
Due to the geographical isolation, limited space, and lack of fossil resources, islands traditionally rely on the import of fuels for power supply [6]. The isolation and dependence on a few price-dominant fuel suppliers can lead to a lock-in of low energy market liquidity and carbon-intensive power supply, jeopardizing the overall island economy [5]. As Ioannidis et al. present in a detailed study involving 44 global islands, island energy systems are specifically vulnerable in terms of (1) availability, (2) accessibility, (3) affordability, and (4) acceptability of energy supply [5].
Ironically, most islands are blessed with a great potential of various renewable energy sources, such as the potential for solar power, hydropower, wind power, or biomass [7]. However, most island systems cannot exploit their renewable energy potential, due to their poor grid infrastructure [6,8]. Limited transmission network extension hinders the inherent possibility to balance fluctuations of power feed-in from renewable energies [6]. To overcome this shortage, additional flexibility options counteracting the variable supply are of vital importance to assure a stable supply of electricity [6]. Such flexibility options include electricity storage, sector coupling, and demand-side management (DSM) [6,9]. While early DSM schemes, invented in the 1970s for peak and load shedding to reduce peak capacity requirements, were developed on a low level of automation, recent programs of the third generation build on the backbones of Smart Grids (SGs), using two-way communications and intelligent load management to exchange physical grid status and market signals with the end-users in almost real-time [10]. Such programs, which aim for short-term effects on timescales close to power and load reduction delivery, are referred to as demand response (DR) schemes [10]. For a detailed overview of different DR schemes, see Albadi and El-Saadany [11].
Simultaneously to technical transformation, an energy transition is interlinked with a social transformation of the population. Whether users act individually or in collective property, Schot et al. show their decisive role in “initiating, accelerating and stabilizing transitions” and ensuring the sustainability of developed solutions [12]. In doing so, the authors prefer the term “user” to “consumer” to emphasize that involvement goes beyond awareness and aims at active participation and conscious decisions. More than that, it is widely known that even the best performing technologies and whole transitions tend to fail when not being adopted and supported by the population. Addressing this crucial involvement of local communities, the European Commission in various call for tenders calls to put the user at the center of energy system transitions and to integrate the population as a central part of the energy market.
Residential DR schemes are by their technical nature a bridge and enabler for involving the population in the energy system transformation, and simultaneously address the great challenge of offering flexibility to the grid. The social involvement of DR in comparison to other flexibility services is much greater—which we argue can not only be a threat to its actual techno-economic success and grid relief but even potentially change the mindset of the population towards the whole energy transition thereby increasing the momentum for further actions of transition. The DR user—depending on the level of automation of the scheme—will be confronted with his/her electricity consumption behavior, linked to the topic of energy transition and climate change in general, daily. As Christensen et al. for example report from a case study in Norway, DR participants report to be more sensitive to weather forecasts and other issues related to climate [13]. Such a closer link to nature, we argue, can potentially have an (in)direct impact on encouraging the user to have a positive attitude and increase involvement in climate change mitigation and the energy transition (snowball effect).
However, previous literature clearly shows the crucial importance of designing the DR scheme in the most desirable shape for the user, to sustainably attract the user to the scheme and unlock its potential flexibility offer to the power grid. Consequently, it is common to assess critical social factors of acceptance in potential use cases of residential DR, before proceeding with technical scheme design. Prominent social issues discussed in previous literature are:
  • Balance between loss of control and gain of comfort in direct load control (DLC) schemes: DLC refers to a DR scheme, in which electrical household appliances/devices—popular examples being water heaters, air conditioners (ACs), and electric heaters—are remotely controlled by the respective scheme provider in direction of the desired load shift, rewarded with a predefined remuneration [14]. DLC programs have gained greater attention due to their advantages of accurateness of estimate in flexible load and ease of reducing peak loads [14]. However, as participants in DLC programs give up some control over a household appliance or device, a common barrier towards participation in such schemes is the sense of losing control, even though gaining comfort through avoided actions [15]. Dütschke et al. [16] validate findings from a survey in a real laboratory test, finding participants to prefer preferred automatic DR to manual changes of electricity consumption [16]. Paetz et al. [17] come to the same conclusion, striking out the value of intelligent control systems to save time and maintain comfort [17]. Fell et al. [15] take up the link of such technologies to ease of use. Users frequently being absent from their homes might be attracted by automatic control schemes [18]. However, evidence on perceived drawbacks is also abundant. The installation of new technologies may deter from signing up for a DLC program [19,20], as may associated costs [21], space requirements [22], or installation itself [22,23]. Many of the abovementioned work points back to the popular information deficit model [24], which implies that lacking visibility of the current electricity price may lead to a loss of awareness over personal energy consumption behavior—and vice versa.
  • Devices/appliances applicable for DR schemes: The acceptance of DLC may vary with the type of device/appliance included in the scheme [25]. A prominent assumption states that such devices/appliances are preferably shifted, to which the least routines are bound to [13]. The assumption can be confirmed by evidence found in literature. Yilmaz et al. found from a survey amongst 622 households in Switzerland, that participants most likely agree with heat pumps, boilers battery and PV to be controlled remotely, while dishwasher and washing machine shows low acceptance [26]. Ghanem et al. present evidence from a similar survey on the islands of La Graciosa (Spain), San Pietro (Italy), Aran Islands (Ireland), which indicate the washing machine, PV and battery to be largely accepted for DLC programs, while responses to EV were strikingly heterogeneous [4]. Shifting demand from wet goods, however, in some case studies raise concerns regarding noise, quality of laundry, and safety [21,27,28]. However, as with associated routines the acceptance of DLC for certain devices/appliances may vary according to the socio-demographic background of the respondents [26,28]. Particularly important in the considered setting of the present study, Xu et al. distinguish between DLC programs for AC to be remotely curtailed or switched-on (switch program), and AC to be controlled in a temperature range. Noticeably, the automatic switch program was significantly more preferred in a survey conducted in California [14]. The option to override the contract was indicated as more convincing to participate in the scheme than monetary compensation [14]. The idea of temperature range control is supported by Alimohammadisagvand for the northern hemisphere, who suggests controlled heat pumps to adjust the temperature range of residential heating in Finland [29] to minimize electricity costs [30].
  • The issue of trust: Issues of trust can arise from technical issues in the associated technologies [31], lack of transparency in the DR scheme [27,31], the function of the overall energy market [32], or concerns about the entity providing the scheme [17,25]. Noticeably, this issue may be difficult to transfer to island systems, considering the often vertically integrated structure of utilities and small scale of the system.
  • Tariff design: As a bounding bridge between technology, economics, and acceptance of DR schemes, designing attractive tariffs is crucial for the uptake of DR schemes [33]. Previous work has assessed the preference for different tariffs. An extensive overview of studies analyzing the acceptance of time-of-use tariffs can be found in Nicolson et al. [33]. Dynamic tariffs—mostly due to the high perceived involvement of the user—turn out to be less favored [15,26,34]. In addition, power tariffs experience low support [26,33]. Bonus tariffs in contrast are shown to be more interesting to survey participants in Yilmaz et al. [26]. The interest in tariffs, however, might be influenced by the socio-demographic background of the sample population [26]. Even though anticipated interest in tariffs may be high in most analyses, the actual change of consumer behavior and consumption in response to price signals varies across previous studies. The authors of [35,36,37,38] show evidence that demonstrates a permanent change in consumption patterns of users. However, many researchers argue DLC programs allow for a more reliable shift in consumption patterns, reducing uncertainty for the grid operator [25,39,40].
  • Consumer motivations for demand response: Analysis addressing why residential electricity customers might choose to participate in DR schemes has identified numerous motivations, with financial and environmental benefits being the most prominent ones [14,19,27,32]. The actual purpose behind it—that is to increase electricity system reliability—has been found to be additional motivation [22], however, with high heterogeneity [4]. Noticeably, [41] find social benefits as another dimension of motivation, i.e., the pride of discussing participation with neighbors or being a role model for children. The major motivation might be closely linked to the question of preferred remuneration. While monetary remuneration is common practice, alternative remuneration schemes such as coupons have been proposed by researchers [42].

1.2. Research Contribution and Ambition

In our observed case of islands, energy systems are at the beginning of their transition towards a high share of renewable energies. A successful implementation of DR schemes, encouraging the population to promote the energy transition at its very beginning, could accelerate the whole transformation towards a low-emission energy system. Consequently, it is crucial to detect how to best implement DR schemes on island systems, respecting all the technical, economic, and social dimensions [43]. Such a holistic assessment is conducted in the MAESHA project, which aims at demonstrating how to decarbonize the energy systems of geographical islands on a case study of Mayotte. While studies on the social perception of DR on islands are scarce, evidence and reliable studies on Mayotte are absent. As Mayotte in its history, geographic location, socio-economic conditions, and the political setting is a noticeable outlier in the group of European islands, a transfer of findings from previous literature is questionable. As an initial study to assess the potential design and suitability of residential DR on Mayotte, this paper will therefore present findings from a survey conducted in Mayotte addressing key topics from prominent literature. The major objectives of the analysis performed are:
  • To evaluate the overall interest in residential DR participation;
  • To identify key drivers/main motivation for the participation in residential DR schemes;
  • To discover how socio-demographics influence the key drivers for participation and preferences in compensation/remuneration;
  • To identify distinct DR preferences (acceptance of DLC of individual electrical devices and appliances, interest in tariffs);
  • To identify socio-demographic predictors for preferences in DLC and electricity tariffs;
  • To explore the effect of overriding DR contracts on the willingness to participate.
The paper is structured as follows: Section 2.1 will introduce the case study of Mayotte, highlighting differences to other European settings. Section 2.2 presents the survey design and methodology applied in statistical analysis. Results are described in Section 3, and discussed and compared to literature in Section 4. The paper summarizes the findings, concludes, and recommends future work promoting residential DR on Mayotte.

2. Materials and Methods

2.1. Case Study of Mayotte

Mayotte is a French overseas department located in the Indian Ocean between Madagascar and the coast of Mozambique. The department is composed of two inhabited islands, Grande Terre and Petite Terre. As of today, 300,000 people are officially registered on Mayotte, while another 200,000 are assumed to live on the island as not registered. Within the population registered officially, the unemployment rate is 35%, compared to an average of about 9% in France at the same time. A staggering 70–84% of the people live below the poverty line. Overall gross domestic product (GDP) per capita of the island is USD 13,000, which is half of the GDP of the neighboring island of La Réunion. Opposed to these figures, young people—notably estimates state that half of the population is younger than 18 old—face significant (economic) challenges in near future.
The geographical location offers a great potential for renewable energies, especially solar PV (1850 kWh/m2 global horizontal irradiation) [44]. Due to restricted land availability as conflicting usage, wind energy potential is limited, but offshore wind could be a realistic exploitable resource, as well as ocean energy. However, current electricity production is based on 95% diesel generators supplied by two power plants (Longoni and Badamiers). Both power plants are owned by the vertically operating supply and distribution company Electricité de Mayotte (EDM). The remaining 5% of electricity supply is generated by PV plants (23 MWp with a 4% annual growth rate).
The power grid of Mayotte is subdivided into high voltage (90 kV), medium voltage (20 kV), and low voltage (230 V) lines. The grid does not yet conform to European standards, offering low redundancy and low visibility on grid status. Supply interruptions on feeder sections occur frequently. In 2020 the local grid operator reported a total of 1943 minutes of “criterion B”, which is defined as an interruption for any reason (including maintenance) in medium voltage that lasts longer than three minutes. Large-scale integration of renewable energies, as envisaged in the Progammation Pluriannuelle de l’ Energie detailing the medium- and long-term energy strategy of Mayotte, conclusively opposes significant challenges. Flexibility services, which may counteract the volatile character of renewable energies and reduce bottlenecks, are a crucial contribution to future energy system development. The MAESHA project aims to develop a flexibility management trading platform capable of coordinating various flexibility services embedded in a market scheme. As one pillar of these flexibility services, the residential Demand Response must be explored, under which activities this study has been carried out [45].

2.2. Survey

As the success of residential DR schemes is known to be highly sensitive to the context and preferences of the local population [43], it is vital to harness opinions, preferences, and perceptions of the local population to later tailor the respective DR scheme as close as possible to the mindset of the community. Therefore, our study includes a survey aiming to capture such preferences of the community regarding DR on the specific case of Mayotte. The survey thereby specifically addresses factors influencing user’s perceptions detected in previous literature. These factors can be translated into research questions to be answered via survey. Table 1 presents the research questions, corresponding original questions of the survey addressing the research questions, and answer options presented to the respondents (notably, the respondents had the option to skip any of the questions). Each following question is discussed in the Results section, while including socio-demographic and dwelling characteristics of the respondents, to detect patterns among the society.
The survey was carried out in the villages of Mamoudzou, Dembeli, and Kani-Keni in September 2021 amongst randomly selected household members. The survey participants were chosen by a local subcontractor, who went door to door in the three villages on both weekdays and weekends between 9 a.m. and approximately 6 p.m. The local subcontractor was trained on relevant residential DR schemes and the background of the survey, which was presented orally to the participants at the beginning of the survey. The survey participants were asked to address any questions arising during the briefing and to finally indicate that they have understood the purpose, basic function, and potential implications of DR before starting with the questionnaire. The questionnaire was initially developed in English and translated into French, and if required into the local Shimaore dialect by the subcontractor. The data were collected via smartphone, to directly have the digital data transferred and available for cross-checking for a representative sample group —i.e., showing similar frequencies of socio-demographic variables to average on Mayotte –and valid answers. For each question, participants had the option of omitting it, or re-addressing questions of understanding to the subcontractor, so that answered questions are recognized as valid. A total of 146 people completed the survey with no missing information. The respondents were able to leave an anonymized code if desired to be contacted in succession to the survey.

2.2.1. Independent Variables

The responses from the survey are expected to be influenced by independent variables representing the respondent and are used as predictors/grouping variables in later analysis. These independent variables included in the analysis are grouped into socio-demographic variables (age, gender, employment status, area of residence, household size, presence of children in the household, average monthly electricity expenditure, average monthly household income) and dwelling characteristics (tenure type, dwelling type). Table 2 includes the independent variables and frequencies of responses. In addition, the table holds the share of appliance/device owners.
Additionally, the analysis tests in which regard the option to override a DR contract influences the willingness to participate in a DR scheme.

2.2.2. Dependent Variables

The independent individual variables are expected to predict the affinity to certain behavior/perception to DR, such of which accordingly are classified as dependent variables. These are
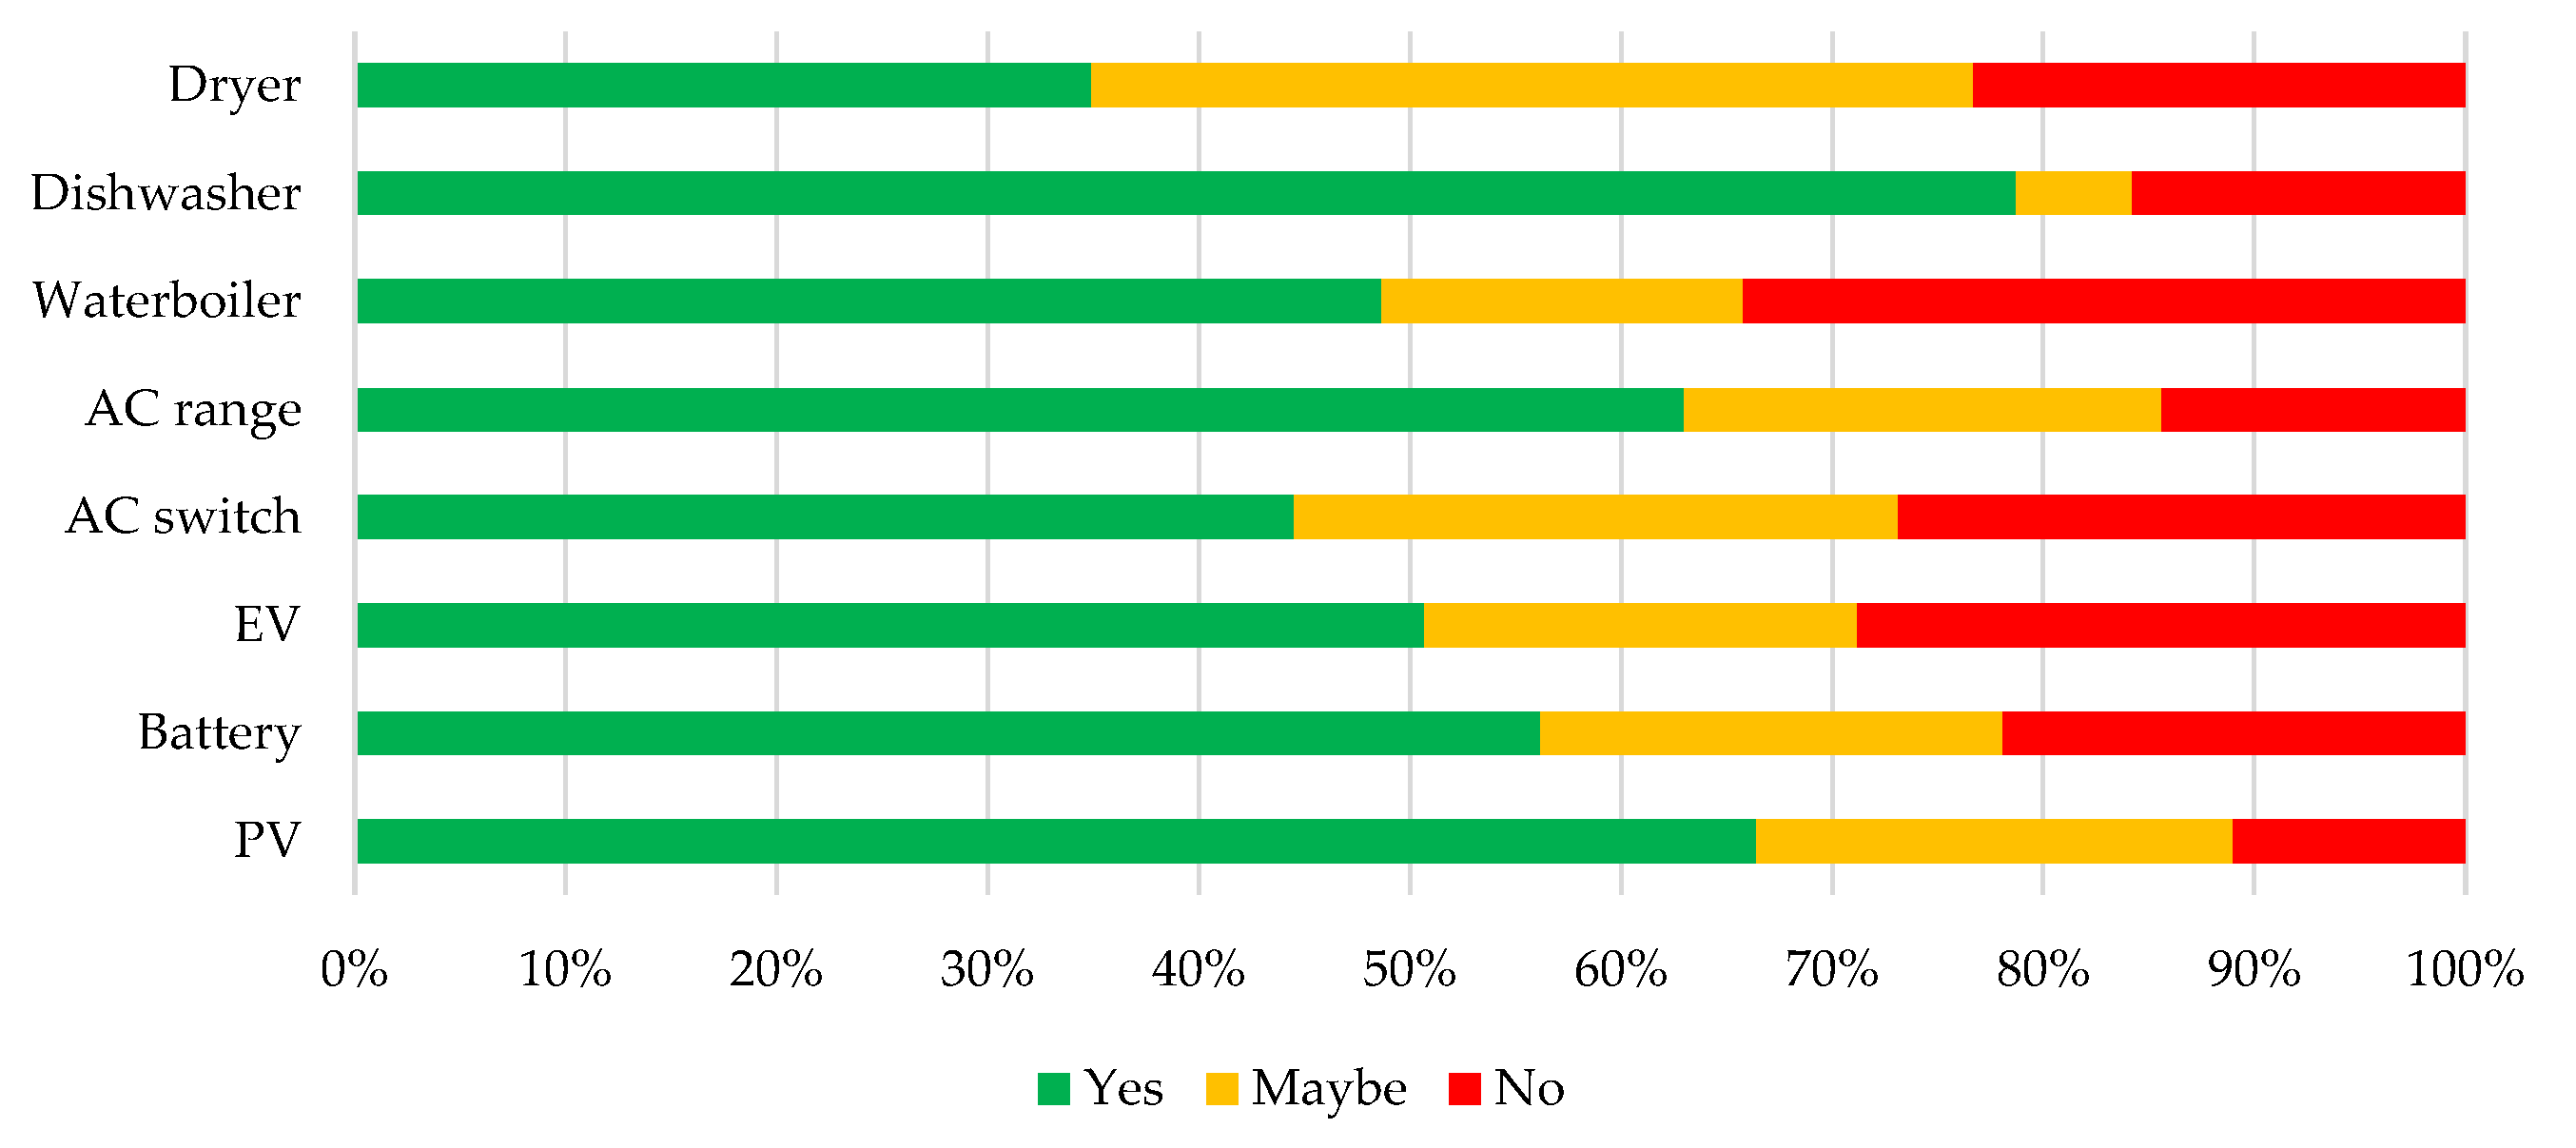
  • Acceptance of DLC: The respondents were asked to indicate with “yes”, “no”, or “maybe” for each device/appliance included in Table 2 whether they would allow the device to be controlled remotely by a third party. For AC, the question distinguished between controlling the AC in a temperature range of three degrees only and a total curtailment or start-up.
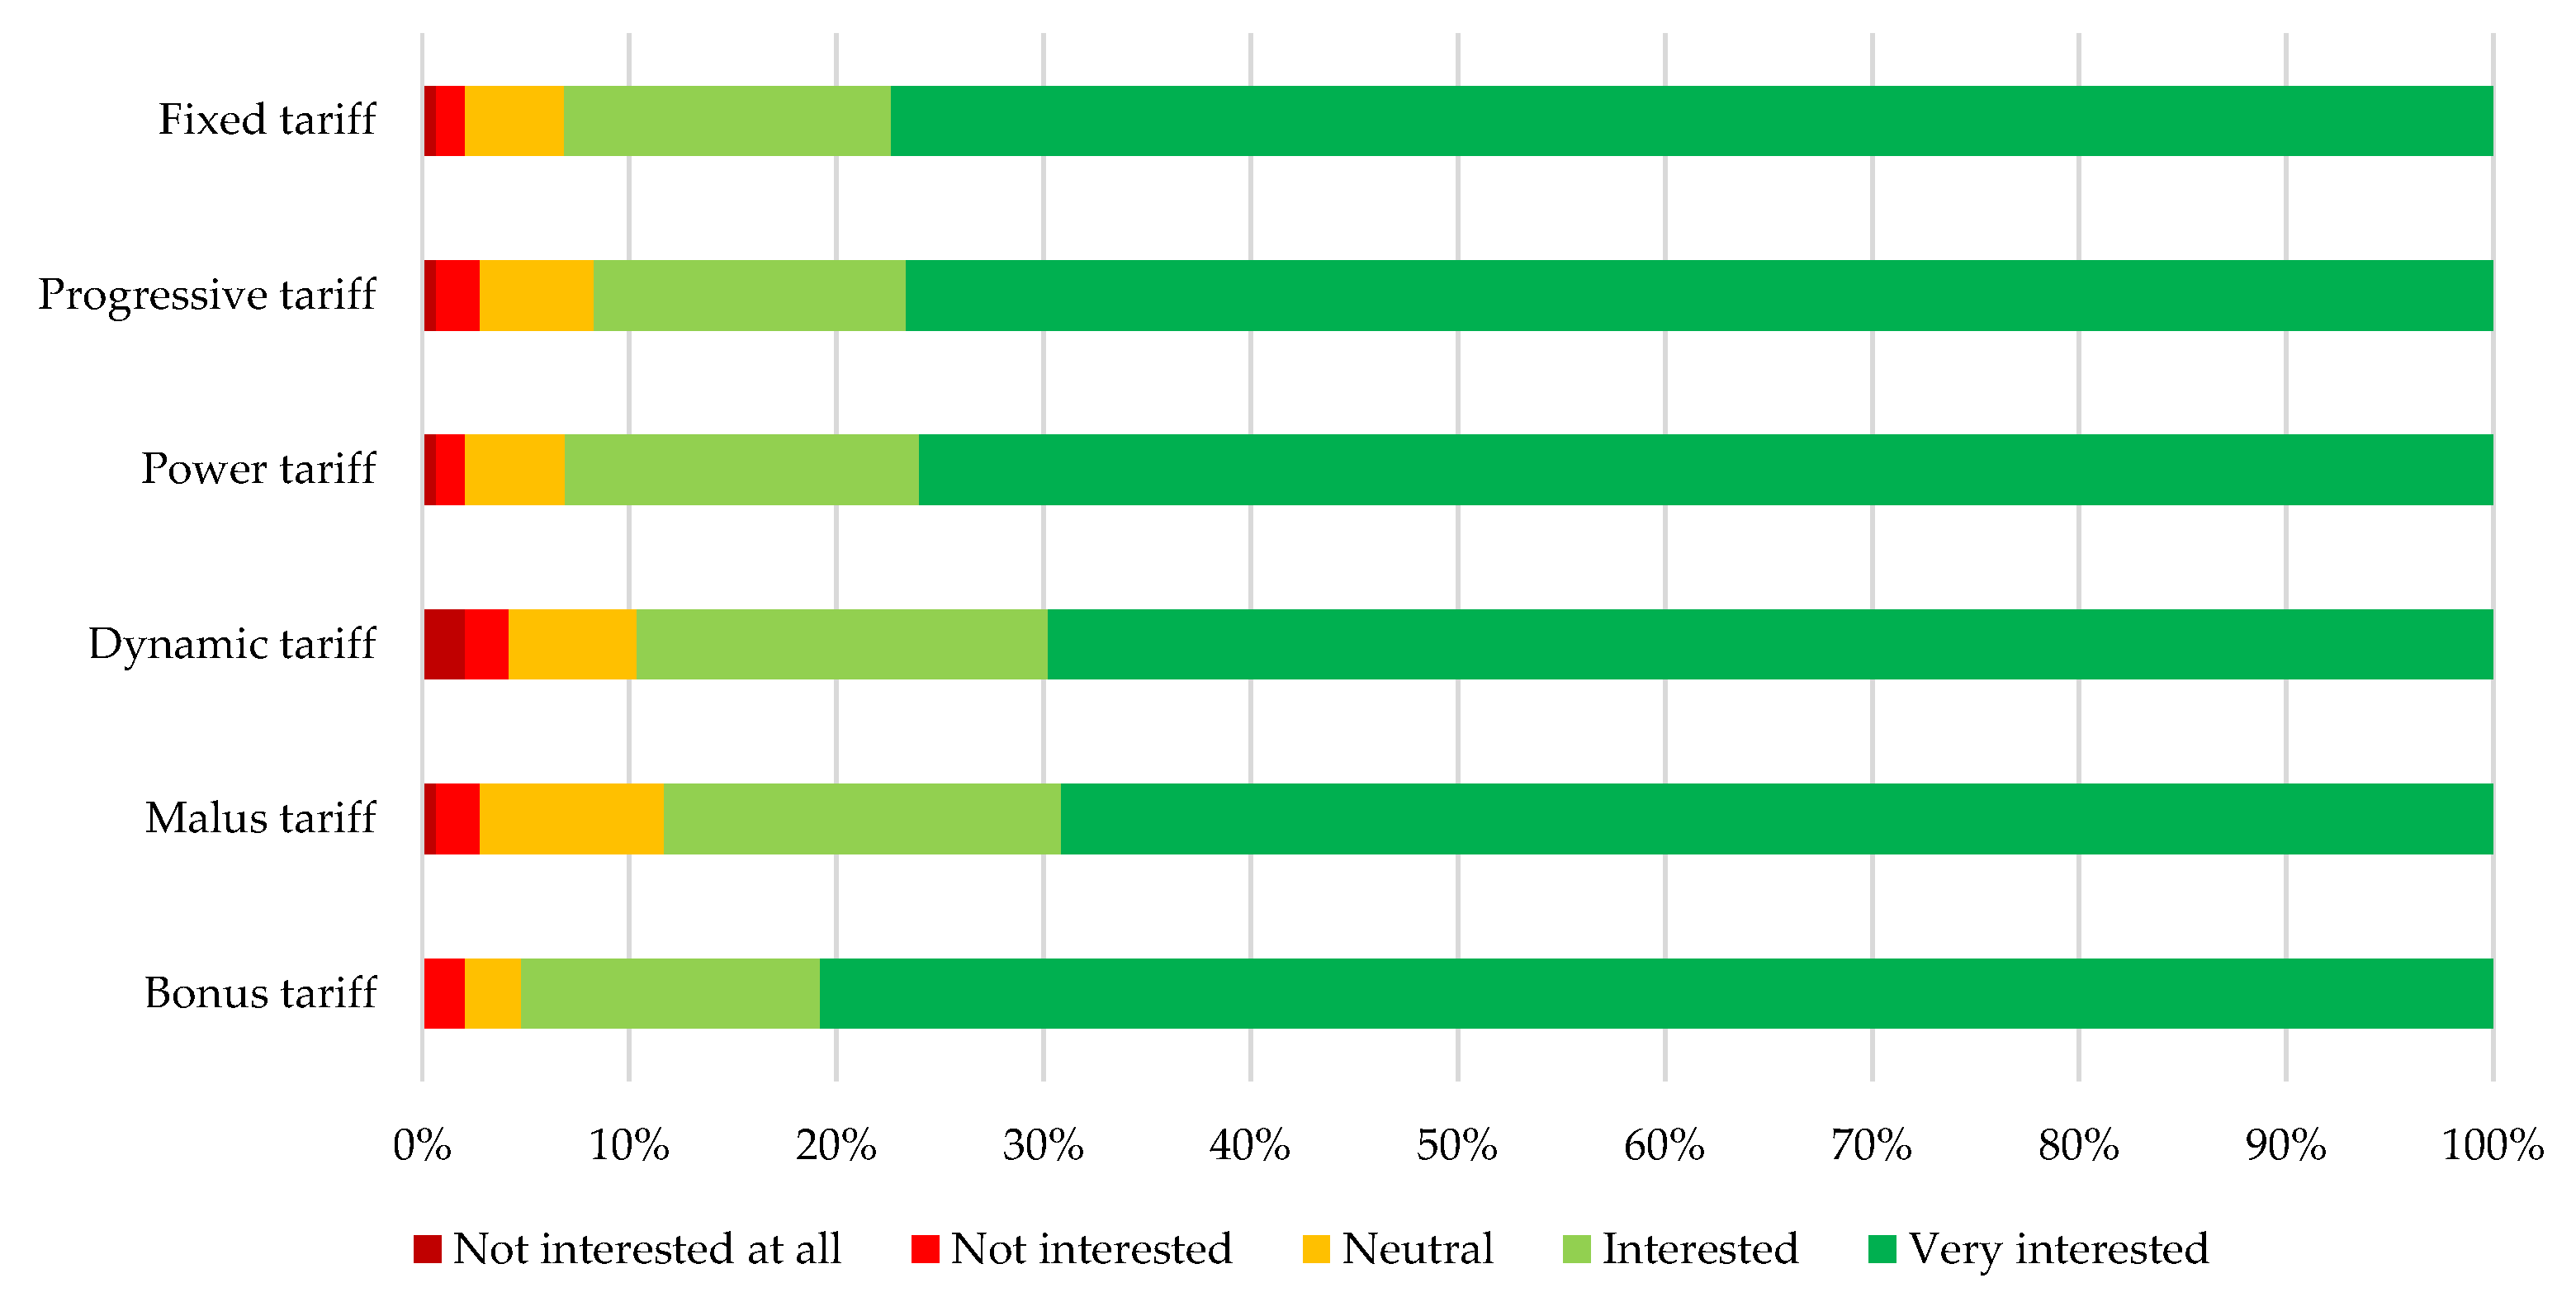
  • Interest in tariffs: The respondents were asked to indicate their level of interest in different tariff types based on a five-point Likert scale. The respective tariffs were explained in an exemplary sentence listed in Table 3 and explicitly phrased close to the wording of Yilmaz et al. [26] to allow for later comparison.
  • Main motivation to participating in a DR scheme: Asking “What is your main motivation for participating in such a program” the respondents were confronted to choose between monetary savings, the motivation to promote the energy transition, to be a pioneer in the neighborhood or to have a community project within the neighborhood as the main driver for their participation. The different options at first had to be evaluated on a 5-point Likert scale ranking before validating the answers in a comprehending question on the most important motivation of the aforementioned.
  • Desired remuneration: Asking for the desired type of remuneration respondents could indicate monetary compensation, vouchers for leisure events such as movie tickets or home entertainment subscriptions, or the possibility of a third party beautifying the local neighborhood.

3. Results

The following section presents the results of the survey and applied statistical treatment. The section is separated into six thematic blocks. In each block, at first, the descriptive statistics are presented, before explaining the results of advanced explorative analysis. Table 4 summarizes the analysis conducted in this study, explaining the purpose as well as method and variables contained, respectively.
The initial interest in residential DR participation on Mayotte is high. Based on a five-point Likert scale reaching from very unlikely (3.4%), unlikely (1.4%), neutral (2.1%), likely (11.6%), to very likely (81.5%), the majority of respondents indicate to be interested, with a median of 5, mean of 4.66, and standard deviation of 0.873.

3.1. Acceptance of Direct Load Control

3.1.1. Descriptive Statistics of DLC Acceptance

Asking the respondents for their acceptance of having devices/appliances to be controlled remotely by a third party turns out to be dependent on the type of device/appliance. However, for each device/appliance acceptance rates exceed the rejection rates. Figure 1 illustrates the frequencies of answers for each device/appliance.
The highest acceptance rates are indicated for the dishwasher (“Yes” = 78.8%, “Maybe” = 5.5%, “No” = 15.8%), PV (“Yes” = 66.4%, “Maybe” = 22.6%, “No” = 11%), AC in a temperature range of three degree (“Yes” = 63%, “Maybe” = 22.6%, “No” = 14.4%) and EVs (“Yes” = 50.7%, “Maybe” = 20.5%, “No” = 28.8%). Water boiler (“Yes” = 48.6%, “Maybe” = 17.1%, “No” = 34.2%), AC curtailment/switch-on (“Yes” = 45.9%, “Maybe” = 29.5%, “No” = 27.7%) and lastly the dryer (“Yes” = 34.9%, “Maybe” = 41.8%, “No” = 23.3%) have acceptance rates below than 50%. Remarkably, the results indicate more respondents to agree with the AC being controlled in a range of three degrees than automatic curtailment or switch-on.
Asking the participants how likely their answers would change to “yes” if they had a weekly chance to pause the contract shows a great approval for such option. Based on a five-point Likert scale, the mean acceptance was indicated with 4.85 points, while no respondent indicated only one or two points.

3.1.2. Socio-Demographics and DLC Acceptance

To investigate any significant relationship between socio-demographic and dwelling characteristics, and the acceptance of DLC for individual devices/appliances, a series of Chi-square tests are performed on the contingency table of responses. The Chi-square test of independence is a nonparametric test to determine whether two categorical variables of a contingency table are (significantly) likely to be related to each other. The idea of a Chi-square test is to arrange two or more variables in a contingency table, with categories for one variable i to appear in the rows and categories of the other variable j to appear in columns. The cells include the total count of cases for each specific pair of categories of the two variables. By comparing these observed counts oij of your sample size against an expected count eij, a significant deviation in the difference of the expected and observed count can be computed via Equation (1).
X 2 = i = 1 rows j = 1 columns ( o ij e ij ) 2 e ij
If the resulting X2 is greater than predefined critical X2, the null hypothesis of independent variables may be rejected.
Acceptance of DLC device/appliance feature serve as dependent variables, while socio-demographic and dwelling characteristics serve as independent variables. While the Chi-square test tells if there is a significant relationship between the variables of the contingency it does not include the strength of the relationship. Therefore, Cramer’s V (as the contingency is greater than 2 × 2) is calculated to quantify the effect size. Table 5 reports the results of the analysis, with only significant results shown.
The professional status, area of living, and ownership of a house or apartment show a significant correlation with the acceptance of AC to be switched on or being curtailed remotely. Business owners tend to accept the remote control, whilst especially students accept this less than the expectation with no correlation would indicate. People living in the city area of Mamoudzou do not widely accept the DLC of AC switch, whilst respondents in Dembeni and Kani-Keli are more in favor of it. In addition, owners of either apartments or houses show greater acceptance than tenants.
The acceptance of a water boiler to be remotely controlled significantly depends on the area of living in Mayotte. Respondents living in Kani-Keli show a higher interest than expected, while people living in the area of Mamoudzou tend to be less in favor of the solution.
Acceptance of DLC of a dishwasher significantly depends on the ownership of an accommodation. Owners show a higher acceptance of the remote control than tenures. The presence of children in a household significantly reduces the acceptance of the dishwasher to be remotely controlled.
The acceptance of remote control of a dryer is significantly contingent on the housing type of respondents. Respondents living in apartments show greater acceptance of the scheme than people living in houses.

3.2. Interest in Tariffs

3.2.1. Descriptive Statistics of Interest in Tariffs

Figure 2 presents the frequencies of indicated intserest in the different tariff types based on a five-point Likert scale.
Average interest is highest for the bonus tariff (M = 4.74, SD = 0.611, Mdn = 5), followed by the fixed tariff (M = 4.68, SD = 0.694, Mdn = 5), capacity tariff (M = 4.66, SD = 0.698, Mdn = 5) and progressive tariff (M = 4.65, SD = 0.739, Mdn = 5). The malus tariff (M = 4.54, SD = 0.798, Mdn = 5) and dynamic tariff (M = 4.53, SD = 0.864, Mdn = 5) are least preferred. However, even for the on average least preferred dynamic tariff the median of responses equals the highest possible answer of 5, which indicates an overall high interest in the tariff.

3.2.2. Socio-Demographics and Interests in Electricity Tariffs

Analogous to the previous section, this section aims to investigate how socio-demographic and dwelling characteristics predict the interest in the different tariff options. Therefore, a series of one-way analysis of variance (ANOVA) tests were conducted with socio-demographic and dwelling characteristics as independent variables. Levene’s test was performed in advance to check for potential homogeneity of variances (p < 0.05). For such data violating the assumption, the robust test of equality was carried out to neglect the null hypothesis and conclude that at least one of the group means is significantly different from others.
While the one-way ANOVA only indicates whether a significant difference does exist or not, it does not point out the specific variable relevant for causing the significant difference. Therefore, Tukey’s HSD post hoc test was performed to identify such variables. Table 6 presents the results for variables identified with significant differences. Note that only significant values are shown in the table.
As presented in the previous sections the bonus tariff gains high interest across all groups. The ANOVA test reveals only a minority of respondents indicating “other” as profession to be less interested (M = 3.4, SD = 1.342) than other professions. However, the standard deviation is noticeable, and the group only consists of five people.
The malus tariff is indicated to be disapproved by business owners (M = 3.25, SD = 2.062) and people with (high) income in between 3800–5500 EUR/month. In contrast, the tariff option is appreciated by retired people (M = 4.94, SD = 0.236). People living in a house (M = 4.59, SD = 0.709) are more attracted to the malus tariff than people living in apartments (M = 3.33, SD = 1.633).
The dynamic tariff is more accepted by older people than by younger people. Respondents of the youngest category (13–24 years) show significantly less interest in this tariff (M = 4.06, SD = 1.197). Except for the “other” group of profession (M = 2.8, SD = 1.304), students indicate low interest in the dynamic tariff (M = 4.22, SD = 1.121), especially in contrast to retired people (M = 4.94, SD = 0.236). Respondents living with children in the household are less attracted to the tariff (M = 4.4, SD = 0.946) than childless households (M = 4.75, SD = 0.667). People living in houses are more in favor of the dynamic tariff (M =4.59, SD = 0.805) than people living in apartments (M = 3.33, SD = 1.366).
People in the age between 55–65 years are more attracted to the capacity tariff (M = 4.94, SD = 0.25) than younger people, especially in the age between 13 and 24 (M = 4.3, SD = 1.045). Retired (M = 4.94, SD =0.236) and employed (M = 4.862, SD = 0.615) people are more attracted to the tariff than students (M = 4.33, SD = 1.074). Respondents with children living in the household show lower interest (M = 4.58, SD = 0.779) than people without children (M = 4.8, SD = 0.698).
Older people are more interested in the fixed tariff scheme than younger people, with the oldest group of 65+ years (M = 5, SD = 0) being most interested and the youngest group between 13 and 24 least interested (M = 4.48, SD = 0.972). The number of people living in the household has a significant impact on the interest in the fixed tariffs, with people living in households of more than five people (M = 4.41, SD = 0.02) being less interested than smaller households, especially contrasting single-person households (M = 5, SD = 0).
Like the capacity tariff, older people show a higher interest in the progressive tariff than younger people. The group of people between 55–65 years are most interested (M = 4.95, SD = 0.22), while the group of people between 13–24 years shows the least interest (M = 4.33, SD = 0.99). The profession has significant influence on the interest, with retired people showing most interest (M = 5, SD = 0), and business owners the least interest (M = 4.25, SD = 0.36) except for the unspecified group of “other” (M = 3.6, SD = 1.52). The absence of children in the household increases the interest in the tariff (M = 4.84, SD = 0.458) against the presence of children (M = 4.53, SD = 0.851).
Age (7), profession (6), and presence of children in the household (6) are most often decisive for a significant difference in the interests in tariffs. The housing situation (2), household size (2), and level of income (1) also caused a significant difference in interests, while the remaining socio-demographic characteristics (gender, area of living, tenant vs. ownership, electricity expenditure) has not been reported to cause a significant difference.

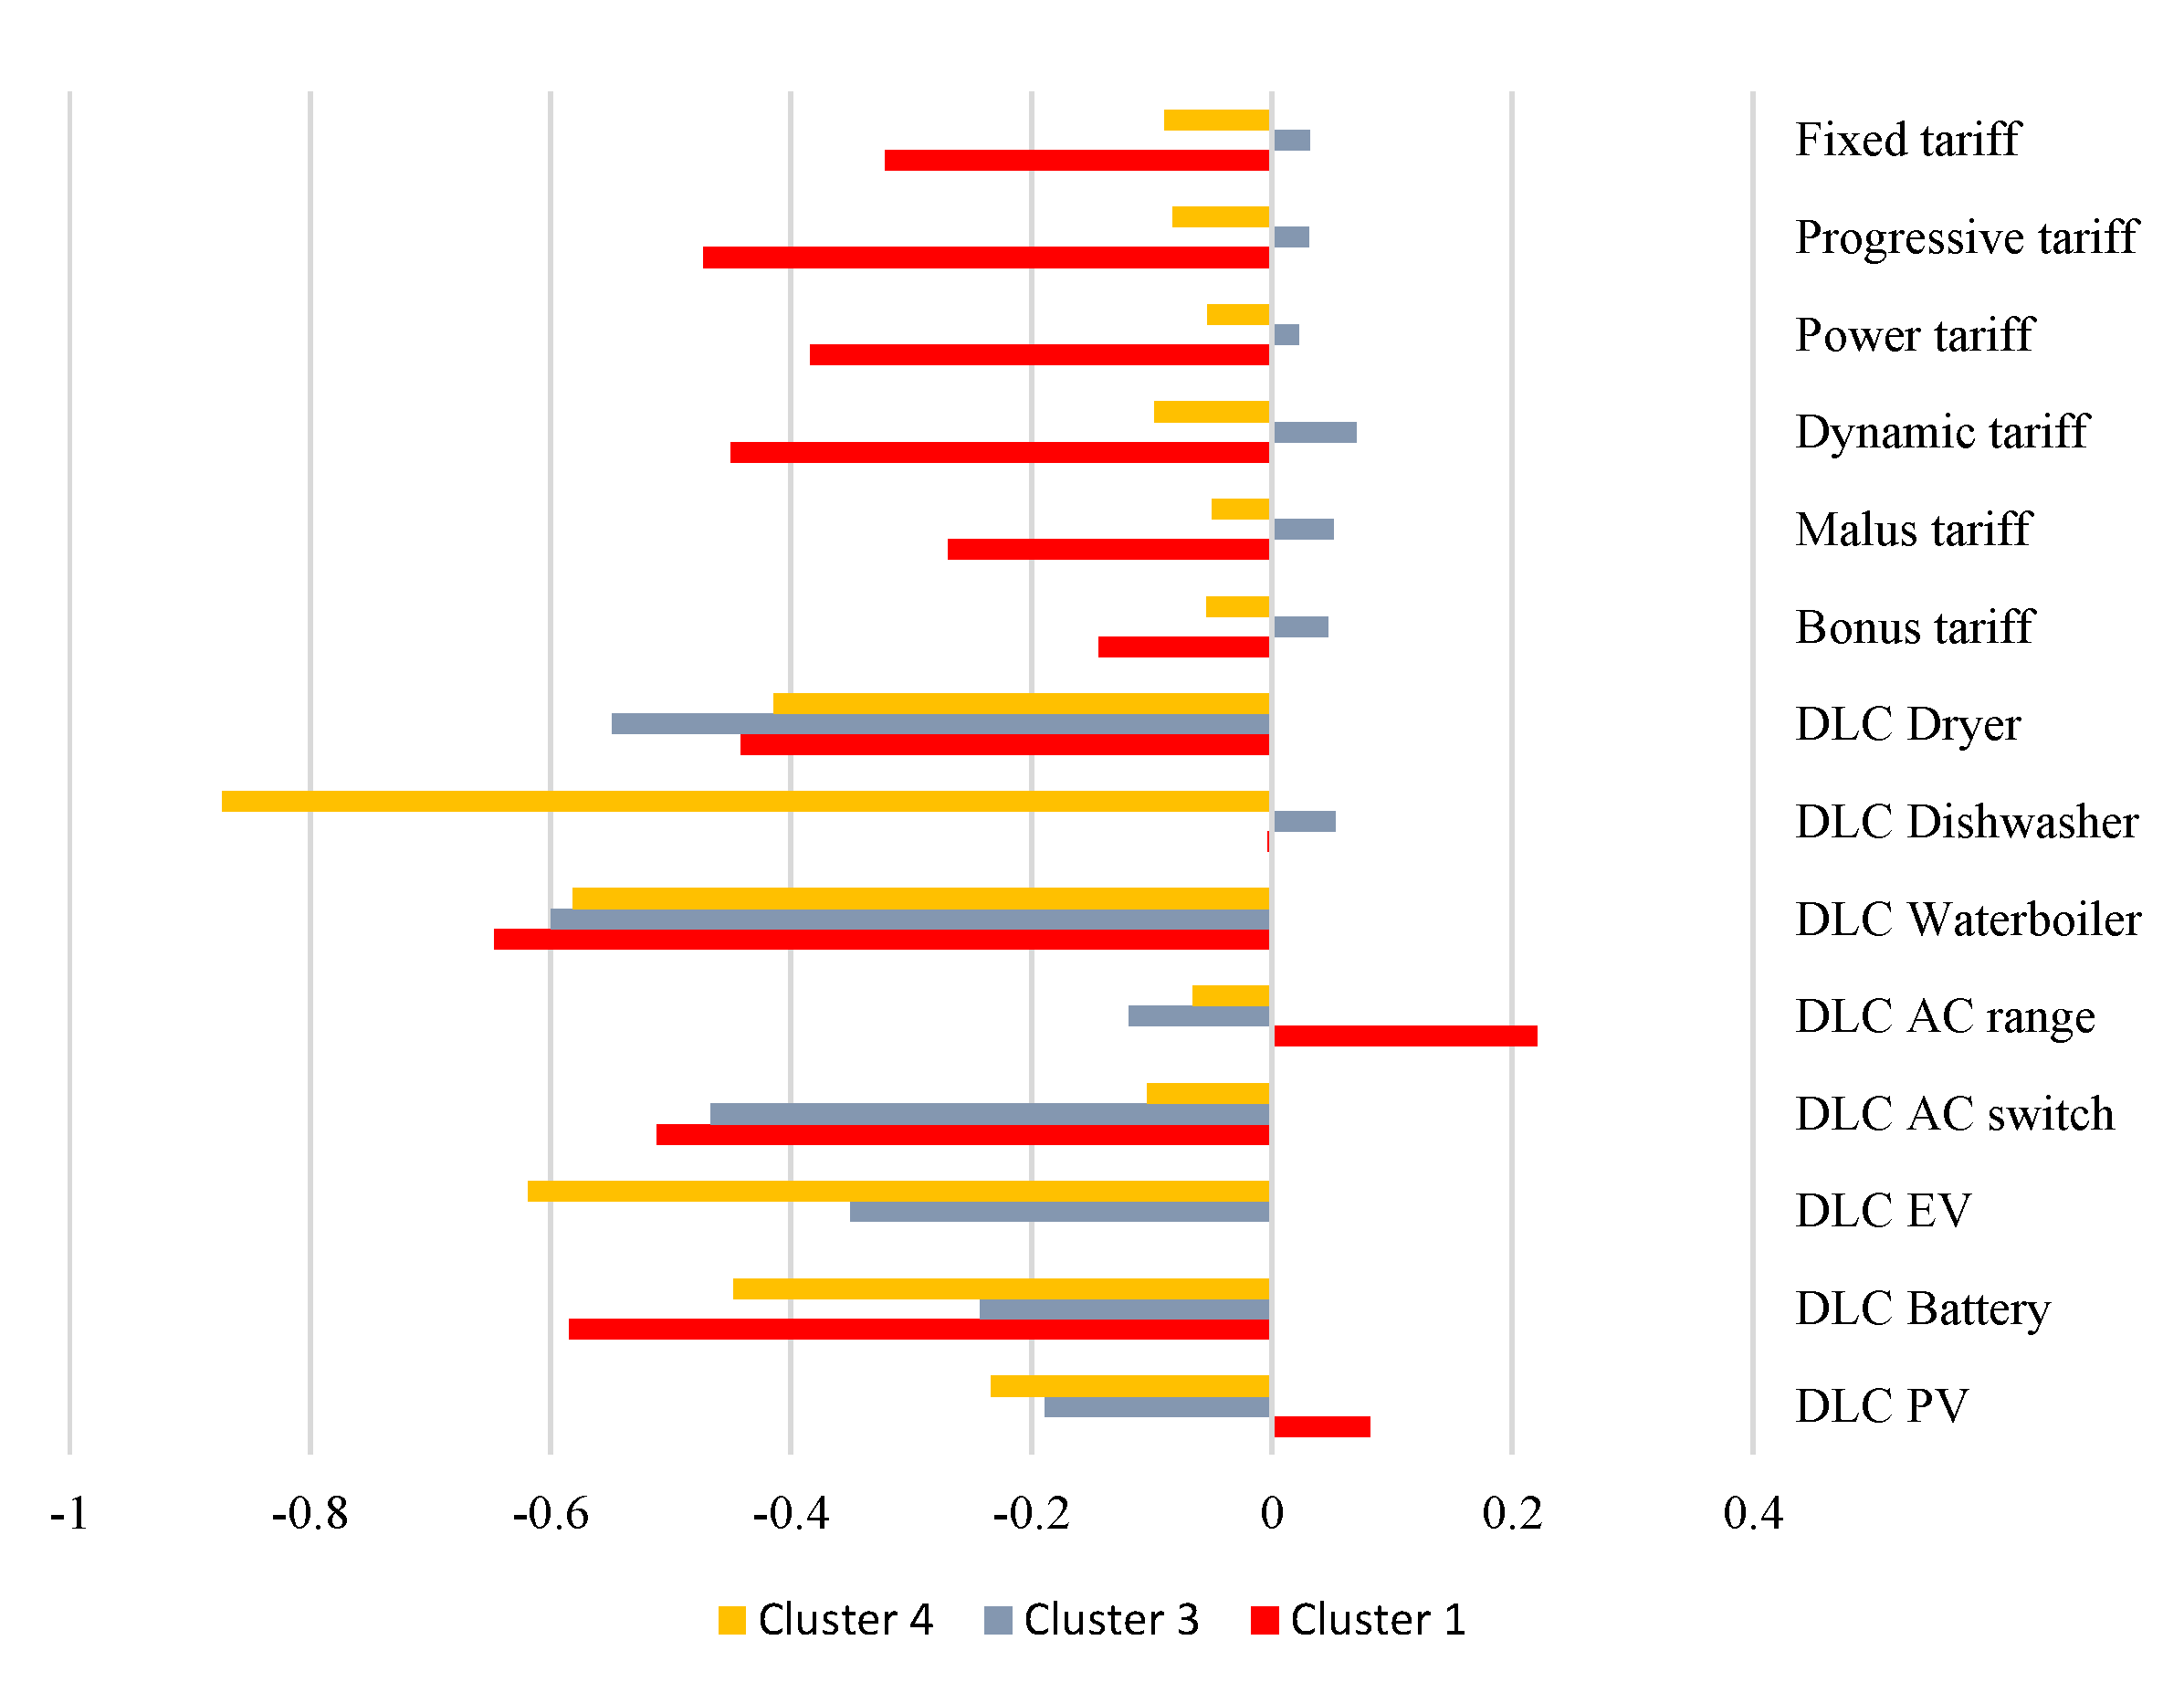
3.3. Clusters of Demand Response Preference

3.3.1. Cluster Analysis

As a common method to identify and segment various DSR preferences amongst the sample group, cluster analysis is applied (see [26]). Cluster analysis allows to group sample objects that have similar expressions in their characteristics. In the present analysis, cluster analysis is applied to detect groups within the respondents that have indicated similar interests and preferences in DR. If distinct clusters can be identified, these can be treated with appropriate statistical tools to identify socio-demographic characteristics and distinguish the different groups from each other—indicating a potential predictor for preferences in DR. K-means clustering was chosen as the clustering method. K-means clustering does not require uniform cluster densities and allows for multiple dimensional data. The main shortcoming of the method compared to other kinds of cluster analysis is the challenge of pre-determining the appropriate number of clusters. However, this drawback can be overcome by calculating similarity measures, as discussed below.
Features incorporated in the analysis are (1) the acceptance of DLC for the respective devices/appliances and (2) interest in the different tariffs. Since the features differed in their scale—DLC acceptance as dichotomous variable and interest in tariffs on a Likert scale—the data must be normalized to avoid any disproportional impacts on the results of the cluster center. Common min-max normalization was applied, which assigns values between 0 and 1 to each response.
The normalized value xnorm of the original value x of a feature i is calculated by using the maximum max(xi) and minimum min(xi) values of the feature span via Equation (2).
x norm , i = x i min ( x i ) max ( x i ) min ( x i )
In addition to the number of required iterations for obtaining the final cluster of each case, the silhouette score serves as an additional measure to define the optimal number of clusters. The silhouette score s of each data point i, calculated according to Equation (3), quantifies the similarity of an object to its own cluster compared to a separate cluster. Ranging in a theoretical span between [−1, 1], a score close to 1 indicates a high similarity and accordingly good performance of the clustering algorithm. Vice versa, a silhouette score of −1 indicates the opposite. The cluster number which holds the highest average silhouette score is optimal. As the data contain ordinal values (however normalized) we use Gower as a dissimilarity measure.
s ( i ) = b ( i ) a ( i ) max { a ( i ) , b ( i ) }
in which a = average intra-cluster distance, and b = average shortest distance to another cluster.
The cluster analysis reveals four distinct groups (number of iterations with changes = 6; average silhouette score = 0.207). Table 7 presents the different groups and average cluster centers of the final solution in each feature, as illustrated in Figure 3.
The smallest cluster, cluster 1 (moderate DLC, low tariff, 8.2%), is moderately interested in DLC (M = 0.62) but expresses a low interest in the offered tariffs (M = 0.59). Remarkably, among the DLC devices, the cluster center of the AC to be controlled in a temperature range is at the maximum of the scale (1), indicating high acceptance. The least preferred tariff within the group is the dynamic tariff (M = 0.458).
Cluster 2 (innovators, 39%) shows an overall high interest in DLC programs as well as in tariffs, with an overall mean of 0.9. The AC to be controlled in a temperature range is less preferred in this cluster than the AC to be curtailed or switched-on remotely, which deviates from the overall average response and thereby other groups, as illustrated in Figure 4. The malus tariff is the less preferred tariff within cluster 2.
Cluster 3 (low DLC, high tariff, 38.4%) is the second-largest cluster. Cases of this cluster report the second-lowest interest in DLC (M = 0.55), but the highest overall interest in tariffs (M = 0.97). The least preferred tariff again is the malus tariff (M = 0.946).
In contrast to cluster 1, cluster 4 (low DLC, moderate tariff, 14.4%) shows a low interest in DLC of devices/appliances (M = 0.44), but a moderate interest in the offered tariffs (M = 0.86). A remotely controlled dishwasher is extremely low accepted, with a mean cluster center at 0.048.

3.3.2. Predicting Clusters Based on Socio-Demographic Characters

Multinomial logistic regression was applied to examine how socio-demographic and dwelling characteristics are associated with cluster membership of DSR preferences. A likelihood ratio Chi-square test compares the full model with all the predictors against the null model. Statistical significance (p-value < 0.001) indicates that the full model is a significant improvement in fit over the null model. Pearson and Deviance Chi-square tests produce contrary results. While Pearson (p-value = 0.010) shows a significant result, Deviance (p-value = 1.000) shows a non-significant result, which is an indicator for good model fit.
The overall contribution of each independent variable to the model is tested via likelihood ratio tests. A significant p-value indicates the variable to significantly contribute to differentiation of the clusters. These variables are found to be age (p < 0.001), housing situation (p < 0.001), housing type (p = 0.002), electricity expenditure (p = 0.044), and monthly income (p = 0.005).
To further investigate the socio-demographic and dwelling characteristics in the different clusters, parameter estimates compare each cluster against one reference cluster. As cluster 2 (innovators) outstands the other cluster showing high interest in both DLC and tariffs, cluster 2 was chosen as the reference cluster. Table 8 reports the multinomial logistic regression coefficient B, standard error, and p-value, as well as odds ratio for each feature compared to the respective feature in reference cluster 2. The multinomial logistic regression coefficient B quantifies the expectation of the logit of outcome relative to the reference cluster 2 to change when changing the predictor variable by one unit. The odds ratio of the multinomial coefficient indicates the comparison of probability to be in the comparison cluster against the probability to be in the reference cluster. If, therefore, the odds ratio < 1, the outcome is more likely to be in the reference group for every increase of the variable considered by one unit. Considering both measures enable to detect if socio-demographic and dwelling characteristics are decisive for cluster membership.
Cluster 1: Members of cluster 1 tend to be younger than members of cluster 2, have less children and own apartments. In addition, members of cluster 1 spend more money on average on their electricity bill and have less income.
Cluster 2 (innovators): Respondents in cluster 2 tend to be older than in other clusters.
Cluster 3: Respondents of cluster 3 less commonly live in the city area of Mamoudzou than such respondents of cluster 2.
Cluster 4: Members of cluster 4 are younger than members of cluster 2, and more commonly own houses.

3.4. Main Motivation for Participation in Residential Demand Response

3.4.1. Descriptive Statistics of Main Motivation to Participate in Residential Demand Response

Asking for the major motivation in participating in a DR scheme reveals the desire to promote the energy transition to be most often option (M = 4.85, SD = 0.543, Mdn = 5) just before willingness to participate in a neighborhood community project (M = 4.82, SD = 0.599, Mdn = 5). Monetary savings rank last (M = 4.62, SD = 0.772, Mdn = 5), behind the motivation to become a pioneer in the neighborhood (M = 4.68, SD = 0.838, Mdn = 5). Figure 4 presents the frequencies of responses on each motivational driver based on the five-point Likert scale.
The results are confirmed by confronting the respondents to choose the most important motivation of the four opportunities. The majority of 58.2% indicates the promotion of energy transition to be most important, followed by 24% suggesting the involvement in a neighborhood community project and the option to become a pioneer (15.8%). Monetary savings representing financial motives are indicated as most important by the minority of 2.1%.

3.4.2. Socio-Demographics and Main Motivation

A series of one-way ANOVA tests were conducted to detect significant correlation between socio-demographic and dwelling characteristics and the main motivation in participating in a DR scheme. Table 9 presents the results of the analysis, while the table only includes significant correlations.
The results indicate the monthly electricity expenditure to be significantly decisive for differences in the main motivation of DR participation. Representatives with the lowest expenditures (<EUR 80/m) show less interest in the motivation offered by any other than the financial incentive. The financial motive in contrast significantly correlates with the professional status. Students show least interest in monetary savings (M = 4.3, Std. = 0.912), while retired people uniformly show greatest interest (M = 5, Std. = 0).

3.5. Preferences in Remuneration

3.5.1. Descriptive Statistics of Preferences in Remuneration

As literature suggests the possibility of general interest in other remuneration than monetary remuneration, the survey compares two alternatives against common monetary remuneration. Both the option to receive vouchers for leisure events such as movie tickets or home entertainment subscriptions (M = 4.68, SD = 0.794, Mdn = 5) as well as the possibility of a third party beautifying the local neighborhood (M = 4.66, SD = 0.764, Mdn = 5) are preferred against monetary remuneration

3.5.2. Socio-Demographics and Interest in Remuneration

A series of one-way ANOVA tests were conducted to detect any significant difference between alternative remuneration schemes than monetary and socio-demographic and dwelling characteristics. Table 10 reports the results of the analysis, while only significant correlations are included.
A significant correlation between professional status and the favor of receiving vouchers instead of money is observed. Retired people are in high favor of the concept (M = 5, Std. = 0). Further, two-person households show the greatest interest in this remuneration scheme (M = 4.92, Std. = 0.44), while with an increasing household size the concept is steadily more disliked. The presence of children in the household accordingly decreases the support of voucher (M = 4.91, Std. = 0.889) compared to the absence (M = 4.91, Std, = 0.549). Monthly average electricity expenditures show a significant impact on the support of vouchers as well. People with the lowest payments per month (<80 EUR/m) disapprove of the concept (M = 4.32, Std. = 1.124) significantly compared to the group of 80–150 EUR/m (M = 4.84, Std. = 0.502).
The monthly electricity expenditures also significantly impact the likelihood of preferring the option of neighborhood beautification against monetary reward. The group of people paying less than 80 EUR/month significantly more dislike the concept (M = 4.21, Std. = 1.258). Age impacts the preference of this alternative reward scheme. The youngest group of 13–24 years old express the lowest interest (M = 4.27, Std. = 1.069), with ascending interest. Highest interest is shown in the group of 55–56 years old (M = 5, Std. = 0).

3.6. Timing of Notification

3.6.1. Descriptive Statistics of Preferred Timing of Notification

Most of the respondents indicate 4 hours (45.2%) to be sufficient, 20.5% indicate six hours. Approximately 20% require 8 hours and a minority of 14.4% indicate 2 hours to be sufficient to react.

3.6.2. Socio-Demographics and Time of Notification

A series of Chi-square tests were conducted to detect any significant difference between the desired time of notification and socio-demographic and dwelling characteristics. Table 11 reports the results of the analysis, while only significant correlations are included.
The results indicate the only significant variable to influence the desired time of notification ahead to be the dwelling type. Respondents living in apartments tend to prefer a longer time span between notification and desired change in consumption, while people living in houses are more open to shorter lead times.

4. Discussion

The presented results synthesize the outcomes of a survey assessing preferences and perceptions of 146 residents on the island of Mayotte on social aspects of residential DR. Beyond descriptive statistics, advanced k-means cluster analysis, multinomial logistic regression, one-way ANOVA and Chi-square tests were applied to the survey responses to detect socio-demographic and dwelling characteristic drivers influencing the respective perception. Analogous to the structure of the results section, this section discusses the key findings from the questionnaire, i.e., DLC acceptance, interest in tariffs, and key motivational driver for participation. The results of the present case study are compared to other authors’ findings in previous analyses, while possible motives for differences are discussed.
The overall acceptance of devices/appliances to participate in DLC programs within the sample group is high, with rejection being lower than acceptance in every electrical device/appliance asked for. The dishwasher, PV, the AC to be controlled in a range of three degrees, as well as battery receive highest indicated acceptance, while the AC to be curtailed/switched-on and dryer receive the lowest support. The findings partly support the common assumption found in previous literature that such devices, which fewer daily routines are associated with, are more suitable for DLC programs. However, the dishwasher may not apply to this theory. As Ghanem et al. on case studies of three islands also find the dishwasher to be widely accepted for DLC [4], daily routines (or the perception) bound to the dishwasher may differ on islands compared to the mainland. Notably, the results indicate the AC to be controlled in a range of three degrees to be preferred over an automatic curtailment or switch-on. This contrasts with the findings from Xu et al. [14], which detected the opposite trend on a case study in mainland California [14]. In line with previous literature, dwelling characteristics are detected to be a significant predictor for DLC preferences, with owners of apartments or houses showing greater acceptance towards AC curtailment/switch-on and dishwasher control. The reasons behind this might be manifold, and the authors suggest including the size of the apartment as an independent variable for future work to add another perspective.
While the overall interest in tariffs is high, the bonus tariff is most accepted by the population. Malus tariff and dynamic tariff are least preferred. These results are in alignment with comparable literature. However, a significant difference is found in the correlation of the age of the respondents and indication of interest in tariffs. While especially Yilmaz et al. [26] find young people to indicate higher interest in tariffs than overall—and especially in such tariffs associated with higher perceived effort for the user—the study on Mayotte indicates the opposite. The impression of young people tending to reject DR schemes on Mayotte may be supported by the cluster analysis, which reveals an innovative cluster with a significantly high age. Based on this study, we can only speculate on the background of this tendency. On the one hand, a connection to the main motivations for participating in DR schemes can be suspected. Since this is primarily ecological motivation and motivation to participate in neighborhood projects, it could be assumed that awareness of the value of these two alternatives emerges with increasing age. While ecological motivators may also be a similar driving force in comparable case studies (noticeably, islands are unproportionally exposed to climate change effects), reflecting on the findings of the study, the sense of—and motivation by—neighborhood projects seem higher on Mayotte and other islands. This impression is supported by the additive question of the survey, which asks to what extent potential participants in DR schemes would feel confirmed in their participation if other neighbors were to join the project. The question was answered by a substantial majority (87%) with “very likely”. Since such a sense of neighborhood cohesion presumably develops with increasing responsibility and age, one reason for a difference in the age correlation and interest in DR schemes can be seen in increasing maturity. On the other hand, one reason for the difference in approval across the age categories could be the different level of knowledge and awareness about issues of climate change, electricity consumption, and more specifically, DR. It could be possible that older people have already experienced related issues and might see an advantage in the actual implementation of DR schemes. This argumentation points to a limitation of the present study, which does not consider the different levels of knowledge of the participants and therefore cannot compare an average level of knowledge and awareness with other studies. A correlation of the answers regarding DLC acceptance to the devices in possession also remains without significance, since only the fewest participants in the study possess most of the devices offered (compare Table 2). As part of the MAESHA project, such a baseline on the level of knowledge, awareness, and interest in climate change and energy supply issues will be developed, which needs to be integrated into the context of the present study, as well as compared with similar studies from the mainland.
The results on asking for a different remuneration than monetary compensation suggest exploring such potential further on Mayotte. Both options of receiving a voucher for leisure events and a third party beautifying the neighborhood are indicated as more attractive to the respondents than monetary compensation. As the analysis indicates the professional status, household size, presence of children, electricity expenditure, and age to be significant variables, different target groups could be approached by different schemes. Especially for young people without children, a gamification approach linked to receiving vouchers—as suggested in previous literature already—could be a pathway to follow.
Even though the results show high overall interest in DR—both DLC and tariffs—it must be noted that such expression of interest does not inevitably lead to success of an introduced DR scheme. First of all, an initial expression of interest does not incorporate long-term interest and behavioral change [20]. Still, after initial fascination users may feel a loss of comfort or become less attracted by the compensation, and at some point reject the DR scheme. This must especially be considered when upfront knowledge of the impact is low (despite the explanations during the survey). Follow-up work must therefore incorporate the level of awareness on climate change and energy innovations on Mayotte. Secondly, the previous analysis did not include the willingness, nor ability, to pay for any DR enabling device, as financial business models in this stage of the project remain unclear. Especially considering the low GDP and employment rate on Mayotte, initial upfront costs for the user can pose a huge barrier to overcome for actual large-scale uptake of the scheme.

5. Conclusions

As on many other European islands, the energy system of Mayotte suffers from low reliability of supply, high share of fossil fuels, and high costs of electricity generation. Flexibility options can significantly improve the inherent weak power grid and allow for a larger share of renewable energies to be integrated. As one of such flexibility option, residential DR outstands from alternative flexibility measures, as it requires the active involvement of the local population. To ensure sustainable involvement, DR schemes must be tailored closely to the preference of the community. As the first study on Mayotte, this paper assesses the population’s preferences on DLC, electricity tariffs, major motivation, and remuneration.
Results from a survey on key social issues carried out amongst 146 residents are presented and discussed. The results show an overall high interest in DLC—depending on the type of device/appliance—and common electricity tariffs. In contrast to previous literature on the mainland, the findings on Mayotte indicate young people to be more reluctant to innovative tariff schemes and DLC. Ecological and social motives of participating in DR exceed financial motivation. As the driver to participate in neighborhood projects receives high encouragement, the idea of island inhabitants having a strong sense of community may be confirmed. This may offer the possibility to explore innovative remuneration goods and schemes to attract residential DR participants. It further underpins the impression of islands being suitable real laboratories for energy innovations. However, as knowledge, awareness, and ability/willingness to pay for DR schemes and other electricity services remain unclear for the island of Mayotte, subsequent work must fill these gaps to flag constraints or highlight potential pathways for actual DR uptake. Translating the hypothesis and highlighted limitations raised in the discussion section into potential future work, the authors recommend to:
  • Explore the contemporary level of awareness and knowledge on DR, electricity supply, and climate change within the community, respecting potential differences across age groups;
  • Assess the ability and willingness to pay for DR schemes, to exclude non-affordable (as cost-intensive for the user) DR schemes from further consideration;
  • Explore the possibilities for alternative remunerations than monetary compensation on Mayotte.

Author Contributions

Conceptualization: K.G. and N.S.; methodology, K.G. and N.S.; software, K.G. and N.S.; validation, K.G. and N.S.; formal analysis, K.G. and N.S.; investigation, K.G. and N.S.; resources, K.G. and N.S.; data curation, K.G. and N.S.; writing—original draft preparation, K.G. and N.S.; writing—review and editing, N.S. and B.H.; visualization, N.S.; supervision, B.H.; project administration, B.H.; funding acquisition, B.H. All authors have read and agreed to the published version of the manuscript.

Funding

This research was funded by the Horizon2020 research program under the grant agreement No. 957843. This work is supported by the MAESHA partners for survey design and review of this document. The outcomes will feed into full reports submitted to the European Commission and available on www.maesha.eu, accessed on 14 January 2022.

Institutional Review Board Statement

All subjects gave their informed consent for inclusion before they participated in the study. The study was conducted in accordance with the ethics requirements to be fulfilled under the Horizon2020 research program funded by the European Commission, and has been reviewed by the MAESHA consortium.

Informed Consent Statement

Informed consent was obtained from all subjects involved in the study.

Data Availability Statement

Raw data of the survey responses can be requested at n.schoene@tu-berlin.de.

Acknowledgments

The authors gratefully acknowledge the MAESHA consortium for support in the development and execution of the study.

Conflicts of Interest

The authors declare no conflict of interest.

References

  1. European Union. 2050 Long-Term Strategy. European Union. Available online: https://ec.europa.eu/clima/policies/strategies/2050_en (accessed on 7 September 2021).
  2. Scandurra, G.; Romano, A.A.; Ronghi, M.; Carfora, A. On the vulnerability of Small Island Developing States: A dynamic analysis. Ecol. Indic. 2018, 84, 382–392. [Google Scholar] [CrossRef]
  3. Kotzebue, J.R.; Weissenbacher, M. The EU’s Clean Energy strategy for islands: A policy perspective on Malta’s spatial governance in energy transition. Energy Policy 2020, 139, 111361. [Google Scholar] [CrossRef]
  4. Ghanem, D.A.; Crosbie, T. The Transition to Clean Energy: Are People Living in Island Communities Ready for Smart Grids and Demand Response? Energies 2021, 14, 6218. [Google Scholar] [CrossRef]
  5. Ioannidis, A.; Chalvatzis, K.J.; Li, X.; Notton, G.; Stephanides, P. The case for islands’ energy vulnerability: Electricity supply diversity in 44 global islands. Renew. Energy 2019, 143, 440–452. [Google Scholar] [CrossRef]
  6. Gils, H.C.; Simon, S. Carbon neutral archipelago—100% renewable energy supply for the Canary Islands. Appl. Energ. 2017, 188, 342–355. [Google Scholar] [CrossRef] [Green Version]
  7. Kuang, Y.; Zhang, Y.; Zhou, B.; Li, C.; Cao, Y.; Li, L.; Zeng, L. A review of renewable energy utilization in islands. Renew. Sust. Energ. Rev. 2016, 59, 504–513. [Google Scholar] [CrossRef]
  8. Zafirakis, D.; Chalvatzis, K.J. Wind energy and natural gas-based energy storage to promote energy security and lower emissions in island regions. Fuel 2014, 115, 203–219. [Google Scholar] [CrossRef]
  9. IRENA. Power System Flexibility for the Energy Transition—Part 1: Overview for Policy Makers; IRENA: Bonn, Germany, 2018. [Google Scholar]
  10. IRGC. Demand Side Flexibility for Energy Transitions—Ensuring the Competitive Development of Demand Response Options; International Risk Governance Council: Lausanne, Switzerland, 2015. [Google Scholar]
  11. Albadi, M.H.; El-Saadany, E.F. A summary of demand response in electricity markets. Electr. Power Syst. Res. 2008, 78, 1989–1996. [Google Scholar] [CrossRef]
  12. Schot, J.; Kanger, L.; Verbing, G. The roles of users in shaping transitions to new energy systems. Nat. Energy 2016, 1, 16054. [Google Scholar] [CrossRef] [Green Version]
  13. Christensen, T.H.; Friis, F.; Bettin, S.; Throndsen, W.; Ornetzeder, M.; Skjølsvold, T.M.; Ryghaug, M. The role of competences, engagement, and devices in configuring the impact of prices in energy demand response: Findings from three smart energy pilots with households. Energy Policy 2019, 137, 111142. [Google Scholar] [CrossRef]
  14. Xu, X.; Chen, C.; Zhu, X.; Hu, Q. Promoting acceptance of direct load control programs in the United States: Financial incentive versus control option. Energy 2018, 147, 1278–1287. [Google Scholar] [CrossRef]
  15. Fell, M.J.; Shipworth, D.; Huebner, G.M.; Elwell, C.A. Public acceptability of domestic demand-side response in Great Britain: The role of automation and direct load control. Energy Res. Soc. Sci. 2015, 9, 72–84. [Google Scholar] [CrossRef] [Green Version]
  16. Dütschke, E.; Paetz, A.G. Dynamic electricity pricing—Which programs do consumers prefer? Energy Policy 2013, 59, 226–234. [Google Scholar] [CrossRef] [Green Version]
  17. Paetz, A.G.; Dütschke, E.; Fichtner, W. Smart Homes as a Means to Sustainable Energy Consumption: A Study of Consumer Perceptions. J. Consum. Policy 2012, 35, 23–41. [Google Scholar] [CrossRef]
  18. Lebosse, C. Grid4EU DEMO6—dD6.8-1 Assessment of the Social Behaviour of the Residential Customers after on Site Tests; Grid4EU: Paris, France, 2016. [Google Scholar]
  19. AECOM. Energy Demand Research Project: Final Analysis; AECOM for Ofgem: Herfordshire, UK, 2011. [Google Scholar]
  20. Parrish, B.; Heptonstall, P.; Gross, R.; Sovacoo, B.K. A systematic review of motivations, enablers and barriers for consumer engagement with residential demand response. Energy Policy 2020, 138, 111221. [Google Scholar] [CrossRef]
  21. Belmans, R.; Beusen, B.; Boesmans, B.; Cardinaels, W.; Claessens, B.; Claessens, S.; Coomans, P.; D’hulst, R.; De Meyer, W.; Degraeve, J.; et al. Linear—The Report; The Linear Consortium: Genk, Belgium, 2014.
  22. Bird, J. Developing the Smarter Grid: The Role of Domestic and Small and Medium Enterprise Customers; Customer-Led Network Revolution: Newcastle, UK, 2015. [Google Scholar]
  23. Hall, N.L.; Jeanneret, T.D.; Rai, A. Cost-reflective electricity pricing: Consumer preferences and perceptions. Energy Policy 2016, 95, 62–72. [Google Scholar] [CrossRef]
  24. Hargreaves, T.; Nye, M.; Burgess, J. Making energy visible: A qualitative field study of how householders interact with feedback from smart energy monitors. Energy Policy 2010, 38, 6111–6119. [Google Scholar] [CrossRef]
  25. Stenner, K.; Frederiks, E.R.; Hobman, E.V.; Cook, S. Willingness to participate in direct load control: The role of consumer distrust. Appl. Energ. 2018, 189, 76–88. [Google Scholar] [CrossRef]
  26. Yilmaz, S.; Xu, X.; Cabrera, D.; Chanez, C.; Cuony, P.; Patel, M.K. Analysis of demand-side response preferences regarding electricity tariffs and direct load control: Key findings from a Swiss survey. Energy 2020, 212, 118217. [Google Scholar] [CrossRef]
  27. Carmichael, R.; Schofield, J.; Woolf, M.; Bilton, M.; Ozaki, R.; Strbac, G. Residential Consumer Attitudes to Time-Varying Pricing; Imperial College London: London, UK, 2014. [Google Scholar]
  28. Friis, F.; Haunstrup Christensen, T. The challenge of time shifting energy demand practices: Insights from Denmark. Energy Res. Soc. Sci. 2016, 19, 124–133. [Google Scholar] [CrossRef]
  29. Alimohammadisagvand, B. Influence of Demand Response Actions on Thermal Comfort and Electricity Cost for Residential Houses. Ph.D. Thesis, Department of Mechanical Engineeering, Aalto University, Espoo, Finland, 2018. Available online: https://aaltodoc.aalto.fi/handle/123456789/33143 (accessed on 2 February 2022).
  30. Alimohammadisagvand, B.; Jokisalo, J.; Sirén, K. The potential of predictive control in minimizing the electricity cost in a heat-pump heated residential house. In Proceedings of the 3rd IBPSA-England Conference, BSO 2016, Newcastle, UK, 12–14 September 2016; Available online: http://www.ibpsa.org/proceedings/BSO2016/p1049.pdf (accessed on 2 February 2022).
  31. Wiekens, C.J.; van-Grootel, M.; Steinmeijer, S. Experiences and Behaviours of End-Users in a Smart Grid: The Influence of Values, Attitudes, Trust, and Several Types of Demand Side Management. In Proceedings of the BEHAVE2014—Behavior and Energy Efficiency Conference, Oxford, UK, 3–4 September 2014; Available online: https://www.researchgate.net/publication/270586399_EXPERIENCES_AND_BEHAVIORS_OF_END-USERS_IN_A_SMART_GRID_THE_INFLUENCE_OF_VALUES_ATTITUDES_TRUST_AND_SEVERAL_TYPES_OF_DEMAND_SIDE_MANAGEMENT (accessed on 2 February 2022).
  32. Torstensson, D.; Wallin, F. Potential and barriers for demand response at household customers. Energy Procedia 2015, 75, 1189–1196. [Google Scholar] [CrossRef] [Green Version]
  33. Nicolson, M.L.; Fell, M.J.; Huebner, G.M. Consumer demand for time of use electricity tariffs: A systematized review of the empirical evidence. Renew. Sust. Energ. Rev. 2018, 97, 276–289. [Google Scholar] [CrossRef]
  34. Todd, A.; Cappers, P.; Goldman, C.A. Residential Customer Enrollment in Time-Based Rate and Enabling Technology Programs: Smart Grid Investment Grant Consumer Behavior Study Analysis; Ernest Orlando Lawrence Berkeley National Laboratory: Berkely, CA, USA, 2013.
  35. Faruqui, A.; Sergici, S. Arcturus: International Evidence on Dynamic Pricing. Electr. J. 2013, 26, 55–65. [Google Scholar] [CrossRef]
  36. Newsham, G.R.; Bowker, B.G. The effect of utility time-varying pricing and load control strategies on residential summer peak electricity use: A review. Energy Policy 2010, 38, 3289–3296. [Google Scholar] [CrossRef] [Green Version]
  37. Voulis, N.; van Etten, M.; Chappin, E.; Warnier, M.; Brazier, F. Rethinking European energy taxation to incentivise consumer demand response participation. Energy Policy 2019, 124, 156–168. [Google Scholar] [CrossRef]
  38. Yilmaz, S.; Weber, S.; Patel, M.K. Who is sensitive to DSM? Understanding the determinants of the shape of electricity load curves and demand shifting: Socio-demographic characteristics, appliance use and attitudes. Energy Policy 2019, 133, 110909. [Google Scholar] [CrossRef]
  39. Ericson, T. Direct load control of residential water heaters. Energy Policy 2009, 37, 3502–3512. [Google Scholar] [CrossRef] [Green Version]
  40. He, X.; Keyaerts, N.; Azevedoa, I.; Meeus, L.; Hancher, L.; Glachant, J.M. How to engage consumers in demand response: A contract perspective. Util. Policy 2013, 27, 108–122. [Google Scholar] [CrossRef] [Green Version]
  41. Western Power Distribution. SoLa Bristol SDRC 9.8 Final Report; Western Power Distribution: Bristol, UK, 2016. [Google Scholar]
  42. Zhong, H.; Xie, L.; Xia, Q. Coupon Incentive-Based Demand Response: Theory and Case Study. IEEE Transactions on Power Systems 2013, 28, 1266–1276. [Google Scholar] [CrossRef]
  43. Darby, S.; Mckenna, E. Social implications of residential demand response in cool temperate climates. Energy Policy 2012, 49, 759–769. [Google Scholar] [CrossRef] [Green Version]
  44. Global Solar Atlas. Mayotte. Available online: https://globalsolaratlas.info/map?s=-12.823048,45.152076&m=site&c=-12.823048,45.152076,11 (accessed on 4 January 2022).
  45. Farré, M.; Genest, O.; González Cuadrado, L.; Heylen, E.; Andolšek, A.; Gutschi, C.; Peiffer, N.; Sonvilla, P.; Varo López, J.; González Reed, P.; et al. MAESHA-D1.1 Use-Cases Requirements and KPIs Definition; Trialog: Paris, France, 2021. [Google Scholar]
Figure 1. Acceptance of remote control of devices/appliances by a third party.
Energies 15 01338 g001
Figure 2. Indicated interest in different types of tariffs based on a five-point Likert scale.
Energies 15 01338 g002
Figure 3. Average distance of cluster centers from cluster center of innovative cluster 2.
Energies 15 01338 g003
Figure 4. Frequencies of responses on the major motivation in participating in a DR scheme based on a five-point Likert scale.
Energies 15 01338 g004
Table 1. Overview of research question and related questions of the original survey.
TopicResearch QuestionSurvey QuestionsAnswer Options
DLCHow is the acceptance of DLC?How likely would you be to participate in a demand response program?Answers based on a Likert scale of 1 to 5 (1 = “Not at all likely”… 5 = “Very likely”)
Which kind of devices/appliances are preferred for DLC?Which devices/appliances would you be willing to control remotely?Answer possibilities as indicated in Table 2.
Does the option to override the contract influence the acceptance of DLC?To what extent do you think your answers would change to ‘yes’ if you had a weekly option to pause the contract?Answers based on a Likert scale of 1 to 5 (1 = “Not at all likely” … 5 = “Very likely”)
TariffsHow interested are you in the following tariffs?Options presented in Table 3.Answers based on a Likert scale of 1 to 5 (1 = “Not interested at all”… 5 = “Very interested”)
What is the desired time-ahead of notification for price signals?How many hours in advance would you like to receive a notification ahead to any price signals?2 h, 4 h, 6 h, 8 h
Major motivationWhat is the major motivation to participate in DR schemes?To what extent can you identify with the following statements:
  • “The monetary savings are a major motivation for my participation”.
  • “Supporting the energy transition in Mayotte is a major motivation for my participation”.
  • “Being a pioneer in my neighborhood is a major motivation for my participation”.
  • “My personal interest in taking action against climate change is a major motivation for my participation”.
  • “My interest in such programs would increase if my whole neighborhood participated together.”
Answers based on a Likert scale of 1 to 5 (1 = “Completely disagree”… 5 = “Highly agree”)
What is your main motivation for participating in a DR program?
  • Monetary savings
  • Support the energy transition
  • Being a pioneer in the neighborhood
  • Participate in a community project within the neighborhood
What kind of remuneration is desired?To what extent can you identify with the following statements:
  • “Rather than being paid in money, I would prefer it to be spent on beautifying my neighborhood”
  • “Rather than being paid in cash, I would like to receive vouchers for leisure events like cinema tickets or home entertainment subscriptions”
Answers based on a Likert scale of 1 to 5 (1 = “Completely disagree”… 5 = “Highly agree”)
Table 2. Overview of independent variables.
VariableFrequency (%)
Socio-demographic variables
Age
13–2422.6
25–3414.4
35–4423.3
45–5415.1
55–6413.7
65+11
Gender
Male44.5
Female55.5
Other0
Employment status
Employed37.7
Entrepreneur2.7
Not employed (unemployed and housewife/-man)25.3
Student18.5
Retired12.3
Other3.4
Area of residence
Mamoudzou30.1
Dembeni38.4
Kani-Keli19.2
Other12.3
Household size
1 person4.1
2 persons34.9
3–4 persons45.9
5 and more persons15.1
Presence of children in the household
Yes61.6
No38.4
Average monthly household electricity bill
<EUR 8019.2
EUR 80–15071.9
EUR 150–2507.5
>EUR 2501.4
Average monthly household income
<EUR 1.00054.8
EUR 1.000–2.40020.5
EUR 2.400–3.80020.5
EUR 3.800–5.5004.1
>EUR 5.5000
Dwelling characteristics
Tenure type
Rent54.1
Own45.9
Dwelling type
Apartment4.1
House95.9
Appliance ownership
Solar panel3.4
Battery storage0
Electric vehicle0
Air conditioning76.7
Electric boiler6.8
Dishwasher24.7
Washing machine95.9
Tumble dryer3.4
Number of valid responses146
Table 3. Electricity tariffs and explanation included in the survey [26].
Tariff TitleExplanation
Bonus tariffThe price per kWh is fixed at X ct/kWh throughout the year. However, if you use electricity when the supply is high and consumption is low (e.g., in the afternoon or in winter), the DR supplier pays you a bonus of X ct/kWh.
Malus tariffThe price per kWh is fixed at X ct/kWh throughout the year. However, if you consume when the electricity supply is low and consumption is high (e.g., in the evening or in the summer), the DR system supplier charges you a penalty of X ct/kWh.
Dynamic tariffThe price of your consumption is dynamic and therefore varies from hour to hour and from day to day. For example, the price is different between 8 and 9 a.m., between 10 and 11 a.m., etc.
Power tariffYour bill depends on the maximum power demand during the year, instead of on your consumption. For example, if in December you use your air conditioner, charge your electric car, and use other devices at the same time, your total electricity demand will be 20 kW and you will be charged 20 €. If you only demanded 10 kW, you would be charged 10 €.
Progressive tariffThe first kWh consumed are cheaper than those above a certain threshold. For example, you pay 7 ct/kWh for the first 100 kWh and 12 ct/kWh above this threshold.
Fixed tariffEach customer chooses a tariff category and pays a fixed price. For example, the “average consumer with a fixed price” which corresponds to an average consumption of 4,500 kWh pays 900 € per year. In case of a higher consumption, he/she will be charged according to a higher category.
Table 4. Overview of analysis and methods conducted with the survey responses.
Question NumberPurposeVariablesMethod
1. Clusters of DR interestsIdentify and segment various DSR preferencesOverall interest in DR; interest in different DLC options; interest in six tariffsk-means cluster analysis with Tukey’s post hoc test
2. Predicting clustersInvestigate the determinants of the DSR preference patterns reflected in cluster membership
  • Dependent: cluster membership variable
  • Independent: socio-demographic and dwelling characteristics
Multinomial logistic regression
3. Socio-demographics and DLC?Investigate how acceptance of DLC differs across socio-demographic groups
  • Dependent: interests in DLC appliance control
  • Independent: socio-demographic and dwelling characteristics
Chi-square
4. Socio-demographics and interests in tariffs?Investigate how interest in tariffs differs across socio-demographic groups
  • Dependent: interests in tariffs
  • Independent: socio-demographic and dwelling characteristics
ANOVA
5. Socio-demographics and key driver?Investigate how the key driver/motivation differs across socio-demographic groups
  • Dependent: key driver for participating in DR
  • Independent: socio-demographic and dwelling characteristics
ANOVA
6. Desired remuneration and socio-demographic/dwelling characteristicsDetect patterns along socio-demographic and dwelling characteristics and desired remuneration
  • Dependent: desired remuneration/compensation
  • Independent: socio-demographic and dwelling characteristics
ANOVA
7. Timing of notification and socio-demographicsDetect patterns along socio-demographic and dwelling characteristics and the desired timing of notification
  • Dependent: timing (hours) of notification ahead of signal
  • Independent: socio-demographic and dwelling characteristics
Chi-square
Table 5. Results from Chi-square test of independency reporting significant relationship between acceptance of DLC and socio-demographic and dwelling characteristics. C = count, EC = expected count, if no correlation would exist.
AC Switch-On/CurtailmentWater BoilerDishwasherDryer
Professional situationχ2dfpCramer’s Vχ2dfpCramer’s Vχ2dfpCramer’s Vχ2dfpCramer’s V
21.953100.0150.274
NoMaybeYes
CECCECCEC
Employed1313.61116.25555
Business owner0101.241.8
Unemployed109.11110.91617
Student116.7108612.4
Retired14.4105.378.3
Other11.211.532.3
Areaχ2dfpCramer’s Vχ2dfpCramer’s V
17.42360.0080.24418.92260.0040.255
NoMaybeYes NoMaybeYes
CECCECCECCECCECCEC
Mamoudzou1310.820131120.21915.147.52121.4
Dembeni1213.81316.53125.71719.2179.62227.2
Kani-Keli56.948.21912.869.614.82113.6
Other64.465.368.386.233.178.8
Owner vs. tenantχ2dfpCramer’s V χ2dfpCramer’s V
6.85320.0330.2176.21720.0450.206
NoMaybeYesNoMaybeYes
CECCECCECCECCECCEC
Tenant2519.52523.32936.3 712.454.36762.2
Owner1116.51819.73830.71610.633.74852.8
Presence of children χ2dfpCramer’s V
6.15520.0460.205
NoMaybeYes
CECCECCEC
Yes1914.264.96570.9
No14.28.823.15044.1
Housing type χ2dfpCramer’s V
6.59820.0370.213
NoMaybeYes
CECCECCEC
Apartment12.501.452.1
House6058.53432.64648.9
Table 6. Results of series of one-way ANOVA and Tukey’s HSD.
TariffIndicatorAgeProfessional StatusChildrenApartment vs. HouseIncomeHousehold Size
BonusANOVA F, Sig./6.634, <0.001
Tukey’s HSD Mean I-J, Sig./Other vs.
employed −1.372, <0.001
Other vs. business owner −1.350, 0.006
Other vs. unemployed −1.519, <0.001
Other vs. student −1.304, <0.001
Other vs. retired −1.433, <0.001
Means, SD/Employed 4.73, 0.525
Business owner 4.75, 0.5
Unemployed 4.92, 0.277
Student 4.7, 0.609
Retired 4.83, 0.707
Other 3.4, 1.342
MalusANOVA F, Sig.2.291, 0.0497.078, <0.0014.383, 0.03815.811, <0.001 /
Tukey’s HSD Mean I-J, Sig./Employed vs. business owner 1.295, <0.01
Employed vs. other 1.145, <0.012
Business owner vs. unemployed −1.507, 0.002
Business owner vs. retired 1.694, <0.001
Unemployed vs. other 1.357, 0.002
Retired vs. other 1.544, <0.001
//2400–3800 vs. 1000–2400
0.567, 0.026
2400–3800 vs. 3800–5500
1.033, 0.017
/
Mean, SD13–24: 4.24, 0.83
25–34: 4.33, 1.155
35–44: 4.59, 0.701
45–54: 4.73, 0.550
55–65: 4.88, 0.342
65+: 4.54, 0.798
Employed 4.55, 0.741
Business owner 3.25, 2.062
Unemployed 4.76, 0.548
Student 4.37, 0.742
Retired 4.94, 0.236
Other 3.4, 1.140
Yes 4.43, 0.862
No 4.71, 0.653
Apartment 3.33, 1.633
House
4.59, 0.709
<1000: 4.56, 0.709
1000–2400: 4.3, 1.088
2400–3800: 4.87, 0.346
3800–5500: 3.83, 1.169
/
DynamicANOVA F, Sig.3.709, 0.0038.334, <0.0015.850, 0.1713.086, <0.001
Tukey’s HSD Mean I-J, Sig.13–14 vs. 55–65: −0.839, Sig. 0.006

13–24 vs. 65+: −0.814, Sig. 0.19
Employed vs. other 1.691, Sig. <0.001Business owner vs. other: 1.7, Sig. = 0.016
Unemployed vs. student: 0.643, Sig. = 0.016
Unemployed vs. other: 2.065, Sig. <0.001
Retired vs. student: 0.722, Sig. = 0.030
Retired vs. other: 2.144, Sig. <0.001
//
Means, SD13–24 M = 4.06, SD = 1.197
25–34 M = 4.67, SD = 0.577
35–44 M = 4.47, SD = 0.961
45–54 M = 4.64, SD = 0.658
55–65 M = 4.9, SD = 0.308
65+ M = 4.88, SD = 0.864
Employed M = 4.49, SD = 0.814
Business owner M = 4.5, SD = 1
Unemployed M = 4.86, SD = 0.347
Student M = 4.22, SD = 1.121
Retired M = 4.94, SD =0.236
Other M = 2.8, SD = 1.304
Yes M = 4.4, SD = 0.946,
No M = 4.75, SD = 0.667
Apartment M = 3.33, SD = 1.366
House M = 4.59, SD = 0.805
CapacityANOVA F, Sig.3.361, 0.0073.361,
0.004
3.684, 0.057 *
Tukey’s HSD Mean I-J, Sig.13–24 vs. 45–54: −0.561, Sig. 0.033
13–24 vs. 55–65: −0.597, Sig. 0.025
13–24 vs. 65+: −0.634, Sig. 0.027
Student vs. unemployed
−0.532, Sig. 0.024
Student vs. retired: −0.611, Sig. = 0.036
/
Means, SD13–24 M = 4.3, SD = 1.045
25–34 M = 4.67, SD = 0.483
35–44 M = 4.62, SD = 0.739
45–54 M = 4.86, SD = 0.351
55–65 M = 4.94, SD = 0.250
65+ M = 4.66, SD = 0.698
Employed M = 4.862, SD = 0.615
Business owner M = 4.75, SD = 0.5
Unemployed M = 4.86, SD = 0.347
Student M = 4.33, SD = 1.074
Retired M = 4.94, SD = 0.236
Other M = 4.0, SD = 1.225
Yes M = 4.58, SD = 0.779,
No M = 4.8, SD = 0.698
FixedANOVA F, Sig.2.447, 0.037 12.791, <0.001 3.616, 0.015
Tukey’s HSD Mean I-J, Sig./ / 2 people compared to 5 people or more: 0.473, 0.034
Means, SD13–24 M = 4.48, SD = 0.972
25–34 M = 4.25, SD = 0.750
35–44 M = 4.56, SD = 0.746
45–54 M = 4.86, SD = 0.351
55–65 M = 4.90, SD = 0.308
65+ M = 5.00, SD = 0.000
Yes M = 4.52 SD = 0.824
No M = 4.93 SD = 0.260
1 person M = 5 SD = 0
2 people M = 4.88 SD = 0.51
3–4 people M = 4,58, SD = 0.67
5 people or more M = 4.41 SD = 0.02
ProgressiveANOVA F, Sig.2.849, 0.0186.230, <0.0016.126, 0.014
Tukey’s HSD Mean I-J, Sig.13–24 compared to 55–65 0.0617 and 0.033 and vice versaEmployed compared to other 1.055 and 0.014 and vice versa
Unemployed compared to student 0.623 and 0.005 and vice versa
Unemployed compared to other 0.319 and 0.001 and vice versa
Student compared to retired −0.704 and 0.011
/
Means, SD13–24 M = 4.33, SD = 0.99
25–34 M = 4.57, SD = 0.68
35–44 M = 4.59, SD = 0.89
45–54 M = 4.82, SD = 0.39
55–65 M = 4.95, SD = 0.22
65+ M = 4.94, SD = 0.25
Employed M = 4.65 SD = 0.62
Business owner M = 4.25 SD = 0.96
Unemployed M = 4.92 SD = 0.36
Student M = 4.30 SD = 1.03
Retired M = 5.00 SD = 0.00
Other M = 3.60 SD = 1.52
Yes M = 4.53 SD = 0.851
No M = 4.84 SD = 0.458
* Close to considered level of significance (p < 0.05).
Table 7. Mean value of the feature across the different clusters (n = 146).
FeatureCluster 1Cluster 2Cluster 3Cluster 4
Percent of sample8.23938.414.4
Namemoderate DLC, low tariffInnovatorslow DLC, high tarifflow DLC, moderate tariff
Overall mean0.60.90.70.6
Interest in DLC
Interest in DLC mean0.620.860.550.44
PV0.9580.8770.6880.643
Battery0.2920.8770.6340.429
EV0.8330.8330.4820.214
AC switch0.330.8420.3750.738
AC range10.780.6610.714
Water boiler0.2920.9390.3390.357
Dishwasher0.9170.9210.9730.048
Dryer0.330.7720.2230.357
Interest in tariffs
Interest in tariffs mean0.590.930.970.86
Bonus0.7920.9360.9820.881
Malus0.6250.8950.9460.845
Dynamic0.4580.9080.9780.81
Capacity0.5630.9470.9690.893
Progressive0.4790.9520.9820.869
Fix0.6250.9470.9780.857
Table 8. Parameter estimation of the multinomial logistic regression analysis. Reference cluster is cluster 2 (innovators).
Parameter Estimation *
Cluster Number of the Case *Independent
Variable
Std. ErrorBSignificance (at alpha = 5%)Odds Ratio
1Intercept7.05418.9280.007
Age0.450−1.572<0.0010.208
Gender0.866−0.8610.320.423
Professional situation0.330−0.3390.3050.713
Area0.3070.0120.9681.012
Household size0.894−1.5810.0770.206
Children1.459−2.9530.0430.052
Tenant vs. Owner1.2723.3830.00829.466
Housing type
Apartment vs. House
2.077−5.3350.010.005
Electricity expenditure0.7761.8330.0186.25
Income0.925−2.5360.0060.079
2Intercept3.6101.3070.717
Age0.165−0.2430.1410.784
Gender0.4190.1680.6891.183
Professional situation0.175−0.1490.3950.862
Area0.172−0.3830.0260.682
Household size0.355−0.3790.2860.684
Children0.597−0.5030.40.605
Tenant vs. Owner0.541−0.460.3950.631
Housing type
Apartment vs. House
1.3271.60.2284.953
Electricity expenditure0.448−0.0510.9090.95
Income0.349−0.2040.5590.815
3Intercept3.506−24.985<0.001
Age0.278−0.7520.0070.471
Gender0.6330.570.3681.768
Professional situation0.304−0.5170.0890.596
Area0.252−0.110.6610.896
Household size0.586−0.1810.7570.834
Children1.047−1.7380.0970.176
Tenant vs. Owner0.8852.7860.00216.214
Housing type
Apartment vs. House
0.00013.9041,092,175.375
Electricity expenditure0.609−0.4320.4780.649
Income0.607−0.940.1210.391
* The reference category is cluster 2.
Table 9. Correlation between major motivation in participating in demand response schemes and socio-demographic and dwelling characteristics.
Motive Indicator Professional StatusElectricity Expenditure
Financial motiveANOVA F, Sig.2.293, 0.049
Tukey’s HSD Mean I-J, Sig.Student vs. retired
−0.704, 0.031
Means, SDEmployed 4.67, 0.668
Business owner 4.5, 1
Unemployed 4.65, 0.824
Student 4.3, 0.912
Retired 5, 0
Other 4.2, 1.3
Motive energy transitionANOVA F, Sig. 4.217, 0.007
Tukey’s HSD Mean I-J, Sig. <80 EUR/m vs. 80–150 EUR/m −0.379, 0.005
<80 EUR/m vs. 150–250EUR/m −0.464, 0.067
<80 EUR/m vs. >250 EUR/m −0.464, 0.623
Means, SD <80 EUR/m 4.54, 0.999
80–150 EUR/m 4.91, = 0.343
150–250 EUR/m 5, 0
>250 EUR/m 4.85, 0.543
Motive neighborhood projectANOVA F, Sig. 3.537, 0.016
Tukey’s HSD Mean I-J, Sig. < 80 EUR/m vs. 80–150 EUR/m −0.376, 0.015
Means, SD <80 EUR/m 4.5, 1.106
80–150 EUR/m 4.88, 0.385
150–250 EUR/m 5, 0
>250 EUR/m 5, 0
Motive pioneerANOVA F, Sig. 4.512, 0.005
Tukey’s HSD Mean I-J, Sig. <80 EUR/m vs. 80–150 EUR/m
−0.605, 0.003
Means, SD <80 EUR/m 4.21, 1.424
80–150 EUR/m 4.82, 0.515
150–250 EUR/m 4.45, 1.036
>250 EUR/m 5, 0
Table 10. Significant correlation between interest in alternative remuneration schemes and socio-demographic and dwelling characteristics.
RemunerationIndicatorProfessional StatusHousehold SizeChildrenElectricity ExpenditureAge
VoucherANOVA F, Sig.2.374, 0.0424.663, 0.0047.676, 0.0065.966, <0.001
Tukey’s HSD Mean I-J, Sig.Employed vs. other
0.982, 0.08
Retired vs. other
1.2, 0.031
2 vs. 5
0.694, 0.003
<80 EUR/m vs. 80–150 EUR/m
−0.517, 0.009
80–150 EUR/m vs. 150–250 EUR/m
0.747, 0.012
Means, SDEmployed
4.78, 0.712
Business owner
4.5, 1
Unemployed
4.65, 0.889
Student
4.52, 0.849
Retired
5, 0
Other
3.8, 1.304
1
4.33, 1.633
2
4.92, 0.440
3–4
4.69, 0.656
>5
4.23, 1.232
Yes
4.54, 0.889
No
4.91, 0.549
<80 EUR/m
4.32, 1.124
80–150 EUR/m
4.84, 0.502
150–250 EUR/m
4.09, 1.446
>250 EUR/m
5, 0
Neighborhood beautificationANOVA F, Sig. 4.495, 0.0052.957, 0.014
Tukey’s HSD Mean I-J, Sig. <80 EUR/m vs. 80–150 EUR/m
−0,567, 0.002
13.24 vs. 35–44
−0.492, 0.077
13–24 vs. 55–56
−0.727, 0.009
Means, SD <80 EUR/m
4.21, 1.258
80–150 EUR/m
4.78, 0.537
150–250 EUR/m
4.64, 0.674
>250 EUR/m
5, 0
13–24
4.27, 1.069
25–34
4.62, 0.740
35–44
4.76, 0.496
45–54
4.77, 0.528
55–65
5, 0
65+
4.66, 0.764
Table 11. Significant correlation between timing of notification and socio-demographic and dwelling characteristics.
Timing of Notification AheadHousing Type
χ2dfpCramer’s V
9.28130.0260.252
ApartmentHouse
CECCEC
2 h00.92120.1
4 h22.76463.3
6 h01.23028.8
8 h41.22527.8
Publisher’s Note: MDPI stays neutral with regard to jurisdictional claims in published maps and institutional affiliations.

