Article

A Generic Framework for the Definition of Key Performance Indicators for Smart Energy Systems at Different Scales

1
Institute of Electric Power Systems, University of Applied Sciences and Arts Northwestern Switzerland, (FHNW), Klosterzelgstrasse 2, CH-5210 Windisch, Switzerland
2
Institute of Computer Technology, TU Wien, Gusshaus Str. 27-29/e384, AT-1040 Vienna, Austria
3
Department of Computer Science, Electrical and Space Engineering, Luleå University of Technology, Regnbågsallén, SE-97754 Luleå, Sweden
4
Siemens Schweiz AG Smart Infrastructure, Freilagerstrasse 40, CH-8047 Zurich, Switzerland
*
Author to whom correspondence should be addressed.
Energies 2022, 15(4), 1289; https://doi.org/10.3390/en15041289
Submission received: 17 January 2022 / Revised: 2 February 2022 / Accepted: 7 February 2022 / Published: 10 February 2022
(This article belongs to the Special Issue Renewable Energy Integration Toward a Sustainable Energy Transition)

Abstract

:
The growing integration of intermittent renewable energy sources (RESs) and the increasing trend of shutting down fossil-fuel-based power plants has brought about the need for additional flexibility in energy systems. This flexibility can be provided in various forms, including controllable generation and consumption, storage, conversions, and exchanges with interconnected systems. In this context, an increasing focus is placed on the development of smart energy systems (SESs) that combine different types of distributed energy resources (DERs), information and communication technologies (ICTs), demand side management (DSM), and energy conversion technologies. The utilization of SESs can lead to multiple benefits for the stakeholders involved; therefore, the assessment of their performance is a primary concern. Due to their multidisciplinary nature, there are no known or universally accepted standards for assessing the performance of SESs. Previous efforts only define key performance indicators (KPIs) for individual homogeneous subsystems, focusing on a specific SES type and application area. This paper focuses on the development of a novel comprehensive KPI framework that can be applied to any type of SES, regardless of the application area. The proposed framework consists of four layers that specify the application area, the main SES requirements, and the involved stakeholders’ objectives. Next, the KPIs are identified for each of the stakeholders’ objectives. The proposed KPI framework is applied to the use case of a European research project with different application areas, to demonstrate its features. Finally, a repository of KPIs is identified for each use case with respect to the aforementioned SES requirements.

1. Introduction

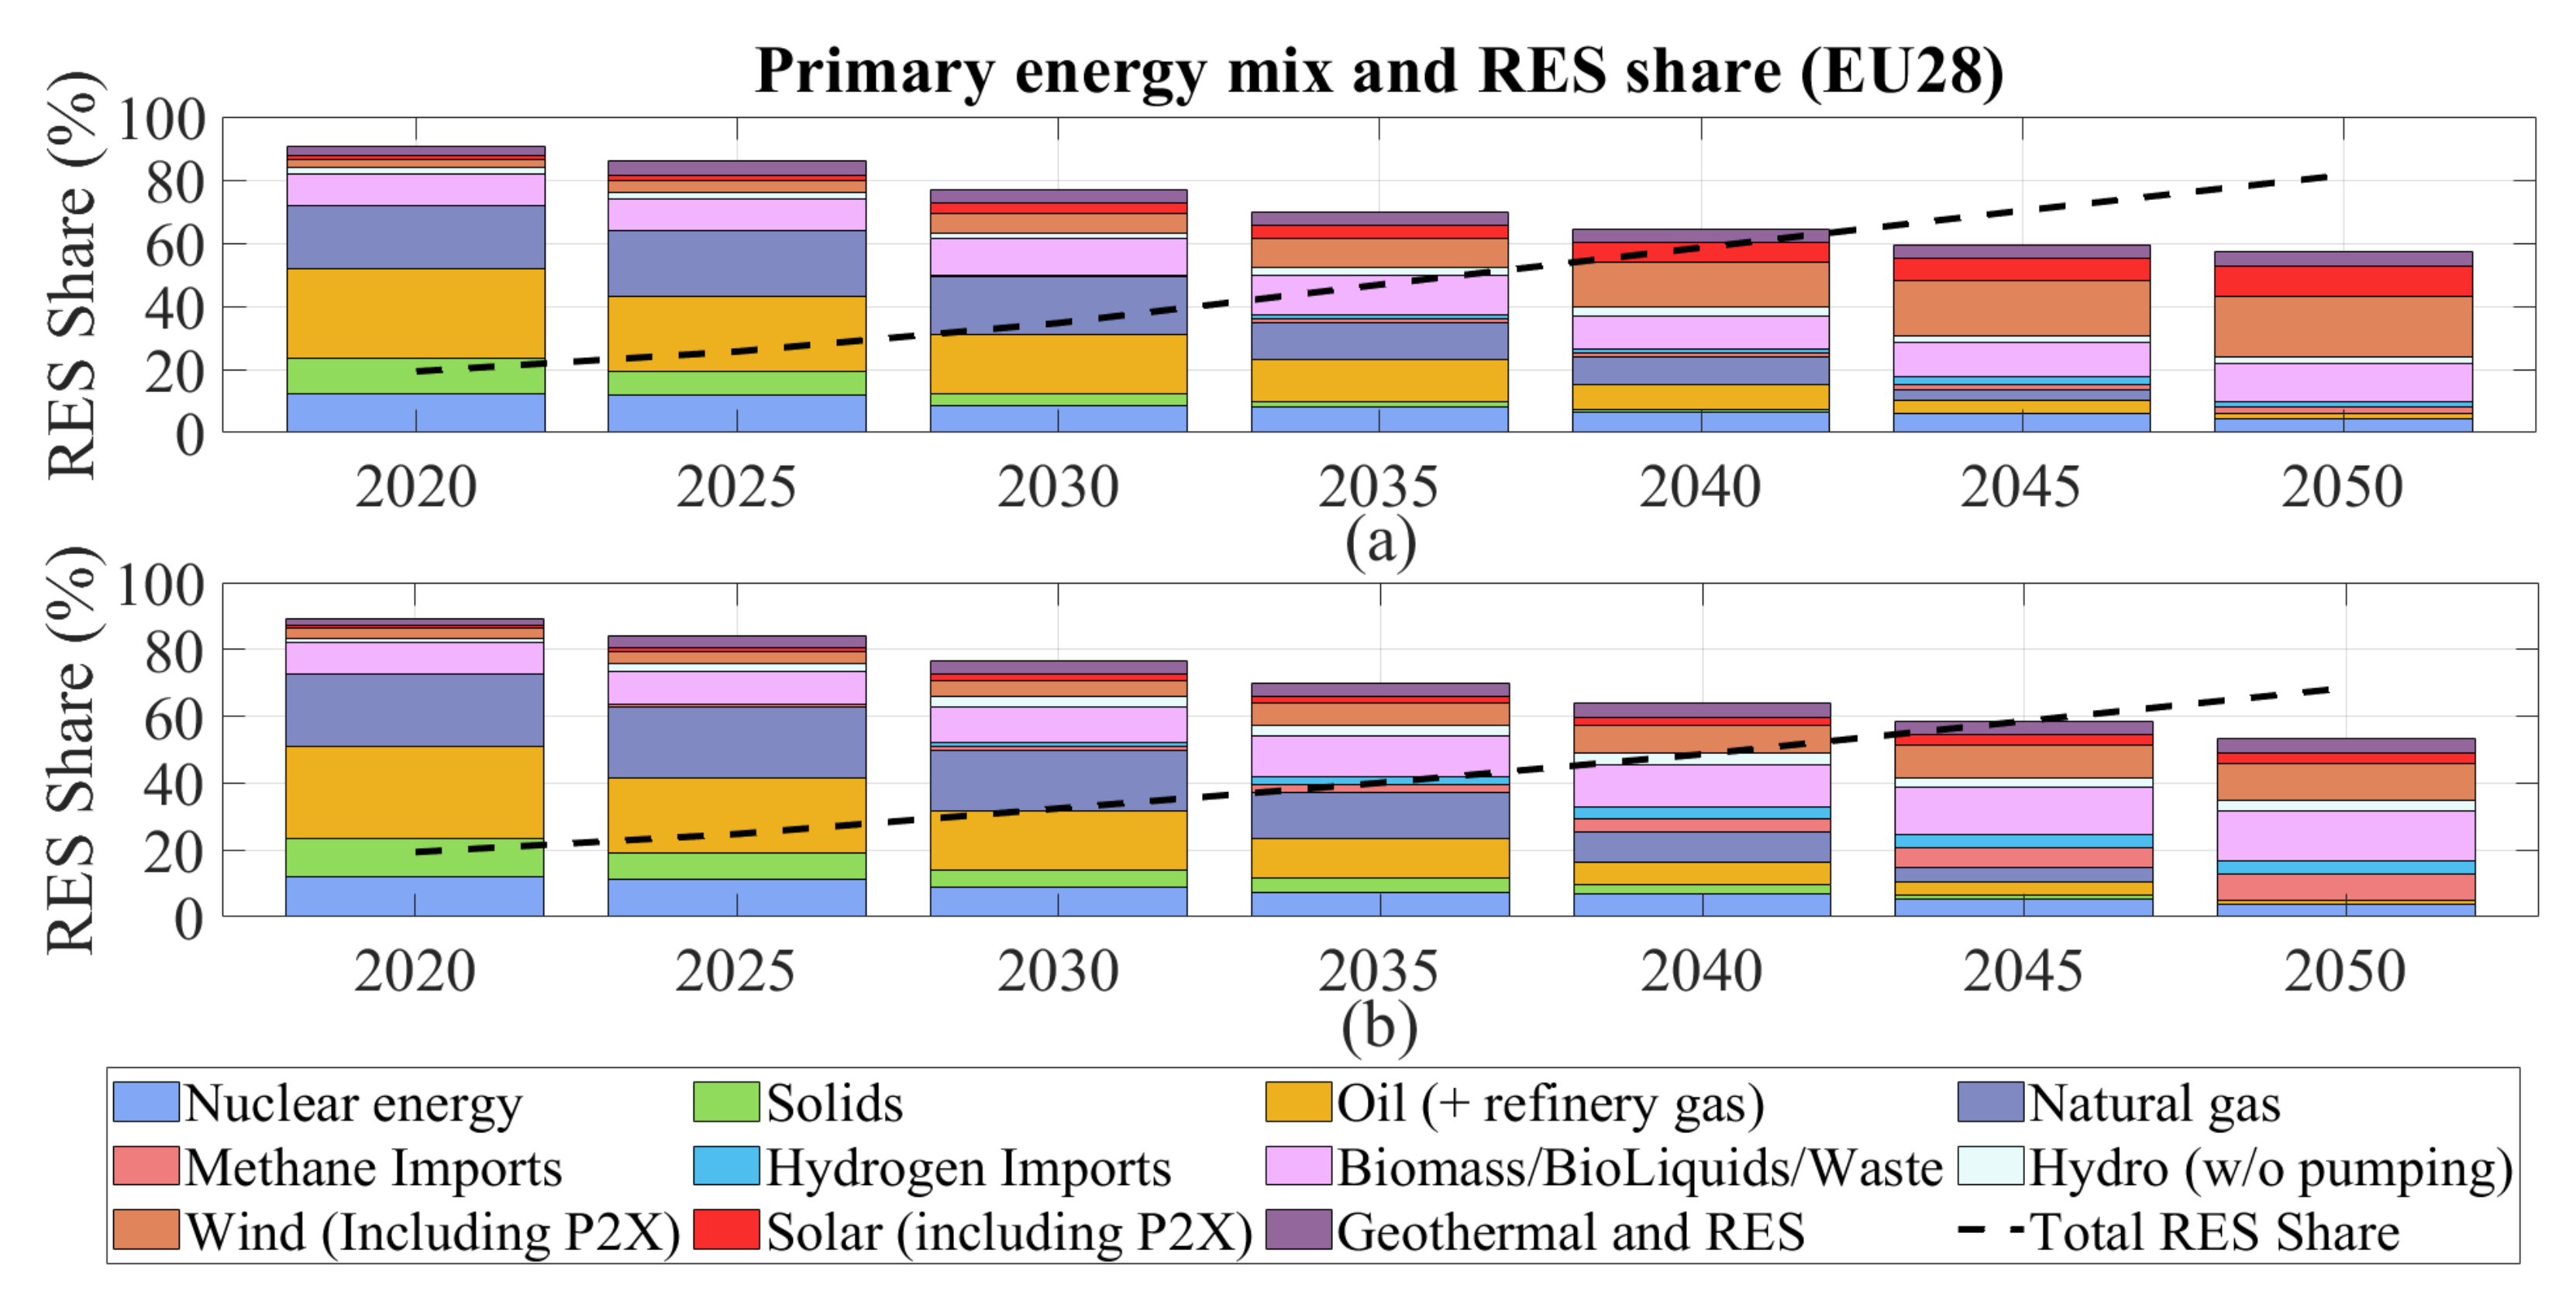
1.1. Smart Energy Systems and Future Trends

One of the main global imperatives in preventing climate change from causing irreversible damage to the planet is to reach net zero carbon emissions by 2050. This necessitates the reduction in energy demand by at least 0.19% per year, and the increasing penetration of renewable energy sources (RESs) to be pushed to above 85% of production by 2050 [1]. In this direction, current energy networks are evolving due to the growing integration of distributed energy resources (DERs). In particular, in 2020, at the European Union 27 (EU-27) level, RESs produced 38% of electrical energy, for the first time overtaking fossil-fired generation, which fell to 37% [2].
Apart from hydropower plants, other RES units, e.g., solar photovoltaics (PVs) and wind farms, require higher flexibility in both time and space to balance power and energy due to their intermittent nature. In addition, the increasing trend of shutting down fossil-fuel-based power plants, e.g., coal- or gas-fired plants, leads to additional decrease in flexibility potential, which is required for the provision of control reserves. The necessary flexibility in the energy system is provided through a combination of different forms, including controllable generation plants and consumption (demand responses), storage, conversions, and exchanges with interconnected systems [3]. Such flexibility forms can defer the deployment of new conventional generation plants, leading to reduced consumption of fossil fuels. As a consequence, an increasing focus is placed on the development of “smart energy systems” (SESs) that combine different DER types, information and communication technologies (ICTs), demand side management (DSM), and energy conversion technologies [4]. SESs are principally referred to “cost-effective, sustainable and secure energy systems in which renewable energy generation, infrastructure and energy consumption are integrated and coordinated through energy services, active users and enabling technologies” [5]. Moreover, an SES can exploit synergies between different energy vectors, such as power, transport, heat, and gas, with the main goal to achieve an optimal solution, not only for each sector, but also for the entire energy system [6]. Hence, by combining the electricity, thermal, and transport sectors, the SES can compensate for the lack of flexibility from RES units. The key expectations for the SESs are to be exergetically sound, energetically secure, environmentally benign, economically feasible, commercially viable, socially acceptable, integrable, and reliable [7].
According to different scenarios (distributed energy (DE) and global ambition (GA)), which are based on the Paris Agreement objective of keeping temperature rise below 1.5 °C, the overall energy mix in EU-28 is expected to become carbon-neutral by 2050. Particularly, the RES share in the GA scenario reaches 69% by 2050, while the DE scenario can achieve a RES share of 82% [8]. In [9], authors also estimate that 83% of EU households could become prosumers by 2050. As shown in Figure 1, the majority of energy in 2050 is expected to stem from renewables—such as wind, solar, and hydro—comprising roughly 52% and 34% of primary energy demand in Europe within the scenarios of DE and GA, respectively. Furthermore, biomass and energy from waste materials can cover 22–28% of the primary energy mix.
The electrification of heat and transport is necessary to decarbonize the energy system. In line with the European targets, different scenarios aim to reduce emissions in both sectors, focusing on the electric vehicles (EVs) and heat pumps (HPs), which have the greatest impact on electricity demand. In [8], the national trends (NT) scenario, based on the EU National Energy and Climate Plan, and external scenarios from third-parties, are also included to broaden the range of possible future trends for EVs and HPs. The DE scenario predicts the highest electrification with 245 million EVs and about 50 million HPs at the EU-28 level by 2040, while the GA scenario assumes a more conservative uptake, reaching 200 million EVs and about 25 million HPs. The NT scenario shows a lower level of ambition for electrification with about 100 million EVs and 30 million HPs by 2040. Though there are differences between the future scenarios, there is a clearly increasing trend for both EVs and HPs, rendering the utilization of SESs necessary for their reliable and secure operation.
The main benefits from the utilization of SESs involve the deferral of investments in network reinforcement and reduced need for additional reserve generation capacity, as well as increased renewable energy use, better health and environmental conditions, climate change alleviation, and optimal energy balancing on a short-term basis [1,7,10]. In a British survey [10], the utilization of SESs is expected to achieve the following: (a) defer investments in grid upgrades by 2050 up to GBP 12 billion; (b) reduce the need for conventional generation, achieving potential savings from GBP 0.5 to GBP 5 billion in 2050; (c) meet binding targets with lower RES capacity, reaching savings from GBP 0.5 to GBP 5 billion; (d) smarten the energy networks, reducing RES curtailment up to 100 TWh per year by 2050; (e) optimize minute-by-minute energy balancing, achieving annual savings of about GBP 1 billion.
Despite the multiple benefits from the implementation of SESs, there are various challenges to be overcome by the involved stakeholders. In case of DSM-based SESs, modeling of customer behavior, forecasting of load demand, as well as attractive pricing schemes and incentives for the end users, can cause barriers to the engaged energy service provider [10]. The main concern for the system operators is that the high integration of RES-based generators can decrease the inertial response of power systems due to the lack of rotating mass endangering the network reliability and stability [11]. In addition, system adequacy issues raised by load and RES generation uncertainties can arise more frequently. Policy and regulatory barriers also prevent the integration of SESs, since the energy policy and regulatory frameworks have been designed around the traditional power generation system. Moreover, benefits by SESs are not always monetized due to the lack of appropriate markets, undermining their investment business case. In terms of sociocultural barriers, the lack of customer awareness about the benefits of SESs can also delay their implementation [12]. Other obstacles are related to technology risk, in cases of missing technical standards for innovative technologies, interoperability issues, and limitations in data exchange due to data privacy and security policies.

1.2. The Role of KPIs and Background of KPI Frameworks for SESs

Due to the plethora of benefits and challenges to be considered when implementing the SESs, the assessment of their performance is usually a complex procedure. Despite the growing interest for SES projects and initiatives, the evaluation and measurement of their outcomes can face various challenges due to prodigious data processing demands and heterogeneity of connected smart components. The SESs cover a variety of heterogeneous subsystems with largely varying applications within the system; however, most assessment techniques exist only for subsystems of SESs [13]. Moreover, there are no known or universally accepted standards defining and measuring the performance of SESs [14]. Assessment frameworks enabling a comprehensive evaluation of SESs are required to quantify the value proposition of SES projects, as well as the initiatives and benefits delivered to the different stakeholders involved in their deployment. In this regard, various criteria, such as environmental impact, system efficiency, cost effectiveness, and resource utilization, are considered for the evaluation of their energetic, exergetic, environmental, and economic performance [7].
To support the monitoring of relevant projects and initiatives, key performance indicators (KPIs) can be a universal instrument to evaluate the progress of SES deployments. KPIs are performance metrics explicitly linked to a strategic objective translating strategy execution into quantifiable terms. Hence, they can provide visibility of the SES performance and enable the involved stakeholders to take action to ensure or accelerate achievement of the desired outcomes. The need for a uniform monitoring of SES performance has led to the proposal of different approaches for the development of KPI frameworks [12,15,16,17,18,19,20,21]. Since there is no standardized approach to evaluate SESs of different spatial scales, most existing tools are developed for the specific use cases and scenarios of each project. Various methodologies follow a macroscopic approach, considering a specific application area (building, community, city, or region) as an entire system, without examining the performance of each SES [12,17,18,19]. In addition, frameworks reported in the literature may be developed for specific spatial levels, for instance, building [16] and community–district [12,18,21]. Other approaches do not consider the impact of the examined SES on energy networks [15,17,21]. In several cases, authors identify the KPIs based on general thematic domains, such as technical, environmental, economic, and social aspects, and not on the involved stakeholders’ objectives [12,17,20,21]. In terms of the stakeholders, various references do not include system operators and energy service suppliers in the target groups [17,21]. Consequently, there is a need to develop a generic assessment tool to measure the performance of SESs, regardless of their application area, mapping the involved stakeholders’ objectives with the defined KPIs.

1.3. Main Contributions and Paper Structure

The main purpose of this paper is to present a generic KPI framework for defining the repository of KPIs for different SES types with respect to the SES requirements and the main stakeholders’ goals. In cases where multiple SESs exist in the application area, the framework will be able to evaluate the impact of each individual SES on the stakeholders’ objectives. In this manner, robustness is also assured, considering the multidisciplinary nature of SES technologies. To the best of the authors’ knowledge, no similar assessment framework exists in the relevant literature. In addition, the proposed approach is differentiated from other reported frameworks for the following reasons:
  • emphasis is given to integrating all relevant stakeholders involved in the deployment and operation of SESs;
  • the methodology is based not on general thematic domains, but on mapping between the key SES requirements and the involved stakeholders’ objectives;
  • the framework can be applied in application areas of different spatial scales.
The proposed methodology is adopted in the context of the EU-funded research project SONDER [22]; however, the ultimate goal is to be applied to a wide variety of relevant SES projects of the joint programming initiative ERA-Net Smart Energy Systems.
The structure of the paper is organized as follows: Section 2 provides the methodology developed for the generation of KPIs, defining the groups of stakeholders, application areas, SES requirements, and the stakeholders’ objectives. Section 3 presents the use cases whose SESs are assessed, followed by the KPIs that are identified for each use case in Section 4. Finally, Section 5 provides a brief summary and next steps of future work.

2. KPI Methodology

The proposed KPI methodology aims to evaluate and optimize the operation of SESs, operating on a building, community, city, or regional level. The KPI framework is intentionally generic, so as to satisfy various assessment requirements of different SES technologies. The procedure for the determination of suitable KPIs is based on four layers, which are required for the definition of application area, involved stakeholders, SES requirements, and stakeholders’ objectives, as shown in Figure 2. Moreover, the KPI framework is developed according to a top–down approach. The top–down approach can relate a generic SES requirement with the stakeholders’ objectives, which can be quantified with various indicators. The SES requirements are considered as main thematic areas that are subdivided into functional stakeholders’ objectives, which are quantified through the defined KPIs. This representation can offer depth, coherence, and clarity, and sums up complex generic criteria with different KPIs. The procedure of collecting KPIs comprises operations of matching, grouping, and ranking information, considering the requirements of the different stakeholders involved in each SES deployment. Though the KPIs can also be defined by another frameworks, the proposed methodology can be adjusted with respect to the application area, SES type, and stakeholders engaged.
Generic SES requirements are defined for six areas of interest, as follows: (a) network operation optimization, (b) improved network development, (c) increased flexibility, (d) enhanced system feasibility, (e) improved interoperability, and (f) improved model accuracy. The selection of the aforementioned areas was carried out with the main goal to establish an assessment tool that covers the majority of the issues that need to be addressed for the deployment of various SESs. The proposed categorization was developed with a view to provide a holistic evaluation considering all necessary SES aspects.
For the stakeholders involved in the SES operation, their main objectives are determined with respect to the SES requirements. This activity leads to a definition of proper criteria based on stakeholders’ priorities and can be different for each project. At the final step, the KPIs for each of the stakeholders’ objectives are defined. Each final KPI is related to a specific stakeholder’s objective in order to evade possible overlaps of the stakeholders’ objectives when calculating the KPIs. In addition, a conflict of interest may exist for objectives that have opposite impact on a specific KPI. In such cases, the final value of the KPI is determined considering both impacts; hence, the conflicting interests are taken into account in a common KPI. In practice, a KPI may be affected by more than one objective; however, we elect to connect the KPI with the most relevant objective, in order to limit the framework complexity. Hence, the selection methodology leads from general SES requirements to final KPIs, following the top–down approach. The utilization of quantitative indicators is valuable not only to describe and assess, as accurately as possible, the individual characteristics of an SES, but also to compare the performance of available SES technologies designed for the same scope. Due to the vast number of potential indicators that can be included in the repository of a KPI framework, a filtering procedure is required based on a series of fundamental criteria identified from the literature. In particular, the KPIs should be characterized by relevance, completeness, availability, measurability, reliability, familiarity, complementarity, non-redundancy, and their benchmarkable capacity [20,23].
Apart from the definition of KPIs, their thresholds and targets should also be determined in order to quantify the main objectives of the SES application. The thresholds can define an allowable range for the KPI values, and they can be determined by relevant standards, extreme use cases, or the business as usual (BAU) scenario. Since most KPI thresholds cannot be specified by standards, it is of the utmost importance to compute the KPI in the BAU scenario without the SES application. The extreme use cases can also determine the upper and lower thresholds of the KPI for the investigated BAU scenario without the SES application. Next, the test implementation can evaluate the SES performance comparing the calculated KPI with the two limits, when utilizing the SES. In case that thresholds cannot be defined through the aforementioned procedures, either typical values can be obtained by previous estimations of the literature, or commonly used assessment methods, e.g., the Likert scale, are applied [23]. The targets can differ from the thresholds, since the thresholds may represent the minimum and maximum values that do not correspond to the optimal ones. Targets are often set using arbitrary methods, values from the literature, or by simulating the optimal SES operation. In addition, targets can be helpful when defining thresholds, as thresholds correspond to a margin determined with respect to the target. Consequently, the derivation of different zones for the KPI, based on both targets and thresholds, can increase the transparency of the SES performance. In this direction, the utilization of traffic light indication systems can help the demonstrators monitor the KPI status (normal, low, medium, high, and critical) and set trigger conditions for alerts and warnings [24].
In the literature, various categorizations are reported for the KPIs, with respect to technical, economic, environmental, legal, and social/policy aspects [18], or according to different levels, such as the technology, system, and market levels [20]. The proposed framework divides the KPIs into thematic pillars that originate from the stakeholders’ objectives and can include the aforementioned areas of interest. In the remainder of this section, each layer of the KPI framework is presented.

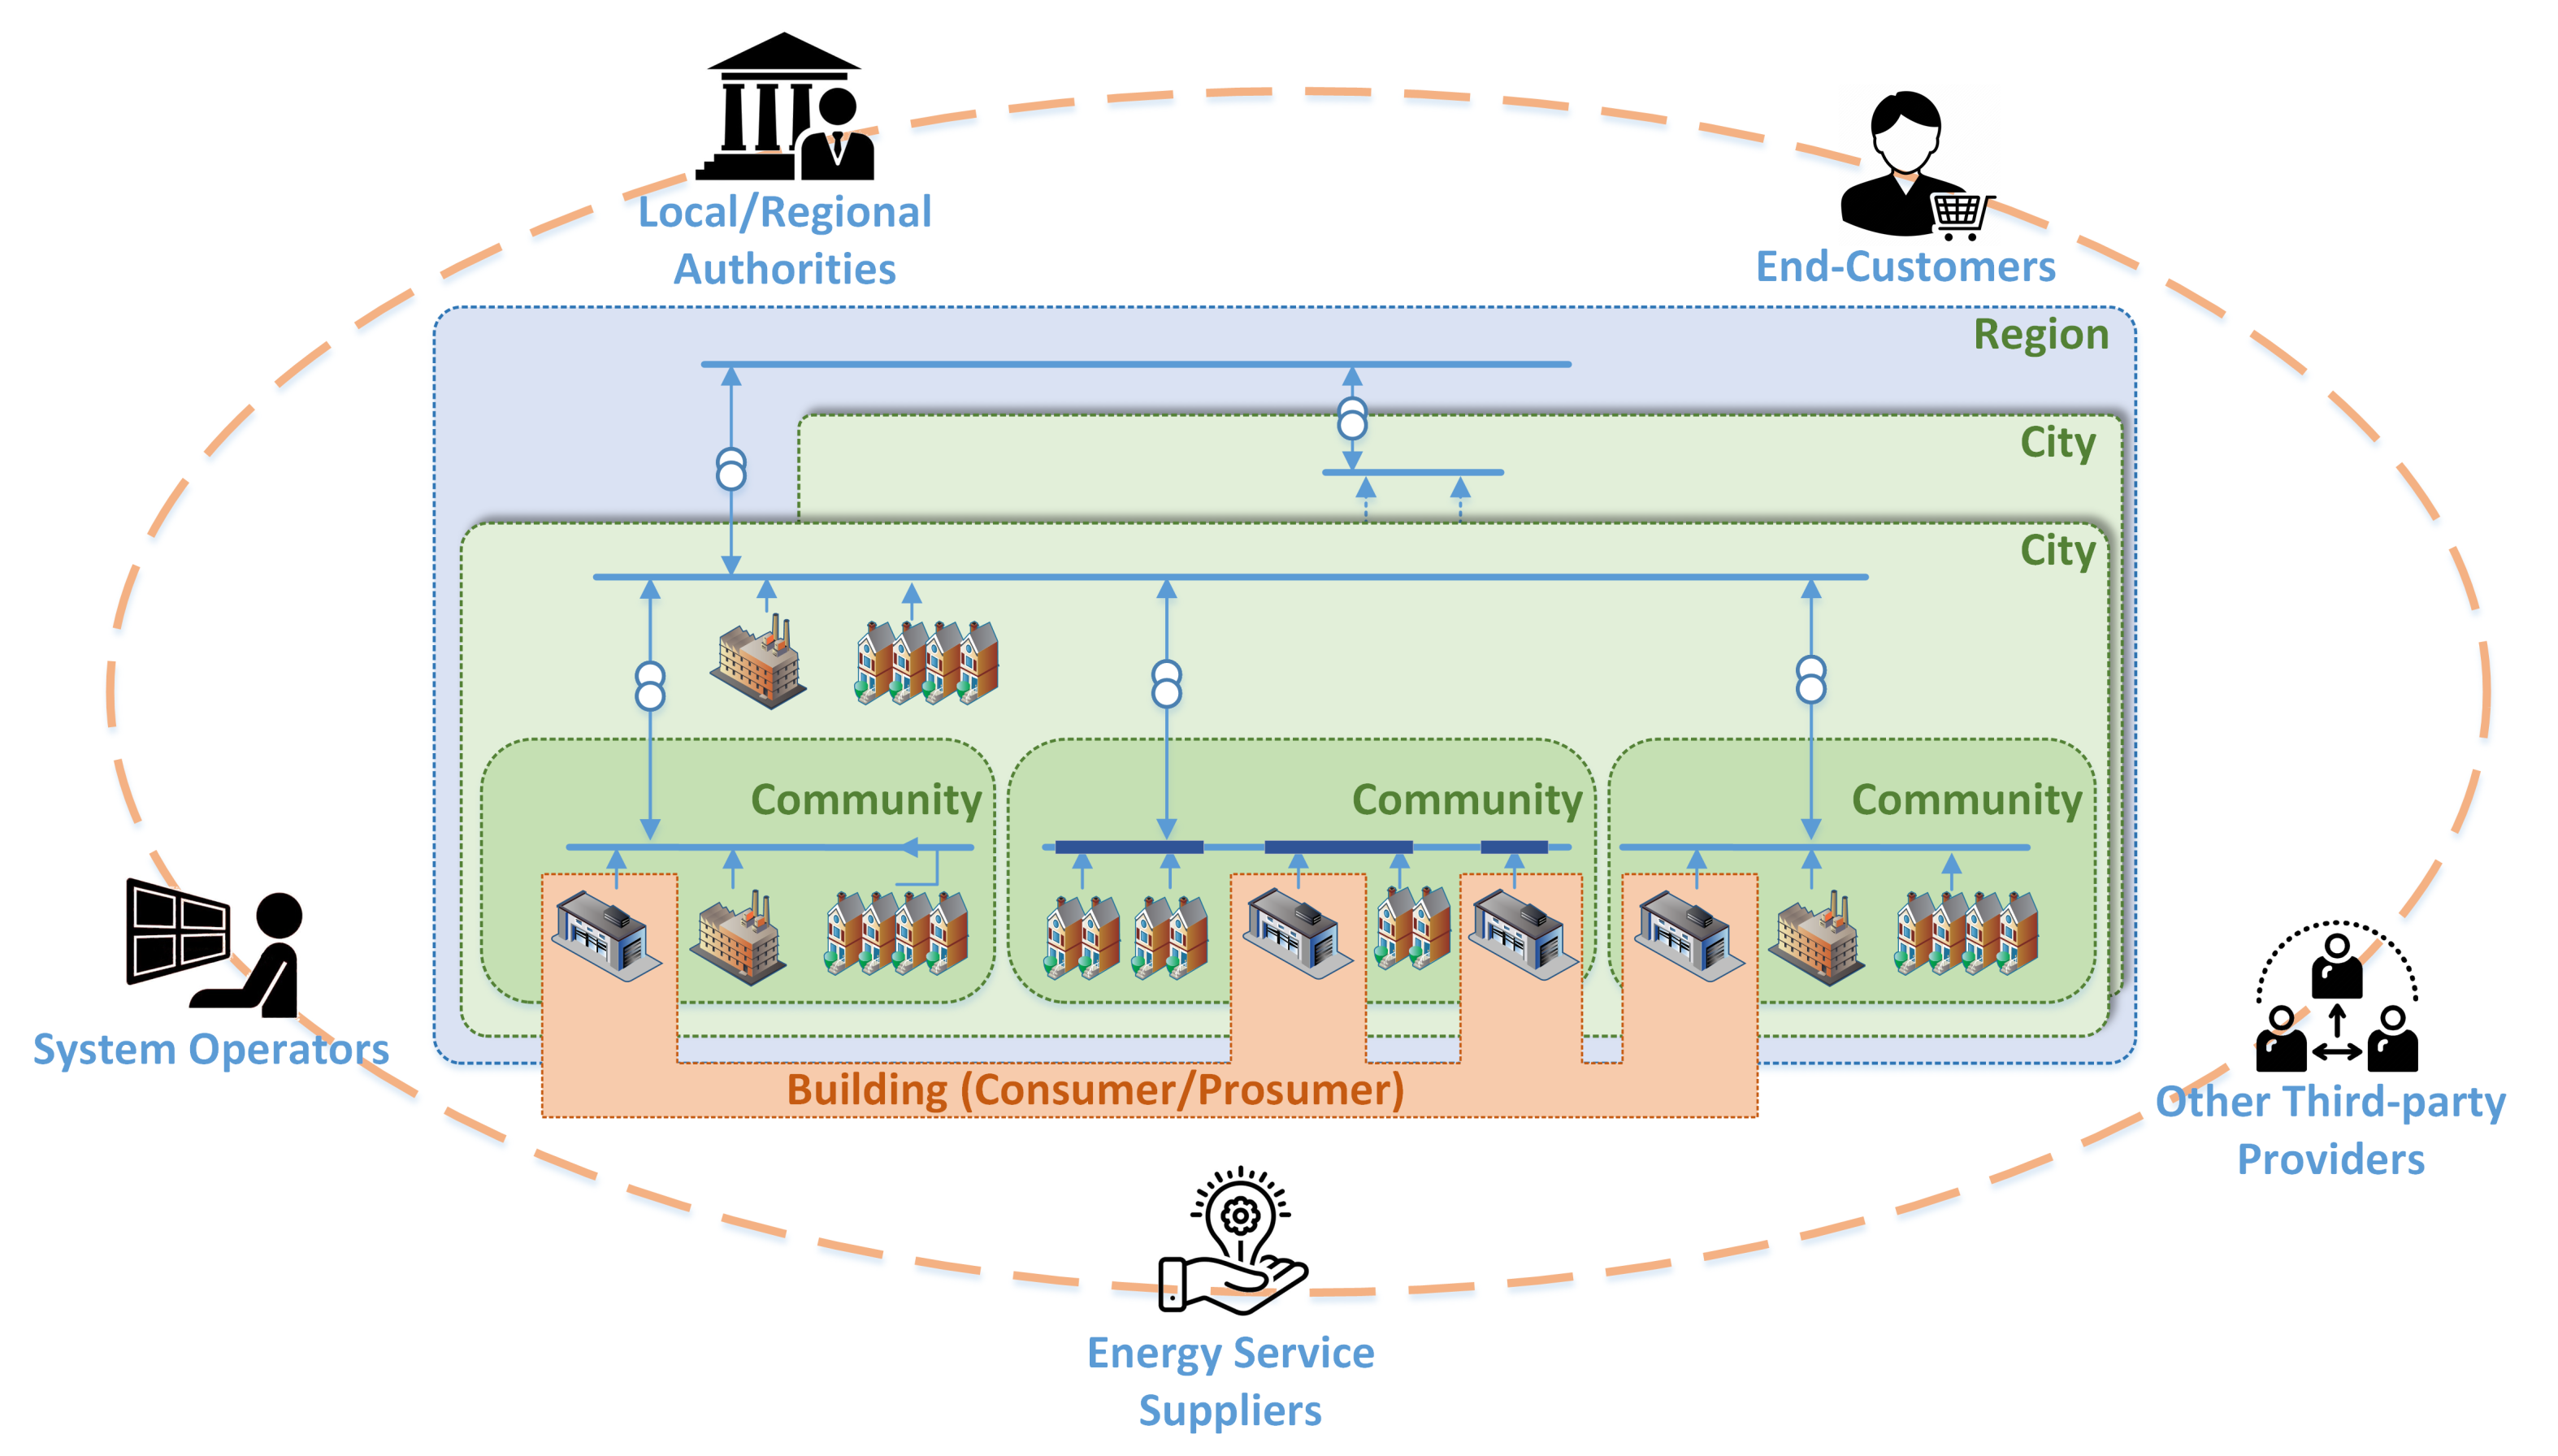
2.1. Main SES Application Areas

The assessment of SESs with the utilization of KPIs entails different spatial levels that vary from a single building to a community, city, or region, as shown in Figure 3.

2.1.1. Building

Buildings account for about 40% of the total energy demand and 36% of the CO2 emissions in Europe; hence, they possess one of the highest untapped potentials for energy management [25]. In this direction, the implementation of nearly zero-energy buildings (nZEBs) is required for all new buildings by 2020 in Europe [6]. The energy used in nZEBs is provided by on-site or nearby RES units. This transition to an nZEB level for all buildings can also contribute on the mitigation of grid stress, reduction in greenhouse gases (GHGs) and energy bills, and better living conditions.

2.1.2. Community

The term “community” represents a group of energy users that decide to act collectively instead of individually because of their proximity to one another, so that the activities can provide services or other benefits to the community members [26]. Focusing on the spatial proximity, a community is placed in a small locality, where people spend a continuous portion of their time, though the term can be scaled up to higher spatial levels [27]. In the energy sector, the term “energy communities” (ECs) has been debated extensively; therefore, the Clean Energy Package has introduced two slightly different types of communities: citizen energy community (CEC) and renewable energy community (REC) [28]. Both types of communities provide a framework for citizens, small- and medium-sized enterprises (SMEs), and local authorities to develop a non-profit entity through which they can collectively produce, purchase, sell, and store energy, providing various forms of energy services to the community shareholders or members. ECs are involved in DG and in performing activities of a DSO, energy service supplier, or aggregator at local level, including cross-border activities [29]. Various SES technologies, e.g., generation assets, energy management systems, and ICTs, can be integrated into EC systems and can be owned by single or multiple parties, including the community and utility and other public or private companies. ECs usually serve a small neighborhood of households; however, they may cover a wider geographic area and a variety of load types [30]. ECs provide various solutions to their members with respect to self-consumption combined with storage, peer-to-peer energy trading, energy balancing, and electromobility [28,30]. ECs can also cooperate with system operators to increase the grid resilience by benefiting from DR aggregation—providing flexibility and deferring grid reinforcements [30,31].

2.1.3. City

Cities house 50% of the world’s population and are responsible for 75% of the global energy consumption [30]. Hence, the cities need to encourage responsible energy consumption—the local production and consumption of renewable energy—so as to increase energy efficiency and to reach energy autonomy. In this direction, the “smart city” concept is used as a holistic approach to cities that use new technologies to ensure sustainable economic growth and a high quality of life, with a wise management of natural resources [32,33]. Cooperation between different stakeholders, e.g., public administration, entrepreneurs, research and development, non-governmental organizations, and citizens, is needed for the implementation of smart cities. In smart cities, SESs can include the areas of generation, storage, infrastructure, facilities, and transport [34]. In this context, state and power management authorities focus on smart control over public lighting, reduced energy consumption in public buildings, deployment of RES-based EV charging stations, and district heating/cooling networks, based on renewable and waste heat recovery systems [30,32]. Consequently, the implementation of SESs at city level can decrease the carbon footprint, providing better living conditions.

2.1.4. Region

The collaboration of local authorities for the development of plans, which cover a wider range of people, places, and issues, can contribute on the conceptual transition from a city to a regional level. Hence, a focus on regions can seek solutions that benefit not only major cities, but also their surrounding towns, villages and rural areas, moving towards broader economic, social, and environmental objectives of planning [35]. According to [33], smart regions require the innovation of sustainable planning approach at the regional level in the context of national development strategies. Moreover, they should be considered in relation to their individual components, whose contents and methods could be applied and declined in various spatial contexts with respect to their location and/or scale [32]. The stakeholders engaged in the development of smart regions include authorities and system operators, as well as end customers and other third-party entities. SESs deployed at buildings, communities, or cities can also be applied at regional level. On the global scales, the implementations of SESs are yet in a small regional scale, since more projects are deployed at the community level [36]. Depending on the regional type, relevant instances of SESs are typically limited in remote areas (e.g., islands), small urban areas (e.g., smart buildings, campuses), and industrial areas [36].

2.2. Main Groups of Stakeholders

The assessment of SESs becomes more meaningful when the various perspectives and requirements of the relevant key stakeholders are examined. The main categories that are described below comprise all the types of traditional and additional stakeholders that are engaged in the development and operation of SESs from customer level to region level. According to their level of interest and impact on SESs, the following main groups can be identified: (a) system operators, (b) energy service suppliers, (c) end customers, (d) local/regional authorities, and (e) other third-party providers.

2.2.1. System Operators

System operators comprise both the network and market operators, while the network operators include the distribution system operators (DSOs) and the transmission system operators (TSOs); market operators (MOs) can also be referred to as TSOs or as other independent system operators (ISOs) [37]. DSOs are responsible for the active management and operation of distribution grids [38,39]. TSOs are responsible for the active management and operation of transmission grids. As for the MOs, they mostly refer to an entity which handles the process of accepting bids for energy production and consumption, and matching supply and demand between the wholesale energy market and the market participants. The MOs perform certain roles in the electricity market, such as balance management, recording of closed contracts, and operational forecasting, as well as market balancing and imbalance settlement.

2.2.2. Energy Service Suppliers

This category includes the following groups of stakeholders: (a) energy producers, (b) energy suppliers, (c) aggregators, (d) balance responsible parties (BRPs), (e) microgrid operators, (f) asset owners, and (g) local energy cooperatives. The main role of energy producers is to feed energy into the grid [40]. Energy producers make profit by selling their produced energy to the market. Energy suppliers sell the wholesale energy they purchase from energy traders forward to end customers. Aggregators are market participants that can pool small-scale independent producers, consumers, and/or prosumers, together with the main goal to optimize the use of their installations [40]. BRPs are also referred to as balancing groups or load serving entities and keep supply and demand in balance, in commercial terms, for the portfolio of producers, suppliers, traders, aggregators, and prosumers [41]. Microgrid operators are independent entities or utility customers that are responsible for the safe operation of a microgrid, consistent with applicable interconnection rules and any operating agreement [31]. EV charging infrastructure operators, e-mobility service providers, EC operators, and other facility managers belong to this category. Asset owners regard single or multiple parties, including utilities and public or private entities that own energy and infrastructure components of an SES installation. Finally, the local energy cooperatives are the most common forms of local energy communities that consist of various SESs with the main goals of producing, selling, consuming, or distributing energy or other related services [42].

2.2.3. End Customers

End customers are natural or legal persons that purchase and consume any form of energy, e.g., electricity, gas, and heat, for their own purposes. End customers are also known as consumers or end users, and traditionally can be divided into three main categories: (i) residential, (ii) commercial, and (iii) industrial. The residential sector includes single-family and multi-family buildings, and the highest potential of their energy consumption is required for space heating and cooling, lighting, water heating, appliances, and electronics. The commercial sector is very diverse and includes buildings of SMEs, government facilities, service-providing facilities and equipment, and other public and private organizations, ranging in size from a few thousand to millions of square feet per building. The main single uses of energy in the commercial sector are needs for space heating, space cooling, and lighting purposes. The industrial sector is highly diverse, composed of a wide variety of small, medium, and large facilities. Industrial customers use energy for processing, producing, or assembling goods, including diverse industries, such as manufacturing, mining, agriculture, and construction. At a customer level, the term “prosumers” has also been established for active customers that both consume, produce, and/or sell energy, self-generated within their premises.

2.2.4. Local/Regional authorities

Authorities involved in the deployment of SESs include policy makers, legislation bodies, regulators, or other local, regional, and national governments. Policy makers or policy-making bodies, which exist on local, national, and EU levels, enforce policies through directives, regulations, and decisions, as well as provide recommendations and opinions that can be considered by authorities as a voluntary basis. They encourage pilot programs to work as a test bed and disseminate results from the operation of SESs. Policy-making bodies should also ensure that the vast amount of data generated during the implementation and monitoring of SESs are organized, utilized, and secured according to the existing regulatory frameworks. Regulators and legislation bodies provide the basis of the regulatory and legislative frameworks, which are responsible for the determination of the quality standards and the basic rules, ensuring the normal and steady operation of the energy markets and networks. Such bodies monitor the development of SESs to ensure that their development is not hindered, providing adequate incentives for their investment. Local, regional, and national governments take stock of the existing legal forms for the establishment of SESs and eliminate any unnecessary barriers for their rollout. Governmental bodies also have potential to inform citizens about the benefits and necessity of SESs with respect to consumer-oriented issues, e.g., affordability, privacy, cyber security, and safety.

2.2.5. Other Third-Party Providers

Other third-party providers include technology providers, non-governmental and non-profit organizations, knowledge institutes, or other associations in energy sector. In the category of technology providers, equipment manufacturers, e.g., vendors of storage systems, EVs, or other DERs, as well as the ICT industry and software developers, are involved. Equipment manufacturers are a key stakeholder for the provision of hardware required for the deployment of SESs. The ICT companies are responsible for the development of software products that enable all the SES components to communicate in a smart way. Software developers are also needed for the development of efficient energy management systems integrating innovative software algorithms into their products. The various knowledge institutes, e.g., universities and research centers, support the development of knowledge and various technologies required for the deployment of SESs. Scientists have the opportunity to understand the state-of-the-art SESs and expand the research in respective fields. Associations are a suitable structure for different types of groups with a common purpose, and are considered as non-profit entities, since their main goal is not to have financial benefits, though all profits must return to the association [31]. Energy associations stay up to date with market developments for SESs, as successful innovations can be disseminated to their members.

2.3. SES Requirements—Stakeholders’ Objectives

Table 1 summarizes the main SES requirements and their mapping to each stakeholder objective. The stakeholders interested in each objective are also highlighted. As there are many different stakeholders that can be involved in an SES project, collaboration and discussion among them is required for the deployment and operation an SES. The challenge lies in the fact that the stakeholders may be responsible for different areas and have different interests in the implementation of an SES. System operators focus on the security of supply, ensuring high energy efficiency and network reliability, while the end customers are mainly interested in their optimal energy management and, hence, high cost savings. IT-enabled SESs may allow cyber attacks, or data exchange between the energy service supplier and other third parties, with privacy concerns arising on the customers’ side. End customers are usually engaged with service contracts with an energy retailer, restricting their options in open markets and, thus, reducing competition. Dynamic tariffs may also transfer the risk of the market volatility to the customers, especially when no appropriate resources exist to take advantage of dynamic prices. In case of DSM-based SESs, there is always a trade-off between customer convenience and the benefits offered by the aggregator due to load shifting. Though numerous more conflicts of interest may arise in the context of SES deployments, focus is given below on the definition of stakeholder objectives for each SES requirement.

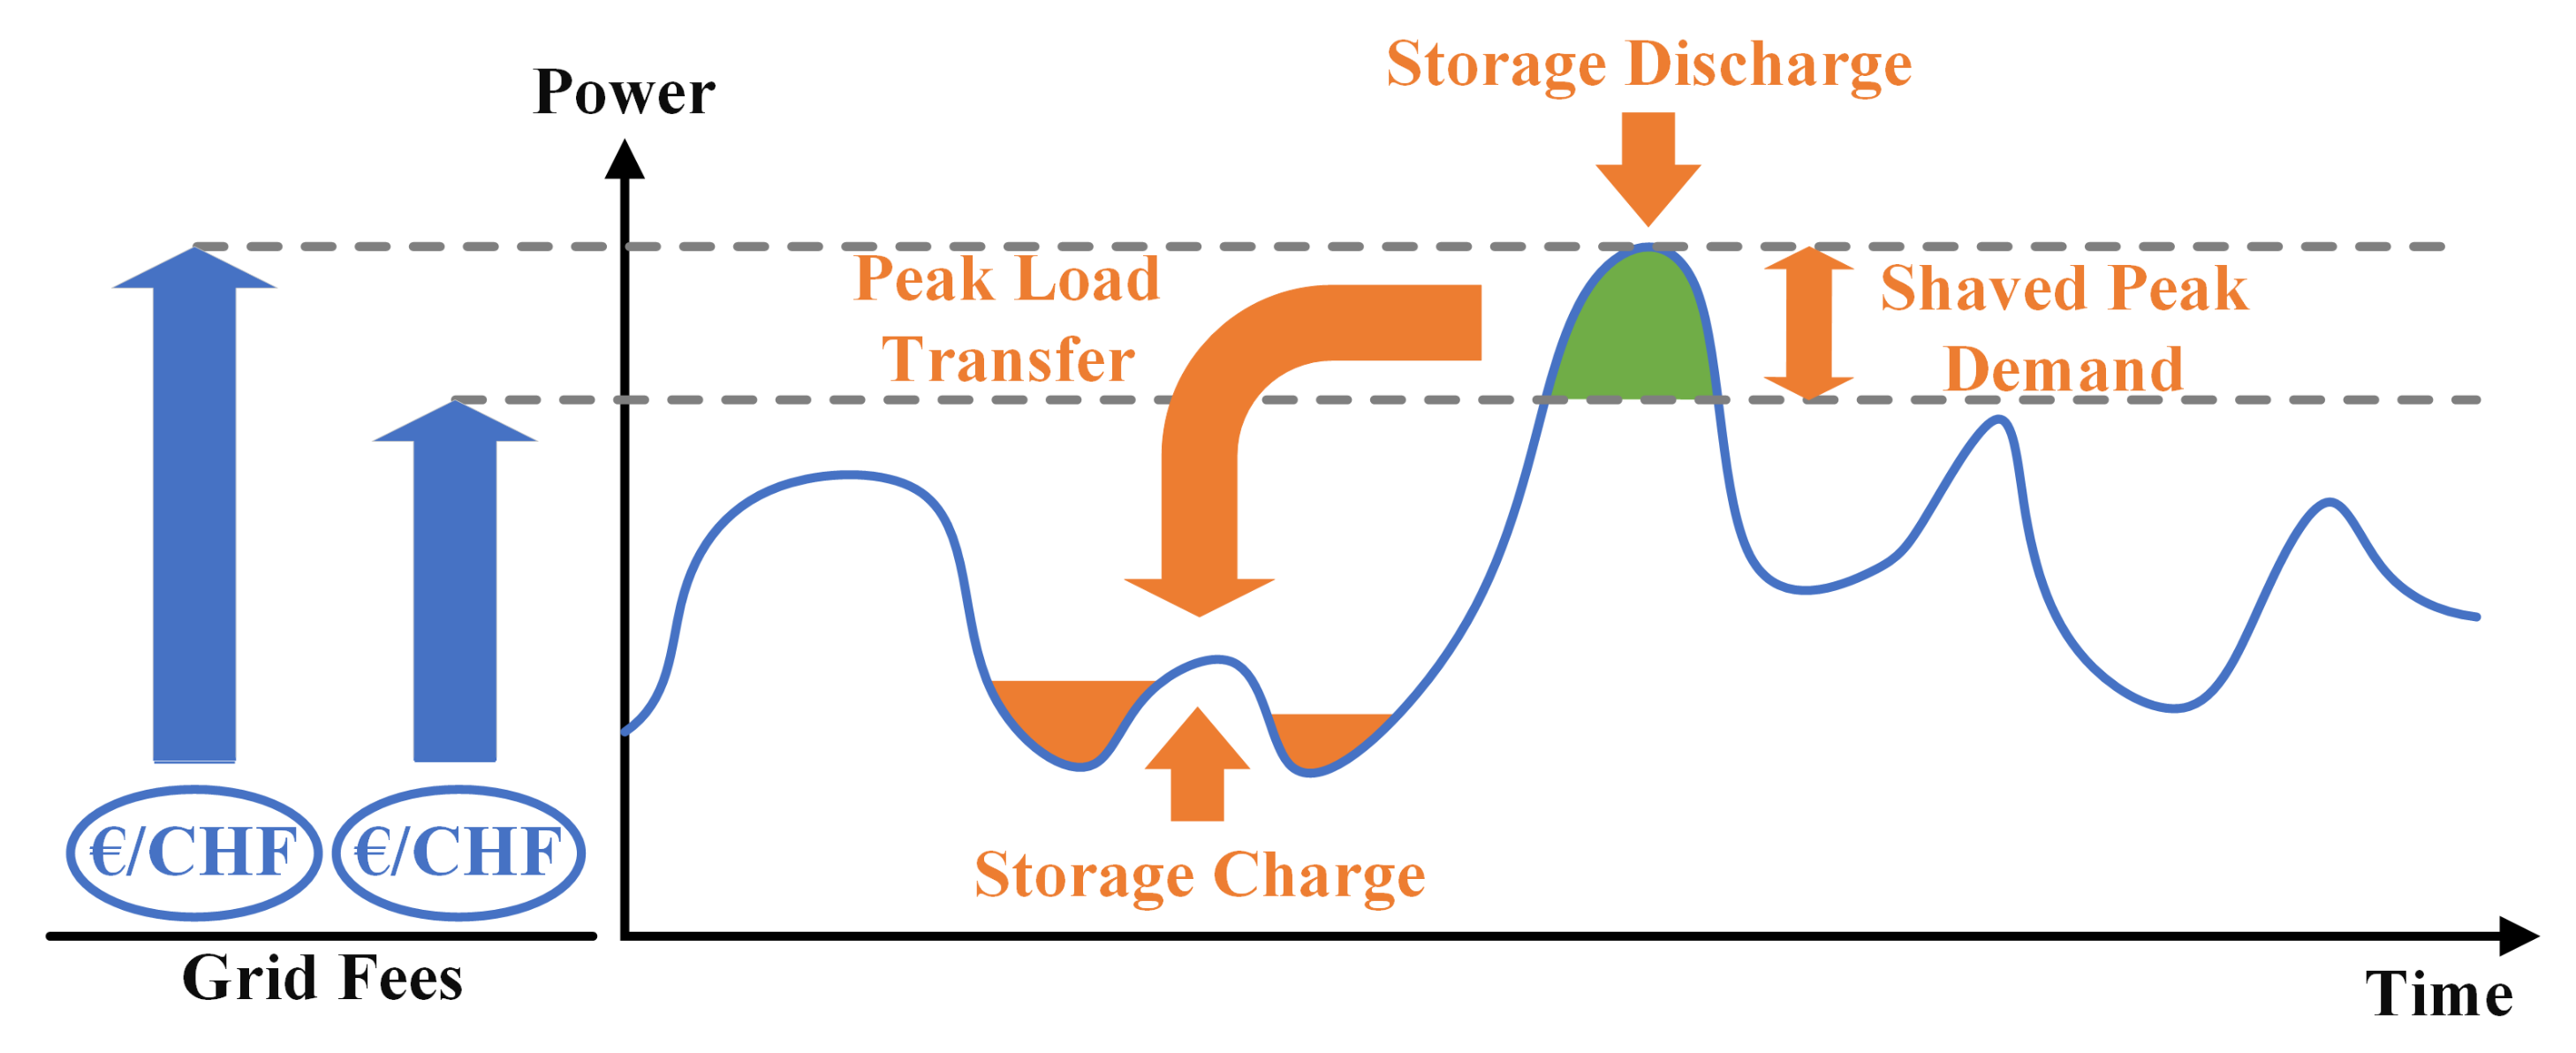
2.3.1. Network Operation Optimization

Network operation optimization is defined as the portfolio of benefits pertaining to peak power shaving, voltage support, reduced grid losses, operational grid costs, and grid reliability–resilience. In the frame of forecasting methods, applied for the prediction of load demand and RES generation, the improved prediction of RES generation and energy consumption can also be considered as a major benefit. The compensation of any forecasting errors is also included in the network operation optimization.
Peak Power Shaving: Peak load is a sensitive factor for the grid operators, since it represents one of the main design criteria and cost factors for the grid elements. Grid operators are usually charged by their superior grid level through peak penalties. Besides that, the most expensive power plants in the merit order have to be used to deliver the peak power resulting in high energy cost. Each event is characterized by its duration and the maximum power needed to reduce the demand to appropriate level. This objective is of main concern for the industrial end customers and network operators, as the peak power cost has a major impact on their operational costs.
Voltage Support: Network operators must fulfill technical requirements for the quality of their services including continuity of electricity supply and power quality laid out in national law, standards, and grid codes. Power quality includes the voltage quality supplied by distribution grids. Most electrical equipment are designed to operate within a narrow band of voltage and frequency; thus, any deviation from the rated band may lead to deterioration of performance. One of the main ancillary services provided by SESs can also be the voltage support in case voltages exceed their permissible limits, as defined by EN 50160 [43].
Reduced Grid Losses: A number of potential operational strategies are applied by network operators for the reduction in grid losses: (i) “traditional” measures of component replacement (e.g., transformers and supply lines) and (ii) measures for an improved power system management, either by controlling the network in-feeds or by grid management actions, e.g., network topology reconfiguration, power factor compensation, phase unbalance management, and voltage control [44]. When energy by SESs is consumed locally, the energy transportation distance, as well as the marginal losses by load curve flattening, are reduced [45].
Improved RES–Load Prediction: Crucial factor in optimizing the operation of SESs is the accurate forecasting of load and generation. RES–load forecasts are required for power supply planning, transmission and distribution (T&D) systems planning, DSM, as well as power systems operations and maintenance, financial planning, rate design, and so forth. The integration of ICTs in SESs enables the use of novel approaches for RES–load prediction, ranging from the distribution level to even residential scale.
Forecasting Error Compensation: Forecast errors in load profiles complicate the establishment of generation–load balance, and possible imbalances are compensated by the operational power reserve mechanism, which is activated by the TSO. BRPs often must pay high penalties to the TSO due to rescheduling actions, when they cannot meet their projected production pattern due to inaccurate forecasts. Instead of compensating forecast uncertainties with fast-acting backup generators, storage units can also be placed close to locations, where possible uncertainties arise.
Reduced Grid Operational Costs: The grid operational costs of the utilities at T&D network levels mainly comprise the following: (i) operating and maintenance (O&M) costs, (ii) energy costs for the utilization of T&D networks, and (iii) other system service costs incurred to ensure the reliable operation of energy systems, e.g., balancing and redispatching. SESs are customized to reduce the grid operational costs by shifting the energy withdraw needs to periods with low charges and low peak demands. Maintenance costs can also be reduced, as there should be less wear on the equipment, and generating plants can operate in their most efficient operating ranges. In addition, local generation and storage technologies can reduce the costs from T&D network losses.
Improved Reliability–Resilience: Grid resilience refers to the ability of the grid to withstand strong and unexpected disruptions without suffering operational compromise or to adapt to the strain so as to minimize compromise via graceful degradation. On the contrary, reliability is a measure of grid behavior, once resilience has broken. More resilient and reliable system operation can be achieved by SESs when providing various services, e.g., balancing energy, reserve capacity, frequency regulation, volt/var support, and black start. The integration of ICTs can also enable predictive maintenance, reducing unplanned outages and downtime and, hence, improving system resilience and reliability.

2.3.2. Improved Network Development

Improvements in network development are related to the usage of grid assets and deferral of grid reinforcement measures.
Improved Grid Assets’ Usage: In practice, a large portion of grid assets is usually underutilized for most of the new equipment life. SESs will enable network operators to adjust power flows, reducing the loading of stressed assets, and making better use of the installed capacity. Furthermore, improved load factors and lower system losses will result in more stable operation of grid assets, allowing more energy to be delivered per unit of installed capacity. As SESs can shift the load demand from on-peak to off-peak periods, reliance upon the most efficient power plants increases, decoupling the dependency upon the least efficient, more expensive-to-run peaking plants. Moreover, ICTs and advanced algorithms that analyze and diagnose asset condition can monitor and control grid assets, improving operational and asset management processes.
Deferral of Grid Upgrades: The network reinforcement can regard the replacement of an aging or over-stressed existing distribution transformer at a substation or re-conducting distribution cables with heavier wire, as well as the construction of new power plants. The ability of SESs to effectively manage loading, improve load factors, and reduce failures means that utilities can increase the lifetime of grid assets, deferring grid upgrades. Optimizing the utilization of power plants can also allow the utilities to postpone new generation investments. By using ICTs and data analyses, maintenance programs can also be switched from reactive to predictive—predicting failures on critical grid assets. In this manner, the costs, dangers, and the inconveniences of failures and reactive maintenance actions will be reduced.

2.3.3. Increased Flexibility

The flexibility term is used as an umbrella covering various requirements and aspects (e.g., technical, economic, and environmental) in SESs [20]; however, it mostly refers to the ability to modify generation and/or consumption patterns in reaction to an external signal. In general, flexibility can be provided by flexible generation (e.g., gas-fired units), flexible demand (e.g., DSM schemes), storage, coupling of sectors (e.g., power-to-gas), and interconnection with other regions (e.g., cross-border) [46]. Particularly, the utilization of the aforementioned resources can increase the demand flexibility, the hosting capacity of DERs, and the self-consumption and self-sufficiency of RES.
Increased Demand Flexibility: Demand flexibility is the total amount of consumed energy that can be moved along the time dimension. As a result, demand flexibility is not related only to the shifted energy demand, but also to the peak load transfer, as shown in Figure 4. In particular, system operators, energy service suppliers, and large-scale end customers aim at shaving the power peaks through DSM schemes and energy storage systems, since they lead to high operational costs. On such occasions, the demand flexibility provided by SESs can also be used for various grid services, e.g., congestion management, system balancing, and frequency response [40].
Increased RES Hosting Capacity: The RES hosting capacity (HC) is defined as the maximum RES penetration level at which the power system operates satisfactorily, in compliance with various technical constraints. Particularly, the impact of additional RES generation on the grid operation shall be quantified by using power quality measurements, e.g., voltage magnitude, and thermal loading in the grid. System operators, energy service suppliers, authorities, and different non-governmental organizations focus on increasing the RES hosting capacity for both environmental and financial reasons.
Increased RES Self-Consumption: Self-consumption (SC) of RES is defined as the energy produced by RES, not injected to the energy network, and consumed locally by the RES owner or by associates in the owner’s proximity zone in case of a community, city, or region. In combination with storage systems and DSM, SESs can facilitate the integration of variable RES units onto the grid, using ICTs and advanced control algorithms. SC increase is of main interest for the end customers, system operators, and energy service suppliers.
Increased RES Self-Sufficiency: An additional flexibility provided by SESs is related to the increase in RES self-sufficiency or autarky, which represents the SES’s ability to be fully functional through its local RES production, storage, and distribution systems. The main target of buildings, communities, cities, or regions is to fully rely on their endogenous resources for the satisfaction of their energy needs; hence, the presence of SESs can be crucial for the energy autarky of the entity. The overwhelming majority of stakeholders, e.g., system operators, individuals, authorities, energy service providers, and third parties, strive to increase their system’s self-sufficiency.

2.3.4. Enhanced System Feasibility

The enhancement of system feasibility is evaluated with regards to technical, economic, environmental, social, and regulatory/legal aspects. Relevant feasibility studies are carried out to evaluate the practicality of projects, ascertaining the likelihood of completing the project successfully and discerning the benefits, requirements, risks, and challenges for each of the aforementioned factors. As a result, such studies can assess to which extent the SESs can enhance the system feasibility and make a project viable.
Technical Feasibility: The technical assessment of an SES investigates the degree to which the system operation is satisfactory at a specific application area, ensuring the longest lifespan for each SES component. In this context, the improvement of system performance through the SES integration is examined with respect to various technical factors. Though increased flexibility can also be related to different technical parameters of the grid, technical performance focuses on the installation and operation of SESs. The ease of installation and maintenance, system efficiency, maturity of technologies, and scalability potential are considered in the context of technical feasibility. This objective is of main interest for the system designers, operators, and investors.
Economic Sustainability: Economic sustainability requires that an SES uses its resources efficiently and responsibly so that it can operate in a sustainable manner to consistently produce an operational profit. The economic sustainability is investigated through economic assessment studies (e.g., cost benefit analysis) to measure the attractiveness of any business case for the lead actor. The economic sustainability can be determined by a portfolio of common indicators (e.g., net present value (NPV) and payback period); however, their selection depends on each business case. The economic dimensions are very crucial to decision making, not only for investors, but also for policy makers and associations that can promote or block innovative technologies.
Environmental Sustainability: Environmental sustainability guarantees that the SESs operate without leading to harmful environmental impacts of conventional resources, which may trigger global warming and climate change. SESs must be clean at every stage from source to their end use with lower emissions and efficient resource utilization, while waste and loss recovery for both energy and materials can additionally enhance environmental sustainability [7]. In practice, the main environmental impacts are grouped based on air, land, and water pollution issues. Additional impacts are related to visual impact (e.g., aesthetics), risk of flash floods or droughts, abiotic depletion potential, noise, and biodiversity loss. Environmental sustainability is of primary concern, not only for the relevant organizations, policy makers, and governments, but also for system operators, energy service suppliers, and end customers.
Social Sustainability: Social sustainability represents the system’s ability to persistently achieve good social well-being and life quality. The social dimension is crucial to ensure equitable distribution of benefits from the SES operation. Social impacts are also important to correctly identify and quantify the human risks, allowing better acceptance and awareness of technologies that may be subject to public objection. The major social aspects are related to employment creation, income development, public perception and acceptance, level of education and awareness, human convenience and welfare, health and safety, and easy usage of energy, as well as social bonds creation, social equity, and social cost of carbon [12]. Social sustainability is of the utmost interest for authorities, associations, and non-governmental organizations that can drive the social acceptance of SESs, improving their social well-being.
Legal Feasibility: The legal feasibility describes whether the SES can stand in conflict with legal requirements and regulations. In this context, the existing legal and regulatory frameworks are assessed, identifying any legal barriers and constraints for the application of SESs. Since law-making bodies and regulators are usually not so flexible to follow the progress of technologies, mature SESs may not be actually implemented and operate in real-life conditions due to the lack of necessary legal background. Hence, an early legislative support of a new technology is required as an additional incentive to its developers, investors, and users. In this context, the legal KPIs assess the governance in terms of legislative flexibility, as well as the adaptability and adoptability of the legal and regulatory frameworks.

2.3.5. Improved Interoperability

According to [47], interoperability is defined as “the ability of two or more systems or components to exchange and use the exchanged information in a heterogeneous network.” Interoperability is a central enabling technology that enables seamless vertical and horizontal communication between various electrical entities within the SES. The smart grid architecture model (SGAM) defines various interoperability layers in the reference architecture that can also be applied on SESs [48]. The interoperability layers are expected to communicate and exchange information with each other so as to carry out energy management services of SESs. In reality, however, there is low interoperability between the SGAM layers, since each layer is governed by standards, which are mature and are only designed to operate on their respective layers. Hence, there is limited interoperability between the communicating means due to differences in the use of communication protocols and data model representation. In the domain of healthcare, the Healthcare Information and Management Systems Society (HIMSS) also defines four levels of interoperability (foundational, structural, semantic, and organizational), which are also applicable in SESs [49]. Systems interoperability and structural and semantic interoperability are of main concern in the context of SES deployments. System operators, energy service suppliers, technology providers, software developers, and equipment manufacturers are mainly interested in interoperability aspects.
Systems Interoperability: This objective involves multiple aspects, e.g., legal, semantic, syntactic, technical, and operational. Interoperable components regardless of the vendor should be able to correctly exchange information and thereby enable multi-vendor systems of heterogeneous devices and services. Though communication standards should provide interoperability, due to implementational flexibilities, it is not guaranteed that two implementations of the same standards are interoperable. Therefore, a normative application of standards is necessary, which can be achieved, for instance, by applying the IES (integrating the energy system) methodology.
Structural Interoperability: In the context of structural interoperability, a common structure or format of data exchange is defined for data exchange with a basic level of interpretation (e.g., the classification of the data that are received). This objective can be measured by comparing how similar the information models are between two standards. One method of measure of structural interoperability is by applying model transformation rules to measure interoperability capacity [50], a model driven approach to measure structural interoperability by measuring the transformation rules that are required for model transformation between two standards.
Semantic interoperability: Semantic interoperability encompasses structure interoperability, but also allows interpretation and inferences of the data by the receiver by enhancing the data exchange with shared vocabularies and increased metadata. Quantifying semantic interoperability is not straightforward, since the system can be classified as either interoperable or not. However, degrees of interoperability can be measured based on how semantically interoperable two standards are. To measure the level of semantic interoperability, the five-point Likert Scale is used to measure the number of interoperable elements between the two standards.

2.3.6. Improved Model Accuracy

Simulation models are typically a close approximation of the real system, with the aim of replicating the selected scope of the system as accurately as possible. In the context of SESs, simulation models can be effective in evaluating the interactions and control of different energy resources operating within the SES confinement. Various stakeholders can benefit from developing and running simulation models. System operators rely on daily simulations required to monitor the stability and reliability of energy grids. Energy service suppliers can use simulation models to plan and evaluate their energy production. Additional benefits of using simulation models of SESs include the following: (i) insights into the complex interactions between various SES energy resources; (ii) evaluation of different SES control strategies; (iii) evaluation of SES practicality, against the set of environmental conditions under which it will operate; (iv) optimizing system performance; (v) mitigation of unforeseen factors which could affect the intended SES operation.
The three main methods for developing simulation models are black box, white box and grey box. Black box methods approximate the exact internal physicals using empirical formulas to relate the model outputs to its inputs. Black box models are computationally light, but are not flexible for changes, since empirical formulas need to be formulated. White box methods implement the internal physics (to its lowest possible level) and most closely resemble the real system. White box models are computationally heavy, but provide the highest flexibility. Grey box methods use a mixture of detailed modeling (white box) and empirical approximation (black box), and are useful for multi-domain modeling (e.g., systems which involve electrical and thermal modeling).
Electrical System modeling: The simplest methods for electrical system modeling use the black box models with empirical formulas that model the relationships between the input and the output of the electrical system and can be adjusted with parametrization of the empirical formulas. The advantage of black box models is the ability to create models which are scalable due to their simplicity (mainly equations and rules), and parametrization can be auto-adjusted to improve model accuracy [51].
Thermal System modeling: This objective is also an important aspect of large energy systems and cannot be overlooked when modeling SESs, since the thermal system contributes heavily to the energy consumption of energy systems. Developing accurate thermal models can be difficult due to the time sensitive nature of thermal dynamics. Thermal simulators, such as computational fluid dynamics simulators, typically require dedicated graphic processing units to carry out accurate simulation of thermal behavior. A multi-domain model, which takes account of both the thermal and the electrical system models, would be beneficial in modeling the energy consumption of SESs. Hybrid or grey box methods are typically used to model multi-domain systems, where computationally heavy models could be approximated with empirical formulas or data-driven methods to run in conjunction with simplified electrical load models.

3. SESs under Evaluation

The SESs that are used for the definition of KPIs are evaluated within the scope of the SONDER project of the joint programming initiative ERA-Net Smart Energy Systems’ focus initiative Integrated, Regional Energy Systems [22]. The main goal of this European project is the optimal energy management at different levels of electricity distribution networks. In this context, three use cases were investigated in Austria (AT), Sweden (SE), and Switzerland (CH), as presented below.

3.1. Austrian Use Case

In the Austrian study case, the development and operation of an REC are of main concern. Emphasis is laid on the integration of commercial members into the REC, in particular, considering a commercial automotive park as exemplary test site. The operation optimization target for the Austrian scenario is a weighted maximization of the self-consumption and self-sufficiency from local RES and minimization of peak grid loads by balancing electricity consumption, production, and storage, locally. Therefore, the control scheme utilizes the customer measurement data and forecasting methods to operate the community battery and apply DSM methods mainly on the commercial end customers with high demand. To facilitate interoperability, the IES methodology is utilized. Main activities consist of defining integration profiles in a transparent, manufacturer-neutral, and cooperative process, and testing software products for interoperability and conformity.

3.2. Swedish Use Case

DCs are rapidly becoming a sizable part of global energy consumption due to the increasing expansion of ICT technologies. Over 3% (about 370 TW) of today’s generated electrical energy is consumed by DCs [52]. The so-called “Green Datacenter” is a new DC type, with the aim of building a sustainable DC solution by utilizing RES to reduce its carbon footprint [53]. With the advent of the green DC and the RES integration (e.g., PVs) in the DC microgrid, DCs could perform the role of a prosumer and take a more active role in the EC—in particular, in DSM applications of DC loads. In the Swedish test case, an edge DC with PV and UPS installations is evaluated [54]. The research challenges include the horizontal interoperability (DC and EC), vertical interoperability (EC and energy market), and DC modeling, maximizing the PV self-consumption and optimizing the use of the UPS battery, as another source of energy flexibility.

3.3. Swiss Use Case

In the Swiss pilot, the main focus is given on the reduction in power peaks at the distribution network of Arbon city, where the end customers have already been equipped with smart meters [55]. The local DSO, which has also the role of energy supplier, is interested in flattering the total power demand profile. A centralized battery energy storage system (BESS) can be used to store energy during off-peak periods and release it during on-peak periods. In this frame, the DSO has installed at the 17 kV distribution level a stationary BESS unit with energy and power capacities of 1.35 MWh and 1.25 MW, respectively. Although the BESS provides primary and secondary frequency response services, there also exists a discussion for additional services, focusing on peak power shaving. In the context of the project, peak shaving control schemes for BESS operation are evaluated with the main goal of identifying the most suitable algorithm for implementation. Since the control schemes are expected to be applied in real-time operation, accurate forecasting tools are also utilized for both the one-day-ahead and short-term prediction of the total load curve of Arbon city.

4. Results—KPI Identification

Table 2 summarizes the main SES requirements, clarifies how they are divided into each stakeholder objective, and presents the mapping to the use cases of the SONDER project. It is evident that the predefined SES requirements and stakeholder objectives are not evaluated or affected by all use cases. In particular, objectives related to the grid are of main concern for the Austrian and Swiss pilots, while the Swedish case focuses on the aspects of interoperability and model accuracy. Furthermore, all pilots assess the enhancement of different flexibilities during SES operation.

4.1. Network Operation Optimization

In terms of peak power shaving, the operation of the stationary BESS unit in the Swiss test case can contribute to the reduction in peak power demand, and hence, in the respective cost. Moreover, BESS utilization may also reduce the variability of load consumption in the investigated grid resulting in higher load factors and lower energy costs. In the Austrian test case, peak power shaving will also be performed by utilizing the community BESS and DSM methods that control deferrable loads, e.g., heat pumps. By contrast, in the Swedish test case, peak power shaving is of secondary priority.
Voltage support by the respective SESs is evaluated by the Swiss pilot. Particularly, the voltage variations at each node of the Swiss grid should comply with the allowable limits [43]. The stationary BESS provides primary frequency response (PFR) services for power system balancing; hence, transients can be mitigated, stabilizing the grid voltages. In the same manner, the Austrian use case aims to balance the electricity consumption and production in the EC by using the community battery, preventing any voltage limit violations. In the Swedish pilot, the battery storage can store excess PV energy, mitigating possible overvoltage issues, while providing short-term frequency and voltage support services in cases of grid outages.
The grid losses regard the losses on distribution cables and transformers of the examined distribution grids. In the Swiss use case, peak shaving may flatten the demand curve of the distribution transformers, thereby reducing the grid losses. For the purposes of the Swiss pilot, only the grid losses along the cables will be considered. Though the optimal energy management in the Austrian EC can reduce the utilization of the grid and the upper grid levels reducing network losses, this objective is of secondary concern for the EC operators. The grid losses are not considered by the Swedish DC either.
In terms of RES–load prediction, improved forecasts will enhance the matching between predicted and real energy balance, enabling better utilization of flexible services. Since optimal peak power shaving is the primary goal of the Swiss pilot, short-term load forecasting methods are applied for the prediction of the daily peak power. Improved load prediction enables the development of advanced control schemes for optimal BESS operation. In the same manner, the Austrian EC also requires the development of a suitable forecasting model for the prediction of net demand, PVs, and deferrable loads, which is indispensable input for the optimal utilization of community BESS and DSM techniques. Though PV production forecasts are also required for the maximum PV self-consumption in the Swedish pilot, the DC does not focus on the forecast improvement.
The compensation of forecasting errors can be carried out with the use of storage units; therefore, in the Swiss use case, the BESS is expected to be an alternative for short-term balancing, reducing the cost of possible prediction uncertainties. The compensation of forecasting errors is also related to the PFR service that is provided by BESS for power balancing and grid stability. This service is not considered by the other pilots.
The reduction in grid operational costs is of main concern only in the Swiss use case. The local DSO, who also plays the role of energy supplier, is interested in decreasing the peak demand costs, which constitute the highest part of total charges, without affecting the end users’ energy consumption. Additional savings can be achieved for the DSO due to the reduction in grid losses and maintenance costs. The reduction in the grid operational costs should comply with the contractual services provided by the DSO without causing any breach of the regulatory framework for the unbundling services among the other stakeholders.
Finally, the objective of improved reliability–resilience is not examined in the use cases of SONDER, though it can be affected in the Swiss pilot. Table 3 and Table 4 summarizes the KPIs defined for each stakeholders’ objective in terms of network operation optimization.

4.2. Improved Network Development

Improved network development is considered by the Swiss DSO and the Austrian EC operators; however, it is evaluated only in the context of the Swiss pilot. Owing to the reduced utilization of grid assets through the BESS operation in the Swiss city, any future investments for distribution grid upgrades can be delayed or avoided. The deferral of grid upgrades can be examined only for future scenarios with high integration of controllable loads, e.g., heat pumps, and of small-scale DERs, e.g., PVs, storage, or EVs. Under such extreme scenarios, the impact of BESS operation on the deferral of grid reinforcement measures will be defined.
The level of improved utilization of grid assets can be evaluated by making use of various capacity factors. These factors describe the ratio of the energy or power that is delivered through a specific asset during an interval, compared with the amount of maximum energy or power that could have been delivered. Table 5 provides the KPIs for the improved utilization of grid assets and the deferral of grid upgrades.

4.3. Increased Flexibility

In the Swiss pilot, the demand flexibility of the grid is expected to be enhanced, as a high amount of energy demand during the peak period can be supplied by the BESS, which can be charged during the off-peak periods. Consequently, the energy demand at the connection point of the distribution network with the transmission grid seems to be shifted from on- to off-peak periods, though the end users’ energy consumption is not affected. In the Austrian test case, peak grid loads shall be minimized, while the self-consumption and the self-sufficiency from local RES should be maximized. In the Austrian test case, the EC peak demand can be minimized, while the self-consumption and self-sufficiency from local RES can increase. Therefore, balancing the electricity consumption and production in the EC is necessary. To achieve this, the community BESS and DSM methods will be applied locally. DSM will be used to shift controllable processes of end customers with high load without compromising their operation. Regarding the Swedish pilot, the peak shaving demand, as well as the improvement of self-consumption and self-sufficiency, are of main concern for the DC. Table 6 summarizes the KPIs for the SES requirement of increased flexibility.

4.4. Enhanced System Feasibility

In the SONDER project, each demonstration area has a different focus. Accordingly, different solutions and technologies, e.g., control schemes, are developed and applied. Depending on the focus and used technologies in the demonstration areas, different KPIs will be used to evaluate the system feasibility for the Austrian and the Swiss pilots.
The Austrian test case focuses on the feasibility of the EC and the community BESS, especially the technical feasibility, as well as the economic and environmental sustainability. To this end, several factors have to be considered, e.g., the composition of EC members and the applied control scheme. Regarding future developments, e.g., increased number of EVs, a sensitivity analysis will be carried out to assess their influence on the EC and its feasibility.
One of the main goals for the Swiss test case is both the economic and technical feasibility of the BESS installation. Here, the BESS control scheme on system feasibility and the impact of DER penetration level are evaluated. A sensitivity analysis is carried out for future scenarios, where the influence of high DER integration levels on technical feasibility and economic sustainability of BESS can be examined.
The technical assessment of an EC is based on the local consumption and local RES production. Here, two indicators are of importance, the self-consumption rate (SCR) and the self-sufficiency rate (SSR); while the SCR indicates the share of locally produced energy which is locally consumed, the SSR represents the share of locally consumed energy which is locally produced. The increased utilization of locally installed RES by the EC members should lead to an increase in both self-consumption and self-sufficiency.
Regarding the BESS technical feasibility, the characteristics of main interest are the power profiles and the energy content throughout the year. These profiles can be used to extract additional profiles for the state of charge (SoC), state of health (SoH), and depth of discharge (DoD), as well as BESS energy content, charging–discharging powers and power-to-energy ratio (C/E-rate). From the profiles of the aforementioned parameters, considerable information about the annual number of BESS cycles and the annual energy throughput can be extracted. Furthermore, the effects of several technical characteristics, e.g., SoC, DoD, C/E-rate, and temperature, will be considered for the computation of BESS degradation rate throughout the project lifetime. The BESS is replaced when the available capacity is lower than the end-of-life criterion, as defined by the manufacturer.
The economic sustainability of an EC focuses on the economic benefit of the EC members. The reduction in network charges due to the consumption of electricity from local RES results in a “local tariff”, which should lead to lower energy costs for the EC members. Furthermore, installation and maintenance costs, as well as aging effects, e.g., of the installed BESS, have to be considered in the economic assessment.
Regarding the Swiss use case, the economic sustainability includes the calculation of savings achieved with the proposed BESS operation for peak power shaving. As the investment feasibility with the proposed BESS operation is out of the scope of this paper, the cost benefit analysis includes only the computation of annual savings for each year of the BESS lifetime. Hence, the aforementioned expenses (capital and O&M), as well as other profitability metrics, e.g., NPV and payback period, are not evaluated.
The environmental benefits will be assessed on a high level only in the Austrian pilot, by comparing the utilized electricity mix before and after implementing the SESs. Owing to the increased use of energy from local RES, a decrease in C O 2 /GHG emissions is expected. A life cycle analysis for the installed components is out of the scope of this paper.
Social sustainability and legal feasibility are not investigated in the project. In particular, both objectives are affected in the Austrian use cases; however, they are not quantified. Though the legal feasibility is also of main concern for the investors in the Swiss pilot, it is not assessed in the frame of SONDER project. Table 7 summarizes the KPIs for the SES requirement of enhanced system feasibility.

4.5. Improved Interoperability

To enable interoperability, the Austrian project share utilizes the IES methodology [56], which is based on the established “Integrating the Healthcare Enterprise” approach to IT interoperability in the medical technology sector. Thereby, the use and application of existing standards and practices are normalized. Therefore, as part of the SONDER project, integration profiles shall be developed. These integration profiles state technical constraints and recommendations on how to apply standards and good practice, wherever interoperability is at risk. As indicators, the number of new created integration profiles and the tested integration profiles of “Connectathon Energy” are used [57].
In the Swedish pilot, focus is given to semantic and structural interoperability. To measure structural interoperability, a model transformation method of measure is adopted from [50]. The main KPI is interoperability capacity, which measures relative information exchange capacity based on transformation rules. The two standards subject to structural interoperability analysis are IEC 61850 (substation automation standard) and IEC 61499 (distributed automation standard) for two reasons [58,59], as follows:
1.
IEC 61850 is a domain-specific standard with well-defined semantic models to describe the domain of energy networks. IEC 61499, on the other hand, is a domain-neutral standard, which can be used to model the specification and implementation of automation systems irrespective of domain.
2.
There is no direct communication or message passing between IEC 61850 and IEC 61499 systems. The two standards complement each other, with IEC 61850 addressing the domain specific communication modeling, while IEC 61499 addresses the implementation of IEC 61850 systems.
To measure semantic interoperability, the five-point Likert scale is used to measure the number of interoperable elements between the two standards to measure the degree of interoperability [23]. The two standards where semantic interoperability can be measured are IEC 61850 and EDIEL (Nordic Energy Market standard). Semantic interoperability is measured between these two standards for the following reasons:
1.
IEC 61850 and EDIEL are both domain-specific standards with well-defined semantic models that model the communication and the message passing of their respective domains (i.e., the energy grid for IEC 61850 and the energy market for EDIEL). These two standards operate independently from each other and only communicate when message passing is required between the two standards. Therefore, the structural aspect of the information model in these two standards is not important with respect to interoperability.
2.
Since message passing exists between the two standards, it’s more important to focus on the semantic interoperability of the two standards rather than the structure. Since both EDIEL and IEC 61850 were developed independently by two different task forces, there can be situations where two signals with identical terminologies (i.e., names) can refer to different things, or vice versa, where signals with the same meaning have different naming terminologies. In addition, only a very small subset of messages on the boundaries of the two standards are expected to interoperate.
Table 8 summarizes the KPIs considered for the evaluation of interoperability in the context of the Austrian and Swedish pilots.

4.6. Improved Model Accuracy

The improved model accuracy is solely examined in the Swedish use case. The total consumption of a DC is mainly attributed to two subsystems, the IT system and the cooling system. According to [60], the IT system accounts for about 60% of the total DC consumption, while the cooling system accounts for approximately 40% of total consumption. These are two dependent systems with different model dynamics and, as such, they are developed independently, with common interconnecting interfaces.
The power consumption of the IT subsystem is modeled from the server level, where the main energy consumers are CPUs and server fans. The IT model of the Swedish demonstration is constructed utilizing a modular Simulink toolbox, which consists of building blocks representing individual components of a typical DC, e.g., CPUs and servers, and is capable of modeling various configurations of DCs.
The cooling system is the second major subsystem that is responsible for the total consumption of the DC, accounting for approximately 40% of the system. The cooling system is typically a linear system made up of hot and cold aisle coolers, a heat exchanger, a storage tank, a chiller, and a cooling tower. The cooling system is driven by the IT power consumption, where the power consumption from the IT load is fed to the hot aisles of the cooling system, and a simplified thermodynamic model of heat transfer is used to model the cooling process of the various cooling subsystems. Since the main emphasis is put on the power consumption of the cooling system, the power consumption at individual cooling subsystems is calculated and validated with real data from the DC.
Various KPIs can be used to measure the accuracy of the DC simulation model. The three key indicators to measure the accuracy of the DC IT power prediction are the mean absolute error (MAE), the root mean square error (RMSE), and the mean absolute percentage error (MAPE). For the improvement of the parametrization of the DC IT power prediction, as an indicator, the mean square error (MSE) is utilized. For the DC temperature prediction, the same indicators as for the DC IT power prediction are used. Hence, the accuracy of the DC temperature prediction is measured through the MAE, RMSE, and MAPE metrics. The MSE is used for the improvement of the parametrization of the DC temperature prediction. Table 9 summarizes the KPIs for the improvement of the parametrization of the DC IT power prediction and DC temperature prediction.

5. Conclusions and Future Work

This study presents a robust KPI framework for the evaluation of SESs installed in application areas of different scales. The KPI framework is intentionally generic, so as to satisfy the various requirements of SES technologies. The procedure for the determination of suitable KPIs is based on four main layers, which are required for the definition of the application area, the involved stakeholders, the SES requirements, and the stakeholders’ objectives.
The application area of each SES deployment is determined based on four levels of spatial aggregation varying from single buildings to communities, cities, or regions. According to the level of interest and impact on SESs, the KPI framework clusters the key stakeholders in the following categories: (a) system operators, (b) energy service suppliers, (c) end customers, (d) local/regional authorities, and (e) other third-party providers. In the context of a generic KPI framework, the SES requirements are defined for various areas related to the energy networks, system feasibility and sustainability, interoperability aspects, and model accuracy. The lesson learned from the analysis of each SES requirement was that the majority of issues related to the deployment of various SESs can be covered by the proposed methodology. Compared with previous efforts, this framework is not based on specific thematic areas (e.g, technical, economic, and environmental), but on objectives that are generated according to the involved stakeholders’ priorities. Furthermore, the top–down approach is one additional advantage of this framework, since from the generic SES requirements, we can define the final KPIs of each stakeholder objective.
The proposed KPI framework can play an important role in driving the behaviors and actions undertaken by system operators, energy service suppliers, end customers, authorities, organizations, and technology developers. The evaluation using the developed approach is of main concern for policy and business investment making, process management, and continuous commissioning, as the degree of project success can be indicated. Besides that, the framework can lead to a more transparent assessment of the SESs demonstrated at different spatial scales. Various stakeholders can use the presented KPI framework, not only to accurately describe a specific characteristic of an SES, but also to facilitate its comparison to other systems designed to meet the same scopes. As a result, the proposed scheme can help the stakeholders promote or hinder the utilization of specific SES with respect to its performance, as determined by the selected KPIs. The involved stakeholders can also identify the margins of further developments towards optimizing the smart and efficient of energy networks in an efficient, cost-effective, user-friendly, and environmentally friendly manner, respecting the social needs of the SES application area to the highest degree.
The developed framework is applied on the use cases of the SONDER project, where the SES application areas vary from a building in Sweden, to a community in Austria, to a city in Switzerland. The Austrian demo targets the optimal operation of an REC utilizing DSM methods for residential and commercial end customers and a community battery energy storage system. Technical, economic, and environmental benefits are assessed, while another focus lies on the improvement of interoperability by applying the IES methodology. The Swiss pilot regards the installation of a stationary BESS at the distribution network of Arbon city and the main target is the optimal BESS operation. In particular, different BESS control strategies are developed with the main goal to achieve the optimal peak power shaving, utilizing suitable forecasting methods. The Swedish use case targets the operation of green DCs in the scope of ECs as prosumers with incentives from the energy market. Firstly, the accuracy of the edge DC model is evaluated with specific emphasis on the DC consumption (IT and cooling system) and its integration with the microgrid (consisting of PV and UPS battery). Furthermore, the horizontal interoperability (DC with EC) and vertical interoperability (EC with energy market) are assessed in terms of structural and semantic interoperability between three standards (IEC 61850, IEC 61499, and EDIEL), using the defined KPIs.
In terms of future work, the KPIs for each pilot of SONDER project will be calculated for the baseline scenario, as well as for extreme cases, with the main goal being to evaluate the performance of the examined SESs. In addition, the SONDER use cases are expected to be integrated into a common benchmark network, where the impacts of each individual SES on the predefined KPIs are evaluated. Finally, as this generalized evaluation cannot be carried out only in the close barriers of a single project, other projects of the joint programming initiative ERA-Net Smart Energy Systems can use the proposed framework for their assessments.

Author Contributions

The present article is addressed by the 7 authors mentioned, each of whom being responsible for various aspects of the work. Conceptualization, N.E., A.G., C.-W.Y., M.G. and T.S.; methodology, N.E., A.G., C.-W.Y., M.G. and T.S.; validation, N.E., S.W. and T.S.; formal analysis, N.E., A.G. and C.-W.Y.; investigation, N.E., A.G. and C.-W.Y.; resources, N.E., A.G. and C.-W.Y.; data curation, N.E., A.G. and C.-W.Y.; writing—original draft preparation, N.E., A.G. and C.-W.Y.; writing—review and editing, N.E., A.G., C.-W.Y., M.G., I.H., S.W. and T.S.; visualization, N.E., A.G. and C.-W.Y.; supervision, M.G., S.W. and T.S.; project administration, C.-W.Y., M.G., I.H. and S.W.; funding acquisition, C.-W.Y., M.G., I.H., S.W. and T.S. All authors have read and agreed to the published version of the manuscript.

Funding

This research was funded by the European Union’s Horizon 2020 research and innovation programme under grant agreement No. 775970 (RegSys) in the framework of the joint programming initiative ERA-Net Smart Energy Systems.

Acknowledgments

The authors would like to thank the joint programming initiative ERA-Net Smart Energy Systems, the Swiss Federal Office of Energy (SFOE), for financing the project, as well as the industrial partners Siemens Switzerland AG, Arbon Energie AG, and the academic partner, Advanced Learning and Research Institute (ALaRI), University of Lugano (USI), for their involvement in the project.

Conflicts of Interest

The authors declare no conflict of interest. The content and views expressed in this material are those of the authors and do not necessarily reflect the views or opinion of the ERA-Net SES initiative. Any reference given does not necessarily imply the endorsement by ERA-Net SES.

References

  1. GSMA. Smart Energy Systems—Connectivity for a Zero-Emissions Future; Technical Report; GSM Association: London, UK, 2020; pp. 1–60. [Google Scholar]
  2. Redl, C.; Hein, F.; Buck, M.; Graichen, P.; Jones, D. The European Power Sector in 2020: Up-to-Date Analysis on the Electricity Transistion; Technical Report; Agora Energiewende: Berlin, Germany; Ember: London, UK, 2021; pp. 1–18. [Google Scholar]
  3. Lund, H.; Mathiesen, B.V.; Connolly, D.; Østergaard, P.A. Renewable energy systems—A smart energy systems approach to the choice and modeling of 100% renewable solutions. Chem. Eng. Trans. 2014, 39, 1–6. [Google Scholar] [CrossRef]
  4. Mathiesen, B.V.; Lund, H.; Connolly, D.; Wenzel, H.; Ostergaard, P.A.; Möller, B.; Nielsen, S.; Ridjan, I.; Karnoe, P.; Sperling, K.; et al. Smart Energy Systems for coherent 100% renewable energy and transport solutions. Appl. Energy 2015, 145, 139–154. [Google Scholar] [CrossRef]
  5. Smart Energy Networks. Vision for Smart Energy in Denmark—Research, Development and Demonstration; Technical Report; DTU Electro—Center for Electric Power and Energy: Kongens Lyngby, Denmark, 2015; pp. 1–8. [Google Scholar]
  6. Lund, H.; Østergaard, P.A.; Connolly, D.; Mathiesen, B.V. Smart energy and smart energy systems. Energy 2017, 137, 556–565. [Google Scholar] [CrossRef]
  7. Dincer, I.; Acar, C. Smart energy systems for a sustainable future. Appl. Energy 2017, 194, 225–235. [Google Scholar] [CrossRef]
  8. ENTSO-E. TYNDP 2020—Scenario Report; Technical Report; ENTSOG: Brussels, Belgium, 2020; pp. 1–64. [Google Scholar]
  9. Kampman, B.; Blommerde, J.; Afman, M. The Potential of Energy Citizens in the European Union; Technical Report; CE Delft: Delft, The Netherlands, 2016; pp. 1–34. [Google Scholar]
  10. DECC. Towards a Smart Energy System; Technical Report; Department of Energy & Climate Change: London, UK, 2015; pp. 1–21.
  11. Refaat, S.S.; Ellabban, O.; Bayhan, S.; Abu-Rub, H.; Blaabjerg, F.; Begovic, M.M. Smart Grid and Enabling Technologies; Wiley-IEEE Press: Chichester, UK, 2021; pp. 1–473. [Google Scholar]
  12. Salom, J.; Tamm, M.; Andresen, I.; Cali, D.; Magyari, Á.; Bukovszki, V.; Balázs, R.; Dorizas, P.V.; Toth, Z.; Mafé, C.; et al. An evaluation framework for sustainable plus energy neighbourhoods: Moving beyond the traditional building energy assessment. Energies 2021, 14, 4314. [Google Scholar] [CrossRef]
  13. Yavor, K.M.; Bach, V.; Finkbeiner, M. Resource assessment of renewable energy systems—A review. Sustainability 2021, 13, 6107. [Google Scholar] [CrossRef]
  14. Francis, C.; Costa, A.S.; Thomson, R.C.; Ingram, D.M. Developing a Multi-Criteria Assessment Framework for Smart Local Energy Systems; Technical Report; EnergyREV, University of Strathclyde: Glasgow, UK, 2020; pp. 1–16. [Google Scholar]
  15. Li, Y.; O’Donnell, J.; García-Castro, R.; Vega-Sánchez, S. Identifying stakeholders and key performance indicators for district and building energy performance analysis. Enery Build. 2017, 155, 1–15. [Google Scholar] [CrossRef] [Green Version]
  16. Dakheel, J.A.; Pero, C.D.; Aste, N.; Leonforte, F. Smart buildings features and key performance indicators: A review. Sustain. Cities Soc. 2020, 61, 102328. [Google Scholar] [CrossRef]
  17. Design4Energy. Report 2.1 B Indicators and Success Factors for Holistic Energy Matching; Technical Report; 2015; Available online: http://www.design4energy.eu/Download.html (accessed on 10 January 2022).
  18. Pramangioulis, D.; Atsonios, K.; Nikolopoulos, N.; Rakopoulos, D.; Grammelis, P.; Kakaras, E. A methodology for determination and definition of key performance indicators for smart grids development in island energy systems. Energies 2019, 12, 242. [Google Scholar] [CrossRef] [Green Version]
  19. Ntafalias, A.; Papadopoulos, P.; Tsakanikas, S.; Menyktas, K.; Kentzoglanakis, K.; Kyriakopoulos, G.; Courouclis, I.; Papadopoulos, G.; Kousouris, S.; Tsitsanis, A. D2.1 Definition of SPARCS Holistic Impact Assessment Methodology and Key Performance Indicators; Technical Report; 2020; Available online: https://www.sparcs.info/about/deliverables/d201-definition-sparcs-holistic-impact-assessment-methodology-and-key (accessed on 10 January 2022).
  20. Yang, Y.; Jurasz, J.; Li, H.; Syrri, A.L.A.; Yan, J. Key Performance Indicators on Flexibility of a Multi-Energy System. In Proceedings of the Applied Energy Symposium: Low Carbon Cities and Urban Energy Systems (CUE), Xiamen, China, 16–18 October 2019; pp. 1–7. [Google Scholar]
  21. Walnum, H.T.; Sørnes, K.; Mysen, M.; Sørensen, Å.L.; Almås, A.J. Preliminary Toolkit for Goals and KPIs—PI-SEC, Planning Instruments for Smart Energy Communities; Technical Report; 2017; Available online: https://www.ntnu.edu/documents/21392748/1276440712/PI-SEC+-+Report+task+1.2+_Preliminary+toolkit+for+goals+and+KPIs.pdf/9231b522-f912-44ca-93f4-96bbf51f4929 (accessed on 10 January 2022).
  22. SONDER. Service Optimization of Novel Distributed Energy Regions. Available online: https://www.project-sonder.eu/about/ (accessed on 10 January 2022).
  23. Bosch, P.; Jongeneel, S.; Rovers, V.; Neumann, H.M.; Airaksinen, M.; Huovila, A. CITYkeys Indicators for Smart City Projects and Smart Cities; Technical Report; 2017; Available online: https://nws.eurocities.eu/MediaShell/media/CITYkeystheindicators.pdf (accessed on 10 January 2022).
  24. Franzl, G.; Wilker, S. Technical Framework on Local Energy Communities (TF-LEC) Vol.1 Version 0.5—First Trial Release; Technical Report; Forschungsbereich Software-Intensive Systems: Vienna, Austria, 2021; pp. 1–74. [Google Scholar]
  25. Groote, M.D.; Fabbri, M.; Volt, J.; Rapf, O.; Marian, C.; Faber, M.; D’angiolella, R. Smart Buildings in a Decarbonised Energy System—10 Principles to Deliver Real Benefits for Europe’s Citizens—BPIE; Technical Report; Buildings Performance Institute Europe: Brussels, Belgium, 2016; pp. 1–28. [Google Scholar]
  26. Benedettini, S.; Brugnetta, G.; Fumiatti, F.; Gentili, P.; Ghiglione, G.; Giordano, V.; Gidron, A.; Küpper, G.; Mandatova, P.; Masci, R.; et al. Assessment and Roadmap for the Digital Transformation of the Energy Sector Towards an Innovative Internal Market; Technical Report; European Commission: Brussels, Belgium, 2020; pp. 1–327. [Google Scholar]
  27. Bauwens, T.; Schraven, D.; Drewing, E.; Radtke, J.; Holstenkamp, L.; Gotchev, B.; Yildiz, Ö. Conceptualizing community in energy systems: A systematic review of 183 definitions. Renew. Sustain. Energy Rev. 2022, 156, 111999. [Google Scholar] [CrossRef]
  28. Tounquet, F.; Vos, L.D.; Abada, I.; Kielichowska, I.; Klessmann, C. Energy Communities in the European Union—Revised Final Report; Technical Report; European Commission: Brussels, Belgium, 2019; pp. 1–142. [Google Scholar]
  29. THEMA Consulting Group; Multiconsult Norge AS. Descriptive Study of Local Energy Communities; Technical Report 1; Norwegian Water Resources and Energy Directorate: Oslo, Norway, 2019; pp. 1–49.
  30. IEA. Empowering Cities for a Net Zero Future: Unlocking Resilient, Smart, Sustainable Urban Energy Systems; Technical Report; International Energy Agency: Paris, France, 2021; pp. 1–111. [Google Scholar]
  31. Pellerin, B.; Puranik, S.; Tuiskula, H.; Kunze, C.; Willems, C.; Loock, M.; Murphy, B. D7.1—Market and Stakeholder Analysis; Technical Report; 2019; Available online: https://elandh2020.eu/wp-content/uploads/2020/09/D7.1-Market-and-stakeholder-analysis.pdf (accessed on 10 January 2022).
  32. Morandi, C.; Rolando, A.; Vita, S.D. From Smart City to Smart Region—Digital Services for an Internet of Places, 1st ed.; PoliMI SpringerBriefs: Milano, Italy, 2016; pp. 1–103. [Google Scholar]
  33. Sutriadi, R. Defining smart city, smart region, smart village, and technopolis as an innovative concept in indonesia’s urban and regional development themes to reach sustainability. IOP Conf. Ser. Earth Environ. Sci. 2018, 202, 012047. [Google Scholar] [CrossRef] [Green Version]
  34. Calvillo, C.F.; Miralles, A.S.; Villar, J. Energy management and planning in smart cities. Renew. Sustain. Energy 2016, 55, 273–287. [Google Scholar] [CrossRef] [Green Version]
  35. Matern, A.; Binder, J.; Noack, A. Smart regions: Insights from hybridization and peripheralization research. Eur. Plan. Stud. 2020, 28, 2060–2077. [Google Scholar] [CrossRef] [Green Version]
  36. Zhao, Y.; Ma, L.; Li, Z.; Ni, W. The development of regional smart energy systems in the World and China: The concepts, practices, and a new perspective. Wiley Interdiscip. Rev. Data Min. Knowl. Discov. 2021, 11, e1409. [Google Scholar] [CrossRef]
  37. Energy Community. Electricity Market Functions—Short Overview and Description; Technical Report; Energy Community Secretariat: Vienna, Austria, 2020; pp. 1–9. [Google Scholar]
  38. Lavrijssen, S.; Marhold, A.; Trias, A. The Changing World of the DSO in a Smart Energy System Environment: Key Issues and Policy Recommendations; Technical Report; Centre on Regulation in Europe: Brussels, Belgium, 2016; pp. 1–98. [Google Scholar]
  39. Oosterkamp, P.V.D.; Koutstaal, P.; Welle, A.V.D.; Joode, J.D.; Lenstra, J.; Hussen, K.V.; Haffner, R. The Role of DSOs in a Smart Grid Environment; Technical Report; ECORYS: Rotterdam, The Netherlands, 2014; pp. 1–145. [Google Scholar]
  40. Khajeh, H.; Laaksonen, H.; Gazafroud, A.S.; Khah, M.S. Towards flexibility trading at TSO-DSO-customer levels: A review. Energies 2019, 13, 165. [Google Scholar] [CrossRef] [Green Version]
  41. Klaassen, E.; Laan, M.V.D. Energy and Flexibility Services for Citizens Energy Communities. In USEF White Paper; 2019; pp. 1–19. Available online: https://www.usef.energy/new-white-paper-energy-flexibility-services-for-citizens-energy-communities/# (accessed on 10 January 2022).
  42. Gancheva, M.; O’Brien, S.; Crook, N.; Monteiro, C. Models of Local Energy Ownership and the Role of Local Energy Communities in Energy Transition in Europe; Technical Report; European Committee of the Regions: Brussels, Belgium, 2018; pp. 1–71. [Google Scholar]
  43. CENELEC EN 50160; Voltage Characteristics of Electricity Supplied by Public Electricity Networks. European Committee for Electrotechnical Standardization: Brussels, Belgium, 2010; pp. 1–44.
  44. Strbac, G.; Djapic, P.; Pudjianto, D.; Konstantelos, I.; Moreira, R. Strategies for Reducing Losses in Distribution Networks; Technical Report; Imperial College London: London, UK, 2018; pp. 1–87. [Google Scholar]
  45. Ochoa, L.F.; Harrison, G.P. Minimizing Energy Losses: Optimal Accommodation and Smart Operation of Renewable Distributed Generation. IEEE Trans. Power Syst. 2011, 26, 198–205. [Google Scholar] [CrossRef] [Green Version]
  46. Strbac, G.; Pudjianto, D.; Aunedi, M.; Djapic, P.; Teng, F.; Zhang, X.; Ameli, H.; Moreira, R.; Brandon, N. Role and value of flexibility in facilitating cost-effective energy system decarbonisation. Prog. Energy 2020, 2, 042001. [Google Scholar] [CrossRef]
  47. IEEE 610-1990; IEEE Standard Computer Dictionary: A Compilation of IEEE Standard Computer Glossaries. The Institute of Electrical and Electronics Engineers: New York, NY, USA, 1991; pp. 1–218.
  48. CEN-CENELEC-ETSI. CEN-CENELEC-ETSI: Smart Grid Coordination Group—Smart Grid Reference Architecture; Technical Report; 2012; Available online: https://ec.europa.eu/energy/sites/ener/files/documents/xpert_group1_reference_architecture.pdf (accessed on 10 January 2022).
  49. Interoperability in Healthcare. Available online: https://www.himss.org/resources/interoperability-healthcare (accessed on 10 January 2022).
  50. Mateus, M.; Maló, P.; Almeida, B.; Teixeira, T. Towards measuring information interoperability based on model transformations. In Proceedings of the 6th Iberian Conference on Information Systems and Technologies (CISTI 2011), Chaves, Portugal, 15–18 June 2011; pp. 1–4. [Google Scholar]
  51. Berezovskaya, Y.; Yang, C.W.; Vyatkin, V. Towards Extension of Data Centre modeling Toolbox with Parameters Estimation. In Technological Innovation for Applied AI Systems; Camarinha-Matos, L.M., Ferreira, P., Brito, G., Eds.; Springer International Publishing: Cham, Switzerland, 2021; pp. 189–196. [Google Scholar]
  52. Energy Innovation Policy & Technology LLC. How Much Energy Do Data Centers Really Use? Available online: https://energyinnovation.org/2020/03/17/how-much-energy-do-data-centers-really-use/ (accessed on 10 January 2022).
  53. Yin, Y.; Wu, J.; Zhou, X.; Eeckhout, L.; Qouneh, A.; Li, T.; Yu, Z. COPA: Highly Cost-Effective Power Back-Up for Green Datacenters. IEEE Trans. Parallel Distrib. Syst. 2020, 31, 967–980. [Google Scholar] [CrossRef]
  54. Brännvall, R.; Siltala, M.; Gustafsson, J.; Sarkinen, J.; Vesterlund, M.; Summers, J. EDGE: Microgrid Data Center with Mixed Energy Storage. In Proceedings of the Eleventh ACM International Conference on Future Energy Systems (e-Energy 2020), Melbourne, Australia, 22–26 June 2020; pp. 466–473. [Google Scholar]
  55. Herbst, I.; Lukovic, S.; Gasparin, A.; Schulz, N.; Witzig, J.; Kieber, S. Lv grid data analysis demonstrated at dso arbon energie. In Proceedings of the 25th International Conference and Exhibition on Electricity Distribution, Madrid, Spain, 3–6 June 2019; pp. 1–5. [Google Scholar]
  56. Franzl, G.; Goranovic, A.; Wilker, S.; Sauter, T.; Treytl, A. Initiating an IES based Technical Framework on Local Energy Communities. In Proceedings of the 2020 25th IEEE International Conference on Emerging Technologies and Factory Automation (ETFA), Vienna, Austria, 8–11 September 2020; Volume 1, pp. 1131–1134. [Google Scholar] [CrossRef]
  57. Gottschalk, M.; Franzl, G.; Frohner, M.; Pasteka, R.; Uslar, M. From integration profiles to interoperability testing for smart energy systems at connectathon energy. Energies 2018, 11, 3375. [Google Scholar] [CrossRef] [Green Version]
  58. IEC 61850:2021; Communication Networks and Systems for Power Utility Automation. IEC: Geneva, Switzerland, 2021; Volume 1.0, pp. 1–7618.
  59. IEC 61499-1:2012; Function Blocks—Part 1: Architecture. IEC: Geneva, Switzerland, 2012; Volume 2.0, pp. 1–245.
  60. Wang, Q.; Huang, N.; Lin, H.; Li, H.; Wennersten, R.; Sun, Q. Potential of energy saving in a data center—Application of an agent-based modeling. Energy Procedia 2017, 105, 3903–3908. [Google Scholar] [CrossRef]
Figure 1. Primary energy mix and RES share in DERs at EU-28 level for the: (a) distributed energy scenario, and (b) global ambition scenario [8].
Energies 15 01289 g001
Figure 2. KPI framework used for various application areas based on the SES requirements and the stakeholders’ objectives.
Energies 15 01289 g002
Figure 3. Different application areas of SESs and main groups of stakeholders that can be engaged in their development and operation.
Energies 15 01289 g003
Figure 4. Increasing demand flexibility due to arbitrage from an energy storage system.
Energies 15 01289 g004
Table 1. SES requirements and stakeholders’ objectives.
SES RequirementsStakeholder ObjectivesInterested Stakeholders
R1.1Network
Operation
Optimization
R1.1Peak Power ShavingA, B, C
R1.2Voltage SupportA, B
R1.3Reduced Grid LossesA, B, D
R1.4Improved RES—Load PredictionA, B
R1.5Forecasting Error CompensationA, B
R1.6Reduced Grid Operational CostsA, B
R1.7Improved Reliability—ResilienceA, B, D
R2Improved
Network
Development
R2.1Improved Grid Assets’ UsageA, B, D
R2.2Deferral of Grid UpgradesA, B, D
R3Increased
Flexibility
R3.1Increased Demand FlexibilityA, B, C
R3.2Increased RES Hosting CapacityA, B, D, E
R3.3Increased RES Self-ConsumptionA, B, C
R3.4Increased RES Self-SufficiencyA, B, C, D, E
R4Enhanced
System
Feasibility
R4.1Technical FeasibilityA, B, C, E
R4.2Economic SustainabilityA, B, C, D, E
R4.3Environmental SustainabilityA, B, C, D, E
R4.4Social SustainabilityD, E
R4.5Legal FeasibilityA, B, C, D, E
R5Improved
Interoperability
R5.1Systems interoperabilityA, B, E
R5.2Structural InteroperabilityA, B, E
R5.3Semantic InteroperabilityA, B, E
R6Improved
Model Accuracy
R6.1Electrical System modelingA, B, E
R6.2Thermal System modelingA, B, E
A—system operators; B—energy service suppliers; C—end customers; D—authorities; E—other third-party providers.
Table 2. SES requirements and stakeholder objectives for the SONDER project and mapping to the national project scenarios (X—evaluated; O—affected, but not evaluated; “-”—not evaluated).
SES RequirementsStakeholder ObjectivesATCHSE
R1Network
Operation
Optimization
R1.1Peak Power ShavingOX-
R1.2Voltage SupportOXX
R1.3Reduced Grid LossesOX-
R1.4Improved RES—Load PredictionXX-
R1.5Forecasting Error Compensation-X-
R1.6Reduced Grid Operational Costs-X-
R1.7Improved Reliability—Resilience-O-
R2Improved
Network
Development
R2.1Improved Grid Assets’ UsageOX-
R2.2Deferral of Grid UpgradesOX-
R3Increased
Flexibility
R3.1Increased Demand FlexibilityXXX
R3.2Increased RES Hosting CapacityXX-
R3.3Increased DER Self-ConsumptionX-X
R3.4Increased DER Self-SufficiencyX-X
R4Enhanced
System
Feasibility
R4.1Technical FeasibilityXX-
R4.2Economic SustainabilityXX-
R4.3Environmental SustainabilityX--
R4.4Social SustainabilityO--
R4.5Legal FeasibilityOO-
R5Improved
Interoperability
R5.1Systems interoperabilityX--
R5.2Structural Interoperability--X
R5.3Semantic Interoperability--X
R6Improved
Model Accuracy
R6.1Electrical System modeling--X
R6.2Thermal System modeling--X
Table 3. KPIs for network operation optimization.
ObjectiveKPIDescriptionFormulaUnit
R1.1Peak power
shaving
R1.1.1. Peak
load reduction
Reduction of the maximum
peak load on daily basis
Δ P ^ = P ^ P ^
p ^ = P ^ P ^ P ^
P ^ , P ^ = Daily peak power
without and with the SES
[MW]
[%]
R1.1.2. Load factorVariability of load consumption L F = 100 · P a v g P ^
P ^ , P a v g = Peak and average powers
on daily or monthly basis
[%]
R1.2Voltage
support
R1.2.1. Voltage
variations
Difference between the actual
and nominal voltage at node i
when applying the SES
Δ v i ( t ) = 100 · V i ( t ) V n o m V n o m
V i ( t ) , V n o m = Actual and nominal
voltages at node i applying the SES
[%]
R1.2.2. Voltage
improvement
Improvement of voltage at
node i applying the SES
Δ V i m p = V i ( t ) V i ( t )
V i ( t ) , V i ( t ) = Actual voltages at
node i without and with the SES
[V]
R1.3Reduced
grid losses
R1.3.1. Grid
losses
Power losses on distribution
cables and transformers
when applying the SES
P l o s s ( t ) = r i j · | I i j ( t ) | 2
r i j = Resistance of branch i j
I i j ( t ) = Complex current on branch i j
[kW]
R1.3.2. Reduction
of grid losses
Reduction of grid losses
when applying the SES
Δ P l o s s = ( P l o s s ( t ) P l o s s ( t ) )
P l o s s ( t ) , P l o s s ( t ) = Power losses at time t
without and with the SES
[kW]
R1.4Improved RES–
load prediction
R1.4.1. Mean
absolute error
Average of the absolute
residuals (prediction errors)
M A E = 100 · ( z f ( t ) z m ( t ) ) N s
z f ( t ) , z m ( t ) = Forecast and measurement
N s = Number of timesteps t per day
[MW]
R1.4.2. Root
mean square error
Standard deviation of the
residuals (prediction errors)
R M S E = 100 · ( z f ( t ) z m ( t ) ) 2 N s
z f ( t ) , z m ( t ) = Forecast and measurement
N s = Number of timesteps t per day
[MW]
Table 4. KPIs for network operation optimization (continued).
ObjectiveKPIDescriptionFormulaUnit
R1.5Compensation
of forecasting
errors
R1.5.1. BESS
energy utilization
Total SES energy used
for compensation of
forecasting errors on daily,
monthly, or annual basis
E c o m p , i = E c o m p , i ( t )
e c o m p , i = 100 · E c o m p , i E s e s , i
E c o m p , i ( t ) = SES energy used for
compensation of forecasting errors
at time t of day, month, or year i
E s e s , i = Total SES utilized
energy per day, month, or year i
[MWh]
[%]
R1.6 Reduction of
grid operational
costs
R1.6.1. T&D
power cost
Total monthly charge for
the DSO due to the monthly
peak power demand
C p = c p ^ · P ^
c p ^ = Active power tariff due to
monthly peak power demand P ^
[CHF]
R1.6.2. T&D
energy cost
Total daily energy cost
due to the usage of the
T&D infrastructure
C u s e = c u s e · E g r i d ( t )
c u s e = fixed fee due to T&D use
E g r i d ( t ) = Energy purchased at time t
[CHF]
R1.6.3. Energy
purchase cost
Energy purchase costs from
energy transactions with
a regional energy provider
C g r i d = c p r i c e ( t ) · E g r i d ( t )
c p r i c e ( t ) = Energy (EPEX) price at time t
E g r i d ( t ) = Energy purchased at time t
[CHF]
R1.6.4. Total grid
operational
costs
Sum of T&D power and
energy costs and energy
purchase cost
C t o t = C g r i d + C p + C u s e
C t o t = Total cost with the SES
[CHF]
R1.6.5. Reduction of
grid operational
costs
Reduction of grid
operational costs when
operating the SES
Δ C t o t = C t o t C t o t
Δ c t o t = 100 · C t o t C t o t C t o t
C t o t = Total cost without the SES
[CHF]
[%]
Table 5. KPIs for improved network development.
ObjectiveKPIDescriptionFormulaUnit
R2.1Improved
utilization
of grid assets
R2.1.1. Average
capacity factor
Fraction of the average C F a v g = 100 · I t h , a v g I t h , n o m [%]
yearly thermal loading I t h , a v g , I t h , n o m = Average yearly
to the rated value forand nominal thermal loading
cables and transformersof cables and transformers
R2.1.2. Peak
capacity factor
Fraction of the peak C F p e a k = 100 · I t h , p e a k I t h , n o m [%]
yearly thermal loading I t h , p e a k , I t h , n o m = Peak yearly
to the rated value forand nominal thermal loading
cables and transformersof cables and transformers
R2.2Deferral of
grid upgrades
R2.2.1. Reduction
of grid upgrade
costs
Reduction of costs
related to grid
reinforcement
Δ C u p g = C u p g C u p g
c u p g = 100 · C u p g C u p g C u p g
C u p g , C u p g = grid upgrade costs
without and with the SES
[CHF]
[%]
Table 6. KPIs for increased flexibility.
ObjectiveKPIDescriptionFormulaUnit
R3.1 Increased
demand
flexibility
R3.1.1. Power
demand flexibility
Ability of SES to
reduce demand
Δ P d f ( t ) = P d f ( t ) P d f ( t )
Δ p d f ( t ) = 100 · P d f ( t ) P d f ( t ) P ^
P d f ( t ) , P d f ( t ) = Load power without
and with the SES at time t
P ^ = Daily peak demand
[MW]
[%]
R3.1.2. Energy
demand flexibility
Percentage of energy
demand served by SES
on daily basis
Δ E d e m , i E d e m , i = 100 · E d e m , i E d e m , i E d e m , i
E d e m , i , E d e m , i = Energy demand
on the MV side of the primary
distribution transformer at day i
without and with the SES
[%]
R3.2 Increased
RES hosting
capacity
R3.2.1. RES
hosting capacity
Hosting capacity
of RES units in the
investigated grid
H C r e s = i = 1 N d e r P n o m , i
h c r e s = 100 · H C d e r P ^ y r
P n o m , i , P ^ y r = Nominal power of i
RES, and peak power of year y r
N r e s = Total number of RES units
[MW]
[%]
R3.2.2. Hosting
capacity increase
Increase of hosting
capacity owing to
SES operation
Δ H C r e s = H C r e s H C r e s
Δ h c r e s = 100 · H C r e s H C r e s H C r e s
H C r e s , H C r e s = RES hosting capacity
without and with the SES
[MW]
[%]
R3.3 Increased
RES self-
consumption
R3.3.2. Self-
consumption
rate increase
Increase of self-
consumption rate when
operating the SES
Δ S C R = S C R S C R
S C R , S C R = Self-consumption
rate without and with the SES
[%]
R3.4 Increased
RES self-
sufficiency
R3.4.1. Self-
sufficiency
rate increase
Increase of self-
sufficiency rate when
operating the SES
Δ S S R = S S R S S R
S S R , S S R = Self-consumption
rate without and with the SES
[%]
Table 7. KPIs for enhanced system feasibility.
ObjectiveKPIDescriptionFormulaUnit
R4.1Technical
feasibility
R4.1.1. Self-
consumption
rate
Part of local RES
production that is
locally consumed
S C R = 100 · 1 E e x p , i E r e s , i
E e x p , i , E r e s , i = Energy exported to the
grid and energy produced by PV at
day, month, or year i
[%]
R4.1.2. Self-
sufficiency
rate
Part of total load
covered by local
RES production
S S R = 100 · E r e s , i E e x p , i E i m p , i + E r e s , i E e x p , i
E e x p , i , E r e s , i = Energy exported to the
grid and energy produced by PV at
day, month, or year i
[%]
R4.1.3. BESS
degradation
rate
Capacity losses on
BESS due to cycling
and calendar effects
B D R = 100 · B C i B C o i · B C o
B C o , B C i = Battery capacity
initially, and after i periods
[%]
R4.2Economic
sustainability
R4.2.1. Energy
cost savings
factor
Difference of energy
costs for EC members
when operating the SES
C s = 100 · C e c C e c C e c
C e c , C e c = energy costs for the EC
members without and with the SES
[%]
R4.2.2. Annual
cost savings
Savings on annual
grid operational costs
for the DSO with the SES
Δ c t o t = 100 · C t o t C t o t C t o t
C t o t , C t o t = Total operational cost for
the DSO without and with the SES
[%]
R4.3Environmental
sustainability
R4.2.1. C O 2 /GHG
emission reduction
factor
Reduction of C O 2 /GHG
emissions owing to
the RES use in the EC
C O 2 , R = 100 · C O 2 , i C O 2 , i C O 2 , i
C O 2 , i , C O 2 , i = C O 2 /GHG emissions in
period i without and with the SES
[%]
Table 8. KPIs for improved interoperability.
ObjectiveKPIDescriptionFormulaUnit
R5.1Systems
interoperability
R5.1.1. Number
of new integration
profiles
Newly created integration
profiles based on the
IES methodology
Not applicable[-]
R5.1.2. Number
of tested integration
profiles
Integration profiles
tested in the context of
“Connectathon Energy”
Not applicable[-]
R5.2Structural
interoperability
R5.2.1. Interoperability
capacity
Structural interoperability
between two standards
C a = 100 · T S
S , C = number of source
[%]
R5.3Semantic
interoperability
R5.3.1. Interoperability
level between
Measured with the five-
point likert scale
standards
Not applicable[-]
Table 9. KPIs for improved model accuracy.
ObjectiveKPIDescriptionFormulaUnit
R6.1
Electrical
system
modeling
R6.1.1. Mean
absolute error
Average magnitude of
the absolute variations
between measured and
predicted values
M A E = 1 N i = 1 N | P m , i P r , i |
P m , i , P r , i = Measured and predicted value
of DC power consumption (W) at time i
N = number of timesteps
[kW]
R6.1.2. Root
mean absolute
error
Average magnitude of
the squared variations
between measured and
predicted values
R M S E = 1 N i = 1 N ( P m , i P r , i ) 2
P m , i , P r , i = Measured and predicted value
of DC power consumption (W) at time i
N = number of timesteps
[kW]
R6.1.3. Mean
absolute error
Relative error between
the measured and
predicted values
M A E = 1 N i = 1 N | P m , i P r , i | P r , i
P m , i , P r , i = Measured and predicted value
of DC power consumption (W) at time i
N = number of timesteps
[kW]
R6.1.4. Mean
square error
Average squared difference
between the measured
and predicted values
M S E = 1 N i = 1 N ( P m , i P r , i ) 2
P m , i , P r , i = Measured and predicted value
of DC power consumption (W) at time i
N = number of timesteps
[kW]
R6.2Thermal
system
modeling
R6.2.1. Mean
absolute error
Average magnitude of
the absolute variations
between measured and
predicted values
M A E = 1 N i = 1 N | T m , i T r , i |
T m , i , T r , i = Measured and predicted
value of DC temperature (°C) at time i
N = number of timesteps
[kW]
R6.2.2. Root
mean absolute
error
Average magnitude of
the squared variations
between measured and
predicted values
R M S E = 1 N i = 1 N ( T m , i T r , i ) 2
T m , i , T r , i = Measured and predicted
value of DC temperature (°C) at time i
N = number of timesteps
[kW]
R6.2.3. Mean
absolute error
Relative error between
the measured and
predicted values
M A E = 1 N i = 1 N | T m , i T r , i | T r , i
T m , i , T r , i = Measured and predicted
value of DC temperature (°C) at time i
N = number of timesteps
[kW]
R6.2.4. Mean
square error
Average squared difference
between the measured
and predicted values
M S E = 1 N i = 1 N ( T m , i T r , i ) 2
T m , i , T r , i = Measured and predicted
value of DC temperature (°C) at time i
N = number of timesteps
[kW]
Publisher’s Note: MDPI stays neutral with regard to jurisdictional claims in published maps and institutional affiliations.

