1. Introduction
In several countries, the sectors of essential services, such as electricity, water, and sewage, are concerned about the well-being of citizens and the proper provision of services. For survival and profitability in a competitive scenario, service providers must develop tools capable of measuring and supporting the quality management of their services, as well as the perceived quality and behavioral intentions of their customers. In recent decades, studies on customer satisfaction have absorbed some of the efforts of marketing researchers, research institutes, government agencies, and companies that intend to implement total quality management programs. Thus, one of the main objectives of these organizations is to reach for customer satisfaction [
1]. Owing to the recognition of this management principle, monitoring customer satisfaction is becoming increasingly important to assess the overall performance of companies, including electric utilities companies [
2].
In electricity distribution services, customer satisfaction tends to be measured by technical performance, such as the availability of electricity. Dusky [
3] points out that most of these companies are focused on providing electricity and not meeting customer expectations. However, quality of service is an essential element in electricity distribution services, and its consumers are susceptible to different aspects of the quality of this service.
Today, customers are more informed and reasonable when it comes to product supply in the market. Therefore, the evaluation of customer needs and satisfaction can improve service effectively and, consequently, leads to increased approval [
4]. Filardi et al. [
5] reported that the interruption of electricity distribution, lack of quality service, and delay in real shooting distribution networks have become increasingly frequent in some countries. These problems were the main factors that resulted in customer dissatisfaction, especially for residential customers.
There are many methods to measure customer satisfaction in the literature, and structural equation modeling (SEM) is one of the most commonly used methods. Using SEMs, Zeithaml, Berry, and Parasuraman [
6] demonstrated that behavioral intentions resulting from the impact of the quality of services provided could be detected, especially in the company’s profit. Some studies emphasize reliability indicators to assess customer satisfaction with energy distribution services. Sullivan [
7] proposes measuring customer satisfaction using indicators such as number of electricity service interruptions or power quality problems, total time of shutdown of electricity supply, and notification of the outage in question. Similarly, Fumagalli, Garrone, and Grilli [
8] propose performance measures to analyze the continuity of power supply, punctuality in the processing of customer requests, reliability of the power supply, voltage values, and average duration of system interruptions as measures of satisfaction.
Bearden et al. [
9] propose a broader perspective, suggesting the use of measures such as frequency of complaints, resolution of complaints, and channels available for resolving complaints. On the other hand, in addition to reliability metrics, Jannadi et al. [
10] adopt performance indicators such as courtesy, individual attention, immediate care, empathy, assurance, and responsiveness to measure satisfaction.
Several studies measure customer satisfaction in various segments of essential services, but there are only a few concerning electric utilities. This industry must develop tools capable of measuring and supporting the quality management of the services provided, perceived quality, and behavioral customer intention to ensure survival and profitability in a competitive scenario. The proposal of this work induces concessionaires/licensees of electricity to maintain data on the evolution of their indicators of the quality of service, achieving strategies that improve and lead to consumer satisfaction. In addition, in possession of the stored results obtained through this proposal, it is possible to establish an association model for concessionaires/licensees from the view of electricity consumers to facilitate the diagnosis of problems and their possible solutions. Therefore, studies that consider the potentialities arising from structural equation modeling, both with partial least squares (PLS-SEM) and covariance-based (CB-SEM), together with the monitoring of service quality indicators and forecasting in diagnoses, reduce the gap and justify the proposal of this work.
This paper presents the originality of the evaluation model of customer satisfaction applied to the electricity sector using PLS-SEM and CB-SEM, and compares the results and evaluation, which is the best model. The PLS-SEM and CB-SEM approaches analyze the cause-and-effect relationships between latent constructs [
11]; however, they are different in terms of results, basic assumptions, and estimation procedures [
12,
13]. The PLS-SEM explains the variance of latent constructs by minimizing the assignments of error and maximizing the
values of endogenous constructs [
12,
14]. At the same time, the CB-SEM, on the other hand, follows the procedure of estimation by maximum likelihood, and aims to minimize the difference between the observed and estimated covariance matrix, without focusing on the explained variance [
11].
The work developed requires data from the customer satisfaction questionnaires, generally available for completion on the companies’ websites, making the research work not computationally costly. It can be applied in monitoring and analyzing customer satisfaction, observing the evolution of the quality of the service provided, and assisting the development of instruments in supporting decision-making with concessionaires and electricity licensees. The main objective of this work is to apply structural equation modeling using partial least squares (PLS-SEM) and structural equation modeling based on covariance (CB-SEM) to evaluate the satisfaction of residential electricity customers concerning electric utilities and licensees that provide their services. The secondary objectives of this study are exploratory and descriptive analyses of customer satisfaction index data.
This manuscript has this structure:
Section 2 describes some international legislation on the quality of electricity, general concepts of customer satisfaction, brief information on structural equation modeling by partial least squares (PLS-SEM), and structural equation modeling based on covariance (CB-SEM).
Section 3 presents the proposed methodology.
Section 4 shows the results obtained from the proposed method, and soon after, the results are discussed. The conclusions are presented in
Section 5.
3. Methodology
This section presents the methodology used to understand how different indicators contribute to achieving residential electricity consumer satisfaction, assessing the fulfillment of these consumers when it comes to concessionaires and licensees that provide electricity distribution services. Therefore, verification is carried out on the instrument and the procedures used for data collection, presenting the process of descriptive data analysis, and the construction of structural equation modeling based on partial least squares, and structural equation modeling based on covariance. The proposed method is illustrated in
Figure 1, with a brief description of the five stages required for the resulting model.
3.1. Data Collection
From the electronic system of the citizen information service (SESIC), it is possible to obtain access to the information necessary to calculate the satisfaction of residential electricity consumers. In this way, reference data are obtained regarding the customer’s perception of the regulation, production, transmission, distribution, and commercialization of electric energy.
The data obtained by SESIC are generally formatted in a structure for mathematical processing, consisting of recording observations and variables of interest. SESICs were used in most cases as .CSV files. The defining variables used were: household, sex, age group, education, family income, and value of last energy bill, among others.
3.2. Pre-Analysis
With the data in hand, pre-treatment was carried out based on the population to be studied. Thus, the population is made up of residential electricity consumers, and the number of respondents varies according to the size of each energy distributor. In describing the qualitative variables characterizing the energy companies and the sample, absolute and relative frequencies are used. In contrast, measures of position, central tendency, and dispersion are used to describe quantitative variables and the description constructs’ items.
The grouping analysis of individuals was performed using the non-hierarchical k-prototypes method. The k-prototype grouping combines the k-means and k-modes techniques, allowing the simultaneous use of numerical and categorical variables. In the pre-treatment, after identifying the outliers, it is necessary to verify whether the exclusion of data produces or does not underestimate the analysis results.
3.3. Theoretical Model
In the model proposed for assessing the satisfaction of residential electricity customers, the approach of structural equations considered the main measurement characteristics of the American Customer Satisfaction Index (ACSI) and the ANEEL Customer Satisfaction Index (IASC). To build a structural equation model that represents the factors that lead to the satisfaction of residential electricity consumers, it is necessary first to elaborate on the theoretical model that determines the multiple dependency relationships between the variables. In this way, the satisfaction, quality, value, loyalty and trust constructs were tested.
In this proposal, satisfaction is considered as the assessment of the degree of adjustment of the service provided by concessionaires/licensees of electric energy to the expectations of the customer. Quality is the customer’s perception of fitness guided by their needs, expectations, and how much the customer perceives the quality in the service provided. Value is considered as the assessment of the relationship between costs and benefits perceived by the consumer about electricity services. Loyalty is defined as the consumer’s commitment to continue consuming the service consistently, depending on the tariff, supply, or service, even though they know that they cannot change providers, since most of the time, there is monopolization of the power distribution service. Trust assesses whether consumers consider electricity suppliers to be reliable, concerned with consumers themselves, or competent in providing the right services and information providers.
Figure 2 illustrates the direct relationships between each construct. Thus, trust is related to perceived quality, satisfaction and loyalty. Perceived quality is related to value and satisfaction, and value is related only to satisfaction. Finally, satisfaction is related to loyalty.
The theoretical model illustrated in
Figure 2 consists of a systematic set of relationships that provide explanations about consumer satisfaction, and is not restricted to the theory of consumer satisfaction, but is grounded in experience and practice obtained from observation.
3.4. Statistical Analysis
To verify the validity of the ability of each construct’s set of indicators to accurately represent its respective concept, a measurement model was developed in which dimensionality, reliability, convergent validity, and discriminant validity were evaluated. To verify the dimensionality of the constructs, the Kaiser criterion was used in this study. Convergent and discriminant validity were used as the criteria proposed by Fornell [
41], which respectively indicate convergent validity, if the average variance extracted (AVE) is greater than 50% or 40% in the case of exploratory research, while discriminant validity occurs when the AVE of the construct is greater than the shared variance of this construct with others.
Cronbach’s alpha (CA) and composite reliability (CR) were used to measure reliability. The CA and CR indicators must be greater than 0.7, to indicate the reliability of the construct, and in experimental research, values above 0.60 are also accepted. To verify the discriminant validity, the cross-factor loading method is used, which indicates discriminant validity when the factor loading of the item is greater than all of its cross-factor loadings.
For the PLS-SEM approach, the bootstrap method was used to calculate the confidence intervals for the weights of the measurement model and the coefficients of the structural model, providing information about the variability of the estimated parameters, thus promoting the validation of the results. In the CB-SEM approach, the model quality parameters were used: comparative fit index (CFI), Tucker–Lewis index (TLI), and root mean square error of approximation (RMSEA), in addition to the p-value to verify that the RMSEA is statistically more significant than 0.05. For the desired adjustment, CFI and TLI were expected to be greater than 0.80. The CFI and TLI values vary in the interval [0, 1], and the closer the matter is to 1, the better the model fit. The RMSEA must present an index of less than 0.10, the ideal being below 0.05.
3.5. Method to Compare Structural Equation Modeling Based on Partial Least Squares and Covariance-Based SEM
One of the objectives of this work is to compare the results obtained by structural equation modeling: (i) based on partial least squares (PLS-SEM) and (ii) based on covariance (CB-SEM). The structural equation model and the measurement model were adjusted for each period/time of the analysis.
4. Results
This section presents the results obtained by applying the proposed methodology. The data used come from concessionaires and licensees of the Brazilian Electricity Regulatory Agency (ANEEL/Brazil). The population for the construction of the database is formed by the set of residential electricity consumers interviewed for the composition of the ANEEL Consumer Satisfaction Index (IASC) in the period from 2014 to 2018. The IASC is obtained annually from a sample survey conducted with residential consumers of all distributors, concessionaires, and licensees, who operate in the Brazilian territory. Approximately 27,000 interviews are conducted per year.
4.1. Database Construction
Concessionaires/licensees concentrate their services in urban areas; however, according to current regulations, electricity distribution services are composed of urban and rural consumers. As the number of rural consumers ≈5% is lower than that of urban consumers ≈85%, the needs of rural areas end up being ignored. The annual satisfaction survey conducted by ANEEL uses samples only from urban residential consumers. Other consumers in other categories, such as trade, industry, and government, are not analyzed. Therefore, the IASC evaluates distributors based only on the opinion of urban residents.
Table 1 provides the distribution of consumer units (CU) in the various consumption classes for all Brazilian concessionaires/licensees.
The research conducted in this work analyzes the satisfaction of the of the customers of the concessionaires/licensees that are primarily urban residential. The pleasure of other clients is not measured, as they are not considered in the sampling of the annual satisfaction survey conducted by ANEEL. Data for assessing the satisfaction of residential electricity consumers were requested from the ANEEL via the electronic system of the citizen information service (SESIC). For 2014 and 2015, 25,186 interviews were conducted each year, 20,230 of which were interviews in 63 concessionaires and 4956 interviews in 38 licensees. In 2016 and 2017, 24,926 interviews were conducted each year, with 19,970 interviews held in 63 concessionaires and 4956 discussions in 38 licensees. In 2018, 23,446 interviews were conducted, 18,490 of which were in the 54 concessionaires and 4956 interviews in the 38 licensees.
After the construction of the database, a pre-analysis was carried out, treating the data to remove those interviewed who did not answer all the questions. With the processed data, there were: 16,704 individuals in 2014, 19,763 individuals in 2015, 19,782 individuals in 2016, 14,618 individuals in 2017, and 15,308 individuals in 2018, totaling 86,175 individuals. The questionnaire contained 50 questions, of which 32 questions were related to the constructs of satisfaction, quality, value, loyalty, and trust. In contrast, the other questions promote a descriptive analysis of the variables that characterizes the sample.
4.2. Descriptive Analysis of Variables
With the database treated, it is possible to perform a descriptive analysis of the variables characterizing the individuals, as shown in
Table 2, in which 79.20% of respondents are responsible for the household.
Most individuals were female (61.71%), 21.50% were between 46 and 55 years old, and 20.80% were between 36 and 45 years old, and these were the most frequent age groups. All interviews were conducted in the interviewees’ homes, and all interviewees had lived in the city for more than six months, knew the name of their electricity company, did not work and had no relatives who worked at the electricity company. All knew the value of their electricity bills.
With most respondents, energy use is exclusively residential, and they do not provide energy to third parties (99.98%). As for the level of education, 35.40% of respondents had not completed elementary school, and 29.30% had completed high school. As for family income, 45.70% of individuals received from US$3974 to US$9937 and 31.3% received annually from US$1807 to US$3974. Thus, 77% of individuals had an annual income between US$1807 and US$9937.
Table 3 shows the groups × variables used in the grouping process, in which the difference between groups and variable values was observed (
p-value < 0.05). There were three groups:
Group 1,
Group 2, and
Group 3. In
Group 1, it was observed that: 87.10% of the individuals interviewed are responsible for the household; 74.60% are men; 28.80% are aged between 46 and 55 years; 64.30% have completed high school with an annual family income between US
$3974 and US
$9937, and 55.10% paid more than US
$28.95 in the last amount on their electricity bills.
Group 2 contained 78.10% of the interviewed individuals responsible for the household; 74.10% were women over 60 years old, 75.8% had only incomplete primary education, and 47.8% had annual family incomes between US$1807 and US$3974. This group had the lowest values for the last electricity bill, with 38% of individuals paying approximately US$12. Group 3 comprised 73.2% of the individuals interviewed as responsible for the household, 77.70% were women, 38.4% were aged between 26 and 35 years, 52.8% had completed high school with an annual family income between US$3974 and US$9937, and the last amounts on the energy bills were between US$19.00 and US$28.95.
4.3. Description of the Theoretical Model
In the description of the theoretical model, the constructs
satisfaction,
quality,
value,
loyalty, and
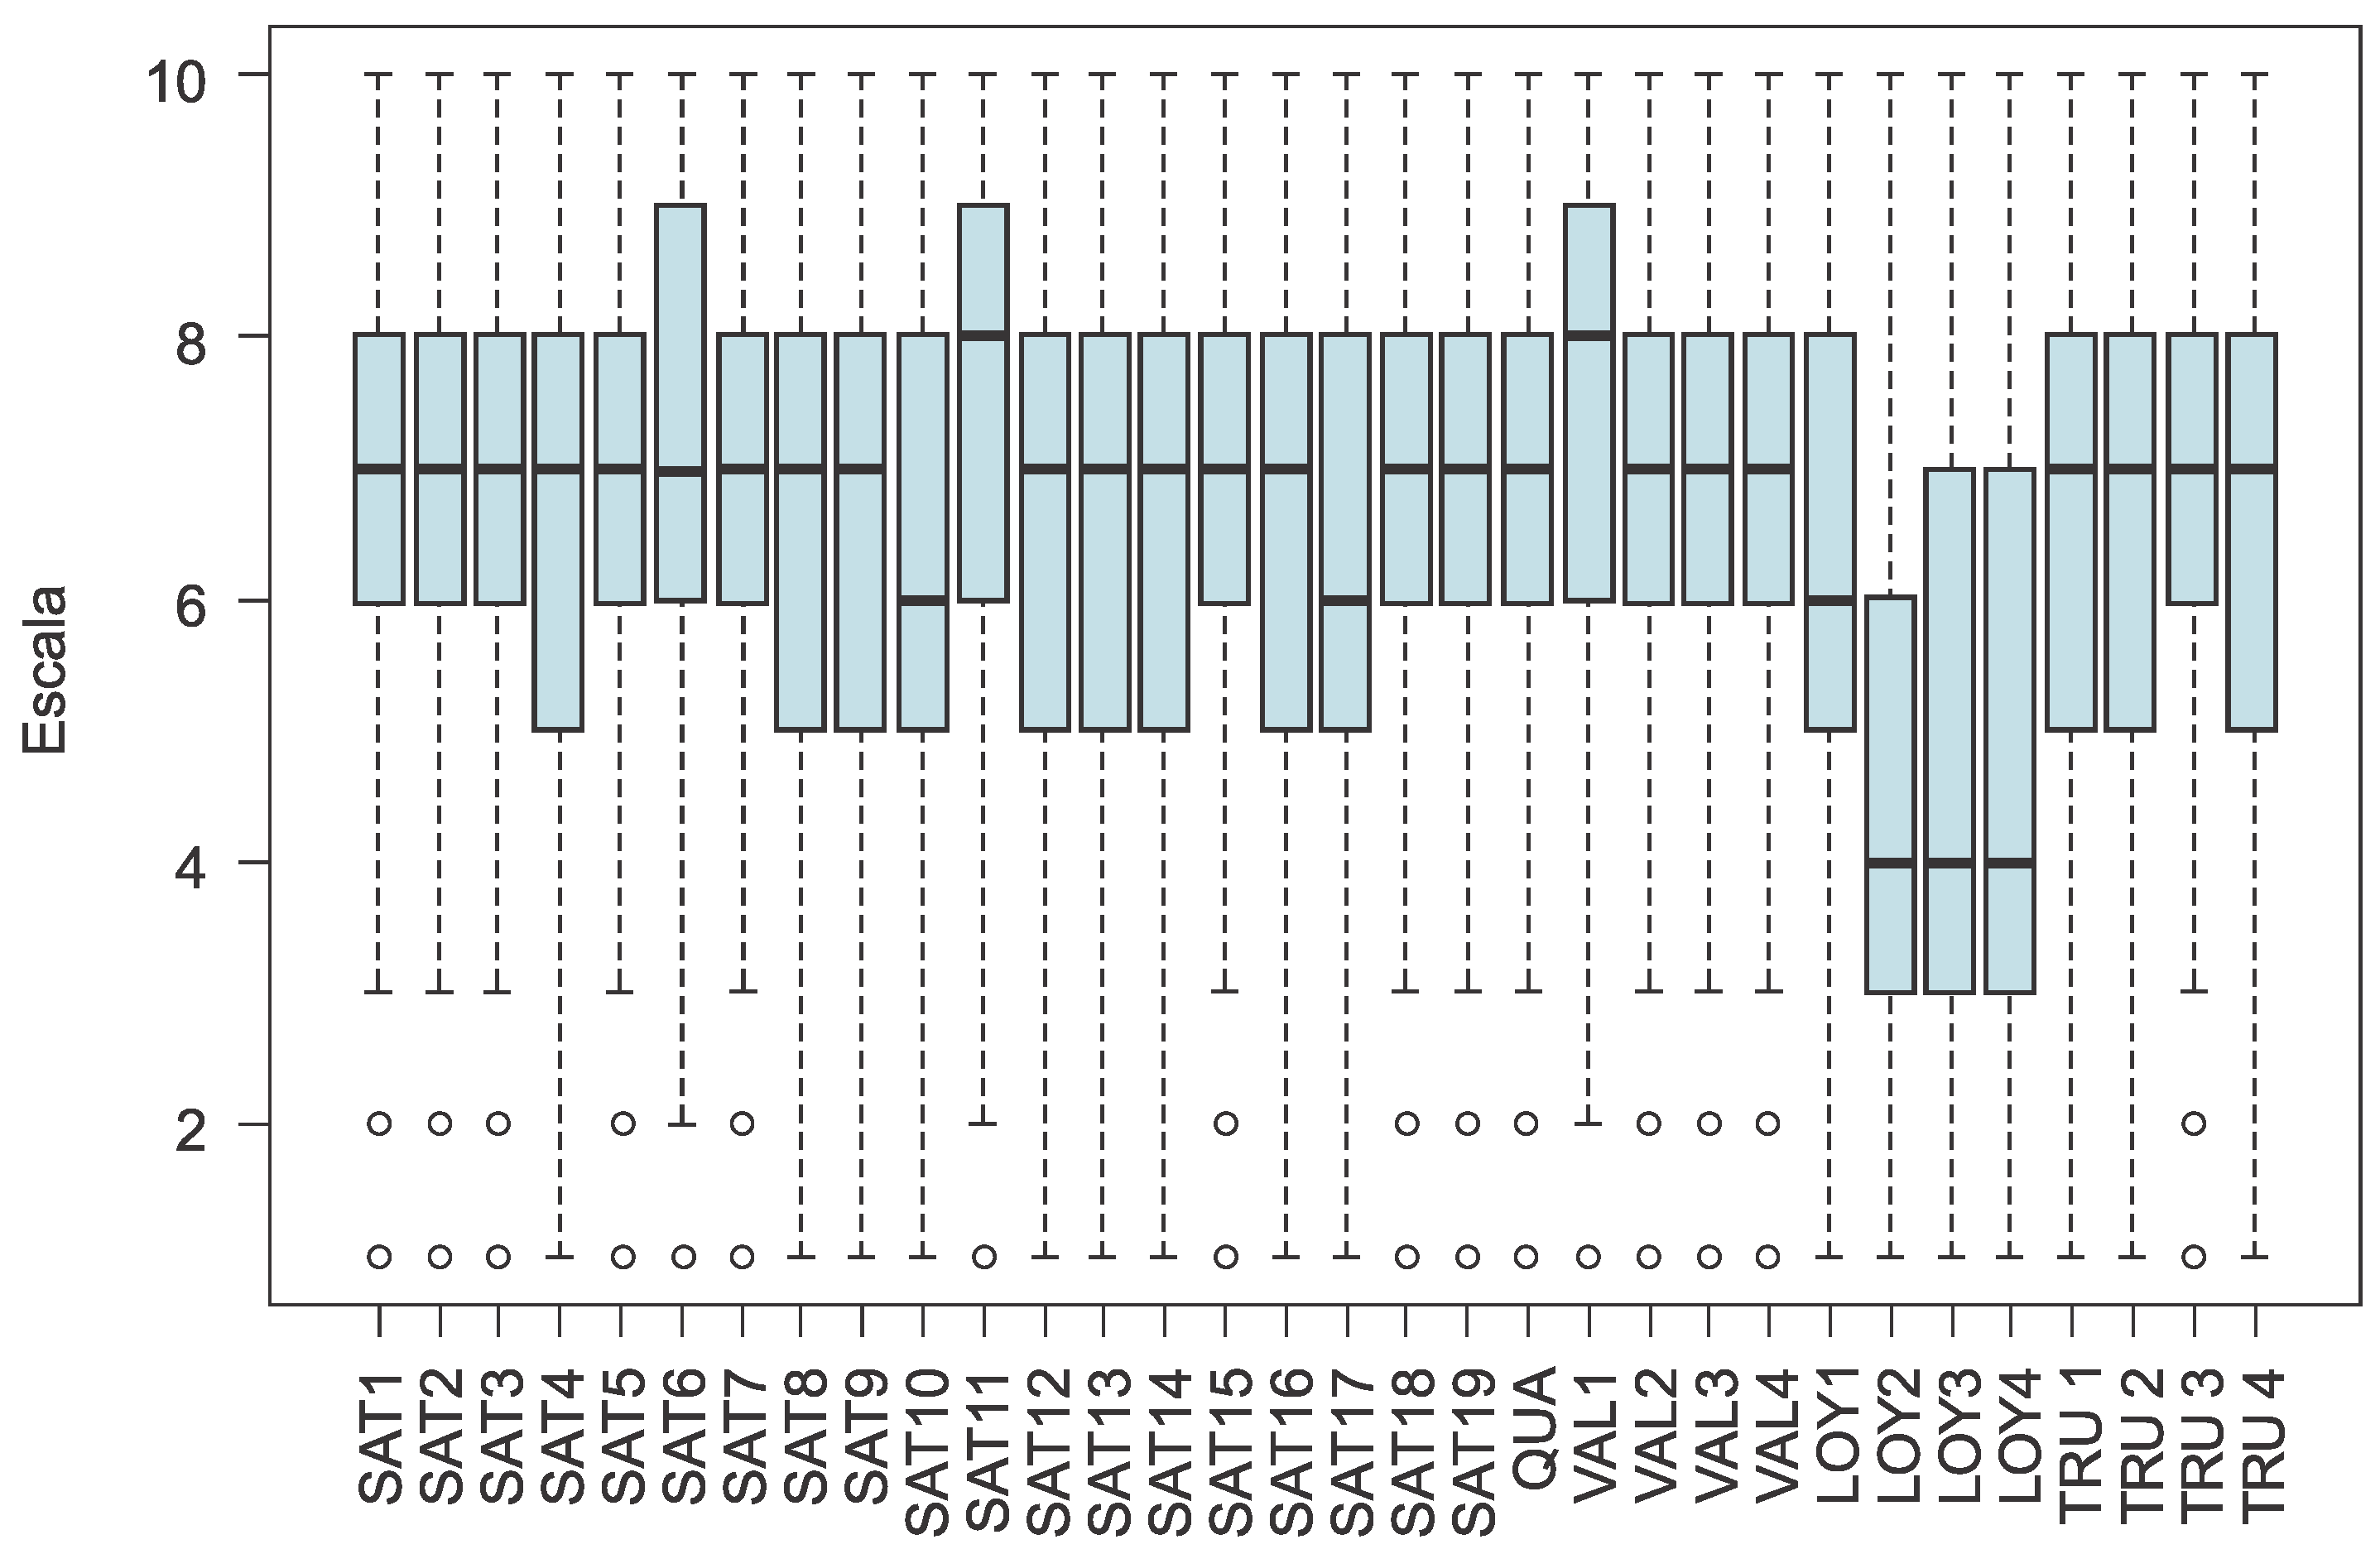
trust are tested. Questions from the ANEEL Consumer Satisfaction Index (IASC) are shown in
Table 4, and in
Figure 3, the distribution and discrepancies in the data of the observable variables that comprise each construct are presented.
Regarding the quality construct, the interviews indicated that QUA was as expected. The satisfaction construct tends to be within what is expected for the items: SAT1, SAT2, SAT3, SAT4, SAT5, SAT7, SAT8, SAT9, SAT10, SAT12, SAT13, SAT14, SAT15, SAT16, and SAT17. Items SAT6, SAT11, and SAT18 tend to be better than expected, and as for SAT19, there is a tendency that the quality is not ideal. In the value construct in items VAL2 and VAL3, there is a tendency for the amount paid to be neither cheap nor expensive, and about items VAL1 and VAL4, there is a tendency for the amount paid to be costly.
Some rating scales are built from items whose conceptual meaning is opposite to that of other items. The assigned value must be inverted to calculate the score in these cases. In this work, for the
loyalty construct, an inversion is performed so that its items are in the same direction as the other constructs. Overall, the interviews indicate that LOY1 would depend on some factors; however, if there was another company with better LOY2, LOY3, and LOY4, the trend would be to switch from one utility company to another. Regarding the
trust construct, items TRU1, TRU2, TRU3, and TRU4 tend to neither agree nor disagree.
Table 5 summarizes the analyses of each construct.
4.4. Measurement Model
In the analysis of measurement models for structural equations modeling based on partial least squares (PLS-SEM), the convergent validity, discriminant validity, and reliability of the constructs were verified. Convergent validity guarantees that the indicators of a given construct are sufficiently correlated to measure the latent concept. Discriminant validity checks whether the constructs effectively measure different aspects of the phenomenon of interest. Reliability indicates the consistency of the measures in the idea to be measured. The results show that all items have factor loadings above 0.50; therefore, excluding items is unnecessary. For confidence intervals (CI-95%), all weights are significant, indicating the importance of all items for forming indicators that represent the constructs.
Table 6 shows the weights, factor loadings, and commonalities of the general measurement model for PLS-SEM.
Table 7 and
Table 8 show the analysis results of the convergent validity, discriminant validity, dimensionality, and reliability of the constructs of the general measurement model.
For the constructs, the Cronbach’s alpha (CA) and composite reliability (CR) indices had values above 0.60, in which the required levels of reliability were reached for all constructs. Using Kaiser’s criterion, all the constructs are one-dimensional. There is convergent validation in all constructs, as they all have an average variance extracted (AVE) greater than 0.40. According to Fornell’s criterion [
41], there is discriminant validation in all constructs, except for the
satisfaction construct, given that the maximum shared variances (MSV) are lower than the respective AVE. Using cross-factor loadings [
42], the
satisfaction construct reaches the discriminant validation criterion, as the factor loadings of the items are higher than their respective maximum cross-factor loadings.
For the measurement model of structural equation modeling based on covariance (CB-SEM), it is necessary to test the normality of the data using the Shapiro–Wilk test (
p-value < 0.05) [
43]. In this analysis, the data are considered to be non-normal and proceed with the investigation in this approach. The method of Satorra and Bentler [
44] was used to create estimators for the covariance structure in the confirmatory factor analysis. The dimensionality, reliability, and convergent validity were verified by analyzing the constructs’ quality and validity. The Kaiser criterion [
45] was used to verify the dimensionality of the constructs. To verify the convergent validity, the criterion proposed by Fornell and Larcker [
41] was used, which indicates convergent validation when the AVE is greater than 50% [
38] or 40% in the case of exploratory research [
46]. To measure reliability, the CA and CR were used [
47]. For discriminant validity, the criterion of Fornell and Larcker [
41] is used, which guarantees discriminant validity when the AVE of a given construct is greater than the shared variance of this construct with the others.
The cross-factor loading method [
42] was used to verify discriminant validation. According to Hair et al. [
33], items with factor loadings less than 0.50 should be eliminated, as they do not contribute significantly to the formation of the latent variable; they impair the reach of the basic assumptions for the validity and quality of the indicators calculated to represent the concept of interest.
Table 9 shows the weights, factor loadings, and commonalities of the items of the constructs in general, indicating that all items have a significant weight and factor loadings above 0.50. The analyses of convergent validity, discriminant validity, and reliability of the constructs of the general model of structural equation modeling based on covariance are shown in
Table 10 and
Table 11.
According to Kaiser’s criterion, all constructs were one-dimensional, with convergent validation in all constructs. In all constructs, the CA and CR indices had values above 0.60, reaching reliability for all constructs. All constructs have an AVE greater than 0.40, and, according to the Fornell and Larcker criterion, there is discriminant validation in all constructs, except the satisfaction construct, given that the maximum shared variances were lower than the respective AVE. Using the method of cross-factor loadings, the satisfaction construct reached the discriminant validation criterion, as the factor loadings of the items were higher than their respective maximum cross-factor loadings.
4.5. Structural Model
To verify the quality of the adjustments of structural equation modeling based on partial least squares (PLS-SEM), the coefficient of determination (
) and goodness of fit (GoF) indices were used [
48]. The GoF is the geometric mean of the AVEs of the constructs and
of the model, and varies from 0% to 100%. The value of
for scale from 0% to 100% represents the extent to which the independent constructs explain the dependents. In contrast, values less than 25% represent weak explanatory capacity, values between 25% and 50% indicate moderate explanatory capacity, and values above 50% define the explanatory capacity [
49]. The GoF in PLS-SEM cannot discriminate valid from invalid models, in addition to not being applied to models with formative constructs [
50]. However, it allows for synthesizing the AVE and
of the model in a single statistic. It is helpful for future comparisons of the adherence of different samples to the model. The results obtained for the structural model using PLS-SEM are presented in
Table 12 and
Figure 4.
With
Table 12 and
Figure 4 in hand, it is possible to carry out the analysis using the constructs. The
trust construct explains 45.2% of the variability in the
quality construct, resulting in moderate explanatory power. The influence occurs with a
p-value < 0.001 and positive with
= 0.672 [0.669; 0.676] of the
trust construct over the
quality construct, indicating that the greater the trust, the greater the quality. The
quality construct explains 5.7% of the variability in the
value construct, indicating a weak explanatory capacity. The
value construct has an influence with a
p-value < 0.001 and negative with
= −0.238 [−0.243; −0.23] of the
quality construct over the
value construct, indicating that the higher the quality, the lower the perception that the amount paid in energy bills is high.
There is an influence of the trust construct on the satisfaction construct with p-value < 0.001 and positive with = 0.391 [0.384; 0.397], indicating that the greater the trust, the greater the satisfaction. The influence measured between the quality construct on the satisfaction construct has a p-value < 0.001 and positive with = 0.548 [0.543; 0.554], indicating that the higher the quality, the greater the satisfaction. There is also the influence of the value construct on the satisfaction construct with p-value < 0.001 and negative with = −0.007 [−0.01; −0.004], indicating that the higher the amount paid on energy bills, the lower the satisfaction. The trust, quality, and value constructs explain 74.4% of the variability of the satisfaction construct, indicating substantial explanatory capacity.
Regarding loyalty, there was a significant influence of trust with p-value < 0.001 and positive with = 0.346 [0.338; 0.356]. Thus, the greater the trust, the greater the loyalty. There was also an influence of the satisfaction construct on the loyalty construct with p-value < 0.001 and positive with = 0.146 [0.136; 0.155]. Trust and satisfaction were able to explain 21.8% of the variability in loyalty; that is, there was weak explanatory capacity. The model presented a GoF of 49.6%, and the bootstrap confidence intervals agreed with the results obtained via the p-value, indicating a greater validity of the results.
To verify the quality of fits in structural equation modeling based on covariance (CB-SEM), as well as in PLS-SEM, the
was used. However, unlike PLS-SEM, CB-SEM still uses the comparative fit index (CFI), Tucker–Lewis index (TLI), and mean squared error of approximation (RMSEA) in addition to the
p-value, to check if the RMSEA is statistically greater than 0.05. In this work, CFI and TLI are expected to be greater than 0.80 [
51], and the RMSEA is lower than 0.10 [
52], ideally
. The results of the structural model using CB-SEM are shown in
Table 13 and shown in
Figure 5.
Regarding quality, there was an influence of the trust construct with p-value < 0.001 and positive with = 0.811. Therefore, the greater the trust, the greater the quality. Trust explained 48.8% of the variability in quality, with moderate explanatory power. The value construct was influenced by the quality construct with p-value < 0.001 and negative with = −0.175, so the higher the quality, the higher the value. The quality explained 6.0% of the variability in value, that is, there was a low explanatory capacity.
Regarding satisfaction, there was a significant and positive influence of the trust construct with p-value < 0.001 and = 0.387; thus, the greater the trust, the greater the satisfaction. There was also a significant and positive influence of quality on satisfaction, with p-value < 0.001 and = 0.393, so the higher the quality, the greater the satisfaction. Finally, there was no significant influence of value on satisfaction. The trust, quality, and value constructs together explained 77.7% of the variability in satisfaction; that is, there was substantial explanatory capacity.
For the loyalty construct, there was a significant influence of the trust construct with p-value < 0.001 and positive with = 0.308, so the greater the trust, the greater the loyalty. Regarding satisfaction with loyalty, there was a significant difference with p-value < 0.001 and positive with = 0.063; that is, the greater the satisfaction, the greater the loyalty. Finally, trust and satisfaction were able to explain 18.2% of the variability in loyalty, with weak explanatory capacity.
Table 14 shows the measures of the goodness of fit for the general CB-SEM model. The values indicate that the general model is satisfactory with values of CFI and TLI
and RMSEA
, with
p-value
.
4.6. Comparison between Structural Equation Modeling Based on Partial Least Squares and Based on Covariance
There are several methods for estimating convergent validity, including factorial load evaluation. The high factorial load indicates that they converge to a common point; that is, there is convergent validity. The literature suggests that the factorial load can be ≤0.5, but the ideal is >0.5. If a given item displays a value <0.5, it becomes a strong candidate to leave the factorial model. From
Table 8 and
Table 11, all item values have a factorial load >0.5, not needing to exclude any item for structural equation modeling based on partial least squares (PLS-SEM), and for structural equation modeling based on covariance (CB-SEM). The comparative analyses of convergent validity, discriminant validity, and reliability of the constructs for the measurement models of the PLS-SEM and CB-SEM are shown in
Table 15 and
Table 16.
According to Fornell’s criterio [
41], when evaluating the PLS-SEM and CB-SEM methods, there is discriminant validation in all constructs, except the
satisfaction construct, given that the maximum shared variances (MSV) are lower than the respective AVE. Using the cross-factor loading method [
42], the
satisfaction construct reaches the discriminant validation criterion, as the factorial load of the items is higher than their respective maximum cross-factor loadings. In addition, from the comparison between the AVE of the constructs by applying PLS-SEM and CB-SEM,
Table 15 shows that the PLS-SEM obtained better results than the CB-SEM, considering that its constructs
trust,
value,
satisfaction, and
loyalty achieved superior values. As the average variance extracted (AVE) is an indicator associated with the quality of the measure, the application of the structural model from the PLS-SEM generates more consistent results.
From the comparison between the averages of the factorial load of the constructs in the application of the PLS-SEM and the CB-SEM, it is also possible to observe in
Table 16 that the PLS-SEM obtained better results than the CB-SEM, since its constructs
trust,
value,
satisfaction, and
loyalty achieved superior values. Factorial load indicates the amount of a given factor that explains a given variable. The application of the structural model based on PLS-SEM generates better results. Another measure is the AVE, which checks the proportion of variance of items by the construct to which they belong. Thus, as in the evaluation of factorial load, the model is considered valid when AVE ≥ 0.4. Therefore, in
Table 15, there is convergent validation in all constructs, whether using PLS-SEM or CB-SEM, as they all have AVE ≥ 0.4.
To confirm the convergent validity, the composite reliability is usually evaluated, which assesses the adequate internal consistency for the PLS-SEM, as it prioritizes the variables according to their reliability. As shown in
Table 15, the constructs had CR ≥ 0.90, for both PLS-SEM and CB-SEM, with the required levels being CR ≥ 0.60. From the comparison between the CR of the constructs by applying the PLS-SEM and CB-SEM, it is also possible to observe in
Table 15 that PLS-SEM obtained better results than CB-SEM.
When comparing the construct’s composite reliability (CR) by applying PLS-SEM and CB-SEM, we observed that the
trust,
value,
satisfaction, and
loyalty constructs of the PLS-SEM reached better values. As composite reliability (CR) is an indicator associated with the quality of the measure, the application of the structural model based on PLS-SEM generates better results. In
Table 15 and
Table 16, the construct
quality for a single indicator is: (i) CR
, (ii) AVE
, and (iii) factor loading
for both structural equation models. The comparative results of the general structural model are listed in
Table 17.
The
trust construct has a greater influence on the
quality construct and presents a higher
in CB-SEM than in PLS-SEM. In CB-SEM, the value construct exerts a greater influence on the
quality construct and presents a higher
in the PLS-SEM. On the other hand, in PLS-SEM, there is a greater influence of the
trust,
quality, and
value constructs on the
satisfaction construct than in CB-SEM. Still, in CB-SEM, the quality of the model’s fit is better because of the higher
compared to PLS-SEM. Finally, the
trust construct and the
satisfaction construct exert greater influence on the
loyalty construct and present a higher
in PLS-SEM than in CB-SEM. Comparative analyses of the convergent validity, discriminant validity, and reliability of the constructs in the measurement models of the groups are shown in
Table 18 and
Table 19.
In
Table 18, there is convergent validation in all constructs, whether using PLS-SEM or CB-SEM for all groups (
Group 1,
Group 2,
Group 3), since all have AVE
. According to Fornell’s criterion [
41], when evaluating the PLS-SEM and CB-SEM methods, they show discriminant validity in all constructs, except the
satisfaction construct, given that MSV < AVE. From the comparison between the averages of the factor loadings of the constructs by applying PLS-SEM and CB-SEM, it is possible to observe in
Table 19 that the PLS-SEM obtained better results than the CB-SEM in all groups. This occurred because the constructs achieved better values for PLS-SEM than CB-SEM.
Using the method of cross-factor loadings [
42], the satisfaction construct reached the discriminant validation criterion because the factor loadings of the items were higher than their respective maximum cross-factor loadings in all groups. In addition, based on the comparison between the AVEs of the constructs by applying PLS-SEM and CB-SEM, it can be observed in
Table 18 that the PLS-SEM obtained better results than the CB-SEM for all groups. From
Table 18, it is observed that the index CR
for constructs using PLS-SEM or CB-SEM in all groups. From the comparison between the CR of the constructs by applying PLS-SEM and CB-SEM, it can be observed in
Table 18 that the PLS-SEM obtained better results than the CB-SEM in all groups. The
quality construct for a single indicator presents values of CR, factor loading, and AVE equal to 1 in all cases. The comparative results of the general structural model for all groups are shown in
Table 20,
Table 21 and
Table 22.
The trust construct exerts a greater influence on the quality construct and presents a higher in the CB-SEM than in the PLS-SEM for all the groups. The value constructs a greater influence on the quality construct in PLS-SEM than in CB-SEM; however, CB-SEM presents a higher than PLS-SEM for all groups. In PLS-SEM, there is almost always the greater influence of the trust, quality, and value constructs on the satisfaction construct than in CB-SEM. Still, in CB-SEM, the quality of the model fit is better because of the higher when compared to PLS-SEM in all groups. Finally, the trust construct and satisfaction construct exerted a greater influence on the loyalty construct and presented a higher in PLS-SEM than in CB-SEM for all groups.
4.7. Discussion
The proposed analysis model comprises five evaluation items: quality, value, satisfaction, trust, and loyalty, whose scores are calculated based on the household survey carried out by ANEEL. In this proposed model, cause and effect are measured to ensure the performance comparison history of distributors over the years. The item satisfaction results from the model considering the concessionaires and licensees together. In the presentation of the results (path diagram), the coefficients that link the evaluated constructs represent the marginal impact of the antecedents, i.e., where the arrows leave, to the focal points, which is where the arrows arrive. For example, between quality and satisfaction is indicative of a trend of 0.7 growth in satisfaction for each point of increase in quality. In this way, so that managers can monitor the quality of the service provided, it is enough to compare the previous with the current . The index can also be used to monitor the quality of services provided. This index assesses how much the change in the focal variable is explained by its antecedents, and the closer to 1, the better the ability to explain the variation in relationships. Thus, managers must monitor the values of annually to compare how the model variables behave.
Several studies measure consumer satisfaction in different segments of essential services, but studies on electricity concessionaires are incipient. To ensure survival and profitability in a competitive scenario, electricity concessionaires must develop tools capable of measuring and supporting the management of the quality of services provided, perceived quality, and consumers’ behavioral intentions. Therefore, this study sought to consider the potential arising from comparing structural equation modeling by partial least squares (PLS-SEM) and based on covariance (CB-SEM). To verify the quality of the PLS-SEM and CB-SEM structural equation modeling adjustments, indices and metrics were used, such as average variance extracted AVE, composite reliability CR, coefficient of determination , and quality of fit GoF. In the CB-SEM approach, specific parameters are also used to assess the quality of the model, such as comparative fit index (CFI), Tucker–Lewis index (TLI), and root mean square error of approximation (RMSEA), in addition to the p-value to verify if the RMSEA is statistically within the desired range.
For PLS-SEM, the trust construct explains 45.2% of the variability in the quality construct, and if the residential consumers of electric energy perceive the electric energy concessionaire or licensee to be trustworthy and provide true information; consequently, the quality perceived by the provision of services tends to be higher. In addition, in PLS-SEM, the quality construct explains 5.7% of the variability of the value construct, so if the services provided have quality concerning customer expectations, then the amount paid will tend to be considered fair. In the trust construct on the satisfaction construct, it is measured that if the residential electric energy consumers perceive the electric energy concessionaire or licensee tp be trustworthy and provide true information, he will be more satisfied. The influence measured between the quality construct on the satisfaction construct defines that if the services provided have a quality assessment in relation to customer expectations, there will be a tendency for the customer to be satisfied. There is also the influence of the value construct on the satisfaction construct, defining that the higher the amount paid in energy bills, the lower the customer satisfaction. The trust, quality, and value constructs can explain 74.4% of the variability of the satisfaction construct, and the trust and satisfaction constructs explained 21.8% of the variability of the loyalty construct.
For the CB-SEM, regarding quality, there was an influence of the trust construct, and the greater the trust, the greater the quality, since the trust construct was able to explain 48.8% of the quality variability. The value construct is influenced by the inverse of the quality construct, and the higher the quality perceived by the customer, the more he will feel that the amount paid is high. Quality explained 6.0% of the variability in the value. Regarding satisfaction, there was an influence on the trust construct; the greater the trust, the greater the satisfaction. There was also an influence of quality on satisfaction, so that the higher the quality, the greater the satisfaction. Finally, there was no significant difference of the value on satisfaction. The trust, quality, and value constructs together explained 77.7% of the variability in satisfaction, trust, and satisfaction, explaining 18.2% of the variability in loyalty.
For the choice of which model to apply, from the perspective of the coefficients of determination , the CB-SEM would have better quality in the model adjustments, because of its relations is higher when compared to of the PLS-SEM relations. This indicates that the independent constructs of CB-SEM better explain the dependent constructs. However, if the average variance extracted AVE is used, for example, PLS-SEM can be chosen as the model that produces better measurement quality. The results of PLS-SEM and CB-SEM in this study are closely related to small differences in the quality of the measurement model. Both approaches return, analyzing only the adjustment inputs and the same results. As a result, it is not possible to say that one method is better than another. However, to correctly apply PLS-SEM and CB-SEM, users must understand the purposes for which each approach was developed and applied to generate satisfactory results.
Consumers expect electricity distributors to improve and become increasingly suited to economic and financial realities, delivering quality in the electricity supply. The IASC honors, for the most part, the best-rated distributors, only based on the opinion of urban residential consumers. The analysis performed by the IASC needs to be improved to obtain the perceptions of all categories of consumers. The numbers measured in this work are essential to map and monitor the concessionaires. Still, the perception expressed by consumers is critical to the evaluation of electricity distribution services, contributing to the improvement of these services.
In this research, the ANEEL Consumer Satisfaction Index (IASC) was used to assess residential consumer satisfaction with services provided by electricity distributors, and a model derived from the American Customer Satisfaction Index (ACSI) satisfaction model. The measures used in structural equation modeling (SEM) were developed from a solid theoretical framework by analyzing the psychometric characteristics of the measurements. The PLS-SEM and CB-SEM methodologies tend to be complementary because the advantages of the non-parametric and variance-based approach can be the disadvantages of the parametric and covariance-based system, and vice versa. New research is being carried out to develop a global measure of adequacy for PLS-SEM. This model evaluation criterion is a fundamental requirement for testing and comparing alternative theories with their associated models. Furthermore, future research may contemplate different approaches for response-based clusterings, such as FIMIX-PLS, PLS genetic algorithm segmentation, and PLS response-based unit segmentation (REBUS-PLS).
In the analysis carried out for the PLS-SEM in
Table 12 and
Figure 4, it is observed that
= −0.238 of the
quality construct is over the
value construct. Similarly, using CB-SEM,
Table 13 and
Figure 5 show that the value construct was influenced by the
quality construct, raising
= −0.175. This is due to the characteristics of the electricity sector in Brazil. This service does not have another energy supply option, and does not yet have sufficient capacity to bargain with its suppliers. In most cases, the improvement in service quality does not correspond to a fuller perception of the value perceived by the user since there is a monopoly. Factors that directly affect rates, such as increases, reductions, discounts, and installments, should have a greater impact on perceived value than on changes in service quality. This fact also explains the common characteristics associated with the continued consumption of services. In these circumstances, the expectations generated have a normative character; that is, the service standards are the references for users to evaluate them. At the same time, they have a low capacity to negotiate with energy suppliers, which means that they cannot change their electricity costs, regardless of the quality provided. Therefore, the relative weights between
quality and
value result in low values.
There is a long-term tendency for distribution concessionaires to increase the number of customers, thus increasing their market and being forced to improve their management practices. However, there is an index defined by ANEEL that is used at the time of the tariff review, the X-Factor. X-Factor works as a reducer of the readjustment rates of the tariffs charged most of the time. Its function is to pass on to customers the estimated productivity gains of the concessionaire resulting from market growth. One of the components of X-Factor assesses the quality of technical and commercial services provided by each distributor to its customers. Therefore, if a concessionaire provides an inadequate service, the penalty will reduce the readjustment of the tariffs charged. In this way, this work serves as an overview for distributors to pay attention to service improvement opportunities, increase their earnings, and provide quality service.
5. Conclusions
This study presented, as its general objective, the application of structural equation modeling by partial least squares (PLS-SEM) and structural equation modeling based on covariance (CB-SEM) to assess the satisfaction of residential electricity consumers about the utilities and licensees that provide the services. For this, the specific objectives included conducting an exploratory and descriptive analysis of the data from the Consumer Satisfaction Index. The study’s objectives were achieved, as the comparative analyses of convergent validity, discriminant validity, and reliability of the constructs for the measurement models demonstrated that PLS-SEM and CB-SEM are complementary and not concurrent, so that a method cannot be considered superior to another.
The weights relative to the quality and value constructs resulted in low values. This is because users have little bargaining power with their energy suppliers. Regardless of the product quality they deliver, residential consumers cannot change their electricity costs. On the other hand, the application of PLS-SEM and CB-SEM results in higher values between the trust and quality constructs, which highlights the high impact of users’ trust in the quality of the service. Therefore, investments in improving distribution systems, service systems, access to the concessionaire/licensee, and the information to users lead to greater trust. Therefore, companies must seek to improve the quality of their services so that consumers remain secure about the offer of these activities.
This study used data from a consumer satisfaction survey questionnaire in all the Brazilian regions. In this way, this research brings the general panorama about the services rendered by the analyzed concessionaires/licensees, as the result of the structural equation models, the average of the countless companies evaluated. Thus, the results of this work can be used to monitor and analyze consumer satisfaction, observe the evolution of the quality of services provided, and assist in developing tools to support decision-making at concessionaires. Residential electricity users can also use this study to understand the aspects that need improvement when it comes to these service providers better, based on which, demand from the competent supervisory body fulfills the proper electricity distribution procedures.
Therefore, we concluded that a significant portion of the variability incident on customer satisfaction could be explained by the trust, quality, and value constructs, with 74.4% when applying PLS-SEM, and 77.7% when applying CB-SEM. This indicates that user satisfaction can be achieved if the electricity concessionaires/licensees demonstrate concern for the interests of the customer/user, including providing correct and accurate information when requested. Another factor that can lead to user satisfaction is the perceived quality, represented by (i) product quality that is related to constant voltage compliance and non-disturbed waveform, (ii) quality of service that is related to the continuity of its provision, and (iii) quality of customer service. Currently, there is a natural monopoly on the electricity distribution service. Although consumers are dissatisfied with the amount paid for their bills, they cannot turn to another company, and end up not exercising their right to choose.
This study proposes a model for evaluating consumer satisfaction for the electricity sector. There is the insertion of a structure that meets the services provided by electricity distributors. The results obtained show that the model has validity and internal consistency because the results obtained by PLS-SEM and CB-SEM are similar. The proposal presents a flexible model to measure the satisfaction of residential customers in the context of different concessionaires/licensees. The association model can be established for each distributor, indicating the diagnosis of problems and their possible solutions. Similarly, the model allows concessionaires/licensees to maintain the database on the evolution of these indicators measured using the proposed methodology, and evaluate the development of consumer satisfaction in the face of suggestions for improvement strategies.


 ,
, 


