Article

Decarbonizing Russia: Leapfrogging from Fossil Fuel to Hydrogen

Russian Presidential Academy, National Economy and Public Administration, 119571 Moscow, Russia
*
Author to whom correspondence should be addressed.
Energies 2022, 15(3), 683; https://doi.org/10.3390/en15030683
Submission received: 30 July 2021 / Revised: 11 January 2022 / Accepted: 13 January 2022 / Published: 18 January 2022
(This article belongs to the Special Issue 100% Renewable Energy Transition: Pathways and Implementation II)

Abstract

:
We examine a different approach to complete the decarbonization of the Russian economy in a world where climate policy increasingly requires the radical reduction of emissions wherever possible. We propose an energy system that can supply solar and wind-generated electricity to fulfill demand and which accounts for intermittency problems. This is instead of the common approach of planning for expensive carbon capture and storage, and a massive increase in energy efficiency and, therefore, a drastic reduction in energy use per unit of Gross Domestic Product (GDP). Coupled with this massive increase in alternative energy, we also propose using excess electricity to generate green hydrogen. Hydrogen technology can function as storage for future electricity needs or for potential fuel use. Importantly, green hydrogen can potentially be used as a replacement export for Russia’s current fossil fuel exports. The analysis was carried out using the highly detailed modeling framework, the High-Resolution Renewable Energy System for Russia (HIRES-RUS) representative energy system. The modeling showed that there are a number of feasible combinations of wind and solar power generation coupled with green hydrogen production to achieve 100% decarbonization of the Russian economy.

1. Introduction

The growth of the carbon-free global economy is a clear response to the challenges of climate change [1]. For Russia, it means a twin transition challenge: on the one hand, Russia should decarbonize its economy in accord with the rest of the world, on the other hand, Russia will face the imminent loss of its position as one of the leading exporters of fossil fuels and carbon-intensive products. Thus, Russia needs to decarbonize its economy and simultaneously find a new place in the rapidly changing global economy. This paper looks for a feasible, although not necessarily optimal, strategy that addresses the primary challenge of decarbonization. This paper also explores the replacement of fossil fuel exports with green energy development.
The net-zero target itself, along with the rapid development of green energy, is a relatively new subject for economic research in general and for Russia specifically. Not that long ago, the idea of 100% renewable energy in power generation seemed nearly impossible. Advances in alternative power generation, distribution, storage, and changes in consumption, have created a foundation for a new energy future. The feasibility debate in the energy economics literature has been settled in favor of renewable energy [2,3,4,5]. Peer-reviewed research published in the last few years makes a strong case, supported by robust quantitative analysis, for this reality [6]. This transition is not only feasible but also cost efficient. For example, refs. [4,5] demonstrate the technical possibility and economic feasibility of the global transition to 100% renewable energy systems.
It is widely agreed in the literature, net-zero transition may still be challenging for energy modeling [2]. However, as has been shown by recent publications on 100% renewable energy [2,4,5], the question is “when and how, but not if”. Country-specific research is needed to study the transition in greater detail, including issues of spatial resolution and the real-time balancing of supply and demand. According to [6], an increasing number of studies of the energy transition pathways in the EU, USA and Australia show its feasibility. At the same time, studies show such important fossil fuel consumers and CO2-emitters like China, Russia and India being left behind. Country-specific analysis provides essential detail that cannot be captured by the global analyses due to the complexity of the modeling transition pathways to 100% renewable energy. Lugovoy [7] explores the zero-carbon transition of China’s electric power generation and [8] summarizes results of an analogous study for India. Few studies have examined the feasibility of a zero-carbon transition for Russia. Analyses that focus on the deployment of renewable energy in rural and isolated remote areas are either incomplete or include only a very modest share of renewables [9,10]. In one case [5], Russia is represented as a part of a larger region. Although this analysis demonstrated the feasibility and viability of a net-zero transition for Russia, it lacked the necessary detailed analysis to justify the case. The value added of our paper is its focus on the twin challenges of decarbonization for Russia and for other carbon-dependent countries, including how to decarbonize the economy while simultaneously reclaiming a new role in the global division of labor to substitute a retreat from a position as one of the world’s leading exporters of fossil fuels.
Many approaches to decarbonizing the economy usually assume a significant reduction of energy consumption per unit of GDP and use of carbon capture and storage (CCS). The traditional approach to modeling a 100% renewable energy system combines interventions on the consumption side with a radical rebalancing of the primary energy mix. On the demand side, the emphasis is usually on energy efficiency and on the radical reduction in energy consumption per unit of GDP. Many studies also see the possibility of a 2050 with 100% energy supply from renewables [11,12,13], although with significant increases in energy efficiency.
This study is an attempt to explore the transition to a carbon-free future in a completely different direction. Here, we examine the possibility of a radical expansion in wind and solar energy leading to a significant increase in electricity production. The proposed radical increase is a response to the reliability challenges of alternative energies. In other words, we propose to build a power supply system that meets critical demand with very high probability but on average produces an over-supply of electricity. Here, extreme energy efficiency improvements are important to curtail critical demand but are not the main solution. This strategy is the answer to the second part of the twin decarbonization challenge. Producing green energy in excess, Russia may then build a new comparative advantage by diversifying the economy and having exports with low Scope One and Scope Two emission footprints. The difference with this approach is the increase in energy production and the production and use of hydrogen coupled with the building of a flexible demand. This is the proposed approach for Russia to solve the challenges of the carbon-free energy transition while at the same time creating a new niche for profitable exports.
We examine an accelerated convergence to alternative energy primarily based on wind and solar, which would lead to the creation of a completely different profile of the entire Russian economy. Our goal is to demonstrate the feasibility of such a strategy to respond to these two challenges, rather than conduct a comprehensive optimization analysis of the transformation of the Russian economy. We used relatively high-cost estimates because if any proposed strategy is feasible under these cost assumptions it will most likely be feasible if actual costs are lower than expected. This is not the case in the other direction. Russia is a country with an exceptionally harsh climate, where developing renewable energies could prove to be more costly in comparison to other countries. Lower cost estimates that are less reliable could undermine the feasibility of a proposed strategy.
We also focus on hydrogen production, not because it is definitively the best option for the use of excess electricity, but because it is a plausible option. However, as a technologically advanced country, Russia can consider several other options to use this excess electricity to diversify its economy. Nonetheless, Russia could build a strong position in the world market as a significant exporter of green energy goods. One of these goods could be hydrogen. According to the literature, “green hydrogen will be an essential part of the future 100% sustainable energy and industry system” [14].
An analysis of the transformation of the entire Russian economy based on readily available and inexpensive electricity is beyond the scope of this study. However, because the Russian economy’s total electrification may take from 30 to 40 years, it is reasonable to assume there will be sufficient time for any approach to rebalance its capital stock in industry, transportation and the service sector. However, if reductions in emissions are carried out in too quickly, and mainly due to international pressures, then the losses from investments in the fossil fuel energy sector, along with the loss of income from the export of fossil fuels, the effect of GHG reductions would be extremely negative.
In all cases, the reduction in emissions will have real benefits for Russia. The reduction in air pollution associated with GHG emissions, would lead to a significant reduction in annual mortality, which is consistent with other analyses [12]. It is also an opportunity to build a more stable economy, with greater energy productivity and less dependence on oil prices. It would enable participation in global climate policy and avoid any potential problems from border tax adjustments.
The following section describes in detail the overall modeling framework, the assumptions and data sources. Then the results show feasible alternatives for decarbonization and detailed changes to the energy sector. Finally, the significance of the results and the possibilities and necessity of changes in a decarbonizing global economy are shown in the discussion and conclusions.

2. Materials and Methods

2.1. Description of Modeling Framework

The modeling framework was designed to build a 2050 energy balance with net-zero carbon and then build the transition dynamics that show that solar and wind power can provide all primary energy consumption, and that some of this can be converted into green hydrogen. To develop these decarbonization and hydrogen production scenarios, we used a partial equilibrium optimization framework, the High Resolution Renewable Energy System for Russia (HIRES-RUS). The framework consists of two models: a high-frequency (hourly) power generation model (RUHOUR) and a representative energy model (RUTIMES), which covers the entire energy sector in Russia. The first model is necessary to analyze the possibility of constructing a power generation system that ensures a stable meeting of demand using intermittent alternative energy sources. The second (RUTIMES [15,16,17]) is used for the construction of the transient dynamics up to 2050. RUTIMES includes renewables and fossil fuels, the heating and electricity generation sector, refineries, cement, iron and steel production, buildings, freight and passenger transport, pipeline distribution networks, and other industries, including non-energy use consumption.
Temporal resolution in the energy model (RUHOUR) includes the balancing of hourly supply and demand. The model contains 8760-time steps (365 days for 24 h), and 7 regions (Central, Northwest, Ural, Siberian, Far East, South and Volga regions). Meteorological calibrations were from detailed data in hourly increments (MERRA-2 collections tavg1_2d_flx_Nx (Surface Flux Diagnostics), tavg1_2d_rad_Nx (Radiation Diagnostics) and tavg1_2d_slv_Nx (Single-level atmospheric state variables) downloaded from NASA Goddard Earth Sciences (GES) Data and Information Services Center (DISC) (https://disc.gsfc.nasa.gov/datasets?project=MERRA-2 (accessed on 28 June 2021)) using GNU Wget network utility (https://disc.gsfc.nasa.gov/data-access (accessed on 28 June 2021) (also see [18]). Parameters of the power generation technologies were calibrated using Lazard’s Levelized Cost of Energy Analysis (Lazard) and Storage technology (EA-ETSAP and IRENA© Technology Policy Brief E18—April 2012). Key technology assumptions in the model are shown in Table 1.
For the low-cost scenario, Solar PV, CAPEX and OPEX battery systems were estimated from [19] and assume that the cost of PV will fall by 62% and battery costs will fall by 74.2%. We assume that the cost of wind will decrease by at least 31%, as for the last 10 years [20], as well as the estimates of fuel cell costs [21].
The hourly balancing issue is a very challenging problem for large-scale energy capacity planning models [22] as each year includes 24 × 365 hourly time steps. To avoid this excess computational complexity, we solve the hourly model just for the year 2050. This will be the year when the hourly balancing is the most challenging due to the highest share of renewable energy in the energy mix.
RUTIMES covers the entire Russian energy system but lacks hourly granularity. RUTIMES has a structure that includes all energy sectors in Russia, and also includes buildings (residential and commercial), transport (freight and passenger), electricity and heat generation, refineries, iron and steel production, cement and other important industrial processes. The RUTIMES was calibrated with historical data from 2012 to 2018 (Sources including an official ROSSTAT, 4-TER, 11-TER, 6-TP, 22-housing and communal services, 23-N, 1-TEP, Russia in numbers, Russian Statistical Yearbook, Federal State Statistics Service Demographic Yearbook of Russia, Housing in Russia, Rosatom. Annual Report 2015, Annual Report of the RUSHYDRO Group, for 2017–2019, The Russian National Statistical Agency for 2016–2019, Annual Report of Public Joint Stock Company “LUKOIL Oil Company”, The annual report of PJSC “NK Rosneft”, the Annual report of PJSC “Gazprom”. Ministry of Energy of the Russian Federation https://minenergo.gov.ru/ (accessed on 5 July 2021), Long-term Program for the Development of the Russian Coal Industry for the period up to 2030 (Ministry of Energy of the Russian Federation), STATE REPORT ON THE STATE AND USE OF MINERAL RESOURCES OF THE RUSSIAN FEDERATION (Ministry of Energy of the Russian Federation), NOVATEK, NOVATEK. ANNUAL REPORT, ANNUAL REPORT OF OJSC Surgutneftigaz, PJSC Transneft” http://www.transneft.ru/ (accessed on 5 July 2021).”JSC Transneft”, The strategic development Program of JSC “Transneft” for the period up to 2020, “On the STATE AND USE of MINERAL RESOURCES OF THE RUSSIAN FEDERATION IN 2014,” 2014, THE MINISTRY OF ENERGY, “ The main indicators of the oil industry in 2016.” https://minenergo.gov.ru/node/910 (accessed on 5 July 2021)), (BP, “Statistical Review of World Energy,” BP Stat. Rev. World Energy, MINISTRY OF NATURAL RESOURCES AND ECOLOGY OF THE RUSSIAN FEDERATION ORDER No. 477 of 1 November 2013, ON APPROVAL OF THE CLASSIFICATION OF RESERVES AND RESOURCES OF OIL AND COMBUSTIBLE GASES. 2013. ETSAP (Energy Technology Systems Analysis Programme https://iea-etsap.org/index.php/energy-technology-data (accessed on 8 July 2021))). The model computes a transition scenario that rebalances energy production and consumption capacities from the current state of the Russian energy system from 2018 to 2050 with an energy mix computed by the hourly model. The major economic and development assumptions are shown in Table 2. RUHOUR computes a feasible solution for 2050 assuming net-zero emissions from electricity production and a given level of hydrogen supply to meet domestic demand in 2050 and provide a hydrogen supply of 12 EJ (or 100 MtH2). This amount of hydrogen would maintain an equivalent export value of Russia’s current energy exports. 2050 is the year with the highest share of renewable energy and the most inflexible electricity demand. Thus, solving the hourly model for the year 2050 guarantees a feasible hourly solution for any earlier time during the modeling period.
The HIRES-RUS model is based on energyRt [23], an open-source model generator implemented in R (R: The R Project for Statistical Computing. R. https://www.r-project.org/ (accessed on 10 October 2021)) and including algebraic programming software languages (GAMS, Python/Pyomo, Julia/JuMP, and GLPK/MathProg)). The model contains classes of information including supply, technologies, commodities, demand, etc. Additionally, it includes methods that are used to build models of a representative energy system expressed as a linear programming problem to meet exogenous final demand with minimal costs, taking into account available and possible technological options, resources and other constraints. The energyRt package has been compared with other modeling software and based on the basic energy model it provides identical results with harmonization of the parameters [24]. Additional information about the modeling system, including some of the equations are shown in Appendix A.

2.2. Future Electricity Demand

Our assumptions about future electricity demand were designed to be on the very high side to challenge our proposition that alternative energy could be produced in the abundance required to minimize needs for energy efficiency and to be able to demonstrate that the transition is feasible. We also assume no growth in either hydropower or nuclear power.
There are three types of demand in the modeling system: critical demand for electricity, which must be met at all times; flexible demand for electricity, which can be satisfied at any time; the demand for hydrogen production for either export or domestic use, which is also flexible in time. The hourly profile of critical demand in 2050 resembles the electricity consumption profile in 2019 reported by the Russian Power System Operator (https://www.so-ups.ru/ (accessed on 9 October 2021)) but scaled up according to the increase in total demand. In this study, we only modeled hydrogen produced by electrolysis. We used IRENA [25] to calibrate the technological parameters for hydrogen production. We did not explicitly model the storage and transportation of hydrogen.
In the modeling system, energy demand in 2050 is driven by government development strategies and programs, as well as reasonable assumptions about the increase in energy consumption by different sectors of the Russian economy. Our intention was to construct a very challenging hourly profile of electricity demand that could still be fully met only using alternative energy production. After shrinking in 2020, 2021 GDP growth in Russia was forecasted to be 4.4% and then 3.1% for 2022 [26]. However, for this study we assumed an extremely high annual GDP growth of 3.5%, even if highly unlikely over the long-term. Although unlikely for the long-term, this assumption was designed as a challenge to be met by growth in clean energy technologies. Other assumptions were that living space will increase from the current 26 m2/person to 45 m2/person, an area that corresponds to a level found in more developed countries. Additional challenging assumptions included a doubling of automobile and freight transport demand, an increase in steel production from 71 to 128 MT (including an additional 9 MT of steel demand to satisfy wind capacity demand) and major growth in other industrial sectors.
Actual costs of alternative technologies have a degree of uncertainty. To ensure robust results, we consider two exploratory mega scenarios: scenario set A is based on current costs (figures from this scenario are marked as “a”) and scenario set B based on more optimistic assumptions regarding the learning rate (figures from this scenario are marked as “b”). Each scenario set, A and B, include 72 alternatives. For scenario B, we introduced additional constraints on the deployment of solar energy. Although there is evidence for the feasibility of PV deployment north of Helsinki [14], we restricted all locations higher than 60-degree latitude (latitude of Helsinki). The rationale was due to maintenance concerns in areas with a very low density population and power infrastructure.

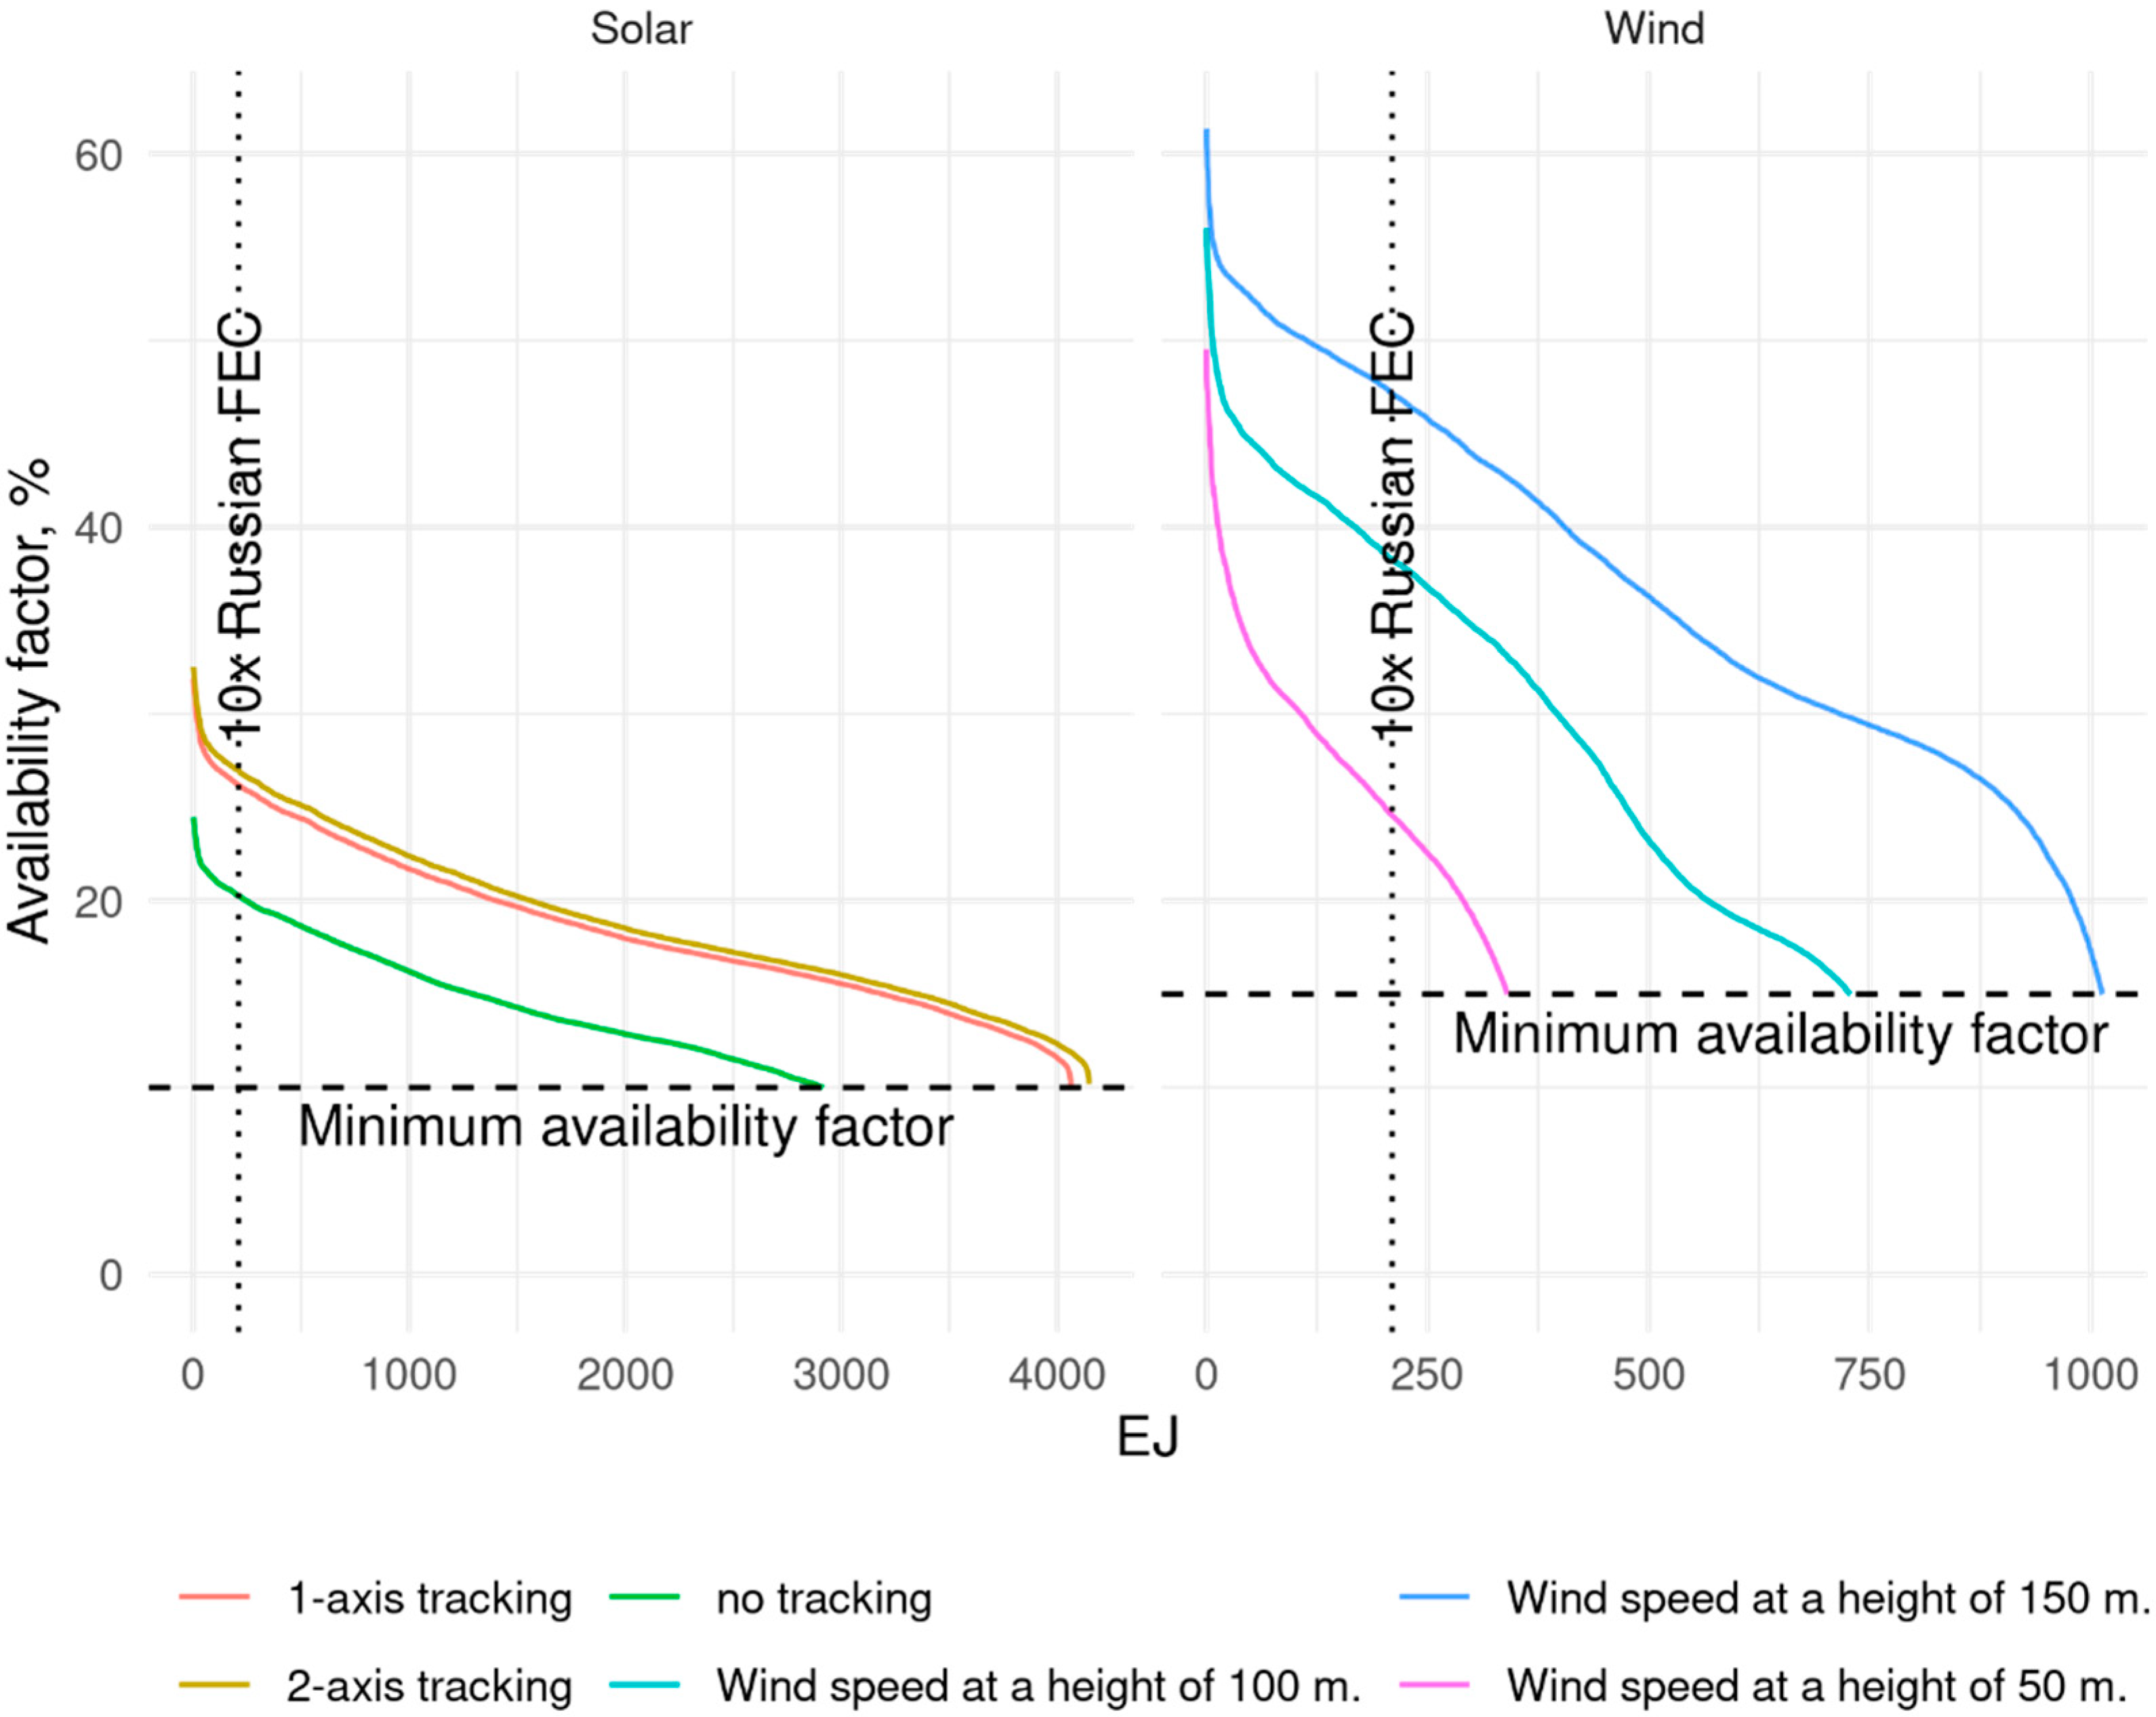
2.3. Solar and Wind Availability

All locations for generating electricity were divided into 250 possible clusters for solar and for wind generation (for a total of 500 locations of the intermittent renewable energy sources). Places where average annual availability factors were less than 10% for solar and 15% for wind were not included in the clusters or in subsequent calculations. We additionally assumed that only 10% of the area of each of the spatial clusters were available for solar PV in contrast to 80% for wind turbines.
Preliminary experiments with the model demonstrated that total electricity production should increase by a factor of approximately 10.5 to replace all other sources of energy. The preliminary modeling showed that on average there will be a large net energy surplus and that this surplus will be converted to hydrogen. Then, the following critical parameters, shown in Table 3, were used to create a set of 72 specific alternatives for the analysis of potential feasibility and effectiveness for 100% decarbonization. This included two levels of electricity demand, three potential heights of wind turbines, three potential solar tracking technologies, unlimited versus limited storage and two assumptions about trade connectivity across the Russian domestic grid. The model solved an optimization for each of the 72 alternatives. A search for a unique optimal solution is beyond the scope of this paper. Instead, we examined each of the 72 alternatives for feasibility and effectiveness. The goal was simply to identify potentially feasible energy mixes for 2050.

2.4. Energy Storage

The intermittency of energy sources may be one of the main barriers to large-scale deployment of solar and wind energy. The solution to the problem of intermittency is possible with the help of a well-developed electricity transmission network and the use of energy conservation and storage technologies. There are several types of energy conservation, each with its own advantages and disadvantages. The use of Li-ion batteries and accumulators is among the most promising for large-scale networks, which can solve the problem of insufficient energy supply during the day. Despite the fundamental differences between storage technologies, including large-scale hydro-pumped storage, from the point of view of modeling, they are quite similar. The modeling used Li-Ion as the more expensive equivalent of conservation technology. If in certain regions conditions allow for the creation of large-scale hydro-pumped storage, then the costs of 100% decarbonization will become cheaper. The use of a solar panel tracking system, with an equal area, can increase the electricity generation of solar panels and increase the time for generating electricity. Large-scale storage systems may require an increase in the extraction of rare metals with a shortage of metal, for example, lithium. However, markets usually find solutions for complex problems. A sodium-ion battery could be a cheaper solution that uses widely available materials.
The modeling does not address the timing of hydrogen production, nor any potential limitations in the hydrogen storage and transportation system. We assume that hydrogen can be converted to other products such as ammonia, synthetic gases or fuels, and can be stored for long time periods and transported long distances.
Other potential approaches to energy storage will grow with the electrification of transport. Even with many existing grids in various countries, electric cars can send excess power in their batteries back to the grid when not in use. Thus, electricity storage potential will grow along with electrification and other technology innovations in this field.

3. Results

This analysis is organized into the following three sections. The first section introduces the feasibility of the transition to a carbon-free future, including a set of alternatives. The second section shows the geography of the future of the 100% decarbonization of the Russian energy sector through renewable energy. The third section analyzes the transitional dynamics to a new equilibrium based on a 100% decarbonized energy system.

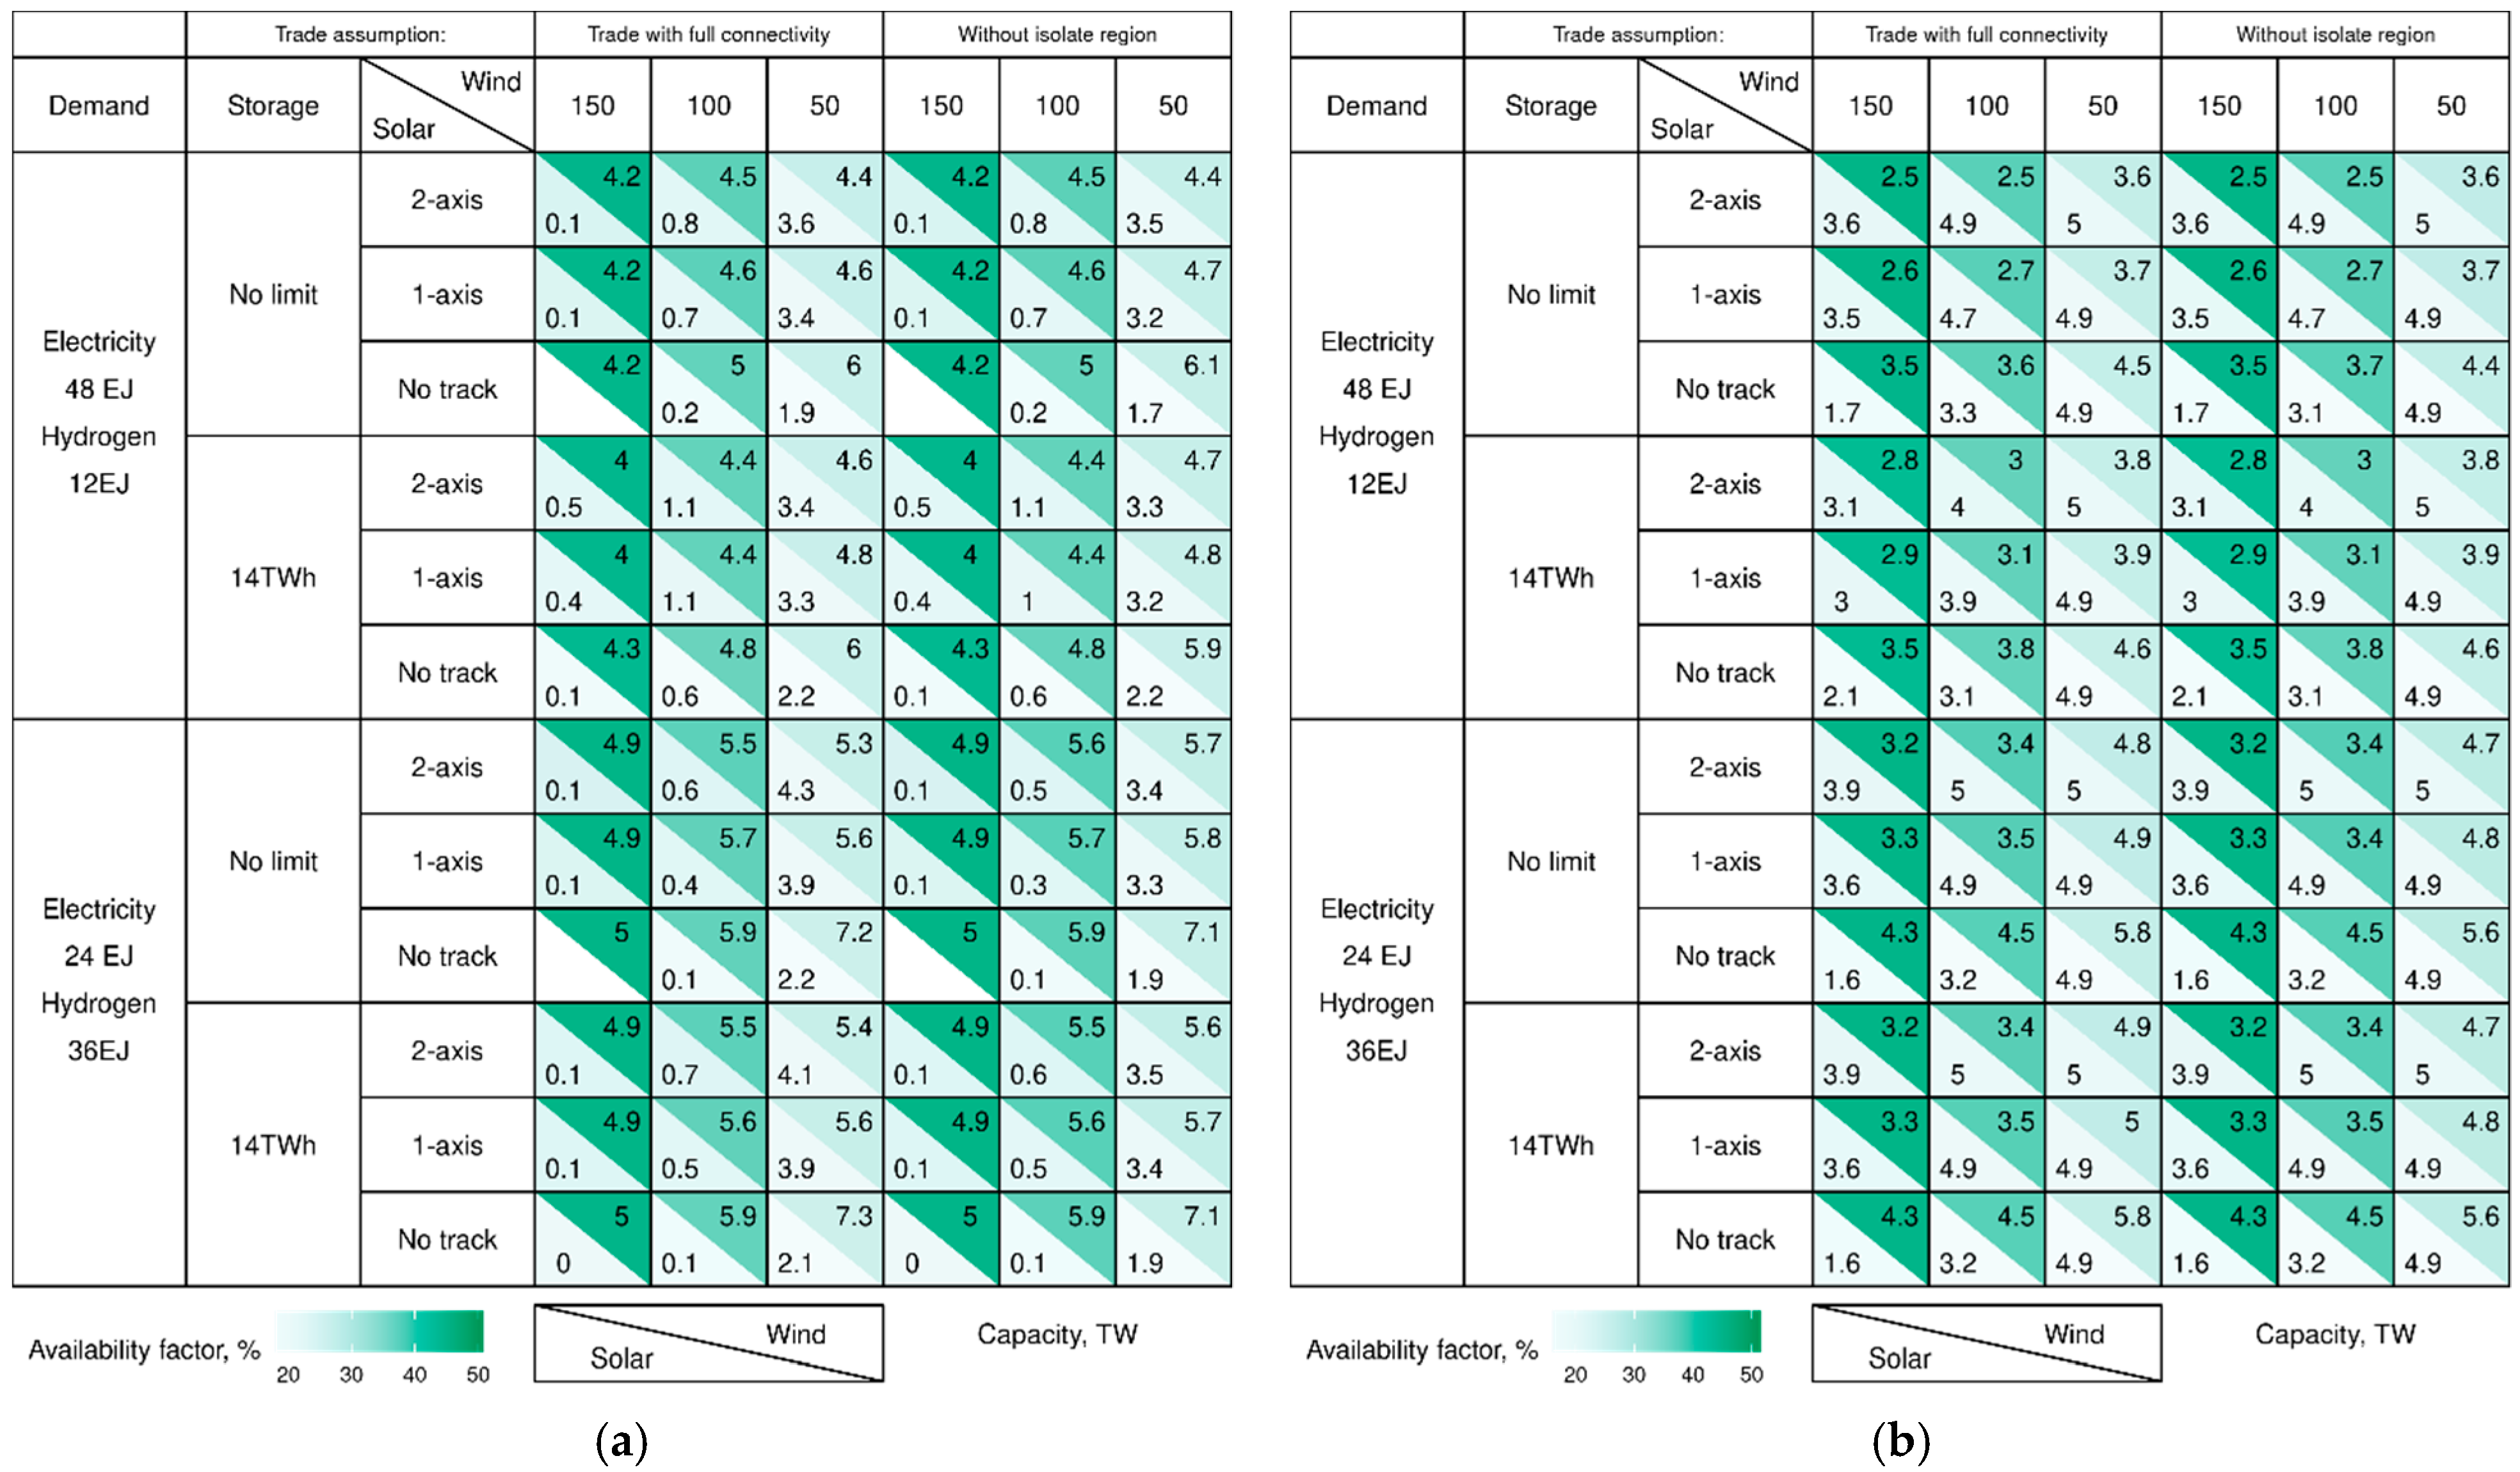
3.1. Feasibility Analysis

Figure 1 shows the supply curve of solar and wind power compared to 10 times the final energy consumption of all energy in Russia. It follows that the supply is sufficient to meet the demand with a significant availability factor (percentage of the time that it is available to provide energy to the grid) and, consequently, at a low price. However, the intermittency of solar and wind power, and the possible remoteness of sources from the point of consumption, can significantly increase costs.
This figure shows that wind or solar can produce enough electricity. Additionally, it is clear that a solar tracking system is required for efficient PV, and that wind turbines need to be higher than 50 m.
Figure 2a shows the detailed results of the feasibility analysis based on Table 1 and the 72 specific alternatives. Demand is in the left column and storage is the second column. The third column shows the three solar tracking alternatives and wind turbine height is shown in the second row. As the HIRES-RUS allows for trade and distribution within the entire country, trade is allowed with full connectivity and nearly full connectivity but with the exclusion of the hard-to-reach, very isolated regions of Siberia and the Far East.
Each rectangle is one alternative; the upper right triangle is the percent availability factor for wind and the lower left triangle is the availability factor for solar. Height (meters) only applies to wind. Tracking applies only to solar. Blank values (white) mean that the use of solar is not cost efficient. This means that if wind is sufficiently productive, there is no need for solar.
Solar without any tracking is very ineffective. However, there is no significant difference between 1- or 2-axis tracking. Thus, to keep costs lower, a 1-axis tracking system would be more efficient. Similarly, wind turbines built only to 50 m would be relatively ineffective; although, in most cases, 150 m turbines are better than 100 m turbines. In theory all 72 alternatives are feasible; however, there are clearly 24 more realistic and desirable alternatives. These alternatives are those with a wind turbine height of 100 m or 150 m and storage requirements that are constrained to 14 TWh. This reduces the reliance on solar, which in some cases is very inefficient (blank lower left part cells) and solar also requires significantly more land area. In Figure 2b, solar PV is more effective and no tracking solar is the most efficient, a very different result from above.

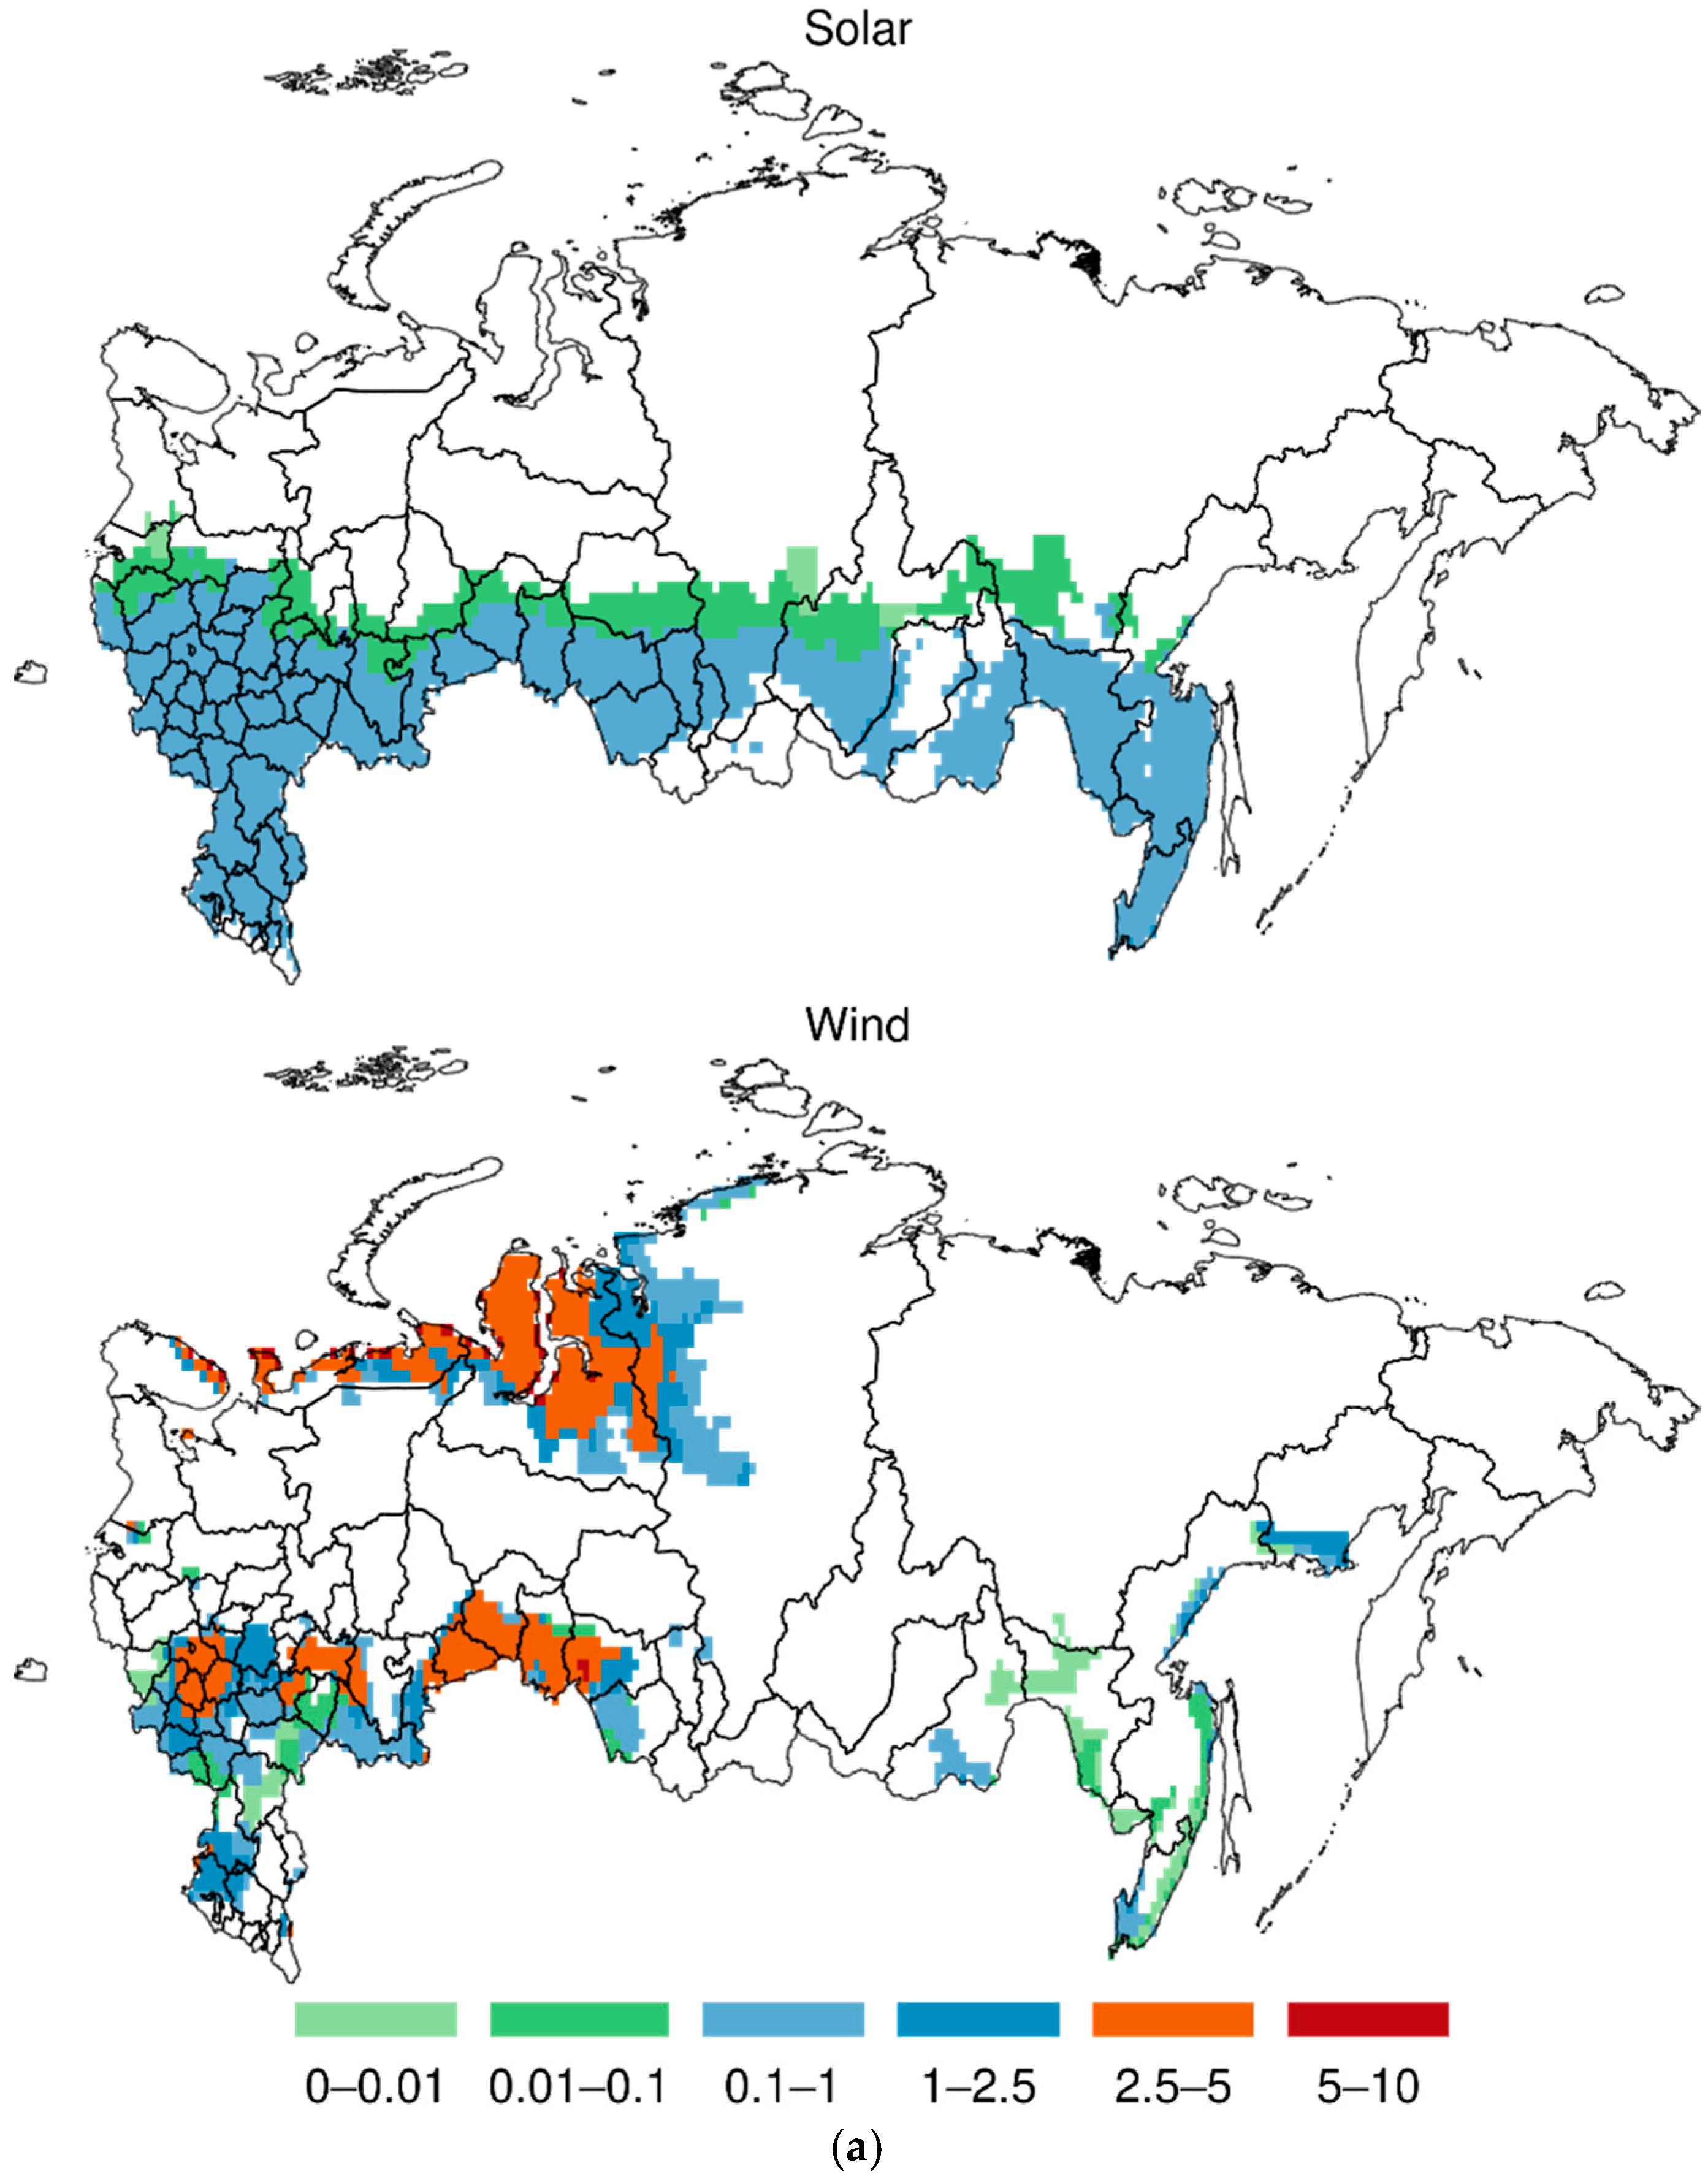
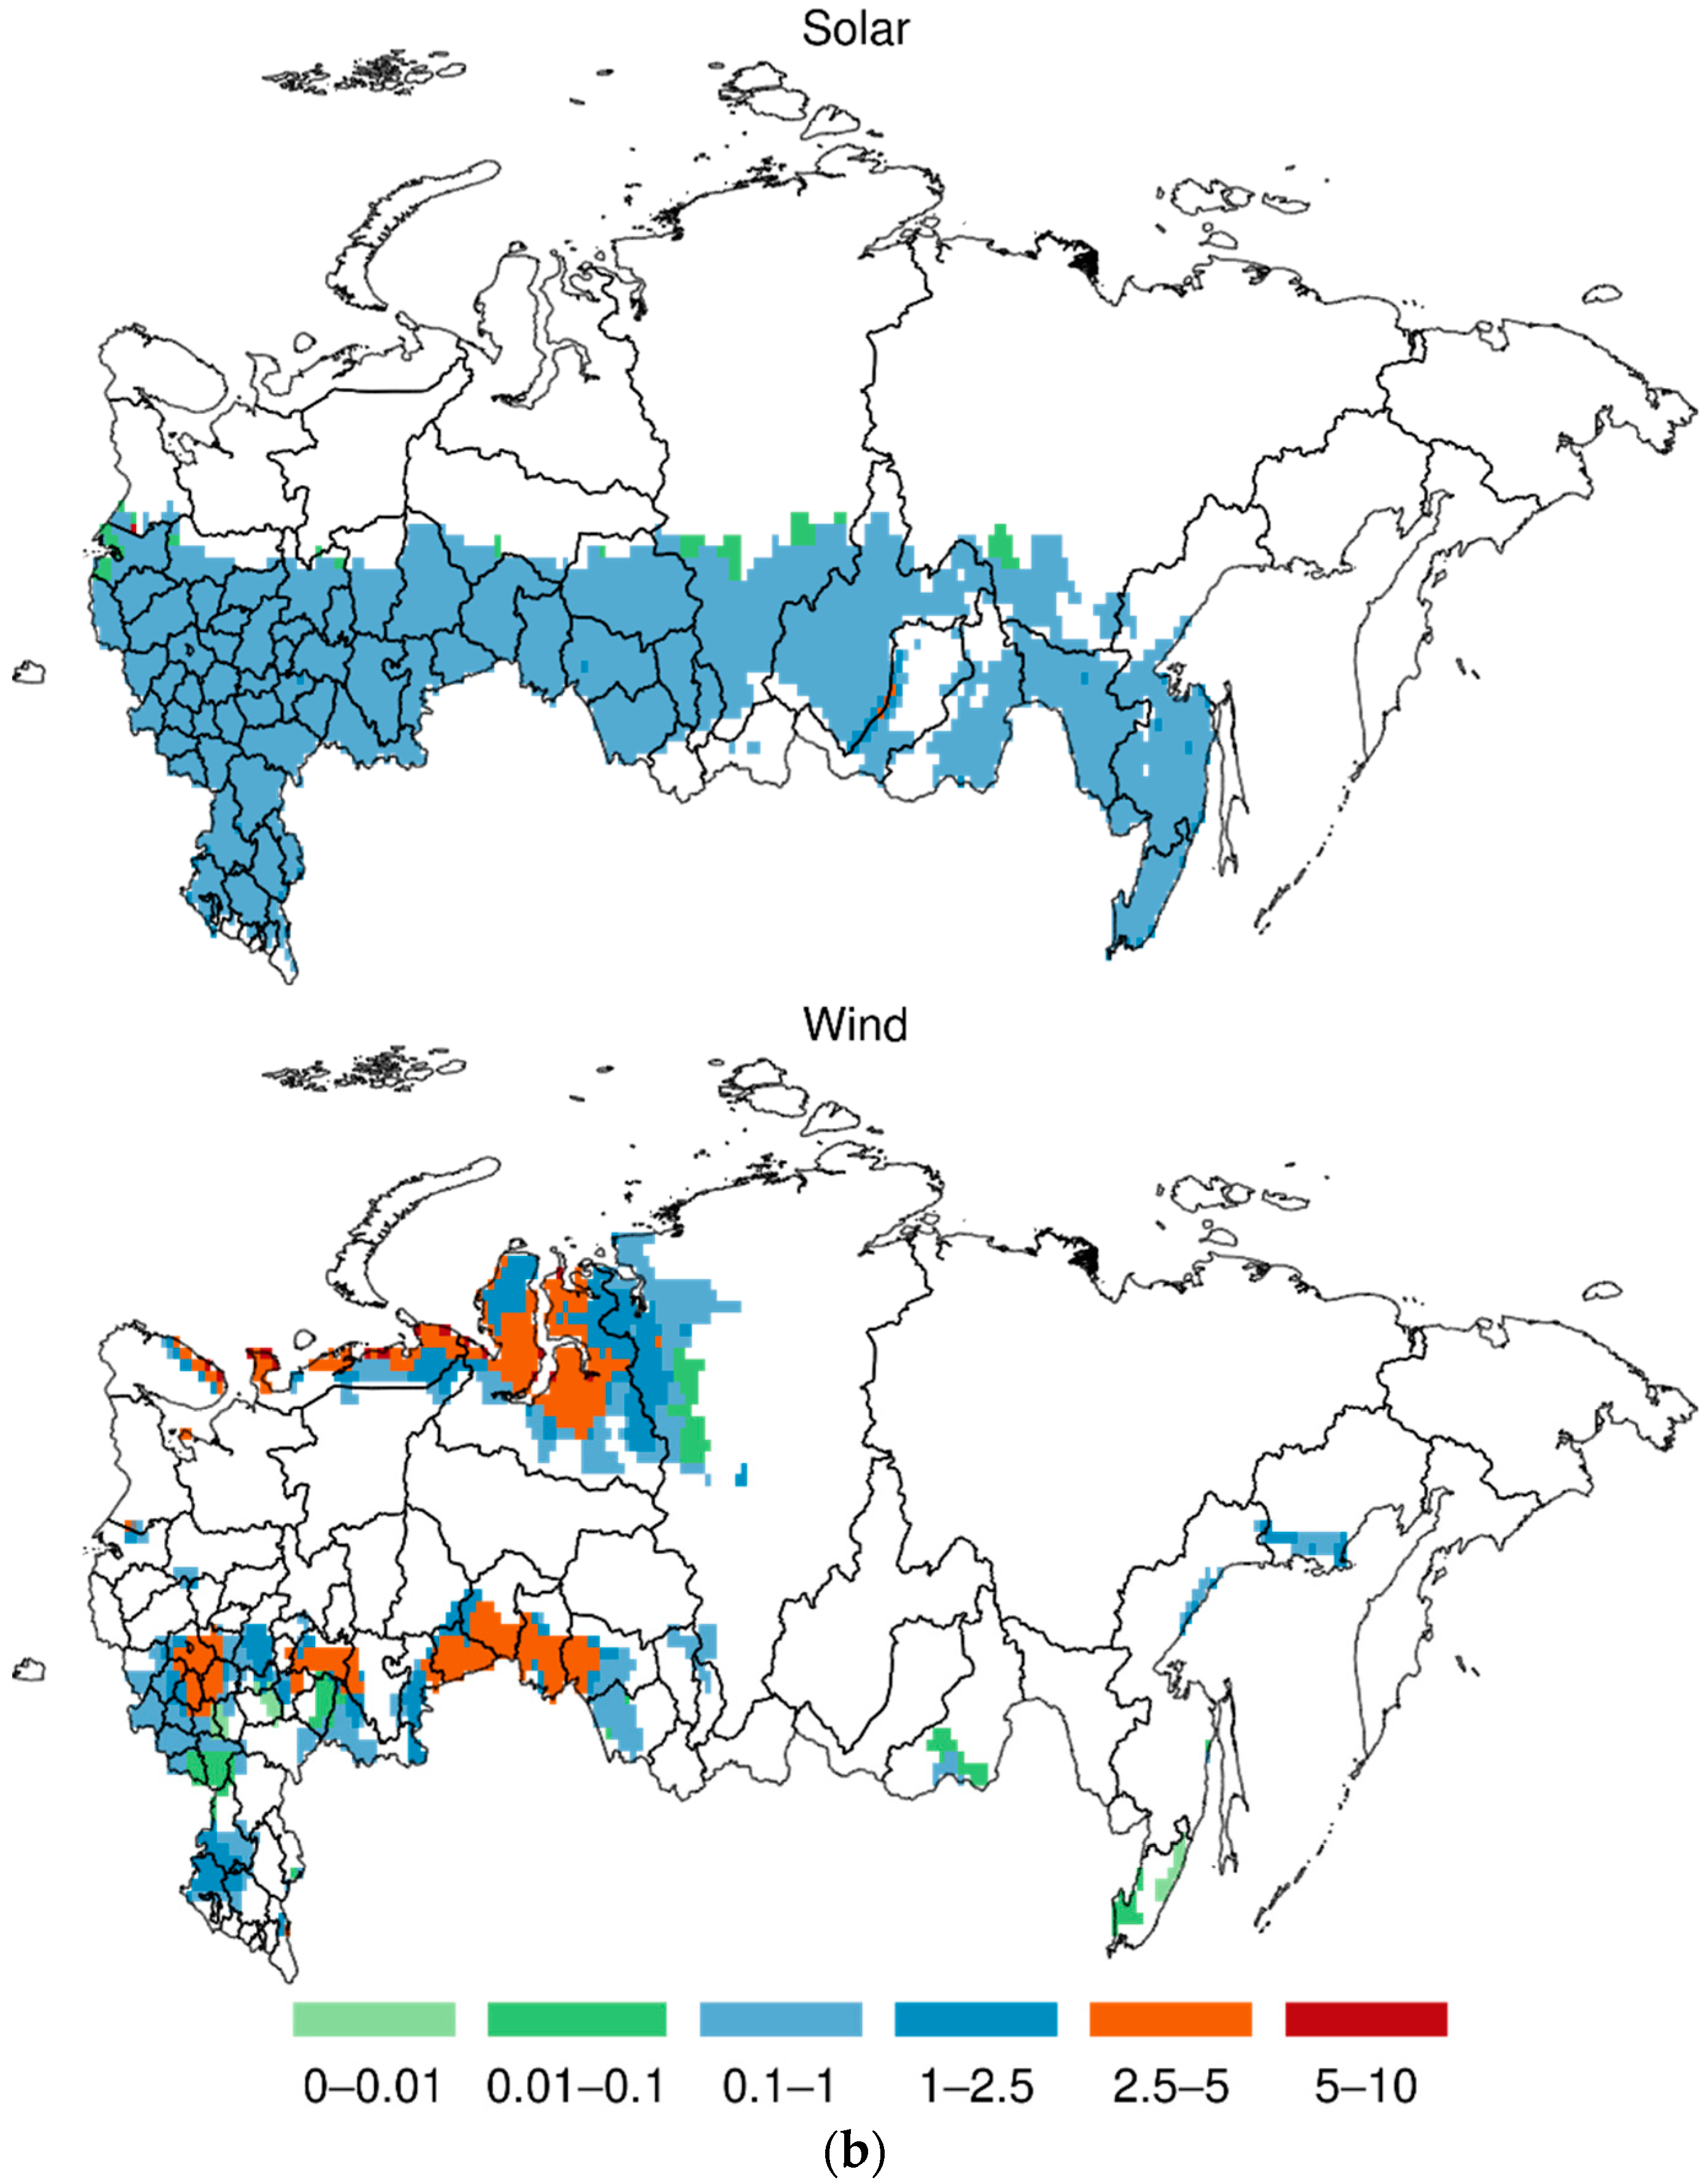
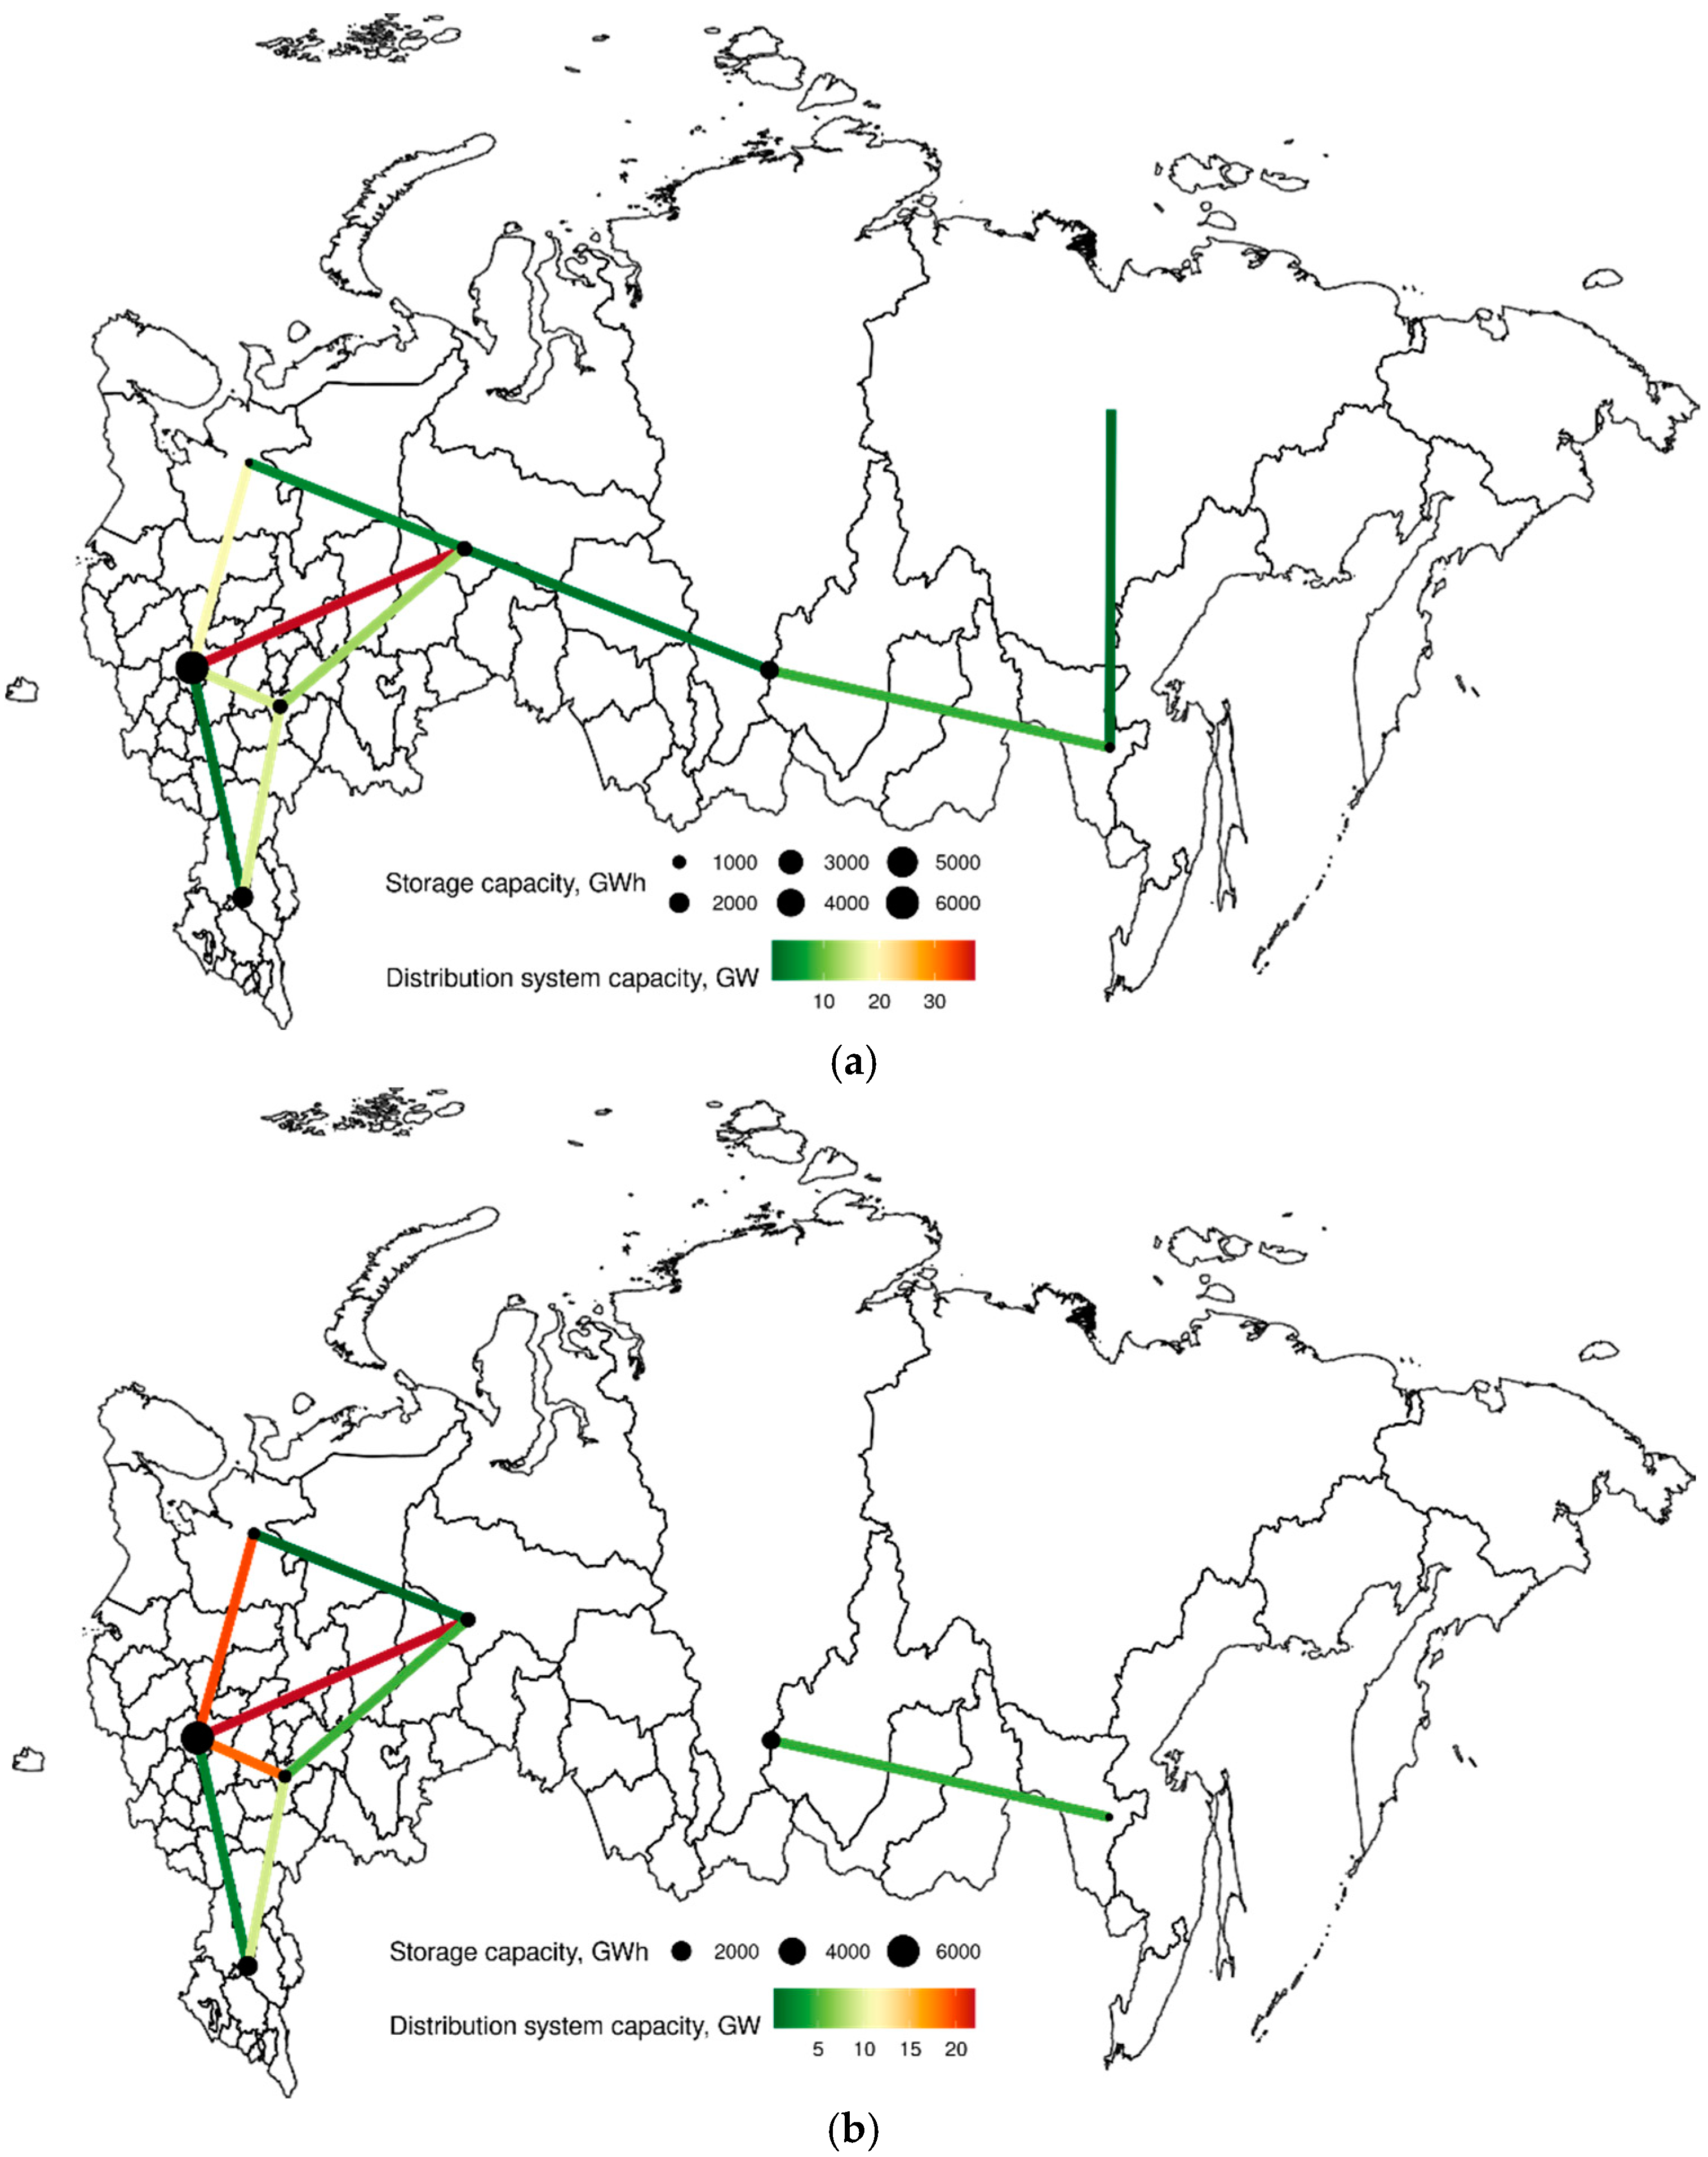
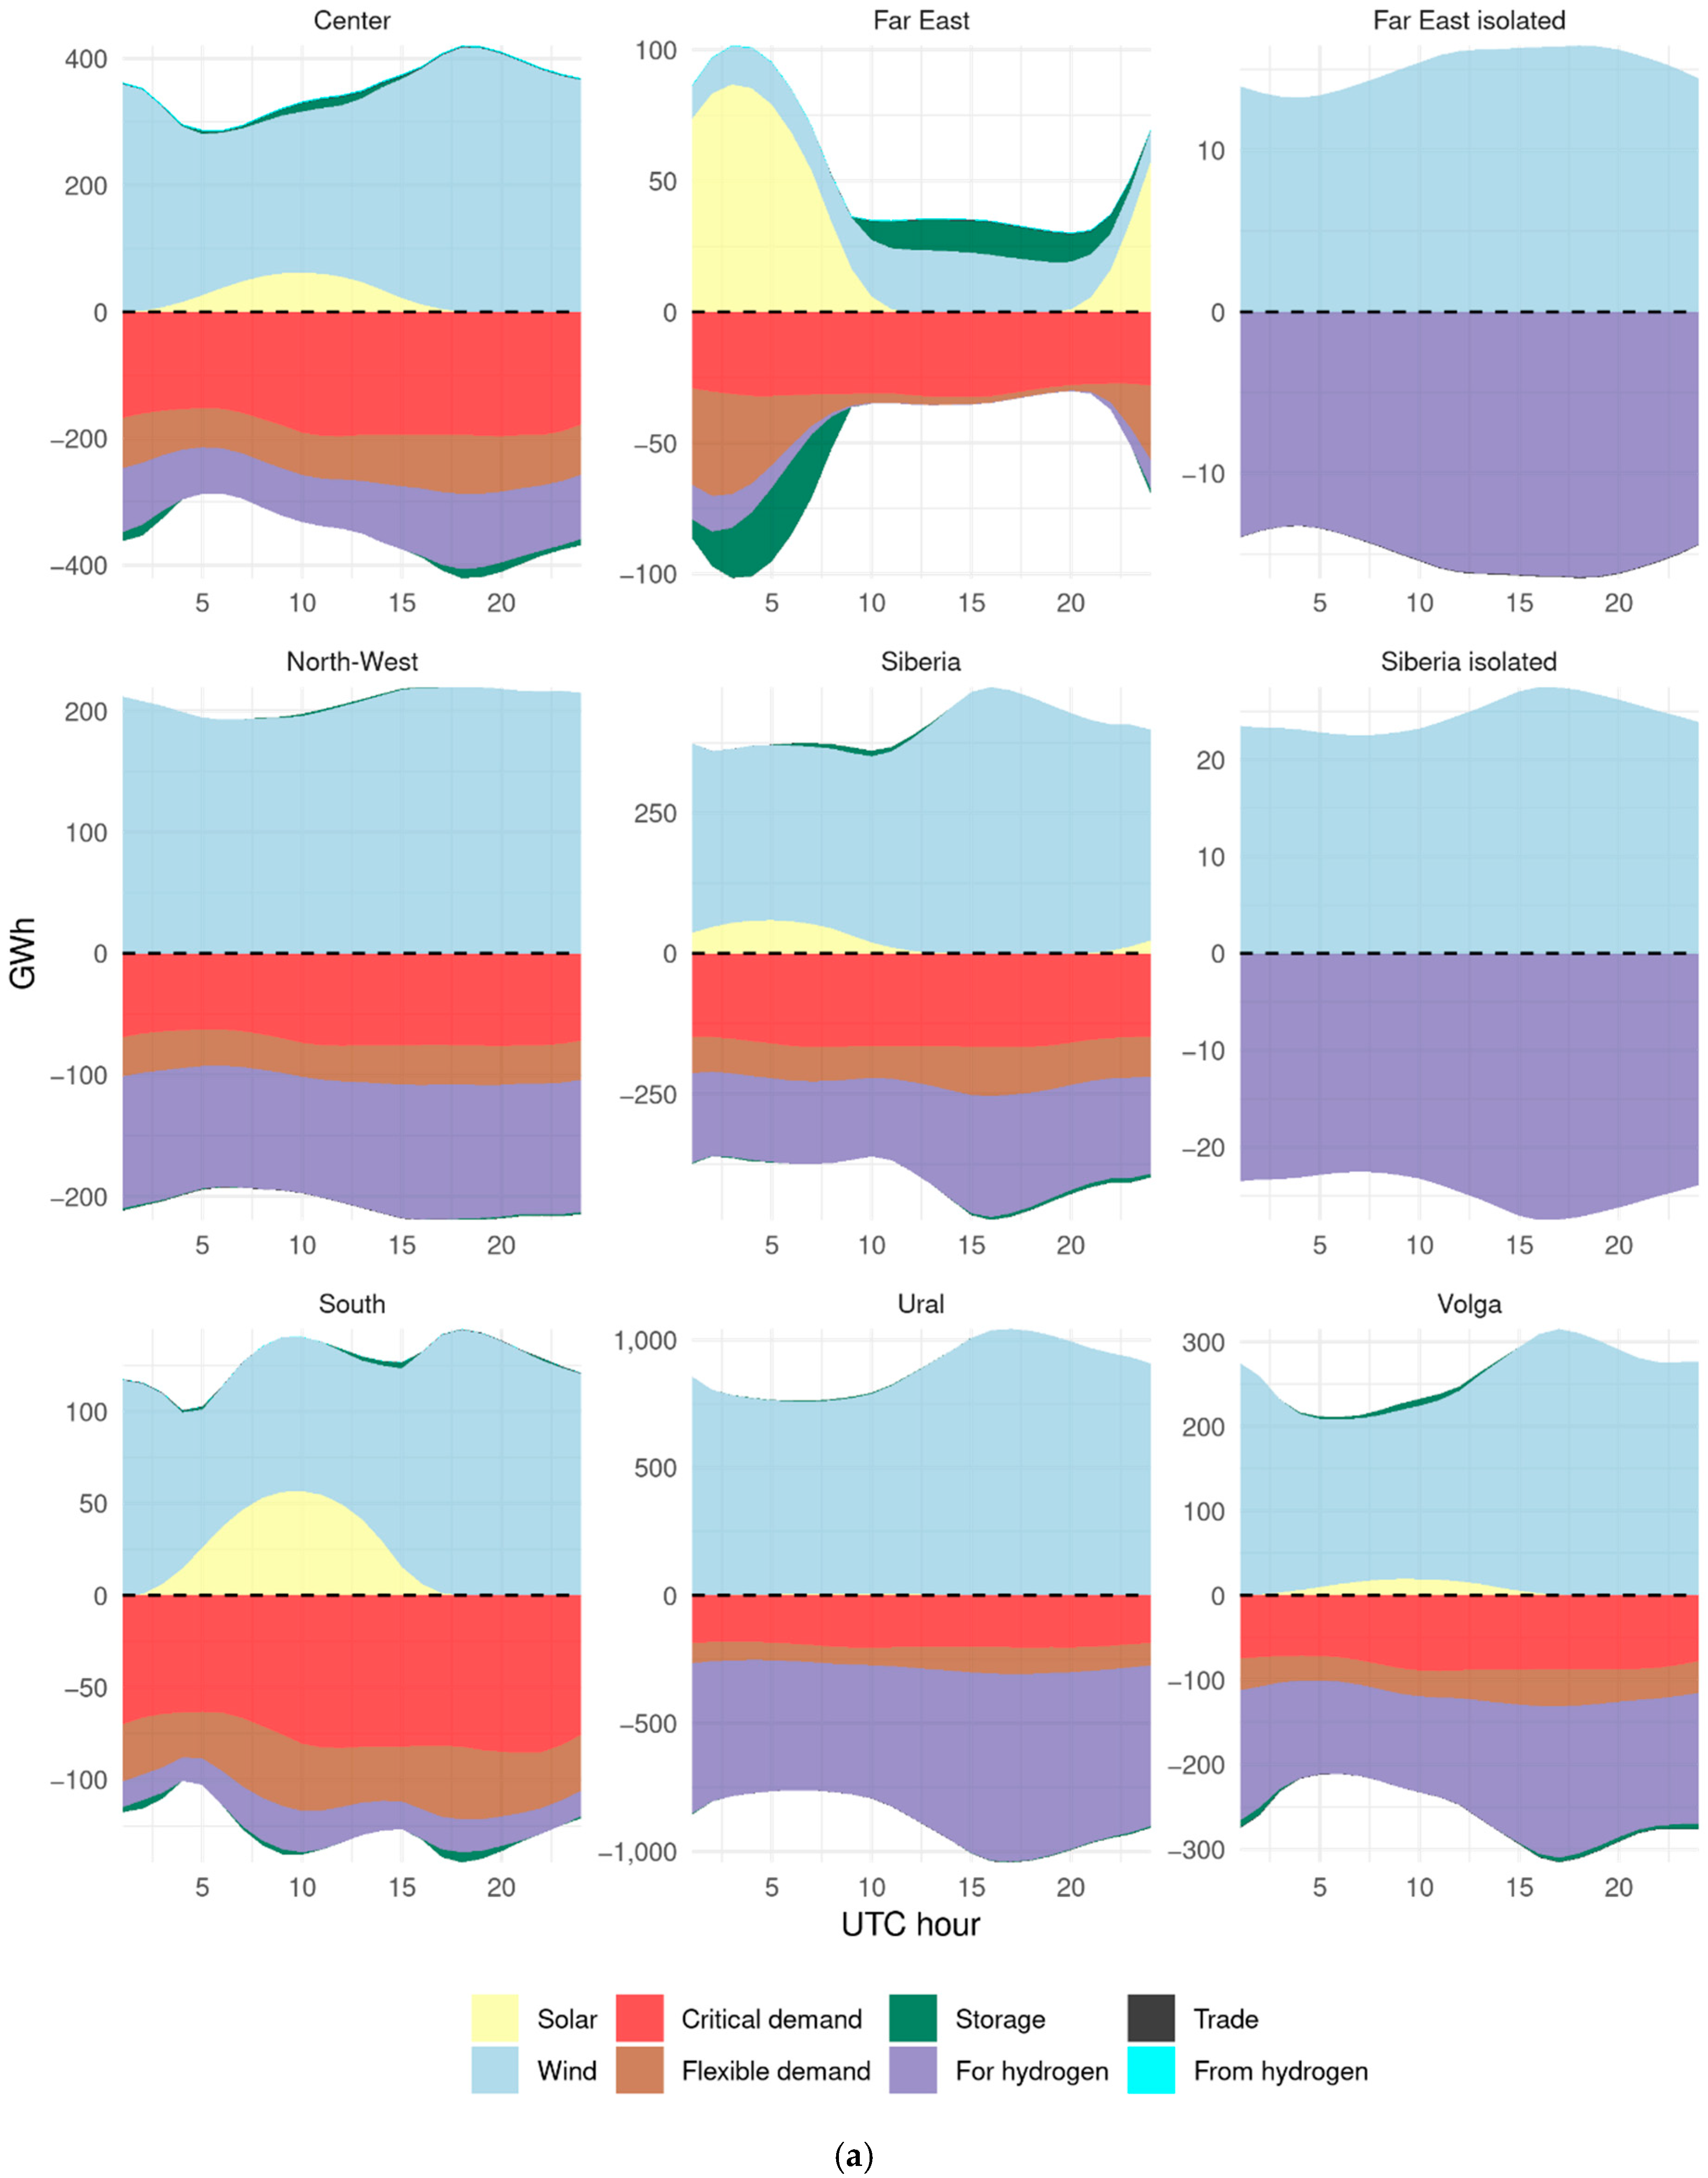
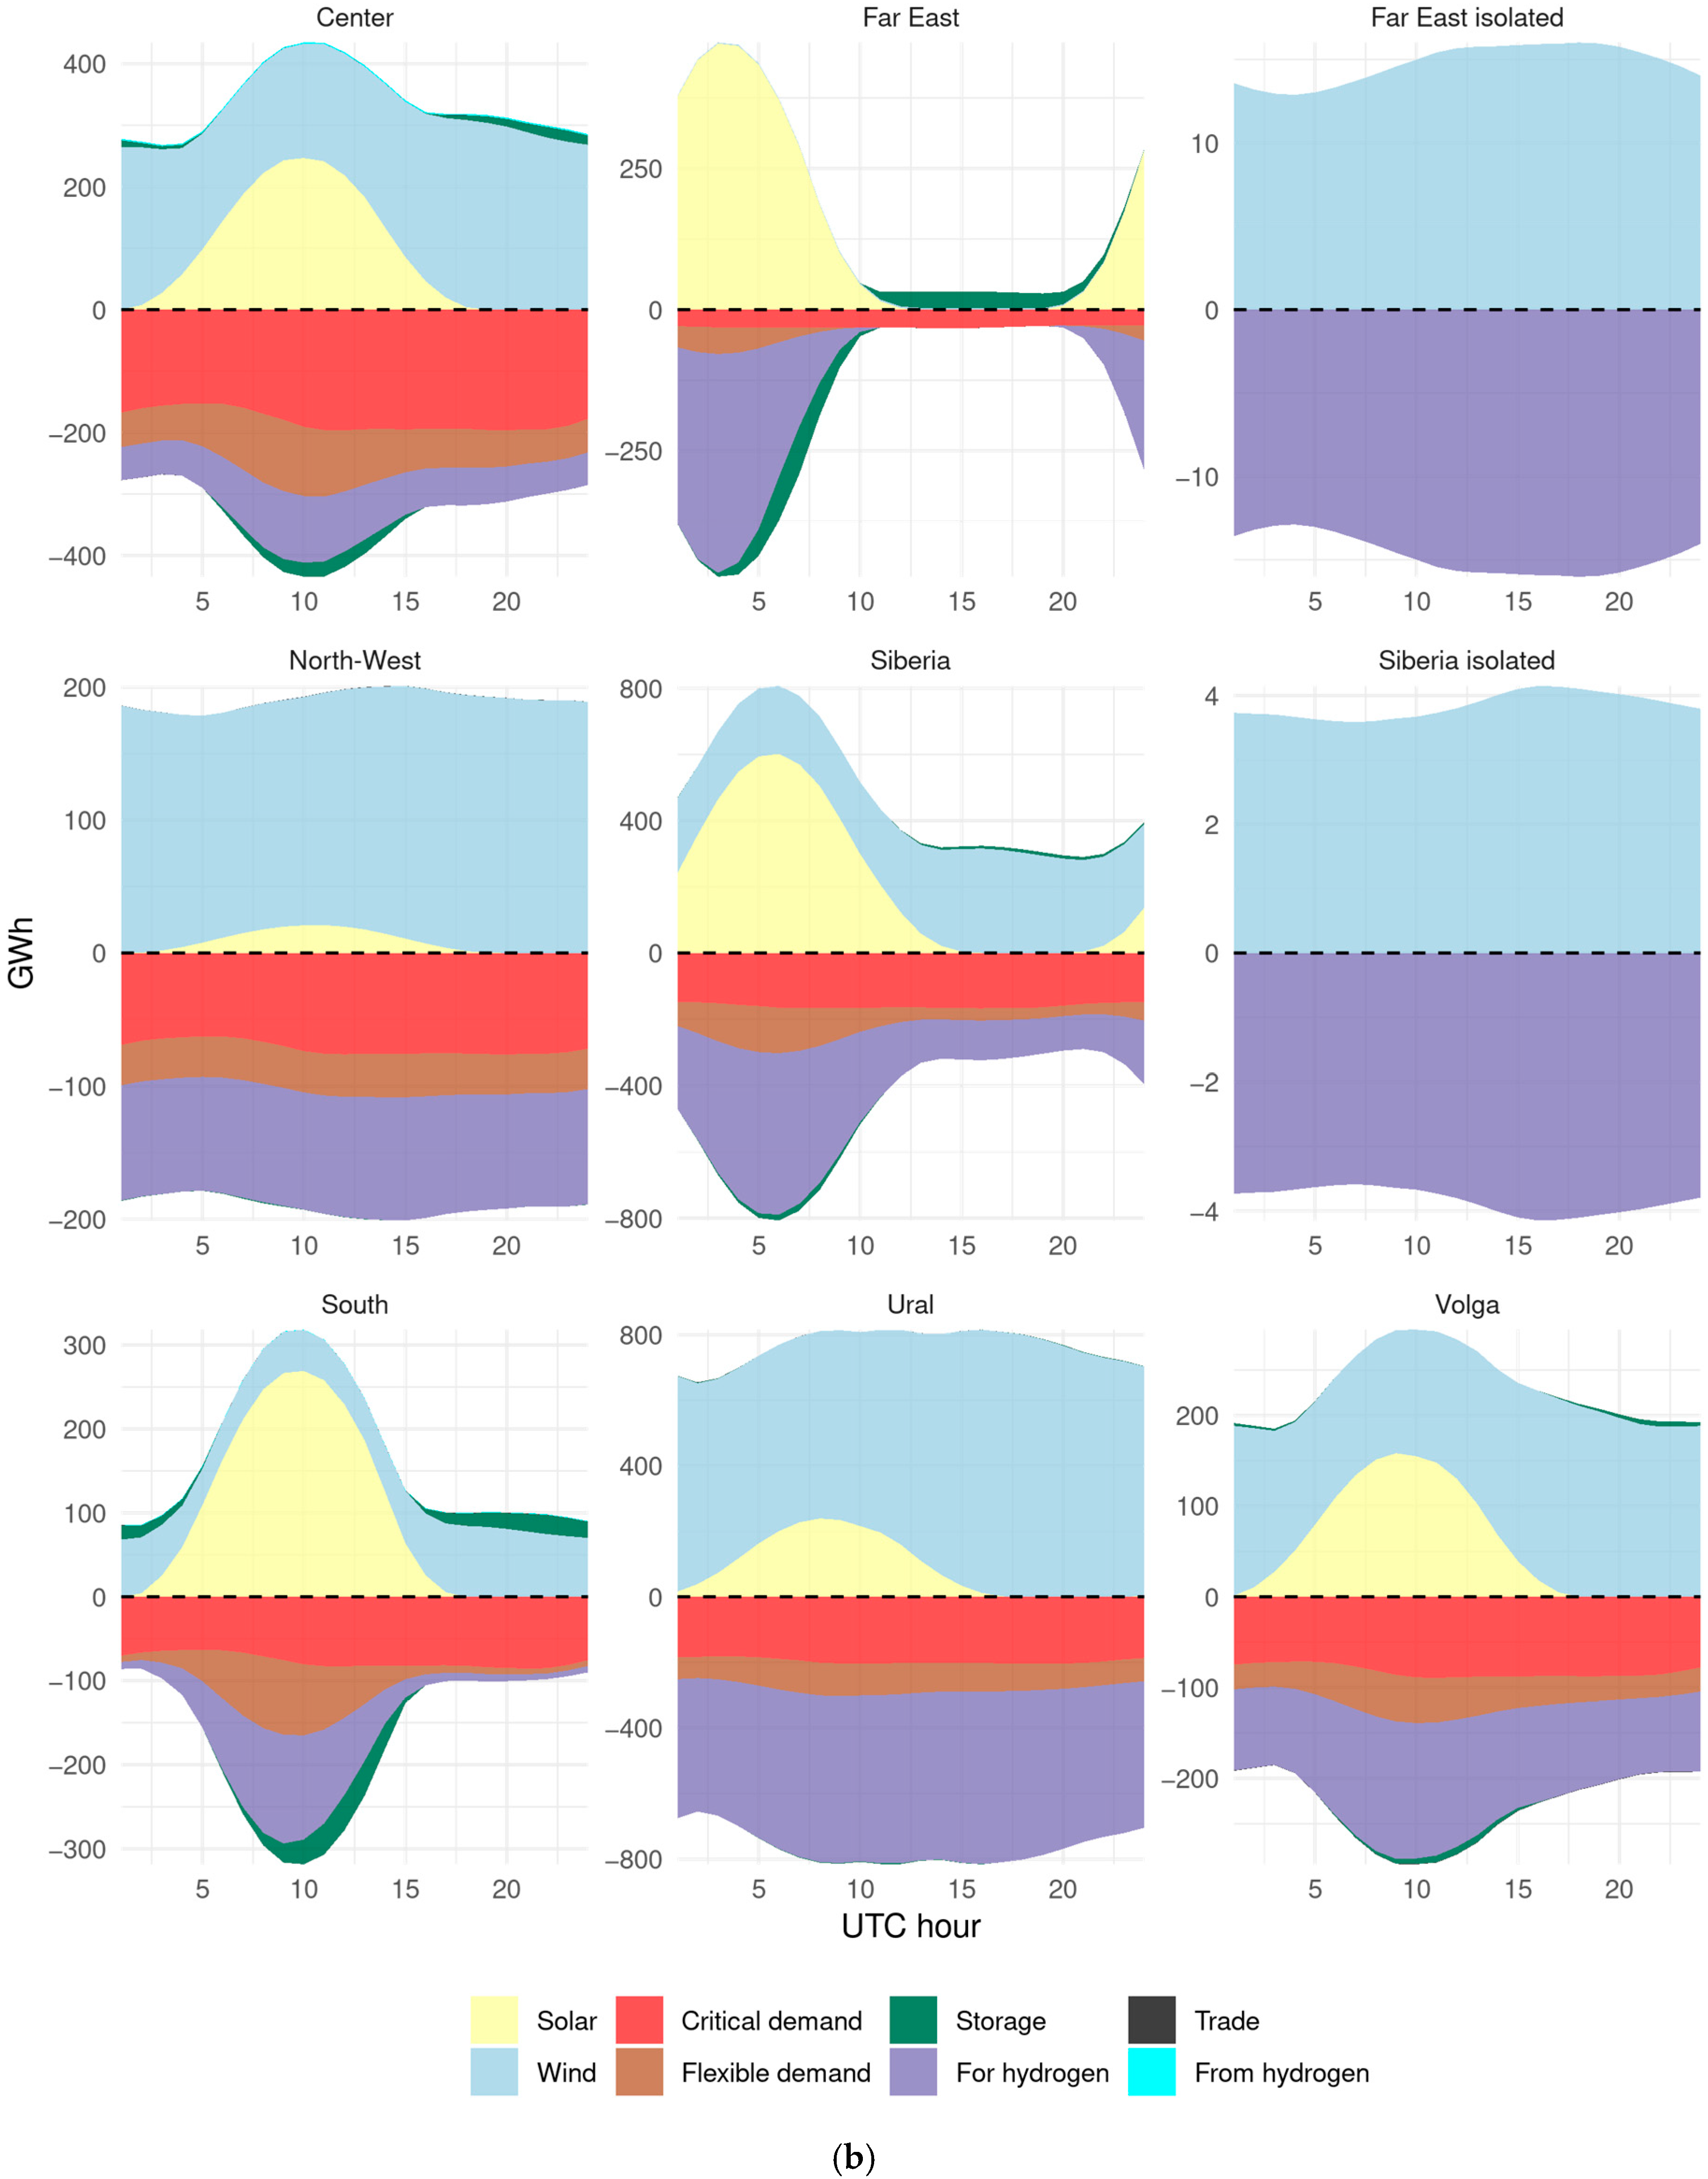
3.2. Geographic Distribution of Power Generation, Distribution System and Storage

Figure 3a shows the locations for the highest capacity for renewable energy power, mainly in the southern regions of the country. It is important to note the very high potential wind capacity in the northwestern regions, although clearly that region does not have a significant capacity for solar. In Figure 3a,b, potential PV in terms of installed capacities per total area of a region are shown. Technically, however, PV capacities in southern regions could reach up to 80 MW per km2 (with an average 40 MW per km2 across the country [27]. Taking into account competition with other land uses, actual installed capacities are likely to be much lower than the technical potential.
Therefore, Figure 3b, even with its lower solar PV costs, shows only wind is viable in the far northwest of Russia. By relaxing constraints on more northern latitudes (>60 degrees) for solar PV we can get even more PV production in more northern regions than in the case depicted in Figure 3b. However, if we also relax the upper-bound constraint on PV density (no more than 1% of land in a region could be allocated to PV), solar production will still gravitate to the southern regions. The cost per installed capacities in the south is approximately twice as low than in the north [14].
Wind energy turns out to be more suitable for northern regions than PV. The transition to alternative energy is expected to take approximately 30 years. The next 10 years is a critical learning period and geographic-specific research into solar and wind production in Russia is needed. If Russia is to significantly expand domestic power consumption, diversifying the economy through the expansion of green energy intensive sectors, solar energy could be a comparative advantage. New sectors with robotics, 3-D printing, additive manufacturing, battery storage, web hosting centers, crypto-currencies, etc. are likely to be above 60 degrees latitude since most of the population lives south of this latitude.
If much or most of the excess power is converted to hydrogen, then wind energy in the Russian north has a comparative advantage. This is an area with large land availability and water, which is important for hydrogen production. Under the lower cost scenario, PV is potentially more abundant across southern Russia and closer to population centers, but still does not work in the far northern regions.
In any case, we ran sensitivity scenarios, all of which demonstrated the feasibility of 100% decarbonization of the Russian economy. An actual composition of energy mix and profile of energy consumption will be revealed over time, based on learning feedback.
Figure 4a shows the general capacity for both storage and distribution capacity. Storage is shown by the size of the black circles. Distribution capacity is illustrated by the color of the lines and is far higher in the populous regions in the east of Russia. There is both more alternative power generation and storage capacity in the most southwestern parts of the country. The changes in the lower cost scenario are shown in Figure 4b but not that dramatically.

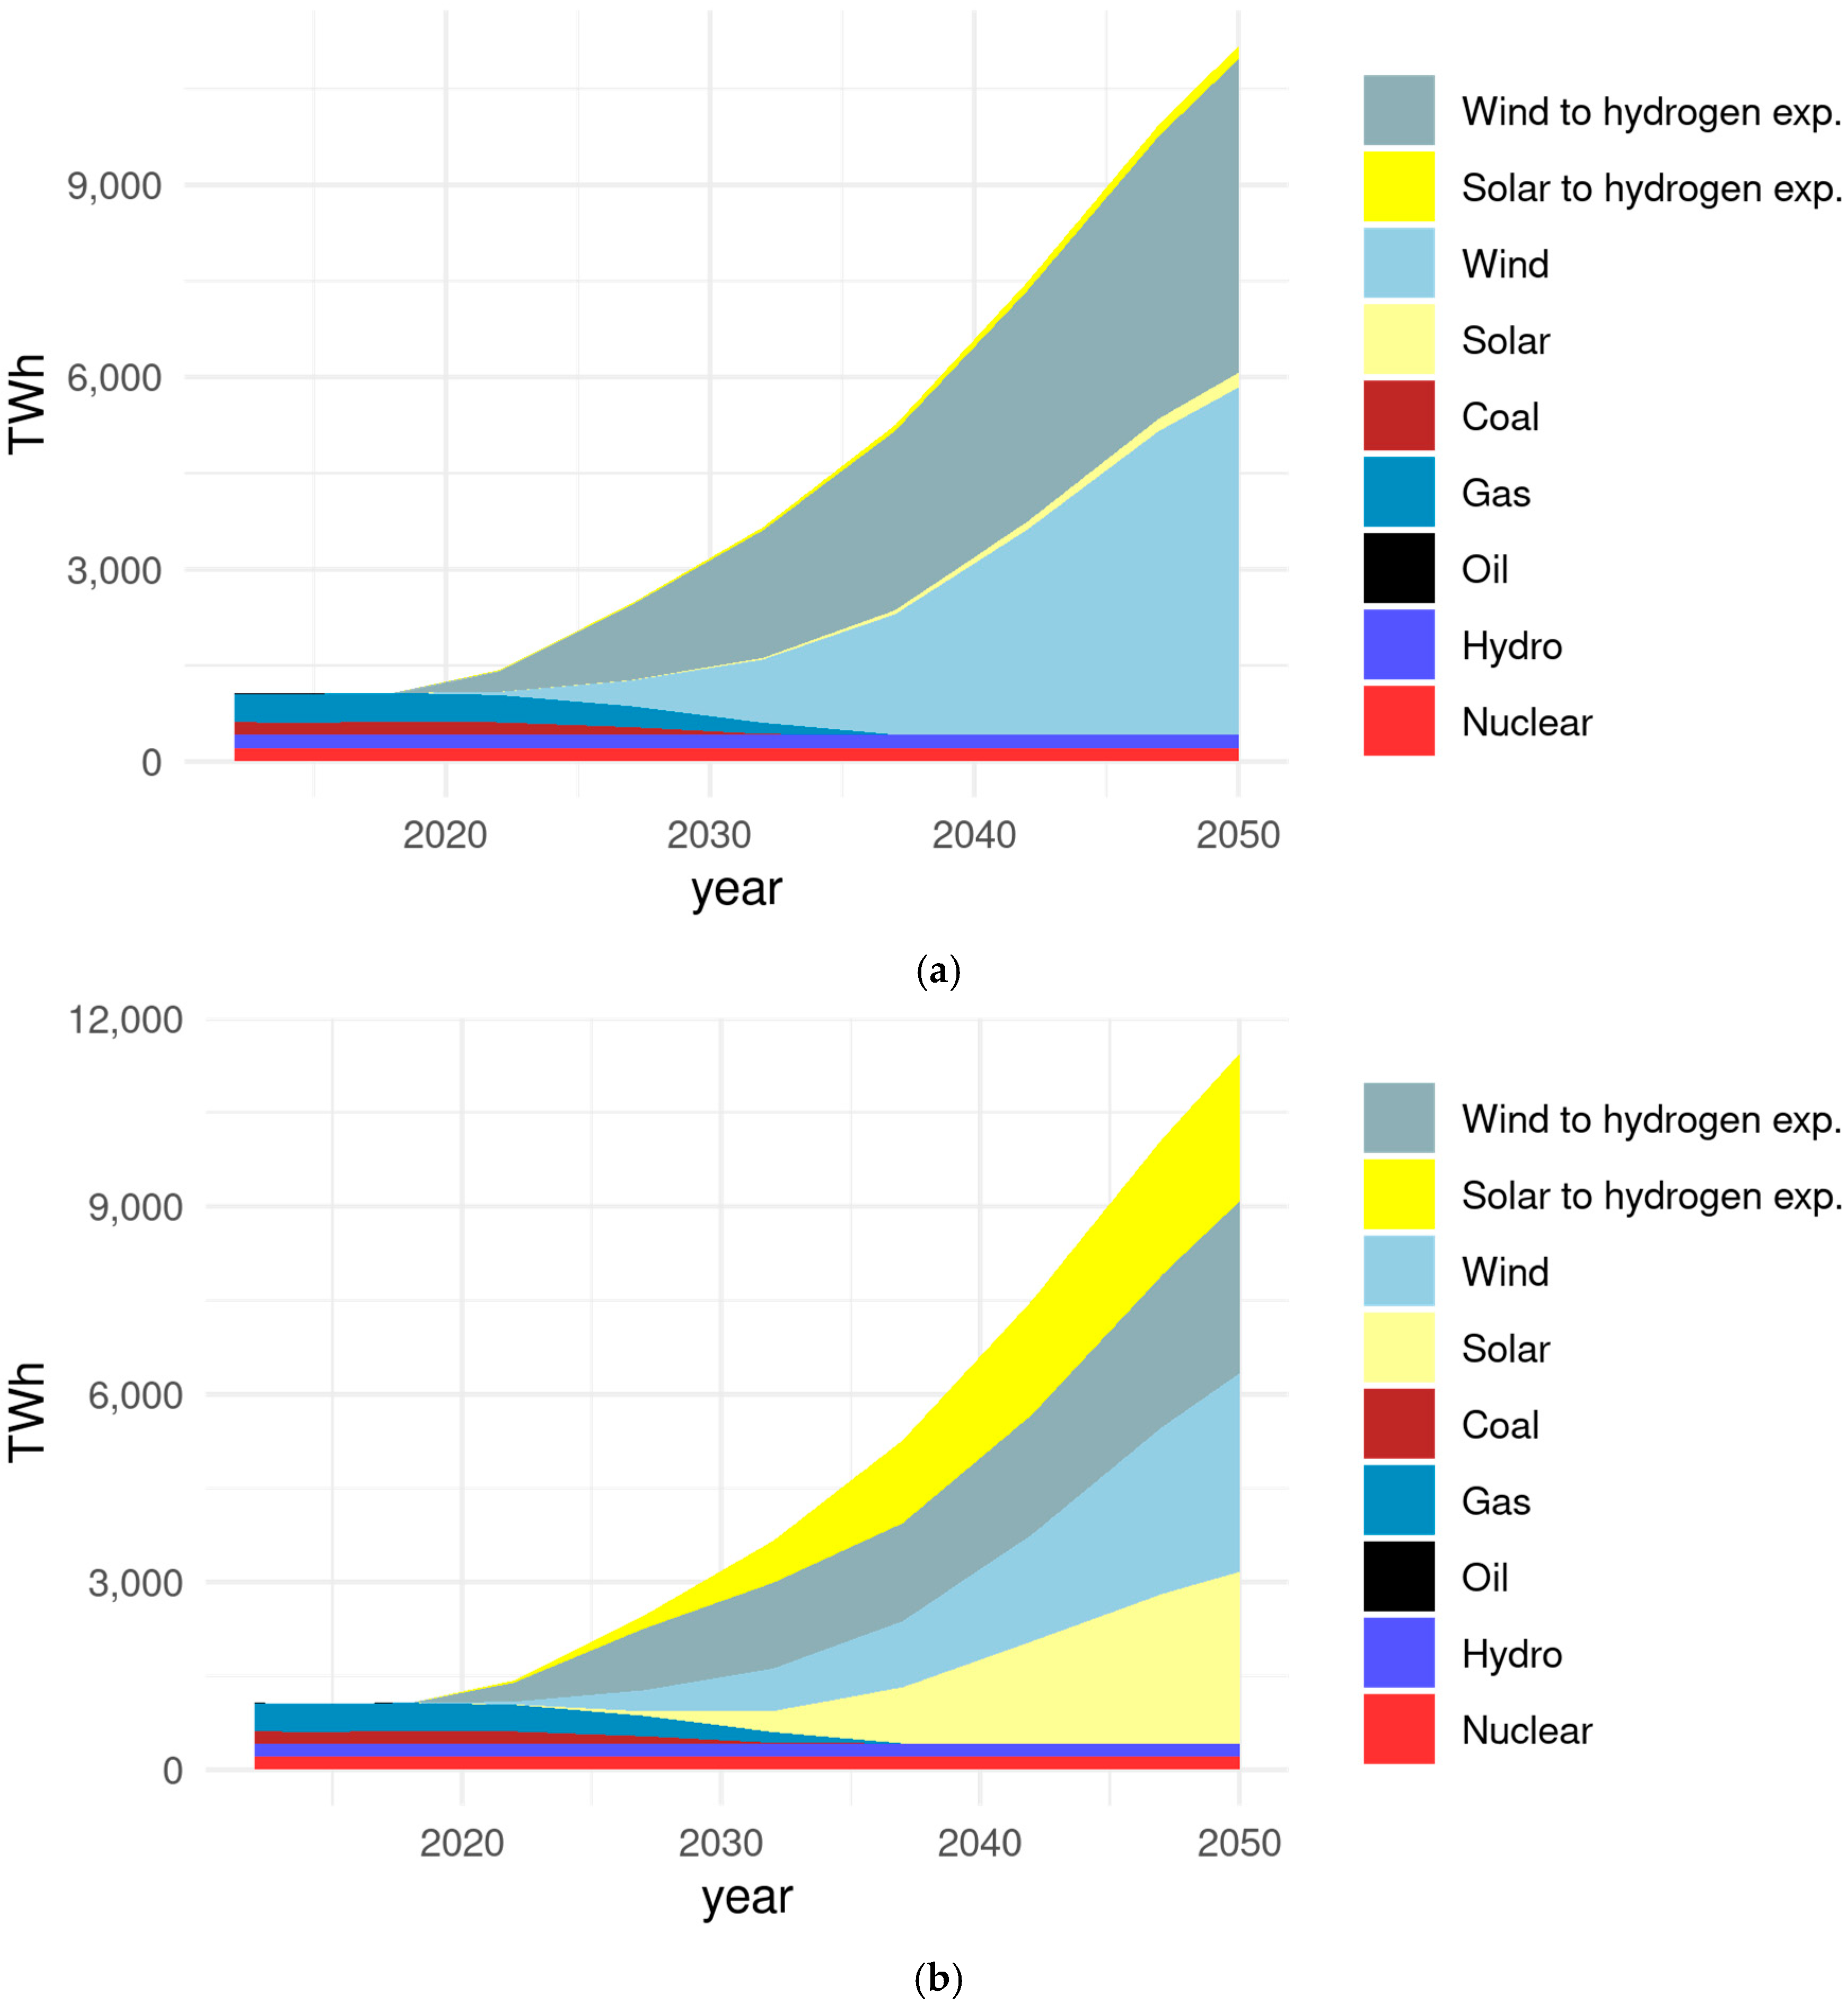
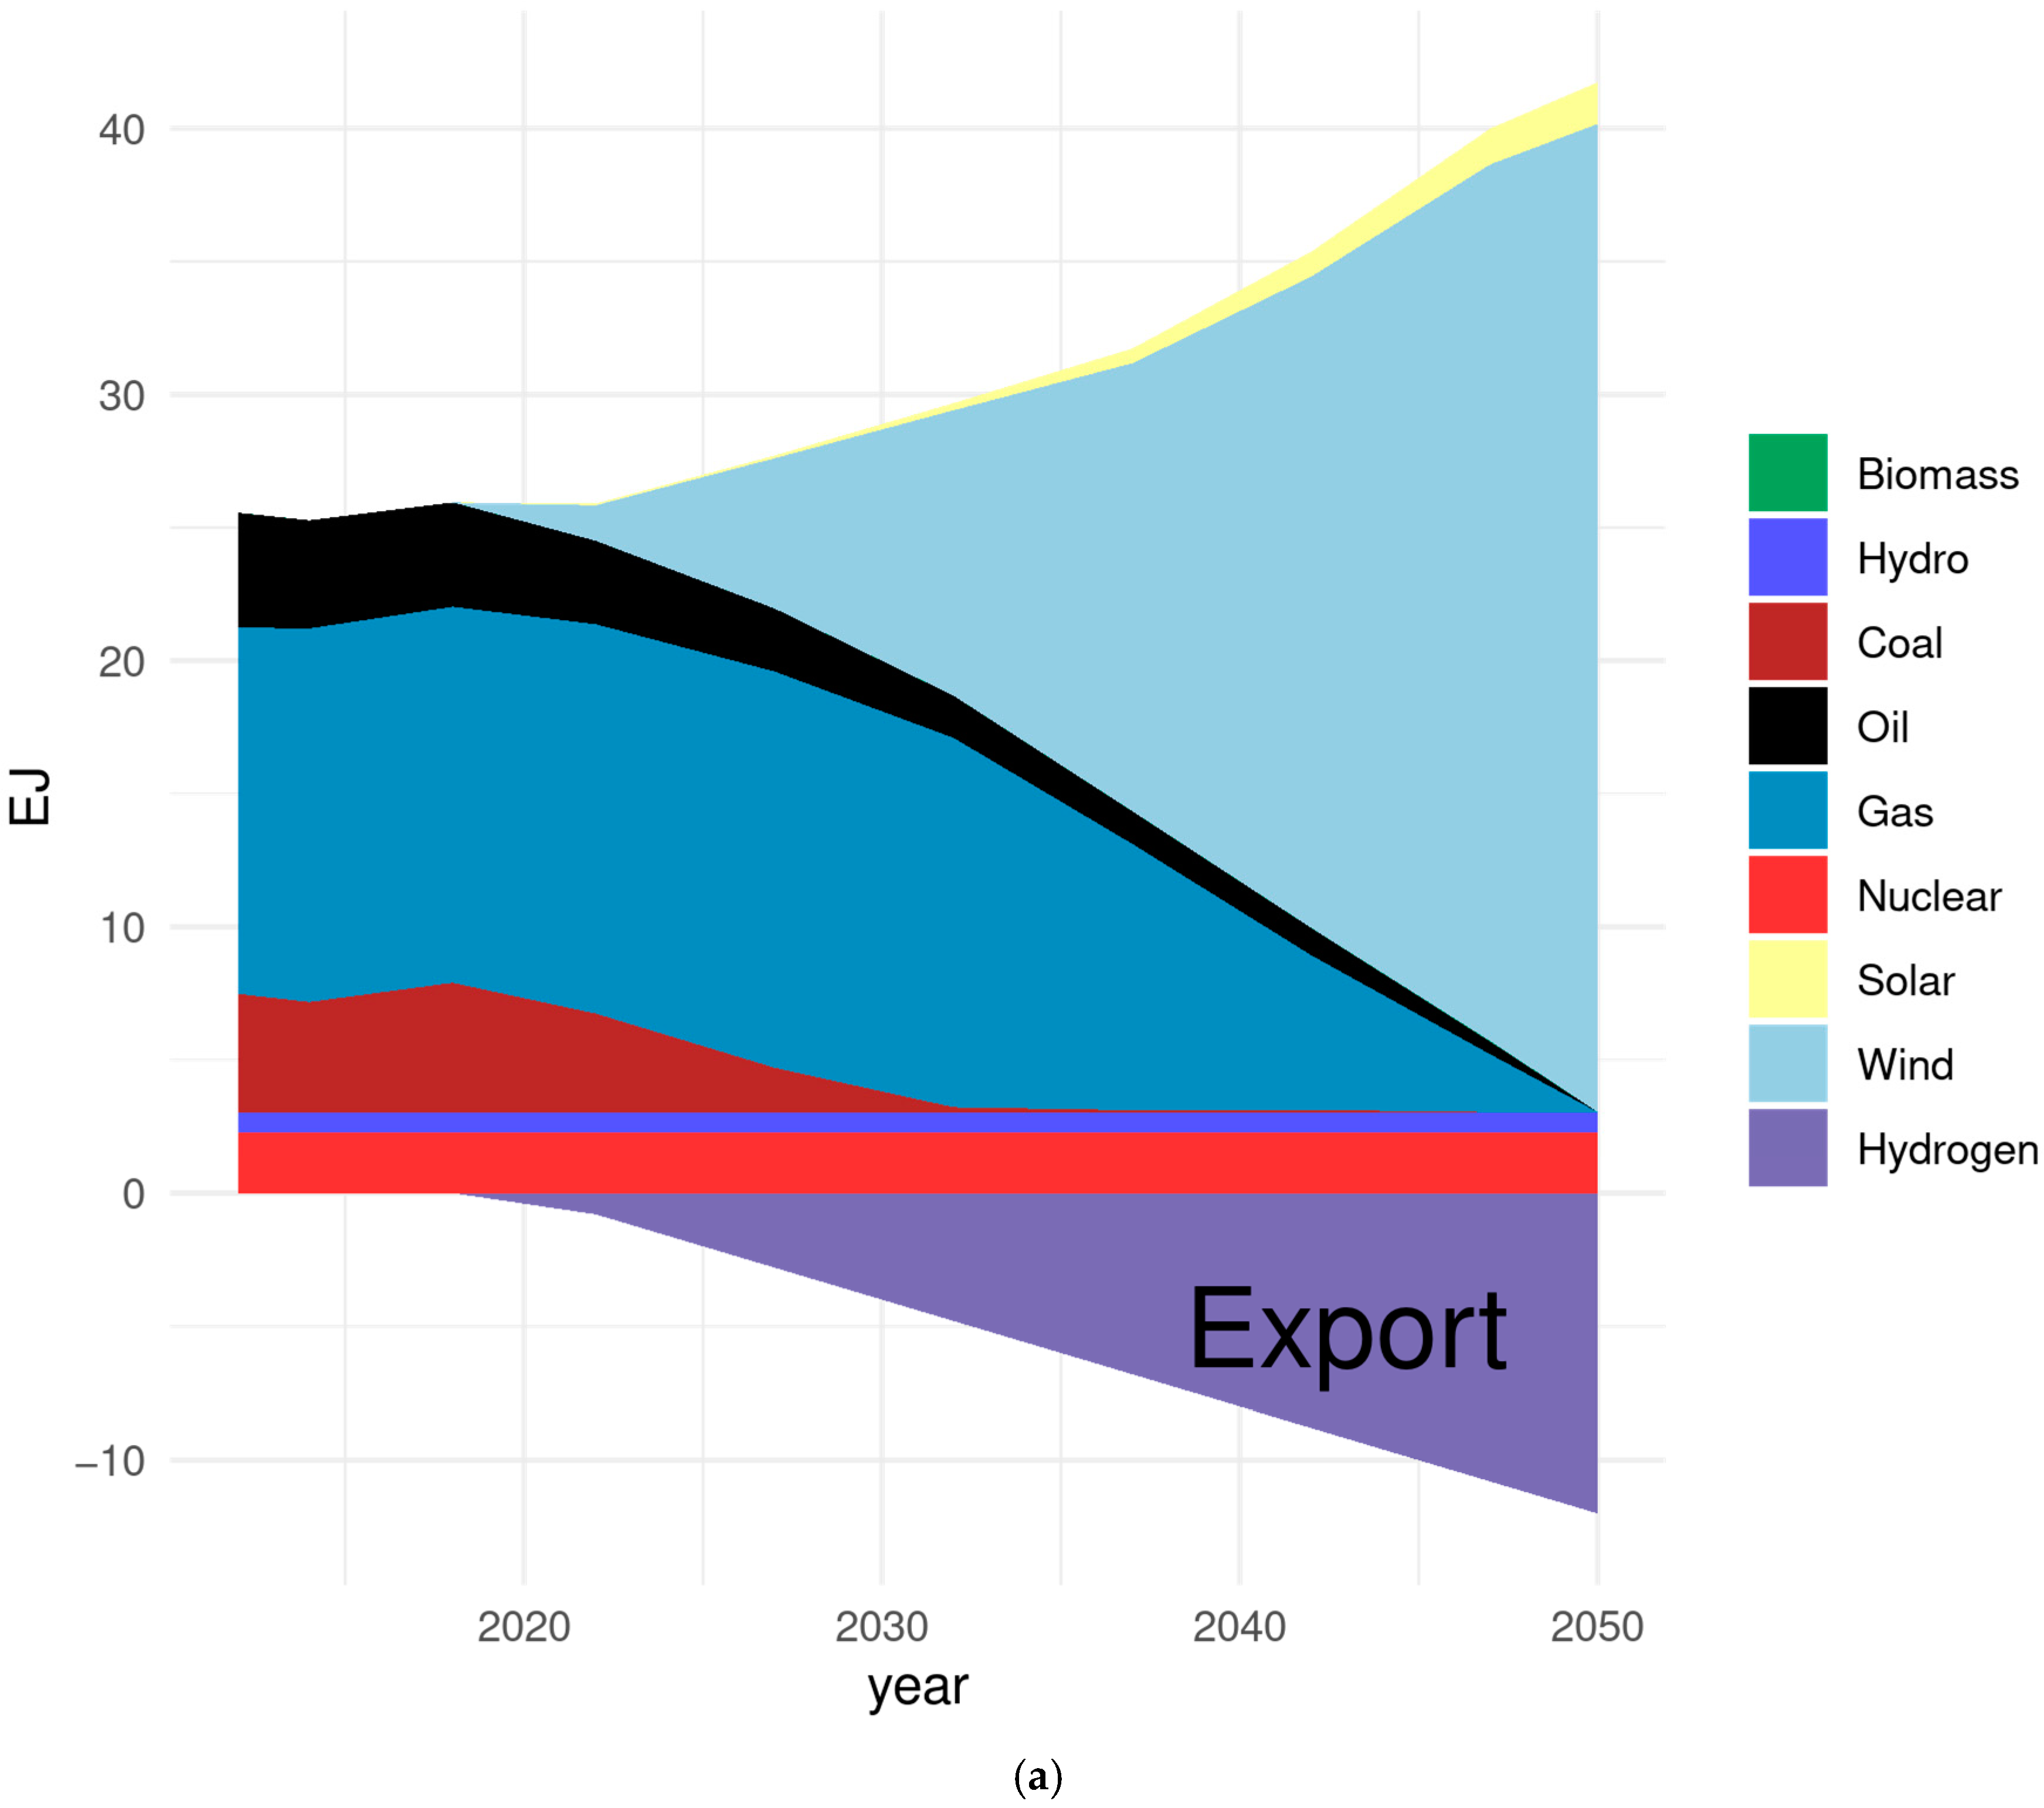
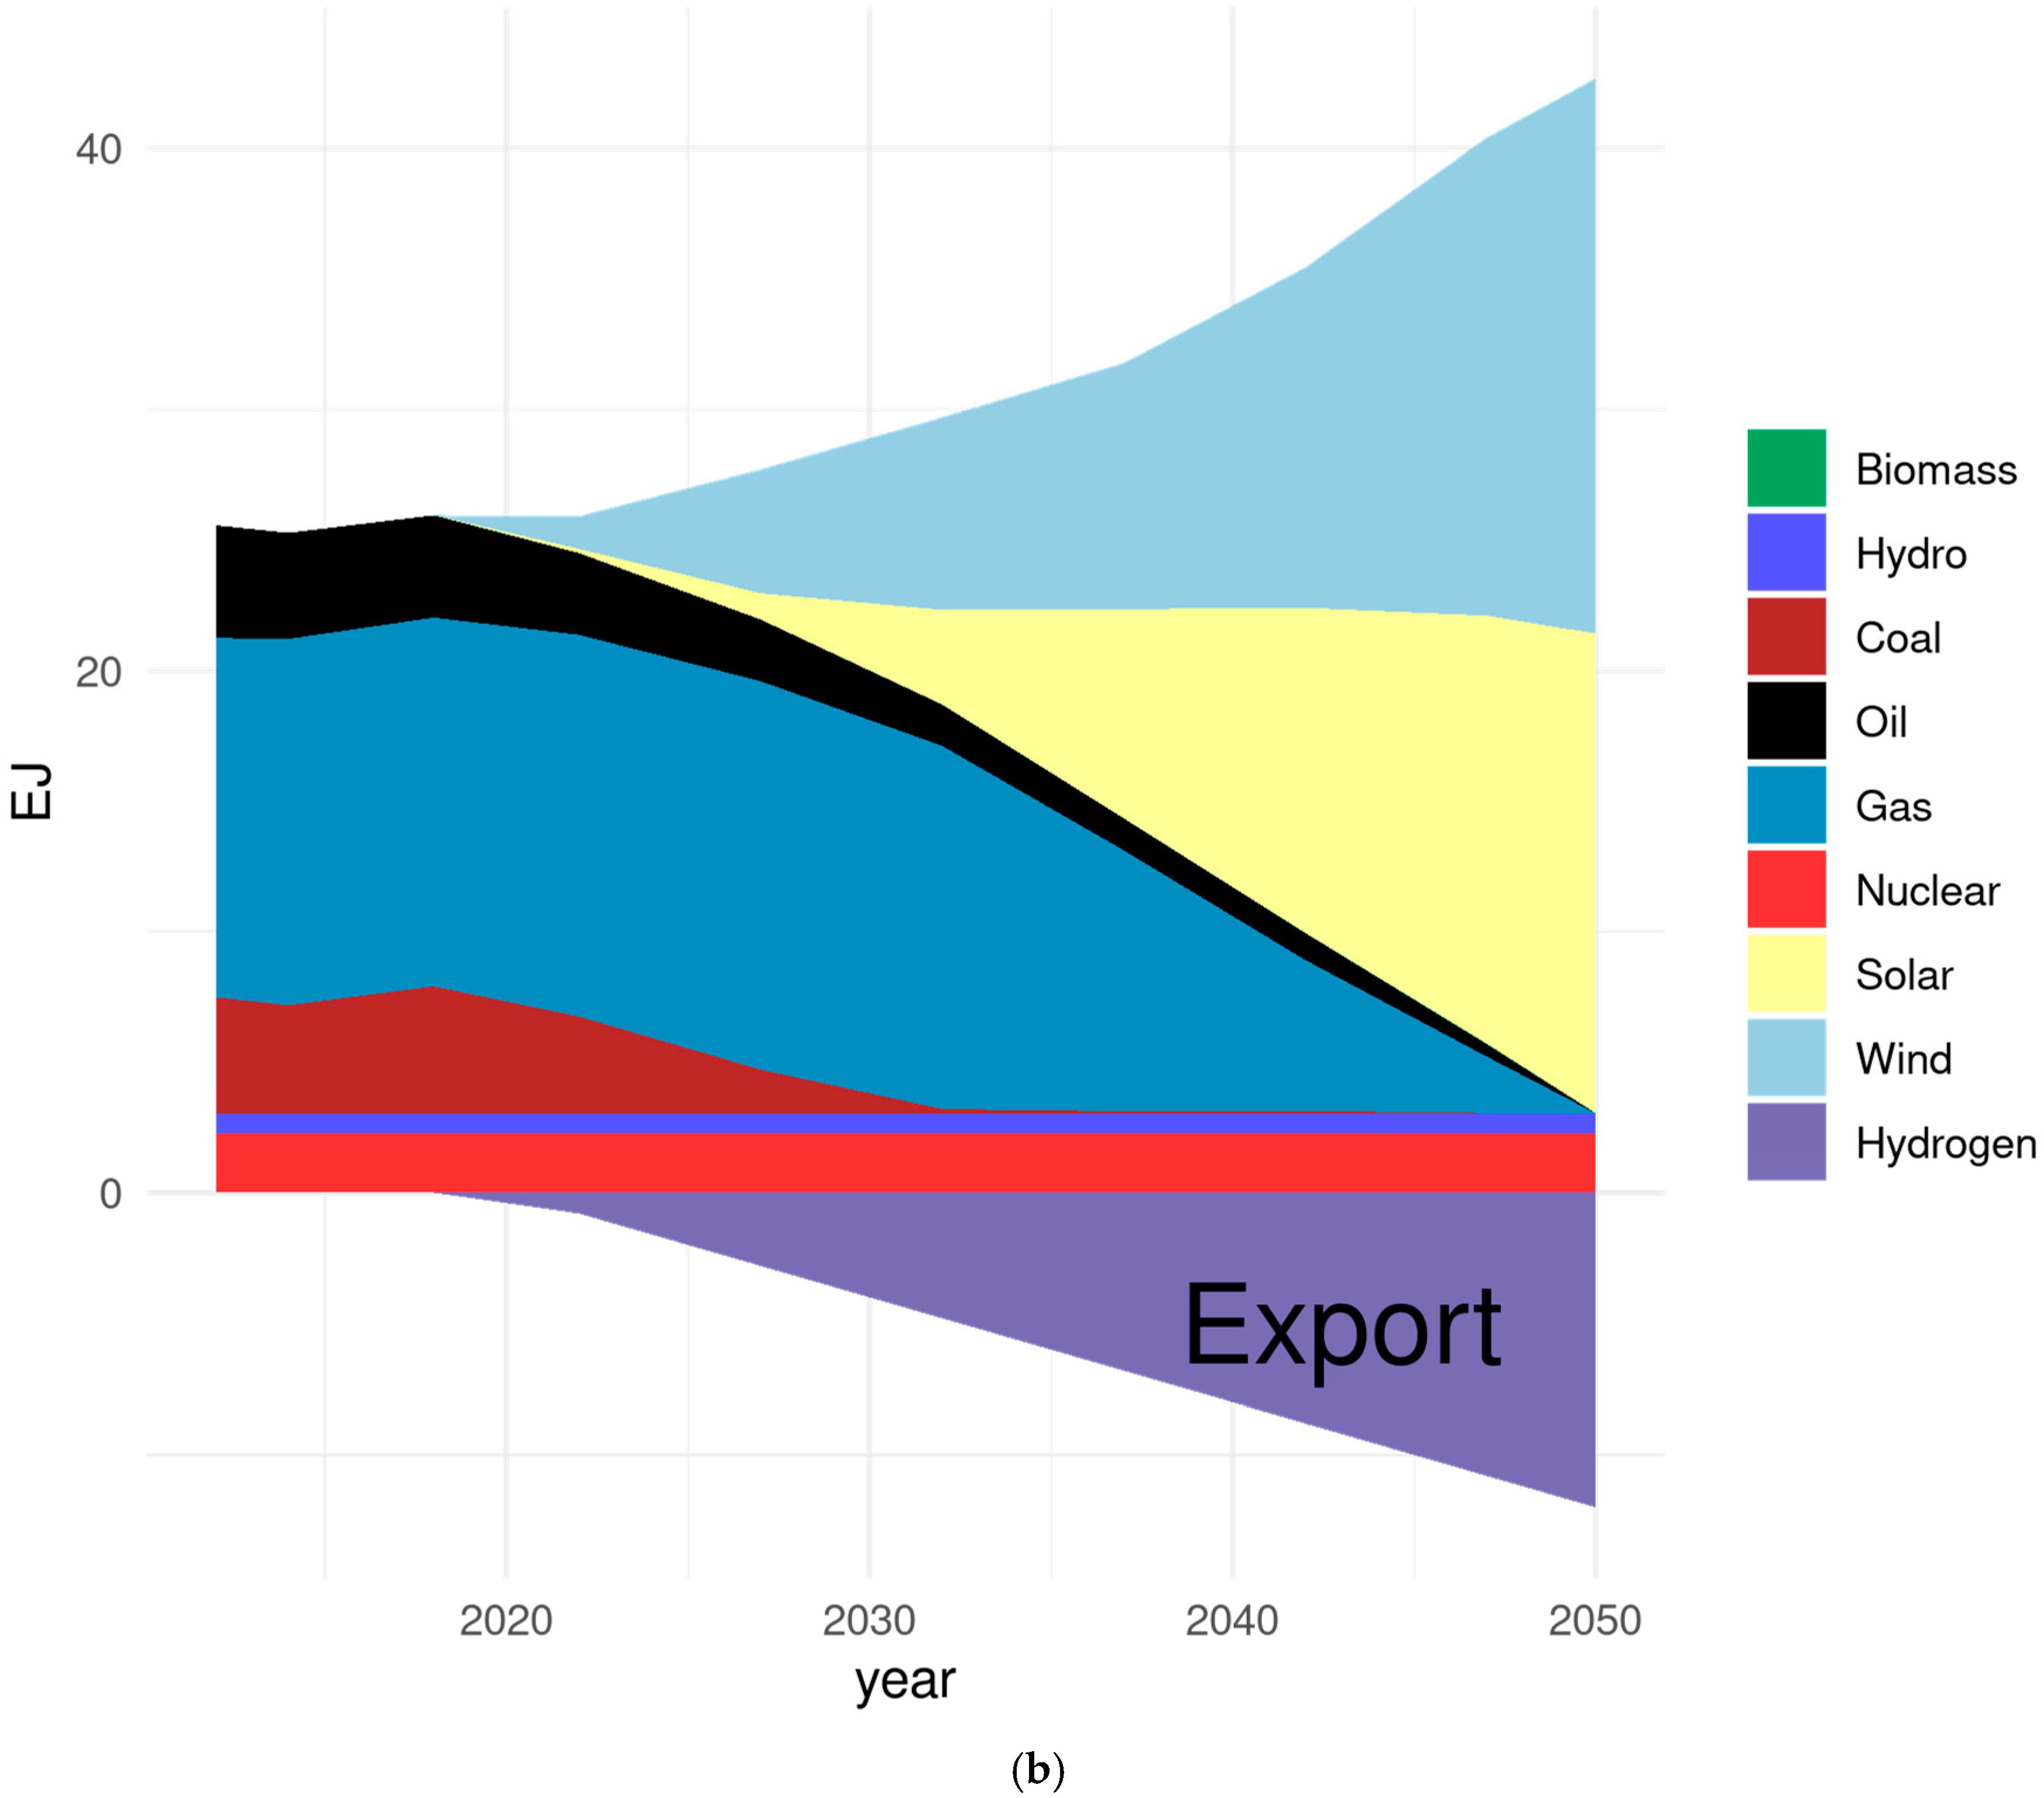
3.3. Transitional Dynamics to a 100% Decarbonized Energy System

This section shows the results of the modeling in terms of electricity production and consumption during the transition to a decarbonized system by 2050. The results shown in following figures are based only on use of the 24 more realistic alternatives identified in Section 3.1. The numbers and quantitative analyses are based on averaged values from these 24 alternatives.
Figure 5a illustrates both the production and consumption of electricity in all nine RES regions. It is shown on an average hourly basis. All electricity is produced from wind or solar. Depending upon the region, wind or solar dominate production over the course of 24 h. However, wind, on average, is far more important. Electricity demand is shown in the lower half of the figure for each region. The model distinguishes critical demand from flexible demand. Additionally, in some regions, a lot of electricity demand can be used to produce hydrogen. Storage plays varying roles in the different regions. In Figure 5b, solar production plays a far bigger potential role.
The next series of figures looks at various aspects of both production and consumption, annualized investment costs, carbon emissions, and a period of phase-out of fossil fuels and the potential for production of green hydrogen. Starting with Figure 6a,b, the long-term development of wind and solar to electricity production can be seen. When costs are lower, as shown in Figure 6b, solar is a much more important share of production than in Case A, Mega Scenario A. Both figures also show that there can be significant use of wind and solar power to produce hydrogen for export, as energy exports are critical to the Russian economy. However, the longer it takes to phase out fossil fuel exports could worsen the economic problem. These are all potentially stranded assets and will not generate the same revenue as some countries will not import these anymore in the future [28].
Figure 6a,b present significantly different profiles for the energy mix in 2050. Mega Scenario A has a prevalence of wind energy that is coupled with a low technology learning rate, and Mega Scenario B has a significant share of solar. The actual composition of the energy mix will depend on the actual technology learning rates. The next decade may provide more clarity and determine the future development of power production and transmission systems.
The carbon emissions reduction profile is similar for both higher lower cost scenarios, which is not surprising, as in either case the emissions are heading towards zero. The total CO2 emissions have decreased by half by 2035. As there is likely to be some residual fossil fuel use even by 2050, achieving net-zero emissions includes assumptions about the use of some nature-based solutions such as carbon storage in forests.
However, the total primary energy supply is different (Figure 7a,b). There is a reasonably long phase-out period for fossil fuels, especially natural gas. This functions as a grace period and could be used as adjustment time to reduce economic dependency on these fuels and begin the development of hydrogen export markets and the reduction in the risk of stranded assets. The phase out of fossil fuels increases in the early 2030s, giving time for planning for it during the adoption of renewables, especially wind. However, in the lower cost scenario (Figure 7b) solar plays a more important role.
Prolonged consumption of oil is driven by the transportation sector. Since transportation is always a highly dispersed activity, it is often thought of as a difficult sector to decarbonize. Additionally, it may take longer than some other sectors. However, the adoption of electric cars and buses around the world is growing and by the 2040s in Russia electricity and hydrogen will be becoming dominant.
Both solar and wind are scalable and, thus, the strategy of the expansion of power production could be adjusted on the fly, depending on advances in wind and solar technologies, prices of raw materials and the actual cost of deployment and operation (for example, cost of cleaning snow, etc.). Regardless of the actual cost improvements, our analysis demonstrates the feasibility of a green transition in Russia. This transition appears more expensive for Mega Scenario A and naturally more affordable for Scenario B (see Figure 8a,b).
Figure 8a shows the annualized investment costs for renewable energy at interest rates of 3, 5 and 10%. Investment costs are of course much lower at the lowest rates. However, there is a shortage of capital in Russia due to political and investment risks. Golub et al. [15] suggest that the risk-adjusted cost of capital in the Russian energy sector can in reality be quite high. With greater certainty about climate policy, green investment could be attracted for a lower interest rate on the international market, which could become an additional driver of economic growth in Russia. However, as Figure 8b shows, lower overall costs lead to much lower annualized investment costs.
In both cases, the cost of capital is driven by investment risks and is an important determinant of the green transition cost. High investment risks are an important barrier for modernization of the Russian economy and for the deployment of new technologies in the energy sector [15].

4. Discussion

In this paper an analysis of the transformation of the Russian energy system proves the feasibility of a complete decarbonization of the energy sector and diversification of Russian exports away from fossil fuels and carbon intensive goods. We used one set of cost estimates that were on the high side to avoid the possibility of solutions that were not in fact feasible. One study in Canada [29] indicates that levelized costs of stand-alone solar PV is in fact more expensive at higher latitudes. Lower estimates of costs in the second scenario make the feasibility case even stronger [14].
The final composition of the energy mix in 2050 may include different proportions of solar and wind energy as shown in Figure 9 below. The proportion of wind and PV composition depends on actual learning rates and cost reductions of solar and wind energy. Competition among different land uses is also an important factor that could slow down the deployment of alternative energy in regions with high demand for agricultural land and forestry, high density of infrastructure, etc. A faster learning rate in solar results in more PV in the energy mix. Moreover, final consumption is an important factor determining the energy mix. First, the expansion of domestic power production to develop green energy intensive sectors would shift the balance in favor of solar but significant growth in hydrogen production for export would slightly shift the balance in favor of wind energy.
Another important factor is the global demand for materials needed to produce solar panels. According to [14] the maximum size of the global PV installed capacity in 2050 is approximately 60 TW in their “fast growth” scenario globally. Then, Russia would account for approximately 5% of this capacity. However, in the slow growth scenario (10 TW of PV installed globally by 2050) Russia could account for almost 1/3 of PV capacity. Although this seems a bit unrealistic it is still possible [14].
The actual ability of Russia to significantly expand solar energy production will depend on the future development of the global market of solar panels. As for wind energy, Russia is less constrained by the raw materials needed to expand the production of wind turbines.
Nevertheless, consideration of both the higher and lower cost scenarios including sensitivity runs, demonstrate the robust conclusion about the feasibility of a green transition of Russian power generation. We also show the potential feasibility to substitute the export of green energy-intensive products for the eventual loss of fossil fuel exports. The actual profile of the energy mix and the cost of the transition depends upon the learning rate for wind and solar technologies. Russia has vast potential for both technologies and should decide on an expansion of one or the other using a recursive method benefiting from new information and exploiting new opportunities. This analysis, therefore, does not provide a final answer for how much wind and solar there will be in the 2050 energy mix. It also does not provide a final answer about how the power surplus will be used, but it does explore the “hydrogen solution”. The paper proves its feasibility but does not endorse it as the best solution. There will be several options to transfer surplus power that produces even higher value added. Hydrogen is one of these products. Not all hydrogen should be exported, as a large fraction could be used domestically in production processes discussed below at a qualitative level. Quantitative analysis requires an additional expansion of the model and linking it to a CGE which is beyond the scope of this paper.
This paper shows a potential “hydrogen solution” as a substitute for current resource rent revenues. Producing excess electricity in Russia creates an option to deploy other and possibly more promising energy-intensive technologies particularly based on the convergence of 3-D printing and additive manufacturing with robotics (https://www.roboticsbusinessreview.com/wp-content/uploads/2019/04/RBR-AdditiveManufacturing-RobotCreators-Final.pdf (accessed on 1 December 2021)) leading to a variety of competitive goods on the global market across their range of uses.
Thus, for the modeling, hydrogen functions as a place holder for a more profound deep transformation of the Russian economy in the context of the global transformation of energy systems and global markets. Hydrogen and related products may be demonstrated to be a feasible alternative to fossil fuel exports. Further analysis is needed to evaluate its international cost-competitiveness or find even better alternatives for the transformation of green energy into low carbon energy intensive products that Russia could offer on the global market. These all reinforce Russia’s need to further explore opportunities for a technologically advanced country with excessive power production.
The parameters used in this study, electricity demand, wind turbine height, solar panel tracking, degree of energy storage and electricity trade across the nine regions of the study created 72 separate alternatives for an energy system of 2050. We identified 24 of these as being more realistic and potentially targeted. All of these were based upon constrained energy storage at 14 TWh. The other important parameters were a wind turbine height of 100 m or higher and at least single-axis tracking for solar photovoltaics. Solar without any tracking was a lot less effective and, in a few cases, very inefficient. However, the difference between 1- and 2-axis tracking was minimal, so if the cost difference is high, the 1-axis tracker might be preferable on average. This is consistent with observations in the literature that single-axis tracking PV is becoming increasingly more common in utility scale systems and market prices of PV modules have decreased by approximately 90% and system prices by close to 80% during a decade [14]. These trends are expected to continue.
Wind turbine effectiveness was progressively better with the increase in height from 50 to 100 to 150 m. If cost constraints are not significant then the higher turbines are likely preferable. An additional advantage of wind is that it uses much less land area than solar PV requires. Another important result for keeping overall costs down is that the two isolated regions do not need to be included for a 100% renewable system. That territory is so large that this does reduce costs significantly. Overall, the power generation cost will be most of the total investment costs when compared with distribution and storage costs.
These technological innovations have made alternative (non-fossil fuel-based) technologies more affordable and nearly competitive even without mandatory climate policy. The cost estimates used in this analysis, in addition to being high, also do not account for likely decreasing costs as the alternative energy industry continues to grow.
These technological shocks will reduce demand for fossil fuels. For example, the increasing penetration of electric cars jeopardizes oil producers’ and exporters’ revenues and further accelerates the development of alternative energy. Shifts in consumers’ preferences reinforce the decarbonization of consumption. Final consumers care about both direct emissions and all emissions that occur along the supply and production chain, e.g., Scope One and Scope Two emissions, as defined by the Carbon Disclosure Project [30].
Corporations and capital markets are also going through a fundamental transition. According to the IEA [31], global investment needs into the net-zero economy ramps up from recent levels of approximately USD 2.3 trillion globally to USD 5 trillion by 2030. In the IEA net-zero scenarios the global GDP increases approximately two times during the period between 2020 and 2050 but energy supply stays slightly below the current level.
Far higher estimates of investment needs have been made [32,33]. This is approximately one-quarter to one-third of the global investment pool. It suggests fundamental changes in the global capital allocation aiming for the divestment of carbon-intensive capital and financing capital investment with a low- and zero-carbon footprint. Russia is already challenged by excessively high investment risks, as the risk-adjusted cost of capital in the energy sector may be up to 45% [15].

Uses of Hydrogen and Excess Electricity

Hydrogen, as proposed in this analysis, is used as a known fuel and a known technology. It is not the only approach to building an alternative energy economy but it is a known path with an already expanding market. Supplying hydrogen to industrial users is now a major business [34]. Demand for hydrogen in its pure form is approximately 70 million tonnes per year (MtH2/yr). This hydrogen is almost entirely supplied from fossil fuels with 6% of global natural gas and 2% of global coal going to hydrogen production. This production of hydrogen is responsible for carbon dioxide (CO2) emissions of approximately 830 million tonnes of carbon dioxide per year (MtCO2/yr) [35].
Using green hydrogen is a potential solution to these emissions and would be produced using the excess renewable energy shown in the various feasible alternatives. It is one solution for hard-to-abate sectors such as industry and heavy transport and for decarbonizing applications without access to electricity grids. Unlike many countries, Russia has an abundance of land, especially for wind stations and abundance of water that could then be converted into green hydrogen. Green hydrogen can also provide grid balancing services in systems built on very high shares of renewable energy [36]. Currently, green hydrogen makes up less than 1% of global hydrogen produced [37], but production costs of green hydrogen are falling rapidly due to decreasing technology costs and the availability of cheaper renewable power. As a result, countries are increasingly seeing green hydrogen as a smart long-term investment. According to IRENA [38], green hydrogen can contribute to significant CO2 emissions abatement as part of a 1.5 °C pathway, particularly in the industrial sector as well as long-haul transport, shipping and aviation. In the short to medium term, green hydrogen is expected to make its most substantial impact in the industrial sector. Approximately 85% of green hydrogen production costs can be reduced in the long term by a combination of cheaper electricity and electrolyser investment and optimization [35]. Derivative products such as solar ammonia as a shipping fuel are also becoming much cheaper [39].
In several of the EU’s hydrogen scenarios [40] there are several very important uses of green hydrogen. This includes transportation using both fuel cell vehicles and synfuels for aviation and maritime transport. Other uses potentially include heat production for industry and the replacement for natural gas for heating of buildings, this might include injection into existing gas networks. Another potentially important use will be for long-term energy storage, production of hydrogen that can later be converted back to electric power when needed. There are quite a number of potential uses of hydrogen, and Europe is a potentially significant market for hydrogen.
The excess electricity production proposed in this analysis can also be used without the use of hydrogen. Electric vehicles can serve as massive energy storage, with the overproduction of electricity charging vehicle batteries, which can then be returned to the grid when overall demand is high. As a country with vast hydropower resources, excess electricity can be used to pump water back upstream to be used to make electricity during lower flow time periods.
The hydrogen production proposed in this analysis is simply a potential first step in the diversification of the Russian economy that would no longer be fossil-fuel based. At first, we propose that hydrogen could be a substitution for fossil fuel exports. Markets for green hydrogen are likely to be strong as all advanced economies are attempting to decarbonize all aspects of their economies and not just the energy sector. Currently, Russia is not heavily involved in developing hydrogen technologies, as the international climate agenda and decarbonization are not yet a significant part of Russia’s energy strategy. Russia does not yet play a significant role in the development of low-carbon technologies in general [41]. Nonetheless, Europe can be an important market as they would substitute Russian hydrogen for natural gas imports. Europe’s utility Enel is looking to develop a green hydrogen project in Russia to expand its renewable energy business in the country and is looking into hydrogen production in connection with a wind plant in the Murmansk region [42]. The climate crisis is further increasing interest in Europe to import green hydrogen and may well be a basis for cooperation with Europe by substituting hydrogen for fossil fuel exports, potentially through existing pipelines [43]. The Russian Government is planning on the northwest of the country to become a key area for hydrogen production, particularly for export to Europe (accessed on 10 December 2021)). Germany’s June 2020 National Hydrogen Strategy clearly states the need for hydrogen imports and emphasizes the importance of international partnerships, which is contributing to Russia’s interests in becoming a major exporter according to the German Institute for International and Security Affairs (https://www.swp-berlin.org/en/publication/russia-in-the-global-hydrogen-race (accessed on 7 December 2021)). For Germany, benefits of cooperation include not only potential access to low-carbon hydrogen but also the opening of a market for German hydrogen technologies and, more strategically, a special role in accompanying Russia’s adaptation to a decarbonizing Europe.
Depending on the quantities, hydrogen can be transported through hydrogen pipelines, not just by tankers. The long experience in the gas sector can be directly used to create hydrogen distribution networks, which are similar to existing natural gas networks. Although it has a lower energy density than natural gas, hydrogen is less viscous than natural gas. As a consequence, the energy needed for its pumping is similar to the energy required for the same quantity of natural gas. Large hydrogen pipelines are present in several countries. In Northern France there is a network of approximately 170 km, while in Europe the total length amounts to more than 1500 km. North America has more than 700 km of pipes for the transport of hydrogen. The distribution networks for liquid hydrogen are particularly expensive (http://www.eniscuola.net/en/argomento/hydrogen/storage-and-transport/how-its-transported/ (accessed on 10 December 2021)).
Successful global climate policy depends on the coordinated actions of all countries. The continuation of unilateral climate policies by carbon-dependent countries is not an option for the global community. As shown in [28], leaders of global climate policies have several tools to create incentives for carbon-dependent countries to join coordinated actions to combat climate change. Carbon-dependent countries may be subjected to a border adjustment tax [6] that reduces its competitiveness on global and regional markets. As a result, carbon-dependent countries will be forced to participate in coordinated global climate policy and introduce domestic carbon regulation.
Climate policies of an increasing number of countries are leading to major investments into innovative electrification and smart technologies and very significant shifts in consumers preferences. These trends mean the era of fossil fuel-based economies and energy systems are coming to an end. As the World Bank [28,44] noted in several recent studies, attempts to prolong the life of a fossil fuel-based economy may alleviate some pressure in the short term but exacerbates the economic shocks in the mid- and long term. The same study also provides some quantitative analysis of potential losses in GDP, final consumption, resource rent, and value-added in carbon-dependent sectors, etc. Potential losses of GDP and final consumption could be up to 5% of GDP and the resource rent loss reaches double digit numbers. The rapidly changing profile of the global economy constitutes a series of challenges for Russia and other carbon-dependent countries. These include massive technological innovations that fundamentally change the profile of energy production and consumption along with changes in consumer preferences driven by environmental considerations. Other challenges include existing voluntary carbon markets (The Gold Standard (https://www.goldstandard.org/impact-quantification/environmental-markets (accessed on 20 July 2021))) with verifiable carbon credits and Socially Responsible Investment [45] and emerging global and regional climate policies with the potential of cross-border enforcement [46,47].
Diversification of the Russian economy coupled with clean energy transformation is the only way to adjust to emerging global climate policy, as it is a major net exporter of energy and a major emitter of greenhouse gases. Significant shares of its emissions are associated with fuel combustion in the domestic energy sector, and indirectly through its large oil and gas energy exports. The World Bank study [28] argues that carbon-dependent countries should in the long run move away from the business-as-usual scenario and begin a proactive diversification strategy and participate in global cooperation on the decarbonization of the global economy.
Currently, in Russia the main competing energy supply technology to wind and solar power is natural gas, and gas exports are a very important source of revenue. Natural gas can still be very cheap and outcompete wind and especially solar. However, as the price of solar and wind continue to decline, gas will be less and less profitable. With any carbon border adjustment mechanism, it will become very expensive, which means in the long run, global climate policy will change the economics of natural gas.
Natural gas infrastructure is a huge sunk cost in Russia, although it is still very profitable. It is far preferable for Russia to use gas in its energy mix if it replaces coal. This is true not only for greenhouse gas emissions but extremely important to reduce particulate air pollution and its heavy burden of mortality in Russia [48]. High costs of capital are a barrier to investment in renewables.

5. Conclusions

Fossil fuel use globally is already declining due to high levels of technological innovation, rapidly declining costs of renewable energy production and increasingly stringent global climate policy. This paper describes a feasible strategy for Russia to respond to twin decarbonization challenges. Our modeling shows that complete decarbonization of the Russian economy is technically feasible. The study demonstrates that Russia has vast potential for wind and solar production. In Russia’s Northwest, there is significant potential for wind power, in a geographic region with few people and the water resources needed for hydrogen production. The study proves the feasibility of a complete transition to wind and solar. With continuous improvements of both technologies, solar and wind could be roughly equal in the energy mix. The learning rate for both technologies determine their proportion in the energy mix. Even in the worst-case scenario (slow improvements and slow cost reduction) 100% decarbonization is still feasible.
The proposed approach, with excess production of electricity, has the potential to jumpstart a more diversified and innovative economy in Russia. This is an opportunity to create longer term wealth that relies on innovative technology and highly developed human capital. The study suggests that this process should be thought of as an opportunity to build a new and a potentially bigger economy through technology change. Since Russia is a technologically advanced country, it is capable of such a change.
The primary and most important conclusion of this analysis is the demonstration of the feasibility of the transition to 100% renewable energy for the decarbonization of the energy sector. We proved the feasibility of an accelerated convergence to alternative energy primarily based on wind and solar, which would lead to the creation of a completely different profile of the entire Russian economy. This transition strategy enables a radical diversification of the Russian economy based on the extensive deployment of green energy and transition to green energy-intensive technologies. We conclude that Russia can likely become a significant exporter of green energy-intensive goods. In this paper, we examined one of the possible alternatives: how to use an over-supply of electricity to produce green hydrogen. This supply of hydrogen could be the substitute for Russia’s export of conventional fossil fuels. Although we did not attempt to identify a targeted scenario, there are a number of realistic combinations of wind and solar energy to achieve decarbonization based on mostly the two energy sources. Plus, we show that for an annualized investment into green hydrogen production of USD 150 billion, Russia could export approximately 100 Mt of hydrogen (and related products in hydrogen equivalent). At a reasonable, and not overly optimistic average price of $3/kg hydrogen, then the export of green hydrogen will provide more revenue than fossil fuel exports in 2019. This could be a new comparative advantage in the global energy market for the Russian economy, although there is a potential risk of international competitiveness and the development in global demand. However, the approach laid out in this paper indicates that Russia could be on the inside of global climate policy making.
The transformation of excess power into hydrogen is one of the options for Russia to solve the twin challenges of decarbonization. Indeed, Russia can potentially transfer green energy to other energy-intensive goods to be traded on the global market substituting losses from resource rent revenues. This diversification strategy may be more profitable and easier to implement (taking into account the difficulties of handling hydrogen). However, a detailed analysis of the green hydrogen sector is beyond the scope of this paper. Our goal was simply to show one possible strategy to address the twin challenge of global decarbonization. Green hydrogen is a very flexible approach that can function as energy storage, fuel for electricity production or transport or as an income producing export to replace fossil fuel exports. Therefore, hydrogen is in a sense a “place holder” and a first step in the path towards more efficient and more attractive technology solutions.
The optimal transition to a carbon-free energy sector in Russia has yet to be researched. The analysis did show the feasibility of this transition, using high-cost estimates, and in a country with an always challenging set of physical conditions. The exploration of export diversification approaches presented in this paper analysis creates a foundation for future studies. Additionally, further research should consider investment risks and institutional barriers for innovations and the diversification of the Russian economy and Russian exports.

Author Contributions

Conceptualization O.L. methodology, software, V.P. and O.L. Writing-original draft preparation, V.P. and A.G., and M.B., writing-review and editing, A.G. and M.B. and V.P. All authors have read and agreed to the published version of the manuscript.

Funding

Michael Brody and Oleg Lugovoy carried out research for this article with the support of the RANEPA state assignment research programme. Alexander Golub and Vladimir Potashnikov carried out research for this article with the support of the Russian Science Foundation, project No. 21-18-00126.

Data Availability Statement

Assumption of weather data, supply of fossil fuels, existing demands and technical parameters were taken from open-source data, including IEA (incl. ETSAP project), official statistics of Rosstat, IRENA, Lazard, UNFCCC reports. The most important ones are cited in the article.

Acknowledgments

The authors gratefully acknowledge the thoughtful comments of John A. “Skip” Laitner on our draft revisions. However, the responsibility for all of these ideas are our own.

Conflicts of Interest

The authors declare no conflict of interest.

Appendix A

All equations are published in the packages of energyRt. Basic model descriptions are in the paper and in the references. Historical data about living space, populations and existing stocks are estimated based on the official Rosstat reports. The most important data about new technologies are in the references.
The model generator energyRt consists of more than 90 equations, with detail not suitable for paper format. For an explanation of the main idea of the model we provide a short, simplified version below. The full set of equations is available on the package website https://energyrt.org/articles/model.html (accessed on 15 December 2021).
min   Objective = y 1 ( 1 + r ) y ( C o s t t e c h + C o s t s u p p l y + C o s t t r a d e + C o s t s t o r a g e + C o s t i m p o r t C o s t e x p o r t )
subject to
market clearance condition:
r , c , y , s :   s u p O u t s u p , c , r , y , s s u p p l y + s t g O u t s t g , c , r , y , s s t o r a g e + t O u t t , c , r , y , s t e c h + O u t c , r , y , s i m p o r t          t I n p t , c , r , y , s t e c h + Demand c , r , y , s + I n p c , r , y , s i m p o r t          + s t g I n p s t g , c , r , y , s s t o r a g e  
Technology efficiency:
t , c , r ,   y , s : c t e c h n o l o g y   i n p u t η t , c , r , y , s I n p t , c , r , y , s t e c h = O u t t , c , r , y , s t e c h
Load constraint:
t , c , y , s :   O u t t , c , r , y , s t e c h S l i c e S h a r r e s C a p a c i t y t , c , r , y t e c h C a p 2 a c t
where Objective —objective functions, C o s t * —total corresponding costs, including equivalent annual costs, operational and maintenance costs, O u t * —output, I n p * —input, Demand c , r , y , s —demand?, where * is tech—technology, sup—suppliers, import—import from rest of the world and other regions, export—export from rest of the world and other regions, trade—interregional trades, sup—supply, storage—storage technology? C a p 2 a c t —convert coefficients from capacity to activity (e.g., GW to TWh), η t , c , r , y , s —commodity efficiency, S l i c e S h a r r e s —share of slice in years (e.g., for day is equal 1/365).

References

  1. IPCC. 2021: Summary for Policymakers. In Climate Change 2021: The Physical Science Basis. Contribution of Working Group I to the Sixth Assessment Report of the Intergovernmental Panel on Climate Change; Masson-Delmotte, V., Zhai, P., Pirani, A., Connors, S.L., Péan, C., Berger, S., Caud, N., Chen, Y., Goldfarb, L., Gomis, M.I., et al., Eds.; Cambridge University Press: Cambridge, UK, 2021. [Google Scholar]
  2. Brown, T.W.; Bischof-Niemz, T.; Blok, K.; Breyer, C.; Lund, H.; Mathiesen, B.V. Response to “Burden of proof: A comprehensive review of the feasibility of 100% renewable-electricity systems”. Renew. Sustain. Energy Rev. 2018, 92, 834–847. [Google Scholar] [CrossRef]
  3. Bogdanov, D.; Koskinen, O.; Aghahosseini, A.; Breyer, C. Integrated renewable energy based power system for Europe, Eurasia and MENA regions. In Proceedings of the 2016 International Energy and Sustainability Conference (IESC), Cologne, Germany, 30 June–1 July 2016; pp. 1–9. [Google Scholar]
  4. Bogdanov, D.; Farfan, J.; Sadovskaia, K.; Aghahosseini, A.; Child, M.; Gulagi, A.; Oyewo, A.S.; Barbosa, L.D.S.N.S.; Breyer, C. Radical transformation pathway towards sustainable electricity via evolutionary steps. Nat. Commun. 2019, 10, 1077. [Google Scholar] [CrossRef] [PubMed] [Green Version]
  5. Bogdanov, D.; Ram, M.; Aghahosseini, A.; Gulagi, A.; Oyewo, A.S.; Child, M.; Caldera, U.; Sadovskaia, K.; Farfan, J.; Barbosa, L.D.S.N.S.; et al. Low-cost renewable electricity as the key driver of the global energy transition towards sustainability. Energy 2021, 227, 120467. [Google Scholar] [CrossRef]
  6. Hansen, K.; Breyer, C.; Lund, H. Status and perspectives on 100% renewable energy systems. Energy 2019, 175, 471–480. [Google Scholar] [CrossRef]
  7. Lugovoy, O.; Gao, S.; Gao, J.; Jiang, K. Feasibility study of China’s electric power sector transition to zero emissions by 2050. Energy Econ. 2021, 96, 105176. [Google Scholar] [CrossRef]
  8. Lugovoy, O.; Jyothiprakash, V.; Chatterjee, S.; Sharma, S.; Mukherjee, A.; Das, A.; Some, S.; Dinesha, D.L.; Das, N.; Bosu, P.; et al. Towards a Zero-Carbon Electricity System for India in 2050: IDEEA Model-Based Scenarios Integrating Wind and Solar Complementarity and Geospatial Endowments. Energies 2021, 14, 7063. [Google Scholar] [CrossRef]
  9. Sokolnikova, P.; Lombardi, P.; Arendarski, B.; Suslov, K.; Pantaleo, A.; Kranhold, M.; Komarnicki, P. Net-zero multi-energy systems for Siberian rural communities: A methodology to size thermal and electric storage units. Renew. Energy 2020, 155, 979–989. [Google Scholar] [CrossRef]
  10. Kozlova, M.; Collan, M. Modeling the effects of the new Russian capacity mechanism on renewable energy investments. Energy Policy 2016, 95, 350–360. [Google Scholar] [CrossRef]
  11. Hawken, P. (Ed.) Drawdown: The Most Comprehensive Plan Ever Proposed to Reverse Global Warming; Penguin Books: London, UK, 2017. [Google Scholar]
  12. Jacobson, M.Z.; Delucchi, M.A.; Bauer, Z.A.F. 100% Clean and Renewable Wind, Water, and Sunlight All-Sector Energy Roadmaps for 139 Countries of the World. Joule 2017, 1, 108–121. [Google Scholar] [CrossRef] [Green Version]
  13. Larson, E.; Greig, C.; Jenkins, J.; Mayfield, A.; Pascale, C.; Zhang, J.; Drossman, R.; Williams, S.; Pacala, R.; Socolow, E.J.; et al. Net-Zero America: Potential Pathways, Infrastructure, and Impacts; Interim Report; Princeton University: Princeton, NJ, USA, 2020. [Google Scholar]
  14. Vartiainen, E.; Breyer, C.; Moser, D.; Medina, E.R.; Busto, C.; Masson, G.; Bosch, E.; Jäger-Waldau, A. True Cost of Solar Hydrogen. Sol. RRL 2021, 5, 2100487. [Google Scholar] [CrossRef]
  15. Golub, A.; Lugovoy, O.; Potashnikov, V. Quantifying barriers to decarbonization of the Russian economy: Real options analysis of investment risks in low-carbon technologies. Clim. Policy 2019, 19, 716–724. [Google Scholar] [CrossRef]
  16. Laitner, J.; Lugovoy, O.; Potashnikov, V. Cost and Benefits of Deep Decarbonization in Russia. Econ. Policy 2020, 15, 86–105. [Google Scholar] [CrossRef]
  17. Safonov, G.; Potashnikov, V.; Lugovoy, O.; Safonov, M.; Dorina, A.; Bolotov, A. The low carbon development options for Russia. Clim. Chang. 2020, 162, 1929–1945. [Google Scholar] [CrossRef]
  18. Lugovoy, O.; Gao, S. MERRA-2 Subset for Evaluation of Renewables with Merra2ools R-Package: 1980–2020 Hourly, 0.5° lat × 0.625° lon Global Grid. 2021. Available online: https://datadryad.org/stash/our_platform (accessed on 8 January 2022).
  19. Vartiainen, E.; Masson, G.; Breyer, C.; Moser, D.; Medina, E.R. Medina: Impact of weighted average cost of capital, capital expenditure, and other parameters on future utility-scale PV levelised cost of electricity; Special Issue: EU PVSEC. Prog. Photovolt. Res. Appl. 2020, 28, 439–453. [Google Scholar] [CrossRef] [Green Version]
  20. IRENA. Renewable Power Generation Costs in 2020; International Renewable Energy Agency: Abu Dhabi, United Arab Emirates, 2021; ISBN 978-92-9260-348-9. [Google Scholar]
  21. Kurtz, J.M.; Cader, T.; Ma, Z.; Saur, G.; Clark, P.L.; Mount, R.L.; Hammond, S.W. Sustainability, Feasibility, and Economics of a Fuel Cell-Powered Data Center. In Proceedings of the 2019 TechConnect World Innovation Conference, Boston, MA, USA, 17–19 June 2019; Available online: https://www.nrel.gov/docs/fy20osti/73604.pdf (accessed on 8 January 2022).
  22. Bistline, J.E. The importance of temporal resolution in modeling deep decarbonization of the electric power sector. Environ. Res. Lett. 2021, 16, 084005. [Google Scholar] [CrossRef]
  23. Lugovoy, O.; Potashnikov, V. EnergyRt: Energy Systems Modeling Toolbox in R. 2021. Available online: https://energyrt.org/. (accessed on 15 December 2021).
  24. Henry, C.L.; Eshraghi, H.; Lugovoy, O.; Waite, M.B.; DeCarolis, J.F.; Farnham, D.J.; Ruggles, T.H.; Peer, R.A.M.; Wu, Y.; de Queiroz, A.; et al. Promoting reproducibility and increased collaboration in electric sector capacity expansion models with community benchmarking and intercomparison efforts. Appl. Energy 2021, 304, 117745. [Google Scholar] [CrossRef]
  25. IRENA. Hydrogen from Renewable Power Technology Outlook for the Energy Transition. 2018. Available online: https://www.irena.org/-/media/files/irena/agency/publication/2018/sep/irena_hydrogen_from_renewable_power_2018.pdf (accessed on 9 October 2021).
  26. IMF. World Economic Outlook. Available online: https://www.imf.org/en/Publications/WEO/Issues/2021/07/27/world-economic-outlook-update-july-2021 (accessed on 10 October 2021).
  27. NREL. Land Use by System Technology. Available online: https://www.nrel.gov/analysis/tech-size.html (accessed on 10 January 2022).
  28. Peszko, G.; Van Der Mensbrugghe, D.; Golub, A.; Ward, J.; Marijs, C.; Schopp, A.; Rogers, J.; Midgley, A. Diversification and Cooperation in a Decarbonizing World: Climate Strategies for Fossil Fuel–Dependent Countries; World Bank Publications: Washington, DC, USA, 2020. [Google Scholar]
  29. Canadian Energy Research Institute. A Comprehensive Guide to Electricity Generation Options in Canada; Canadian Energy Research Institute: Calgary, AB, Canada, 2018; ISBN 1-927037-53-9. [Google Scholar]
  30. Carbon Disclosure Project. Available online: https://www.cdp.net/en/climate (accessed on 22 July 2021).
  31. IEA. Net Zero by 2050; IEA: Paris, France, 2020; Available online: https://www.iea.org/reports/net-zero-by-2050 (accessed on 6 July 2021).
  32. Rifkin, J. America 3.0. The Resilient Society: A Smart Third Industrial Revolution Infrastructure and The Recovery of The American Economy; TIR Consulting Group: Bethesda, MD, USA, 2021; Available online: https://www.rewiringamerica.org/policy/jobs-report (accessed on 3 October 2021).
  33. Lebot, B.; Weiland, M. Policies and Programs Critical for Greater Energy Efficiency. Econ. Policy 2020, 15, 148–167. [Google Scholar] [CrossRef]
  34. IEA. Hydrogen; IEA: Paris, France, 2020; Available online: https://www.iea.org/reports/hydrogen (accessed on 2 October 2021).
  35. IEA. The Future of Hydrogen: Report prepared by the IEA for the G20, Japan. In Seizing Today’s Opportunities; IEA: Paris, France, 2019. [Google Scholar]
  36. IRENA. Coalition for Action, Decarbonising End-Use Sectors: Practical Insights on Green Hydrogen; International Renewable Energy Agency: Abu Dhabi, United Arab Emirates, 2021; ISBN 978-92-9260-346-5. [Google Scholar]
  37. IRENA. World energy transitions outlook: 1.5 °C pathway; International Renewable Energy Agency: Abu Dhabi, United Arab Emirates, 2021. [Google Scholar]
  38. IRENA. Green Hydrogen Cost Reduction: Scaling Up Electrolysers to Meet the 1.5 °C Climate Goal; International Renewable Energy Agency: Abu Dhabi, United Arab Emirates, 2020. [Google Scholar]
  39. Available online: https://cleantechnica.com/2021/12/11/solar-ammonia-in-a-climate-crisis-electrolysis-is-no-barrier-to-low-cost-renewable-ammonia/ (accessed on 9 December 2021).
  40. Hydrogen Use in EU Decarbonization Scenarios. Available online: https://ec.europa.eu/jrc/en/science-update/hydrogen-use-eu-decarbonisation-scenarios (accessed on 31 December 2021).
  41. Mitrova, T.; Melnikov, Y.; Chugunov, D. The Hydrogen Economy—A Path towards Low Carbon Development; SKOLKOVO Energy Centre, Moscow School of Management SKOLKOVO: Moscow, Russia, 2021. [Google Scholar]
  42. Reuters. Available online: https://www.reuters.com/business/energy/enel-eyes-potential-green-hydrogen-project-russia-2021-06-07/ (accessed on 10 June 2021).
  43. Available online: https://www.germanwatch.org/en/17961 (accessed on 9 December 2021).
  44. World Bank. The Changing Wealth of Nations 2021: Managing Assets for the Future; World Bank: Washington, DC, USA, 2021. [Google Scholar]
  45. Edwards, R. The Net Zero Transition and Offsetting of Carbon Intensity in Retail Investment Portfolios. In Forest Trends: Public-Private Finance Initiative; Forest Trends: Washington, DC, USA, 2021. [Google Scholar]
  46. European Commission. Proposal for a Regulation of the European Parliament and of the Council Establishing a Carbon Border Adjustment Mechanism; European Commission: Brussels, Belgium, 2021. [Google Scholar]
  47. Makarov, I.; Besley, D.; Hasan, D.; Boratynski, J.; Chepeliev, M.; Golub, E.; Nemova, V.; Stepanov, I. Russia and Global Green Transition: Risks and Opportunities; World Bank: Washington, DC, USA, 2021. [Google Scholar]
  48. Brody, M.; Golub, A.; Potashnikov, V. The Effects of Increasing Population Granularity in PM2.5 Population-weighted Exposure and Mortality Risk Assessment. Environ. Health Perspect. 2021, 129, 127703. [Google Scholar] [CrossRef] [PubMed]
Figure 1. Supply curve of solar and wind electricity compared to 10 times Russia’s final energy consumption (FEC).
Energies 15 00683 g001
Figure 2. (a) Feasibility analysis of the 72 possible alternatives based on the critical parameters. (b) Feasibility analysis of the 72 possible alternatives based on the critical parameters based on the low-cost scenario.
Energies 15 00683 g002
Figure 3. (a) Average solar and wind capacity, MW per km2. (b) Average solar and wind capacity, MW per km2 under the low-cost scenario.
Energies 15 00683 g003aEnergies 15 00683 g003b
Figure 4. (a) System capacity for storage and distribution. (b) System capacity for storage and distribution under the low-cost scenario.
Energies 15 00683 g004
Figure 5. (a) Average hourly production and consumption of electricity in all 9 RES regions in 2050. (b) Average hourly production and consumption of electricity in 8 of the RES regions in 2050 under the low-cost scenario.
Energies 15 00683 g005aEnergies 15 00683 g005b
Figure 6. (a) Total electricity generation with separate generation for hydrogen export production. (b) Total Electricity Generation with separate generation for hydrogen export production under the low-cost scenario.
Energies 15 00683 g006
Figure 7. (a) Total primary energy supply, excluding non-energy uses. Green hydrogen production is negative because it leaves Russia as exports. (b) Total primary energy supply, excluding non-energy uses. Green hydrogen production is negative because it leaves Russia as exports under the low-cost scenario.
Energies 15 00683 g007aEnergies 15 00683 g007b
Figure 8. (a) Solar and wind annualized investment cost at 3 interest rates. (b) Solar and wind annualized investment cost at 3 interest rates under the low-cost scenario.
Energies 15 00683 g008
Figure 9. Potential energy mix in 2050.
Energies 15 00683 g009
Table 1. Key Technology Assumptions.
TechnologyCostTechnical Parameter
Solar PVInvestment cost—$825/kW, Fixed Operating and Maintenance (O&M)—$9.5/kW/yearSolar availability factor varies between 9–28% depending on location, and is estimated using Sandia’s plane-of-array model and algorithms for solar-array trackers 1 for a fixed tilted, 1-axis tracking system and 2-axis tracking system, with an operational life of 20 years, and is shown in the merra2ools package 2
Wind OnshoreInvestment cost $1050/kW, Fixed O&M—$27/kW/yearWind availability factor can vary between 13% and 57% depending on station location, with precision data calculated using the merra2ools package, with an operational life of 30 years. Wind speeds for 100 m and 150 m were approximated from values at 10 m and 50 m.
Storage$250/MWh investment cost10% loss during charging, operational life of 15 years
500-kV HVDC transmission line$367M per HVDC converter station in one direction, $0.87M per 1 km, for 2.4 GWLosses vary between 2.5% and 7.2% depending upon distance between regions (Losses = 0.6% + 2.9% for every 1000 km).
Hydrogen electrolysis 3Fixed O&M, $18/kW/year, Investment cost of $900/kW/yearEfficiency of 51 kWh/kgH2, availability factor greater than 15%, with an operational life of 20 years
1 Sandia National Laboratories (2021). PV Performance Modeling Collaborative. Sandia National Laboratories https://pvpmc.sandia.gov/ (accessed on 3 July 2021). 2 https://github.com/energyRt/merra2ools (accessed on 2 January 2022), https://datadryad.org/stash/dataset/doi:10.5061/dryad.v41ns1rtt (accessed on 10 January 2022). 3 IRENA 2018. Hydrogen from Renewable Power Technology Outlook for the Energy Transition 2018, (https://www.irena.org/-/media/files/irena/agency/publication/2018/sep/irena_hydrogen_from_renewable_power_2018.pdf (accessed on 22 December 2021).
Table 2. Selected key indicators of economic development in Russia: assumptions by 2050.
Indicator20182050
GDP (bln constant 2018 US$)17444900
Population (mln)146146
Living space, m2/person2645
Fossil fuel exports, EJ250
Hydrogen exports EJ012
Emission, MtCO214630
Freight and Passenger transport demand, index %100200
Steel production, Mt71128
Non-energy fossil fuel demand, EJ4.64.6
Table 3. Parameters for 2050 feasibility analysis and assumptions to achieve minimum costs, leading to 72 alternatives.
ParameterAlternativesDescription
Demand1Total electricity demand is 48 EJ, 70% is critical demand, flexible portion is 30%. Hydrogen demand is 12 EJ
2Total electricity demand is 24 EJ, 70% is critical demand, flexible portion is 30%. Hydrogen demand is 36 EJ
Wind1Wind speed at 150 m height
2Wind speed at 100 m height
3Wind speed at 50 m height
Solar12-axis solar tracking
21-axis solar tracking
3No solar tracking
Storage1Unlimited
2No more than 14 TWh (23–29% of average daily consumption)
Trade1Trade with full connectivity across all regions of RES
2Without isolated regions
Publisher’s Note: MDPI stays neutral with regard to jurisdictional claims in published maps and institutional affiliations.

