
Hosting Capacity Calculation Deploying a Hybrid Methodology: A Case Study Concerning the Intermittent Nature of Photovoltaic Distributed Generation and the Variable Nature of Energy Consumption in a Medium Voltage Distribution Network


Abstract
:1. Introduction
2. Main Methods for Determining HC
2.1. Deterministic Method
2.2. Stochastic Methods
2.3. Time Series Method
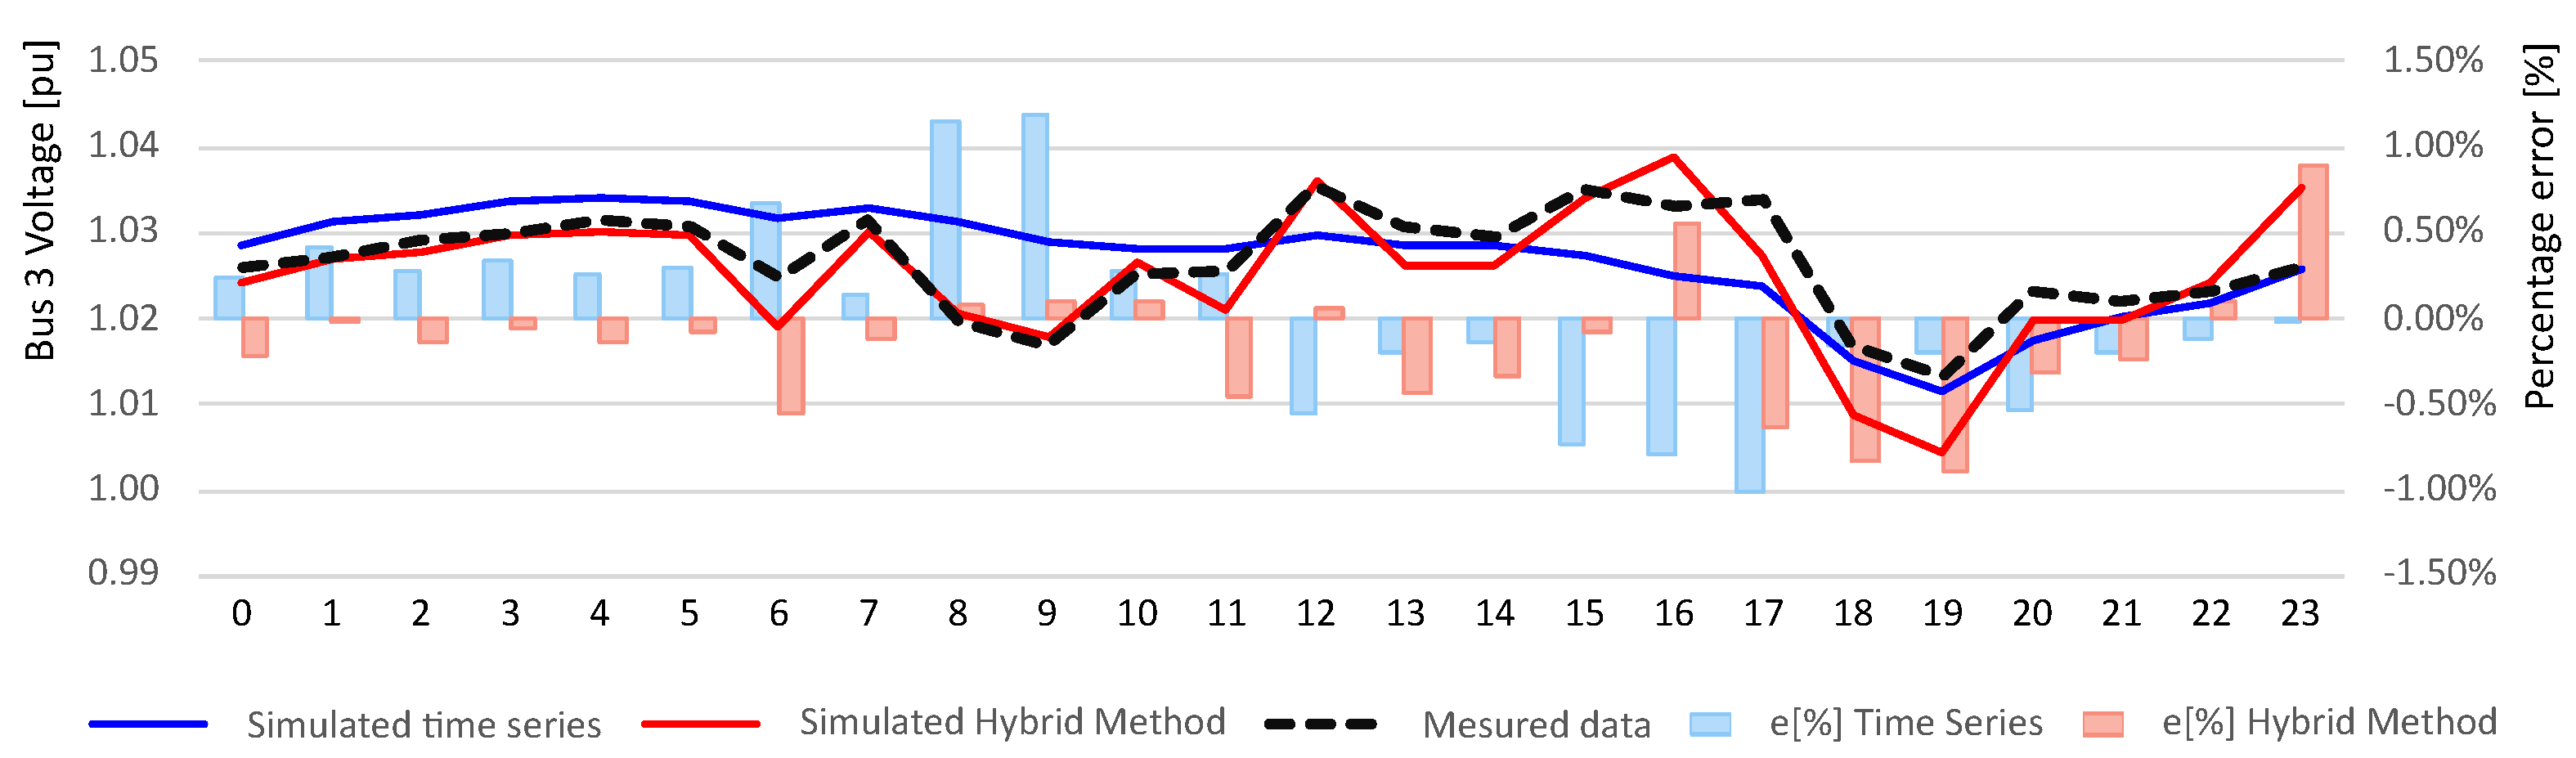
2.4. Proposed Hybrid Method
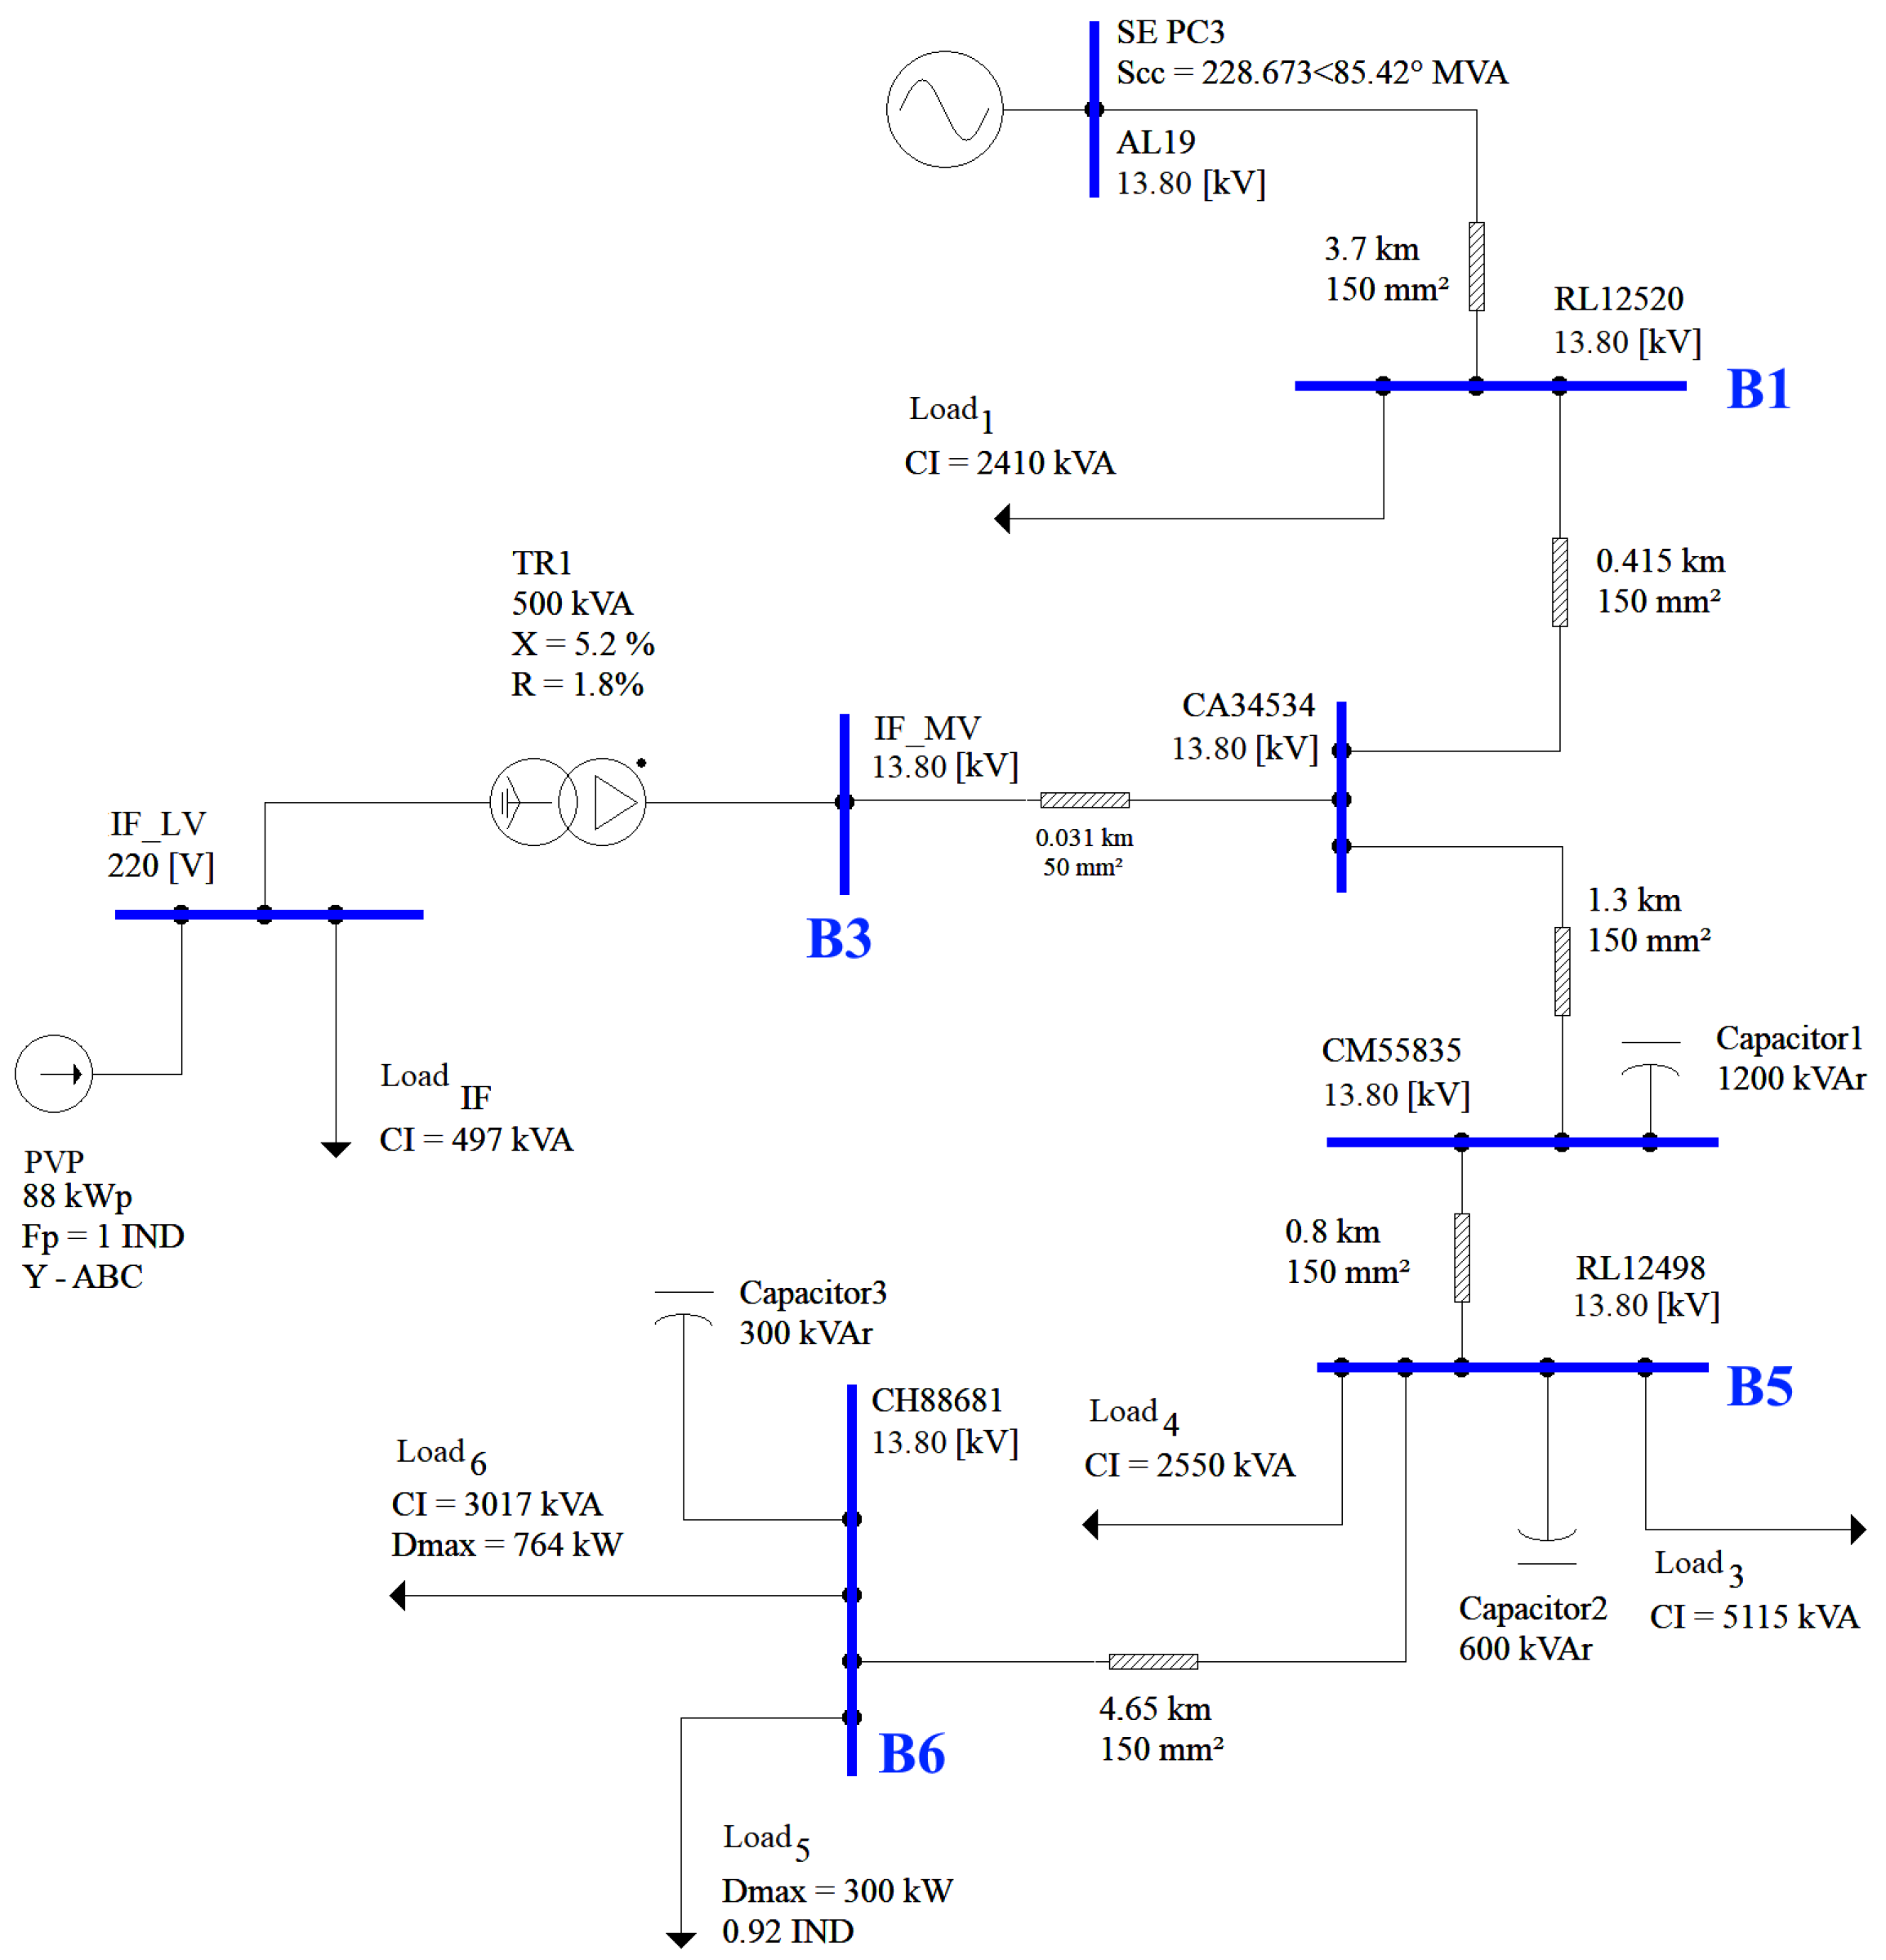
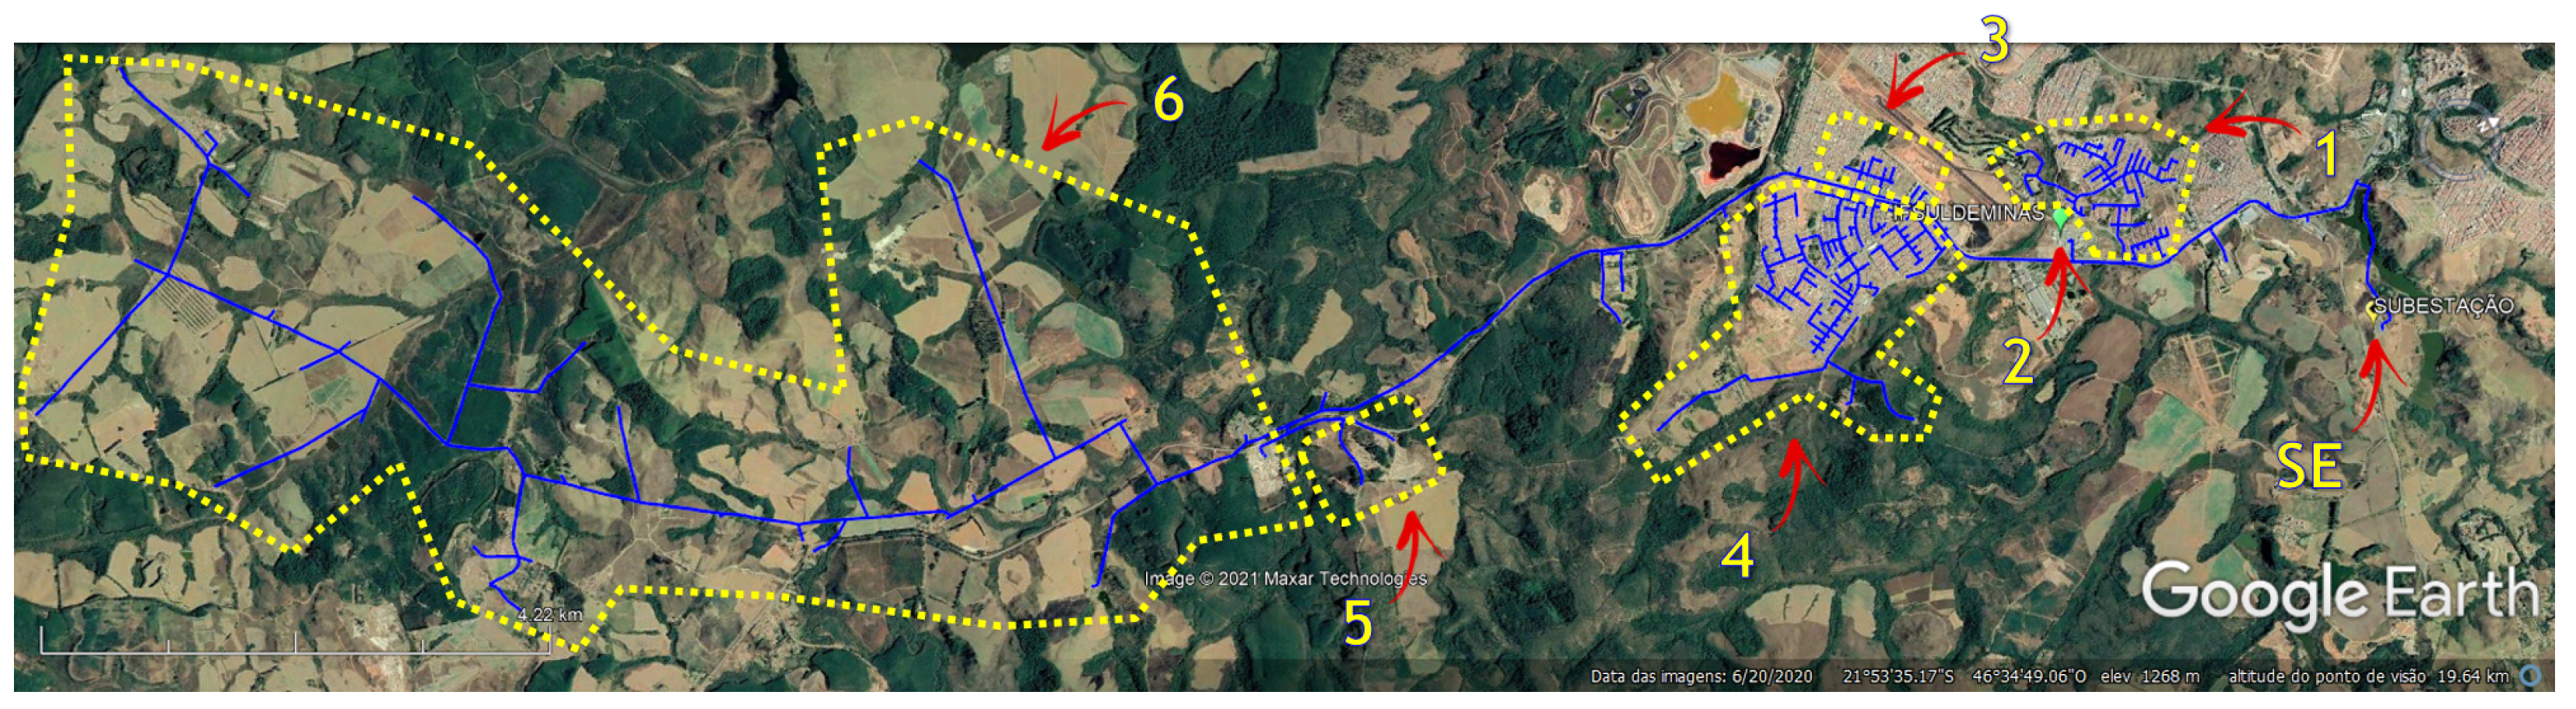
3. Model of the System in Question
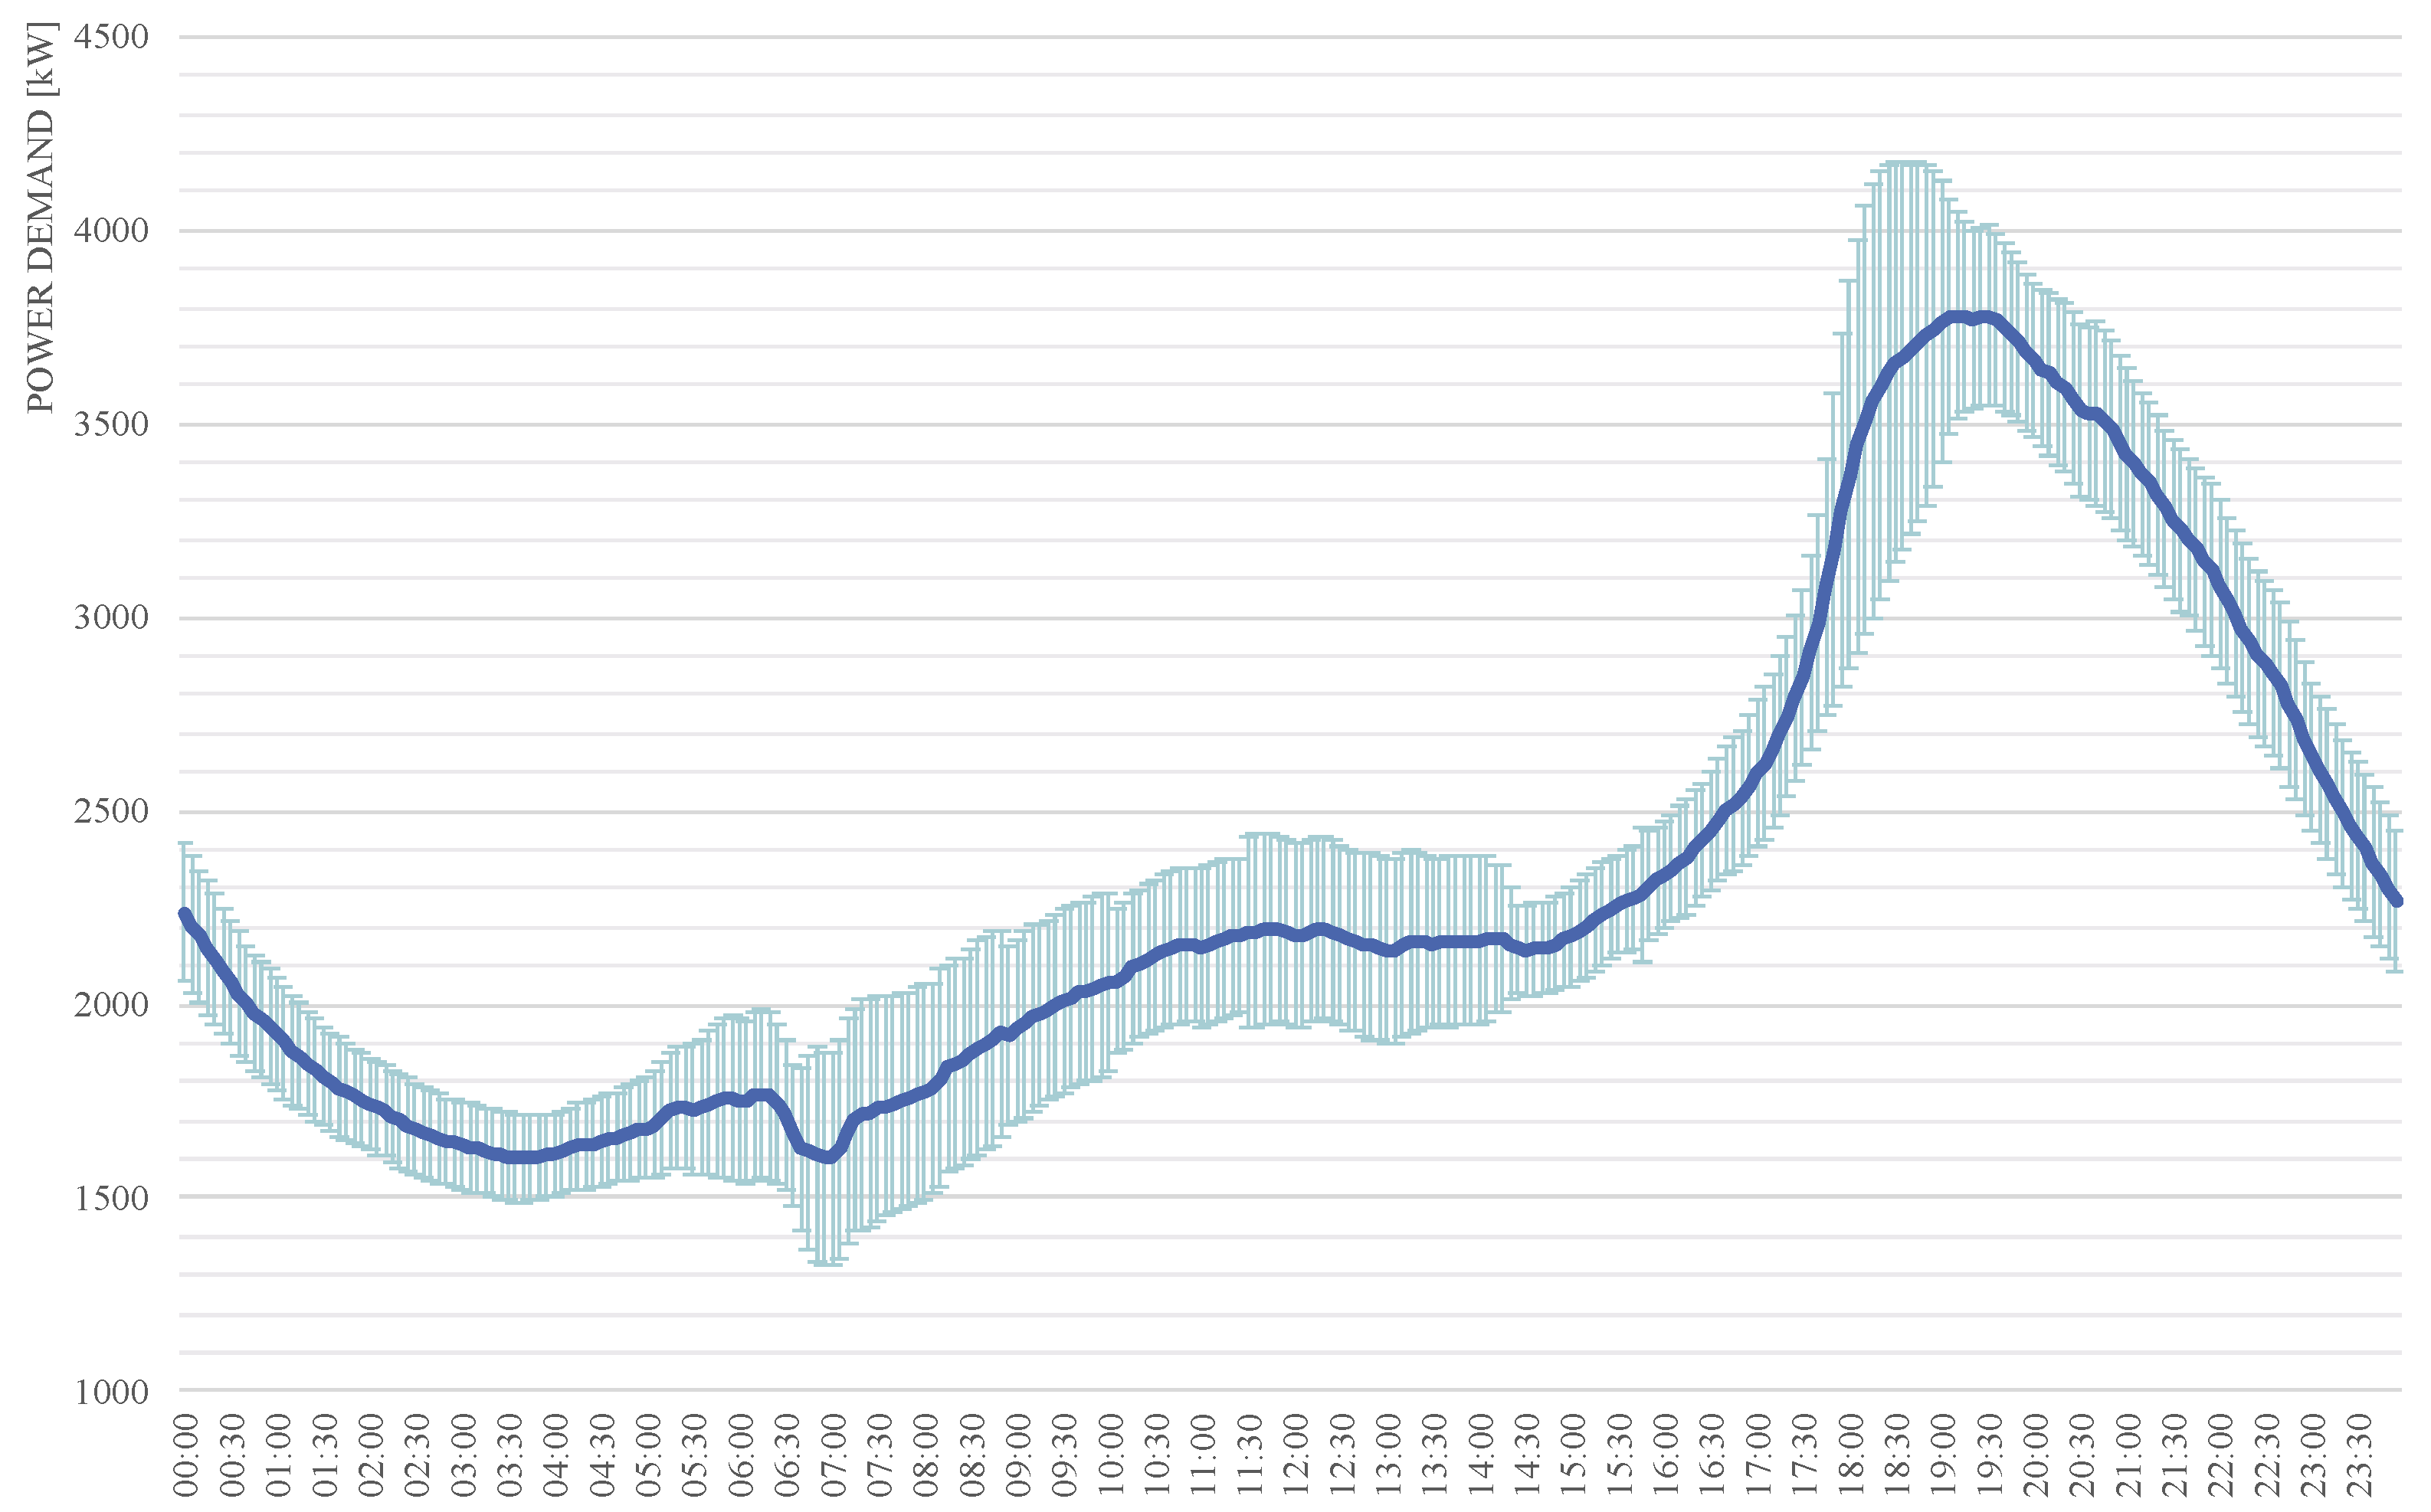
3.1. Linear Loads
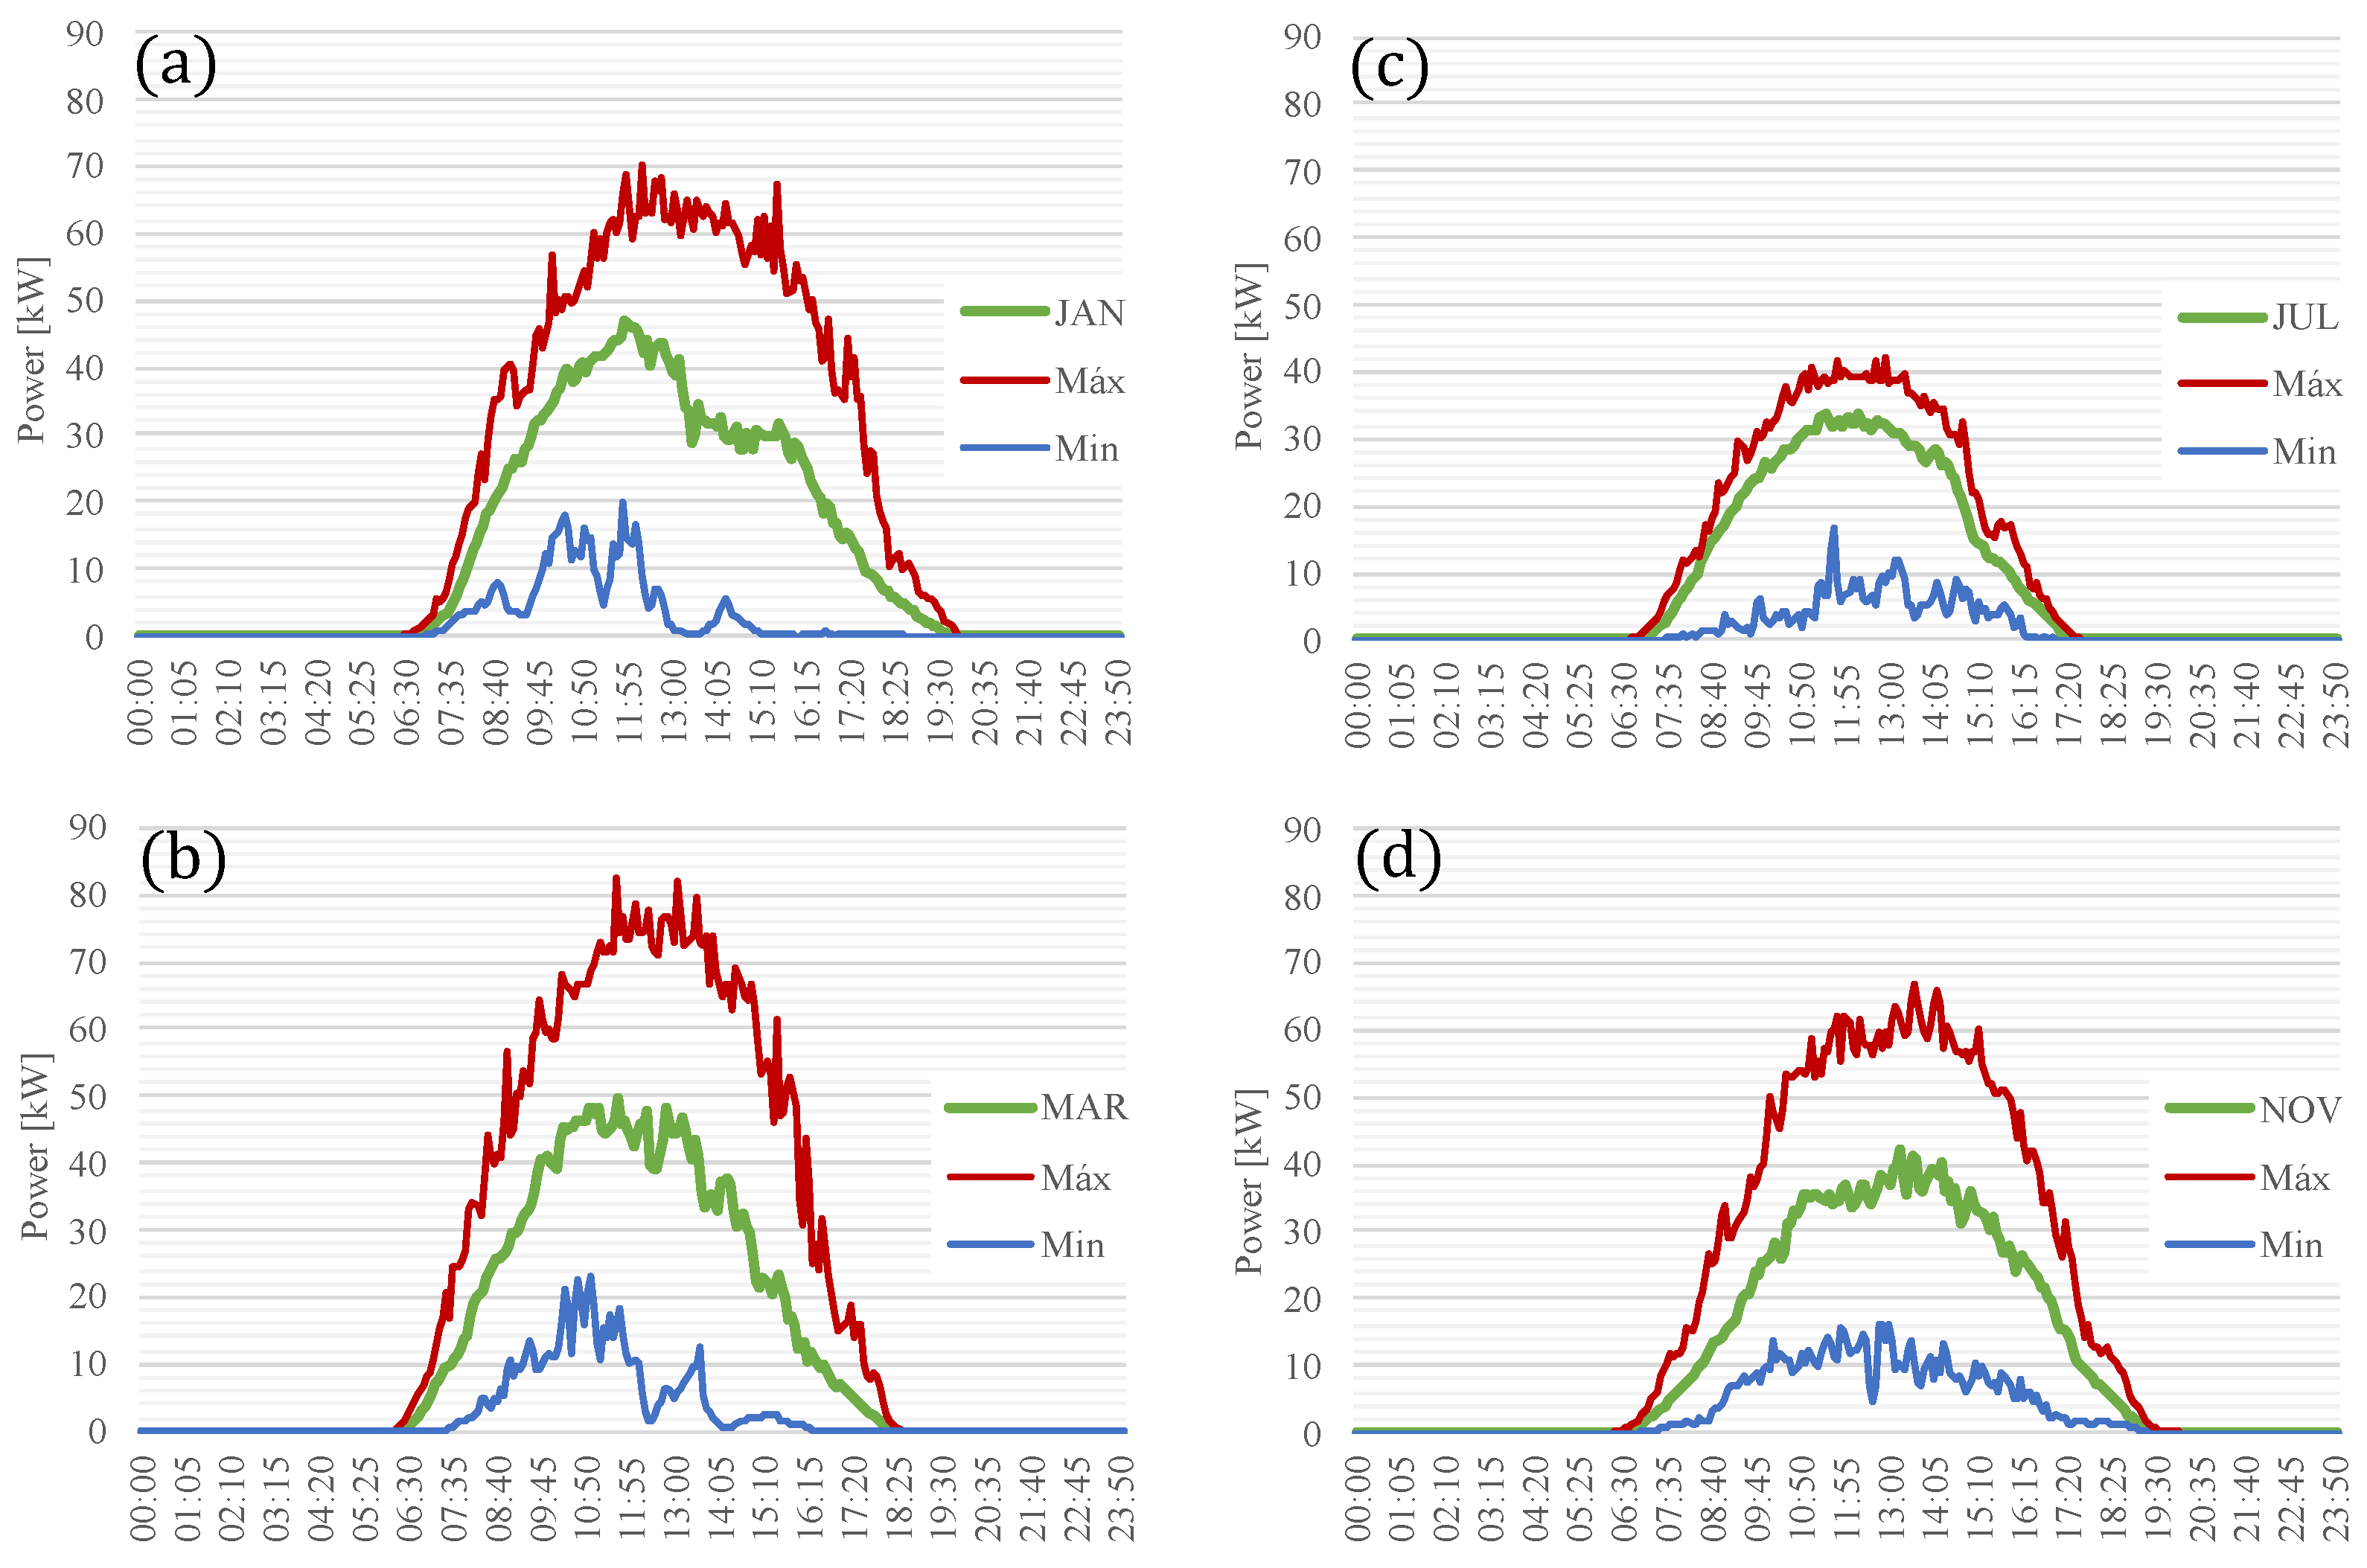
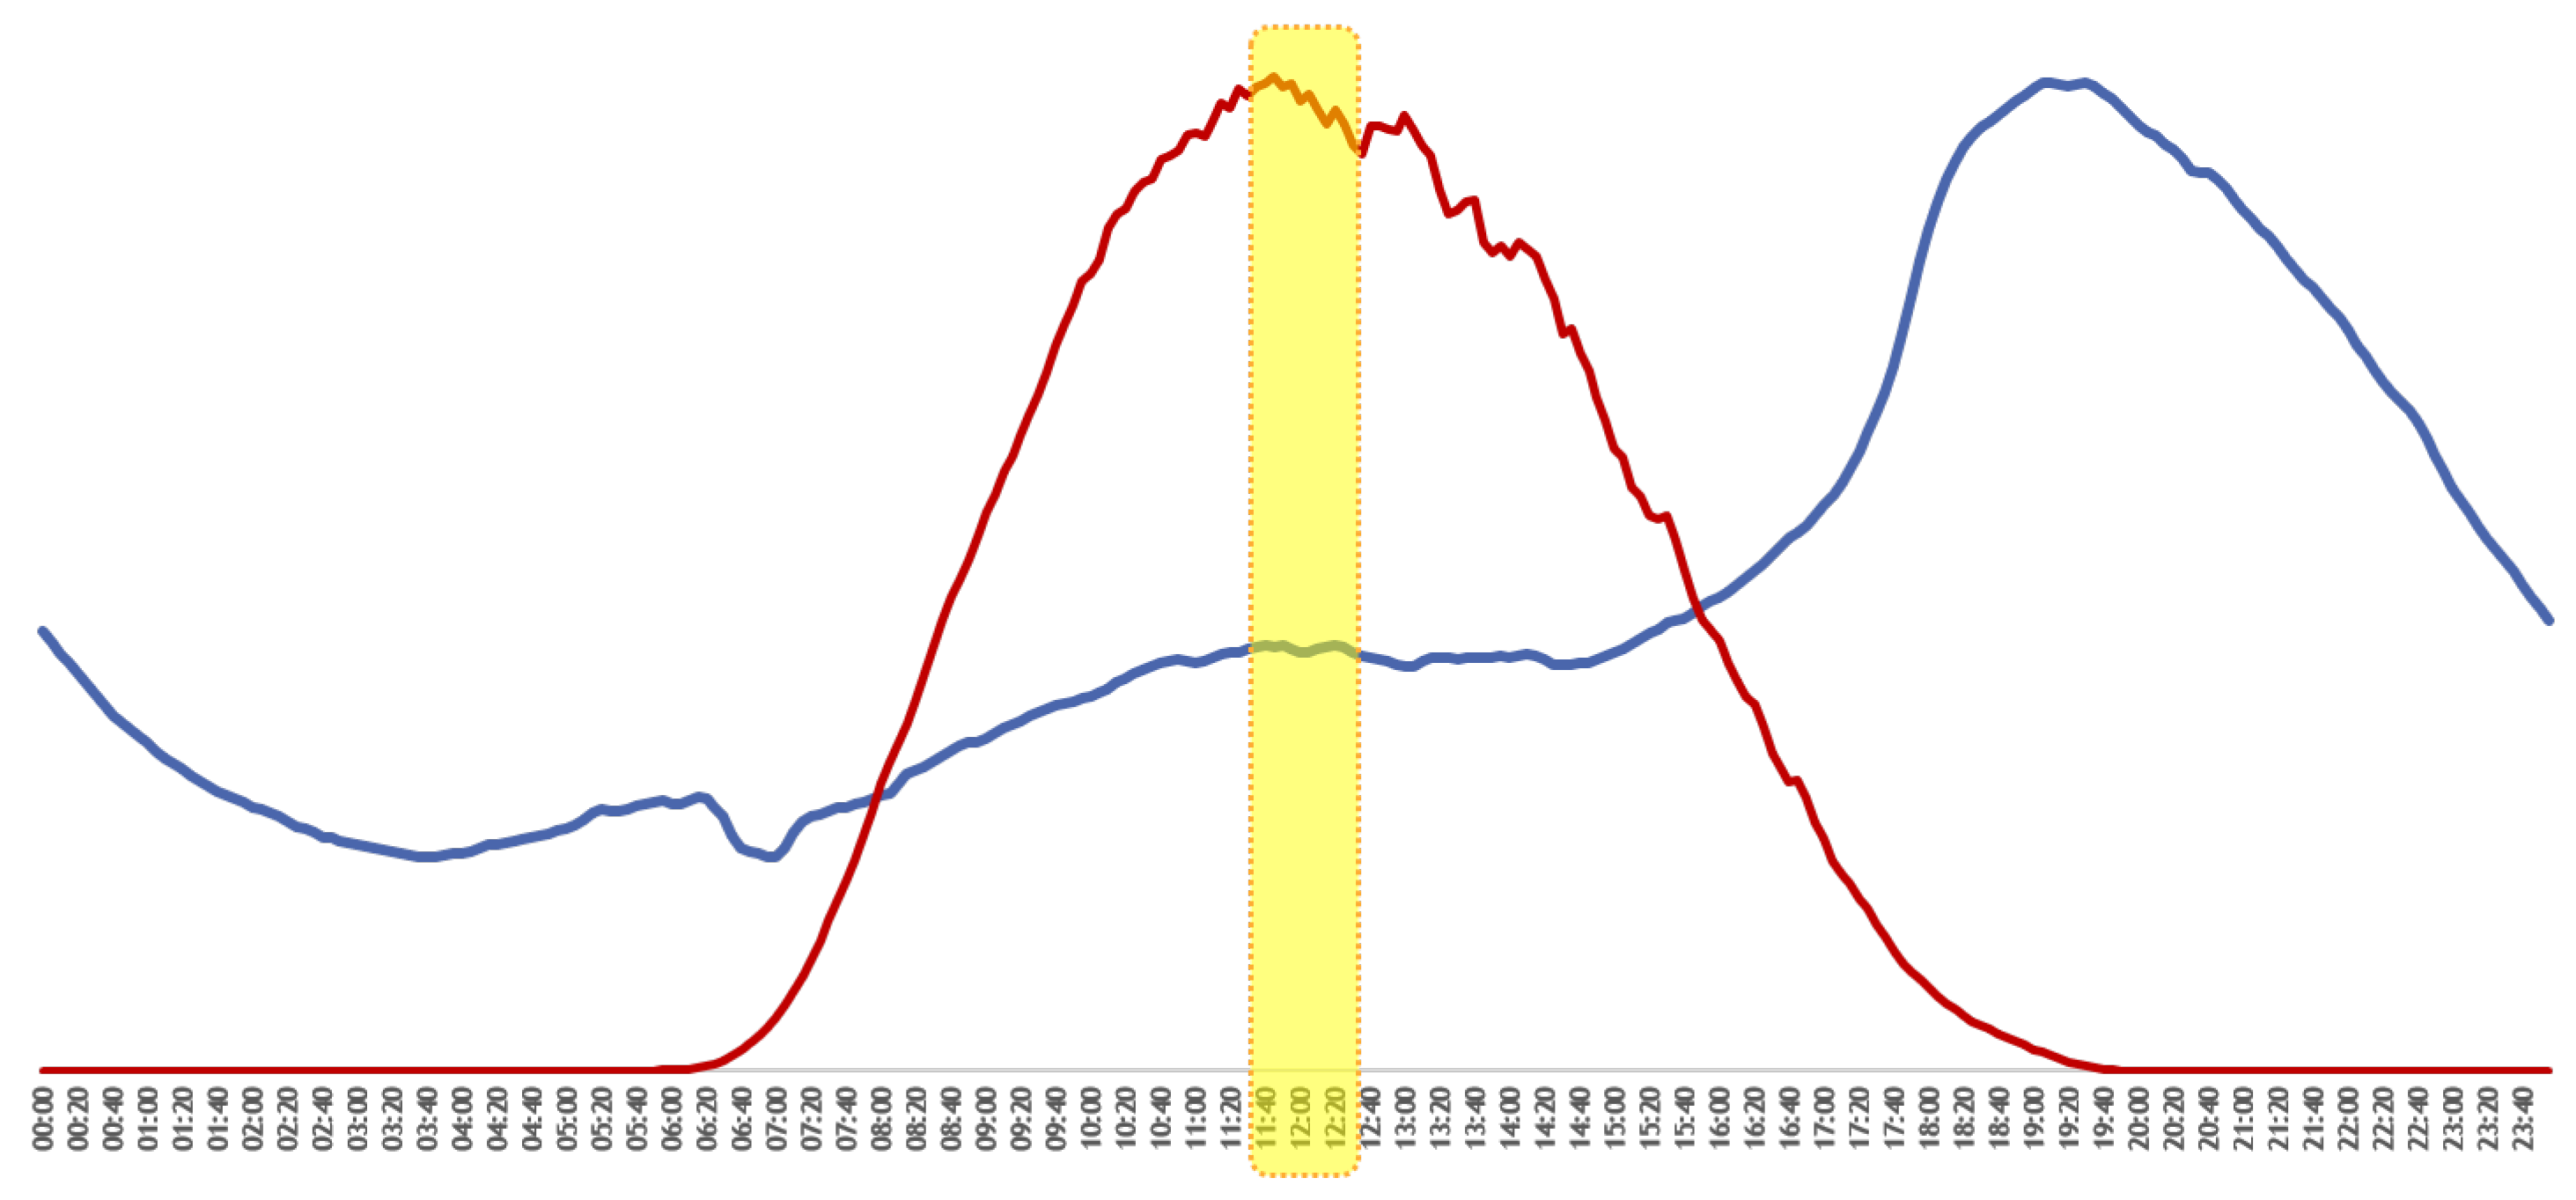
3.2. Photovoltaic Power Plant
3.3. Adjustments and Calibration of the Model
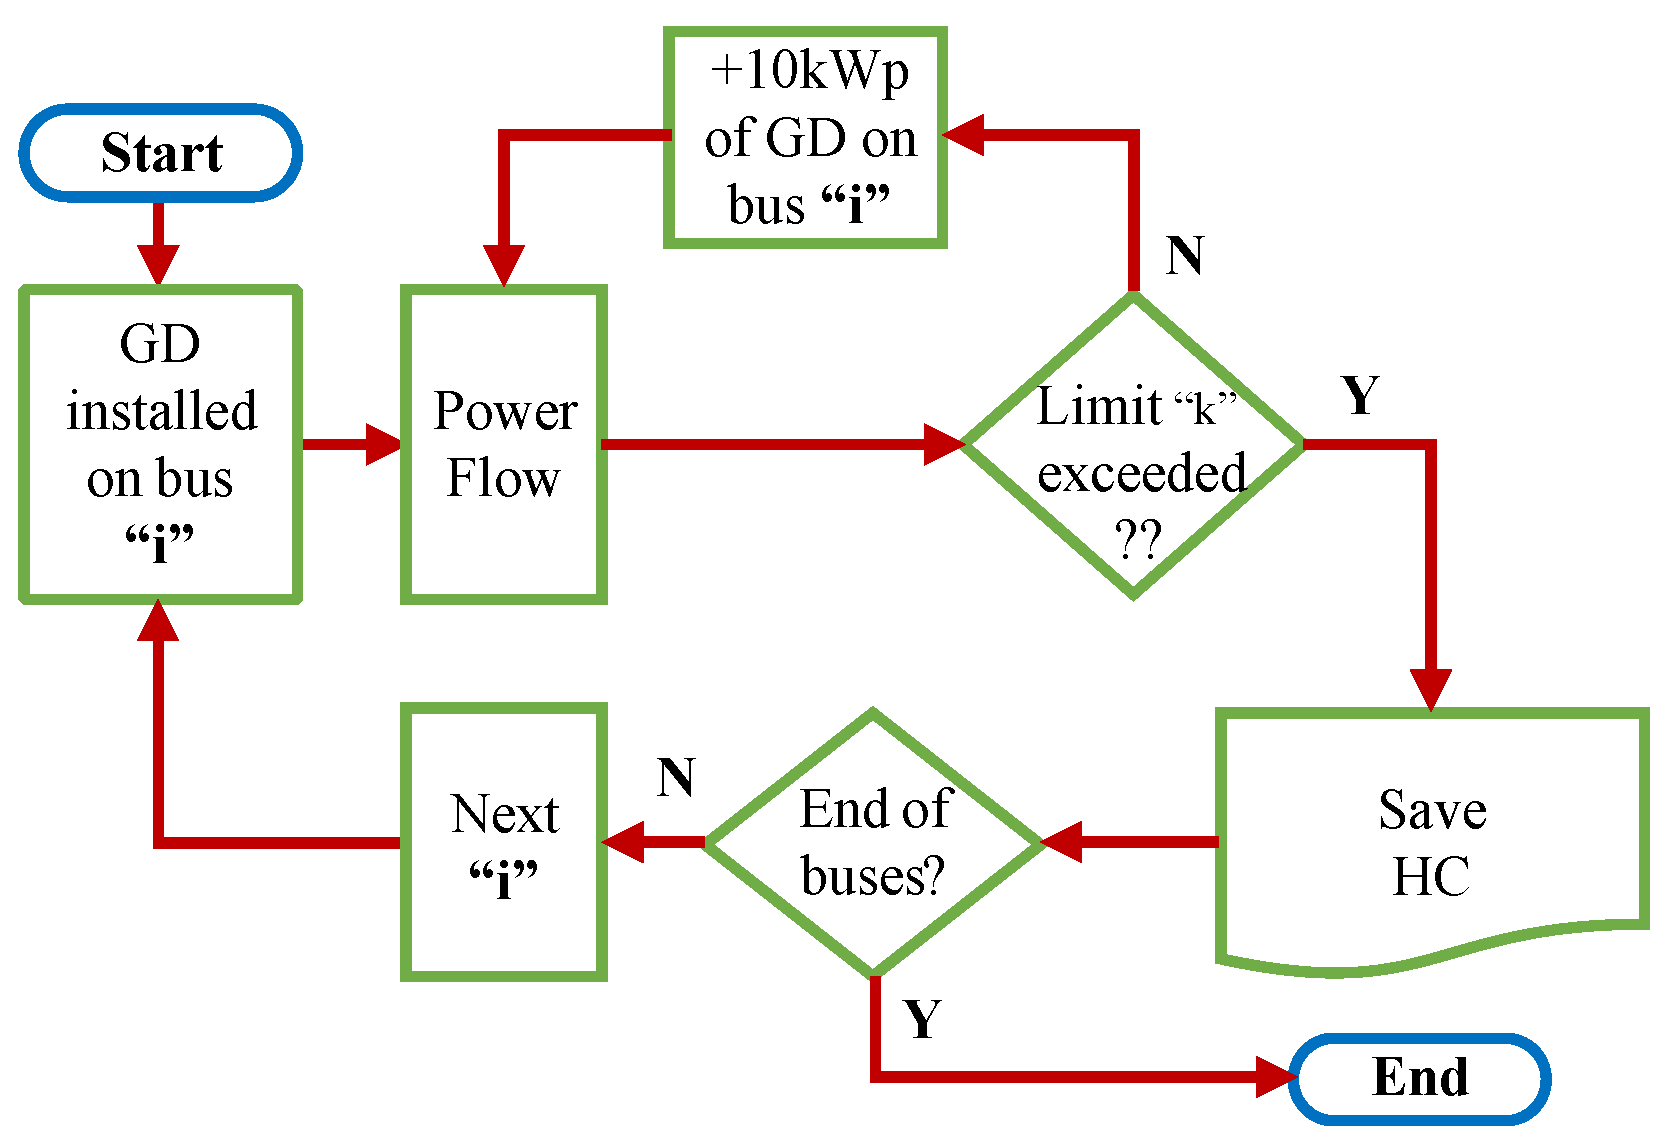
4. The Hybrid Methodology Proposed for Determining HC
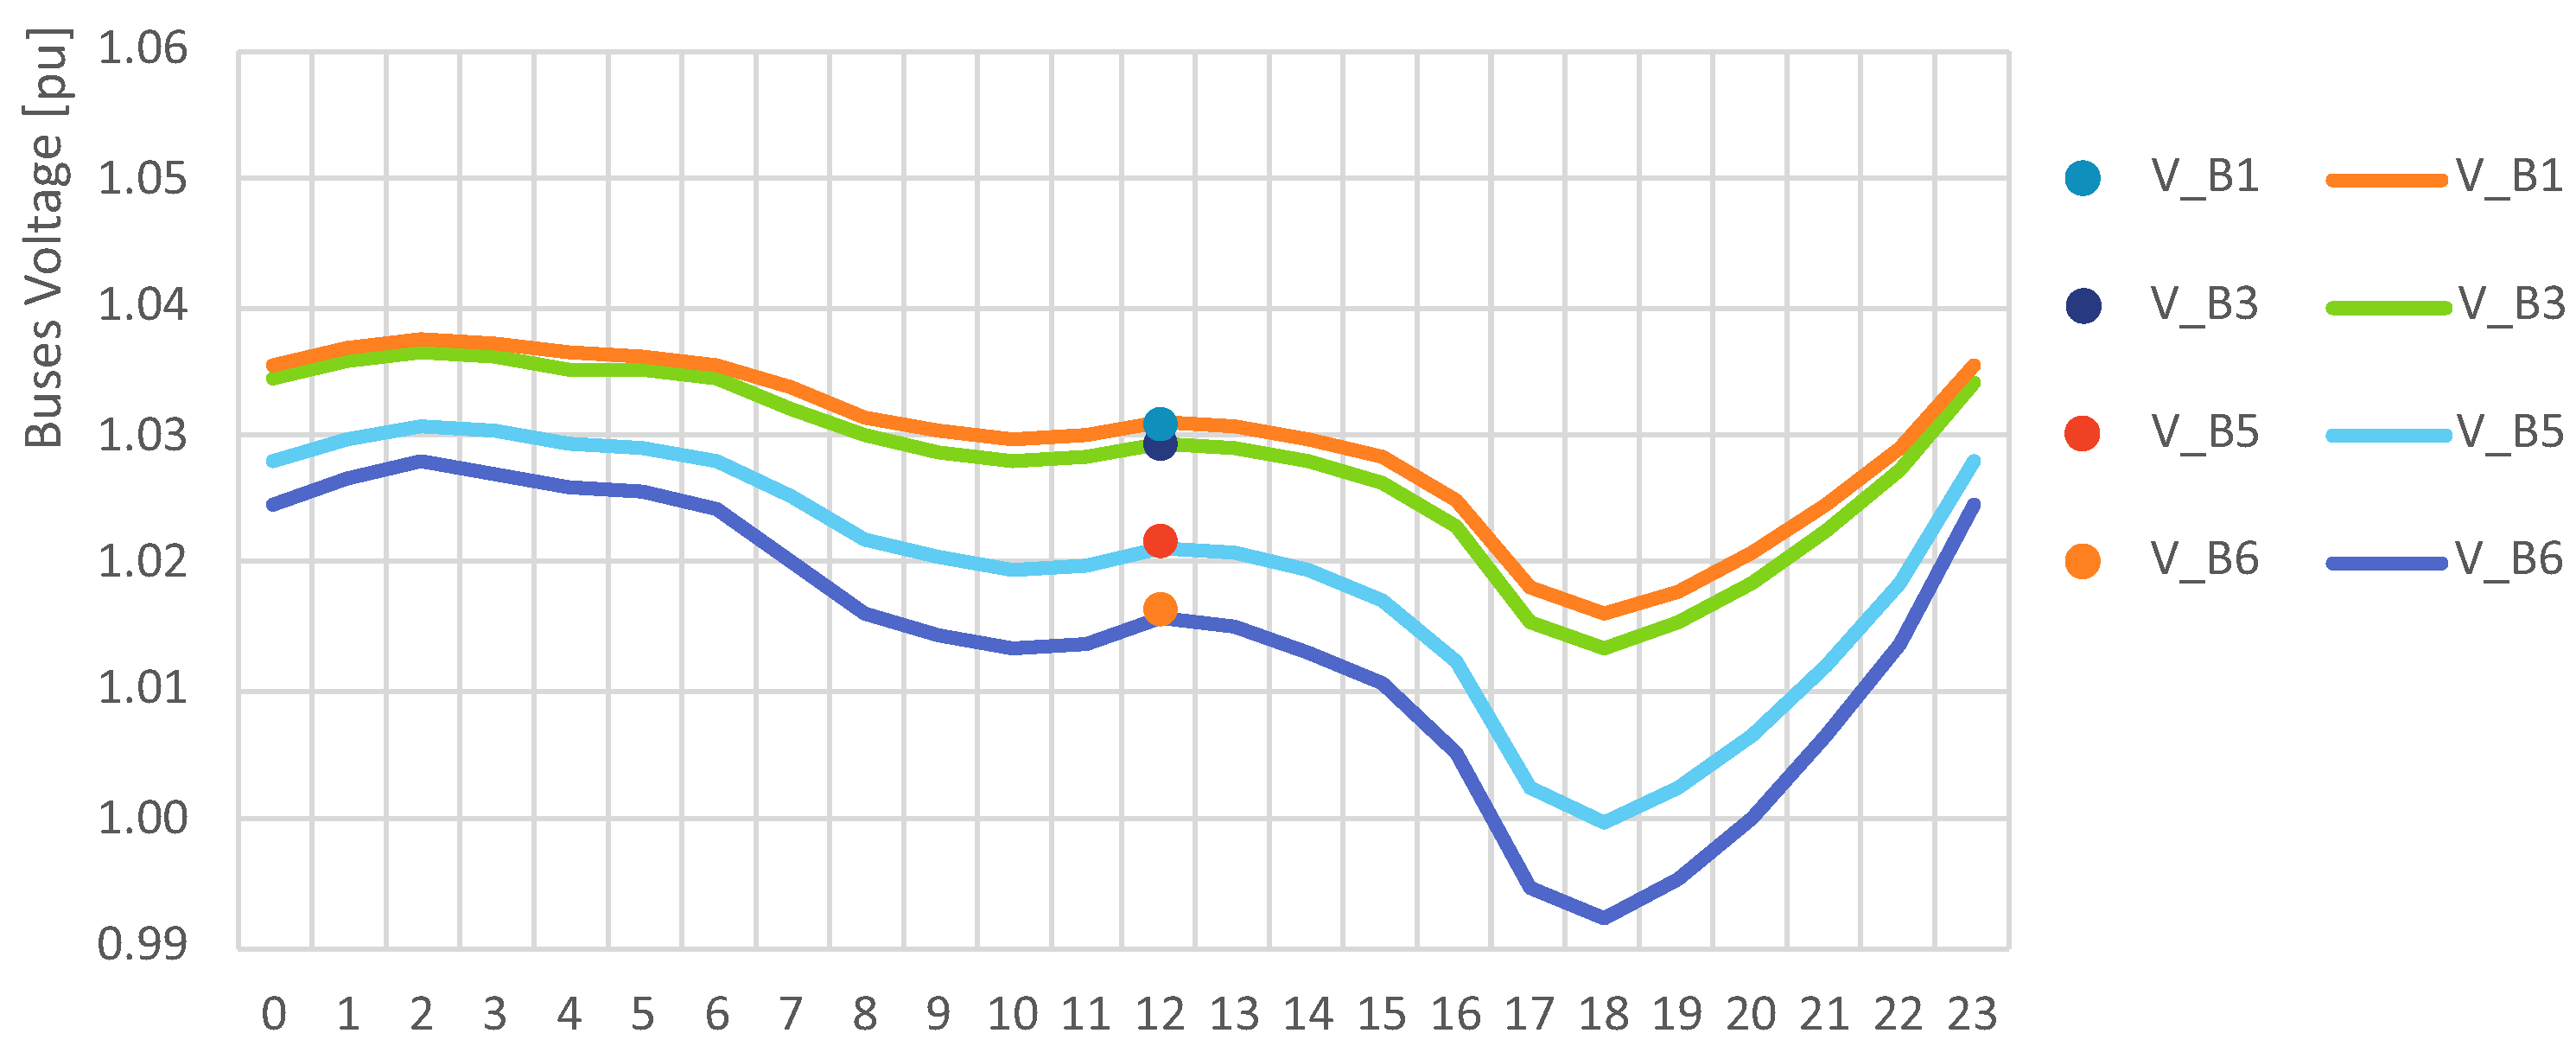
5. Results and Discussion
5.1. Case 00
5.2. Case 01
5.3. Case 02
5.4. Case 03
5.5. Case 04
Author Contributions
Funding
Acknowledgments
Conflicts of Interest
Abbreviations
| ANEEL | Brazilian National Agency of Electrical Energy |
| DG | Distributed Generation (also called Decentralized Generation) |
| HC | Hosting Capacity |
| IFSULDEMINAS | Brazilian Federal Institute of Education, Science and Technology of south of Minas Gerais |
| MG | Brazilian State of Minas Gerais |
| PRODIST | Distribution Procedures from ANEEL |
| PVP | Photovoltaic plant (solar photovoltaic power plant) |
| SE | Electrical substation |
References
- Masson, G.; Kaizuka, I. Trends in Photovoltaic Applications 2019, 2019 ed.; IEA: Paris, France, 2019; p. 100. Available online: www.iea-pvps.org/publications/ (accessed on 27 January 2022).
- EPE. Balanço Energético Nacional 2019—Relatório Síntese Ano Base 2018; Technical Report; EPE: Rio de Janeiro, Brazil, 2019. Available online: www.epe.gov.br/pt/publicacoes-dados-abertos/publicacoes/balanco-energetico-nacional-2019 (accessed on 27 January 2022).
- EPE. Balanço Energético Nacional 2020: Ano base 2019; EPE: Rio de Janeiro, Brazil, 2020; p. 264. Available online: https://www.epe.gov.br/pt/publicacoes-dados-abertos/publicacoes/balanco-energetico-nacional-2020 (accessed on 27 January 2022).
- ABSOLAR. Infográfico da Energia Solar Fotovoltaica no Brasil; Technical Report; ABSOLAR: São Paulo, Brazil, 2021; Available online: www.absolar.org.br/mercado/infografico/ (accessed on 27 January 2022).
- ANEEL/SPE. CHAMADA Nº. 001/2016 PROJETO PRIORITÁRIO DE EFICIÊNCIA ENERGÉTICA E ESTRATÉGICO DE P&D: “EFICIÊNCIA ENERGÉTICA E MINIGERAÇÃO EM INSTITUIÇÕES PÚBLICAS DE EDUCAÇÃO SUPERIOR”; Technical Report; ANEEL: Brasília, Brazil, 2016; Available online: http://bit.ly/38C2CPl (accessed on 27 January 2022).
- Karimi, M.; Mokhlis, H.; Naidu, K.; Uddin, S.; Bakar, A.H. Photovoltaic penetration issues and impacts in distribution network—A review. Renew. Sustain. Energy Rev. 2016, 53, 594–605. [Google Scholar] [CrossRef]
- Chathurangi, D.; Jayatunga, U.; Rathnayake, M.; Wickramasinghe, A.; Agalgaonkar, A.; Perera, S. Potential power quality impacts on LV distribution networks with high penetration levels of solar PV. In Proceedings of the 2018 18th International Conference on Harmonics and Quality of Power (ICHQP), Ljubljana, Slovenia, 13–16 May 2018; pp. 1–6. [Google Scholar] [CrossRef]
- Joint Working Group C4.24/CIRED. Power Quality and EMC Issues with Future Electricity Networks; Technical Report; CIGRÉ: Paris, France, 2018; Available online: www.cired.net/uploads/default/files/final-report-C4.24-CIRED.pdf (accessed on 27 January 2022).
- EPRI. Impact Factors, Methods, and Considerations for Calculating and Applying Hosting Capacity; Technical Report; EPRI: Palo Alto, CA, USA, 2018. [Google Scholar]
- Barin, A.; Felipe Pozzatti, L.; Quadros Machado, R.; Neves Canha, L.; Alberto Farret, F.; da Rosa Abaide, A. Multicriteria Analysis of Impacts of Distributed Generation Sources On Operational Network Characteristics For Distribution System Planning Concerning Steady-State And Transient Operations. Eletrônica de Potência 2009, 14, 75–83. [Google Scholar] [CrossRef]
- Ismael, S.M.; Abdel Aleem, S.H.; Abdelaziz, A.Y.; Zobaa, A.F. State-of-the-art of hosting capacity in modern power systems with distributed generation. Renew. Energy 2019, 130, 1002–1020. [Google Scholar] [CrossRef]
- Mulenga, E.; Bollen, M.H.; Etherden, N. A review of hosting capacity quantification methods for photovoltaics in low-voltage distribution grids. Int. J. Electr. Power Energy Syst. 2020, 115, 105445. [Google Scholar] [CrossRef]
- Koirala, A.; Van Acker, T.; D’hulst, R.; Van Hertem, D. Hosting capacity of photovoltaic systems in low voltage distribution systems: A benchmark of deterministic and stochastic approaches. Renew. Sustain. Energy Rev. 2022, 155, 111899. [Google Scholar] [CrossRef]
- Zain ul Abideen, M.; Ellabban, O.; Al-Fagih, L. A Review of the Tools and Methods for Distribution Networks’ Hosting Capacity Calculation. Energies 2020, 13, 2758. [Google Scholar] [CrossRef]
- Zhang, Y.; Shi, X.; Zhang, H.; Cao, Y.; Terzija, V. Review on deep learning applications in frequency analysis and control of modern power system. Int. J. Electr. Power Energy Syst. 2022, 136, 107744. [Google Scholar] [CrossRef]
- Roberge, V.; Tarbouchi, M.; Okou, F.A. Distribution System Optimization on Graphics Processing Unit. IEEE Trans. Smart Grid 2017, 8, 1689–1699. [Google Scholar] [CrossRef]
- Munikoti, S.; Abujubbeh, M.; Jhala, K.; Natarajan, B. A novel framework for hosting capacity analysis with spatio-temporal probabilistic voltage sensitivity analysis. Int. J. Electr. Power Energy Syst. 2022, 134, 107426. [Google Scholar] [CrossRef]
- Kharrazi, A.; Sreeram, V.; Mishra, Y. Assessment techniques of the impact of grid-tied rooftop photovoltaic generation on the power quality of low voltage distribution network—A review. Renew. Sustain. Energy Rev. 2020, 120, 109643. [Google Scholar] [CrossRef]
- Arshad, A.; Lehtonen, M. A Stochastic Assessment of PV Hosting Capacity Enhancement in Distribution Network Utilizing Voltage Support Techniques. IEEE Access 2019, 7, 46461–46471. [Google Scholar] [CrossRef]
- Arshad, A.; Lehtonen, M. Probabilistic Assessment of Photovoltaic Hosting Capacity in Finnish LV Networks. In Proceedings of the 2019 IEEE PES Innovative Smart Grid Technologies Europe (ISGT-Europe), Bucharest, Romania, 29 September–2 October 2019; pp. 1–5. [Google Scholar] [CrossRef]
- Von Zuben, F.J. Fundamentos para Processos Estocásticos; Technical Report; UNICAMP: Campinas, Brazil, 2003. [Google Scholar]
- Gontijo, R.M.P. Alocação de Geradores Distribuídos Orientada por Fluxo de Potência Probabilístico. Bachelor’s Thesis, UFOP, João Monlevade, Brazil, 2017. Available online: http://www.monografias.ufop.br/handle/35400000/860 (accessed on 27 January 2022).
- de Paula Silva, S.F. SSEP: Simulador de Sistemas Elétricos de Potência, 4.0.0.25 ed.; Quality Engenharia & Sistemas: Uberlândia, Brazil, 2016. [Google Scholar]
- Dugan, R.C.; Montenegro, D.; Ballanti, A. Reference Guide: The Open Distribution System Simulator (OpenDSS); EPRI: Palo Alto, CA, USA, 2020; pp. 1–218. [Google Scholar]
- Kagan, N.; Robba, E.J.; Schmid, H.P. Estimação de indicadores de qualidade da energia elétrica, 1st ed.; Blucher: São Paulo, Brazil, 2009. [Google Scholar]
- Jardini, J.; Tahan, C.; Gouvea, M.; Ahn, S.; Figueiredo, F. Curvas de Carga Típicas e Agregação dos Consumidores Residenciais, Comerciais e Industriais de Baixa Tensão. In 4to Encontro Luso-Afro-Brasileiro de Planjamento e Exploraçao de Redes de Energia-ELAB; ELAB: Rio de Janeiro, Brazil, 1999; pp. 391–397. [Google Scholar]
- Marques, M.D.S. Metodologia para Modelagem de Curvas Típicas de Demanda Elétrica Utilizando Redes Neurais Artificiais Considerando Variáveis Climáticas. Dissertação Thesis, Universidade Federal do Pampa, Bagé, Brazil, 2014. [Google Scholar]
- Paula, G.M.d.F. Curvas típicas de carga para o planejamento operacional do sistema de distribuição. Ph.D. Thesis, USP, São Paulo, Brazil, 2006. [Google Scholar]
- Sauthier, L.F.; Diefenthäler, A.T.; Sausen, P.S.; Sausen, A.T.Z.R. MODELAGEM MATEMÁTICA DE MÓDULOS FOTOVOLTAICOS EMPREGADOS EM AMBIENTES DE SIMULAÇÃO DE GERAÇÃO DISTRIBUÍDA. In 11th SEMINAR ON POWER ELECTRONICS AND CONTROL; UFSM: Santa Maria, Brazil, 2018; p. 6. Available online: www.ufsm.br/app/uploads/sites/553/2020/07/92898-field_submission_abstract_file2.pdf (accessed on 27 January 2022).
- ANEEL. Módulo 8 – Qualidade da Energia Elétrica. In Procedimentos de Distribuição de Energia Elétrica no Sistema Elétrico Nacional—PRODIST, 10th ed.; Agência Nacional de Energia Elétrica: Brasilia, Brazil, 2018; Chapter 8; p. 88. Available online: https://www.aneel.gov.br/documents/656827/14866914/Módulo_8-Revisão_10/2f7cb862-e9d7-3295-729a-b619ac6baab9 (accessed on 27 January 2022).
- Liu, D.; Wang, C.; Tang, F.; Zhou, Y. Probabilistic assessment of hybrid wind-PV hosting capacity in distribution systems. Sustainability 2020, 12, 2183. [Google Scholar] [CrossRef] [Green Version]
- ANEEL. Resolução Normativa nº 482 de 17 de Abril de 2012; ANEEL: Brasilia, Brazil, 2012; p. 1. Available online: http://www2.aneel.gov.br/cedoc/atren2012482.pdf (accessed on 27 January 2022).
- Kordkheili, R.A.; Bak-Jensen, B.; R-Pillai, J.; Mahat, P. Determining maximum photovoltaic penetration in a distribution grid considering grid operation limits. In Proceedings of the 2014 IEEE PES General Meeting | Conference & Exposition, National Harbor, MD, USA, 27–31 July 2014; pp. 1–5. [Google Scholar] [CrossRef]
- Roberge, V. Distribution Feeder Reconfiguration (DFR) Test Cases. 2021. Available online: https://roberge.segfaults.net/joomla/index.php/dfr (accessed on 27 January 2022).


| Characteristic | Ref. | Deterministic | Stochastic | Time Series | Proposed Hybrid Method |
|---|---|---|---|---|---|
| Obtainment of input parameters | [9,10] | Easy | Complex | Moderate | Moderate |
| Implementing the study | [9,10,11,12] | Easy | Complex | Complex | Moderate |
| Supports the processing of uncertainties | [11,12,13,14] | No | Yes | Yes | Yes |
| Simulated Scenario | [11,12,13,14] | Worst possible case | Realistic scenario (millions of simulations) | Realistic scenario (based on measurements) | Realistic scenario (based on measurements) |
| Maintains temporal relationship between quantities | [11,12,13,17] | Yes | No | Yes | Yes |
| Processing speed | [11,12,13,14,16] | Fast | Moderate | Slow | Moderate |
| Simulation time | [12,14,16] | Fast | Slow | Slow | Moderate |
| Computational effort (processing) | [11,12,13,14,16] | Low | High | High | Moderate |
| Scalability of the methodology | [11,12,13,14,16] | Easy | Complex | Complex | Moderate |
| Interpretation of results | [11,12] | Easy | Complex | Easy | Easy |
| 10.3% | 1.1% | 33.7% | 26.9% | 10.1% | 17.9% |
| Input Data | Measured Data | Simulated Data | |||||||||
|---|---|---|---|---|---|---|---|---|---|---|---|
| Case | Day | Hour | PFV [kW] | DIF [kW] | DAL19 [kW] | VSEPC3 [pu] | VSEIF [pu] | VSEPC3 [pu] | Error [%] | VSEIF [pu] | Error [%] |
| 01 | 16.01 | 12 h 45 | 54.43 | 0 | 2177.28 | 1.028 | 1.023 | 1.028 | 0.0000 | 1.02298 | 0.0020 |
| 02 | 26.01 | 15 h 30 | 52.56 | 0 | 2217.60 | 1.046 | 1.027 | 1.046 | 0.0000 | 1.02934 | 0.2240 |
| 03 | 16.01 | 19 h 45 | 0 | 9.74 | 3507.84 | 1.037 | 1.017 | 1.037 | 0.0000 | 1.0210 | 0.3933 |
| 04 | 26.01 | 19 h 45 | 0 | 9.41 | 3528.00 | 1.046 | 1.031 | 1.046 | 0.0000 | 1.0300 | 0.0970 |
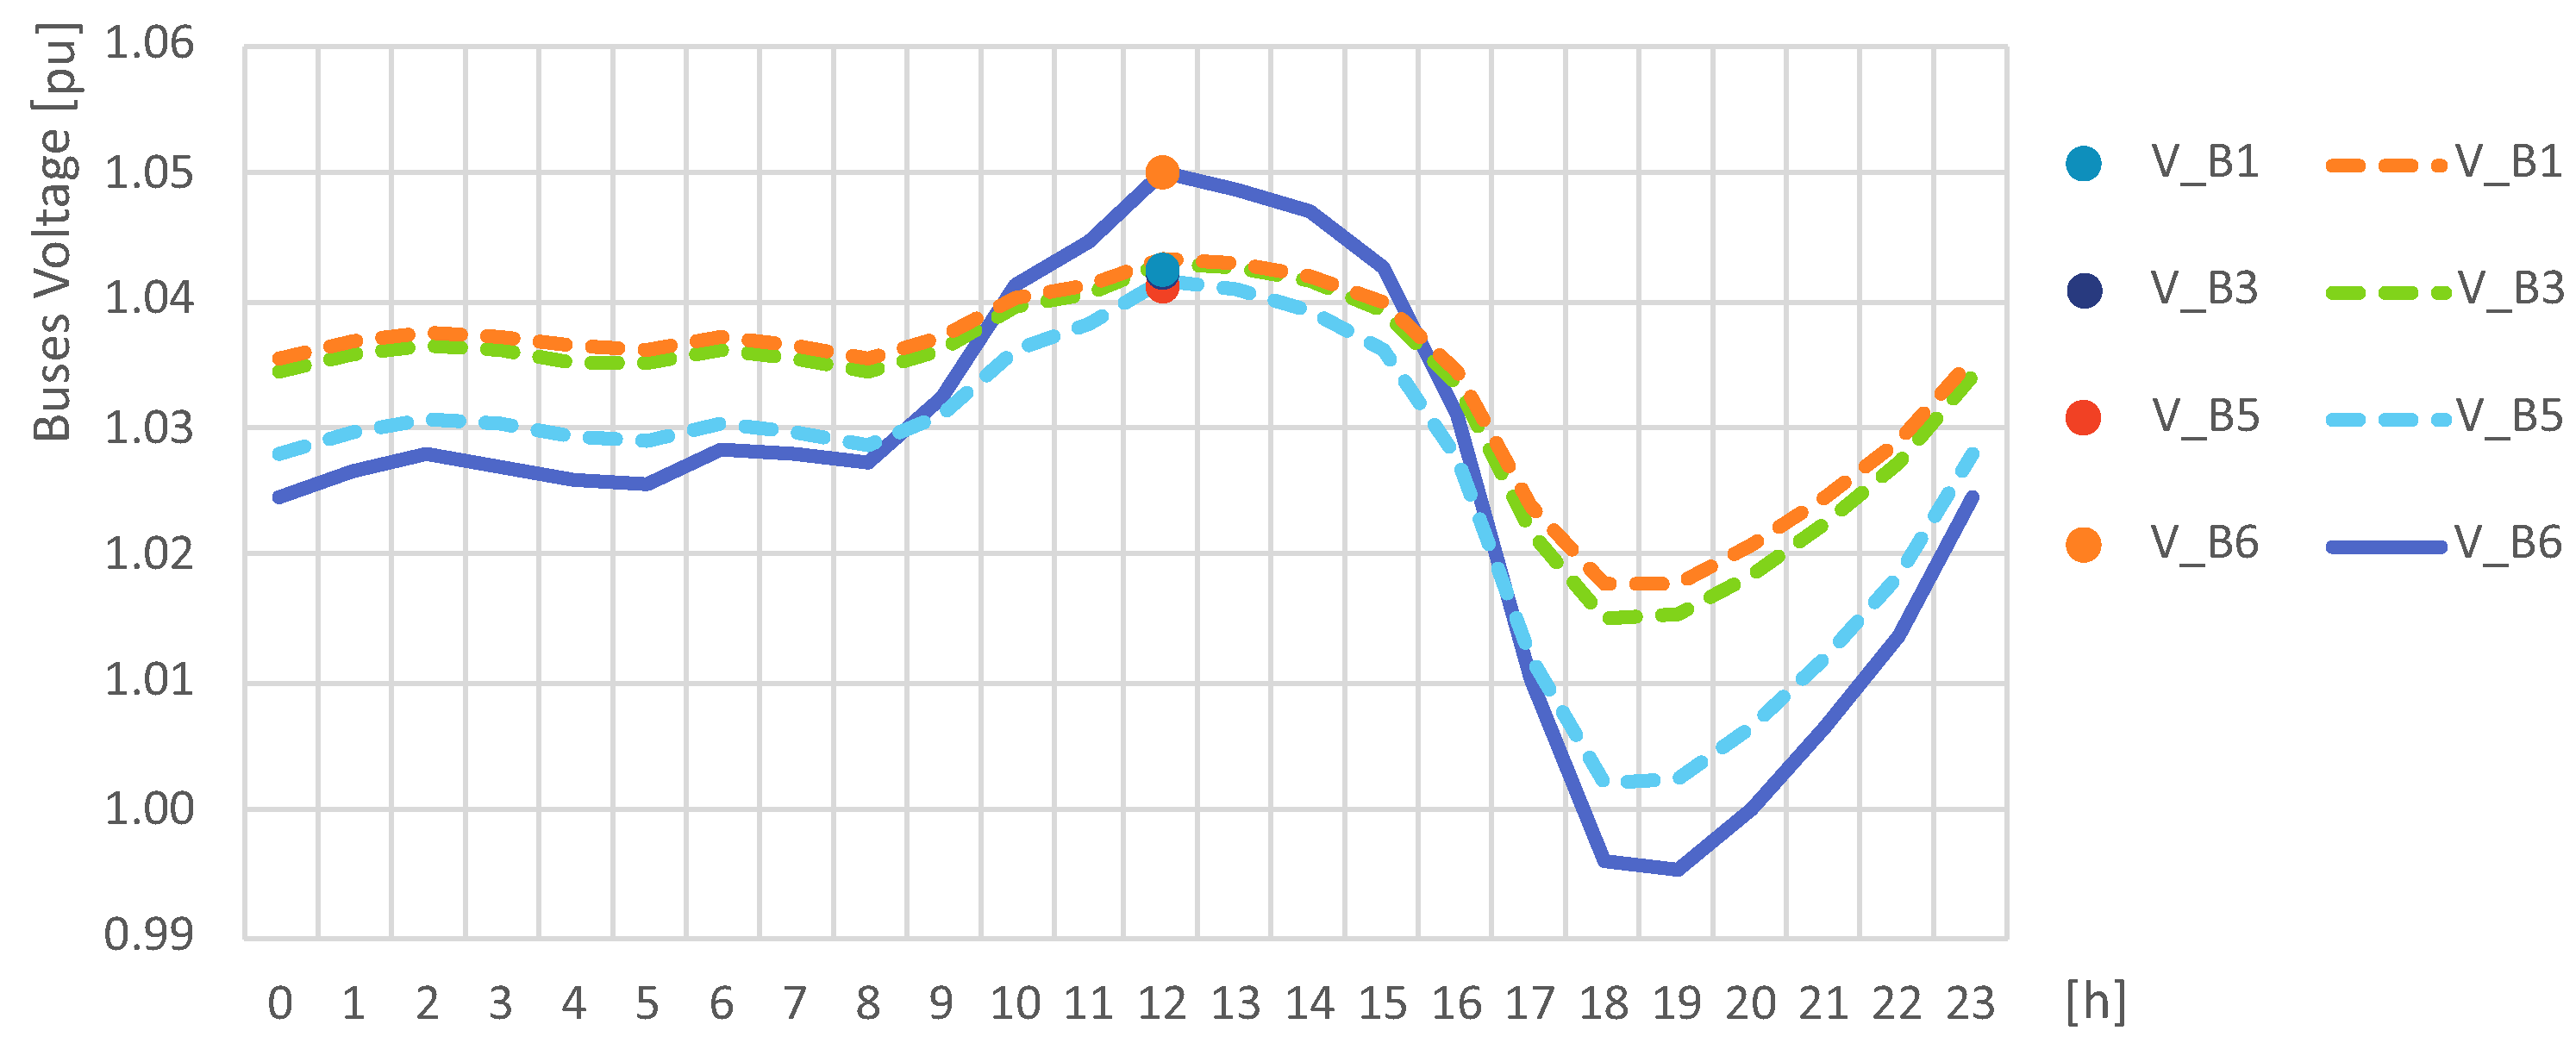
| Time Series Method [pu] | Proposed Hybrid Method [pu] | |||
|---|---|---|---|---|
| Case 00 | 1.0156 | 1.0164 | −0.075% | |
| 1.0212 | 1.0217 | −0.050% | ||
| 1.0293 | 1.0293 | −0.004% | ||
| 1.0309 | 1.0309 | 0.005% | ||
| Case 01 | 1.0501 | 1.0501 | 0.000% | |
| 1.0414 | 1.0411 | 0.030% | ||
| 1.0430 | 1.0422 | 0.077% | ||
| 1.0434 | 1.0424 | 0.087% | ||
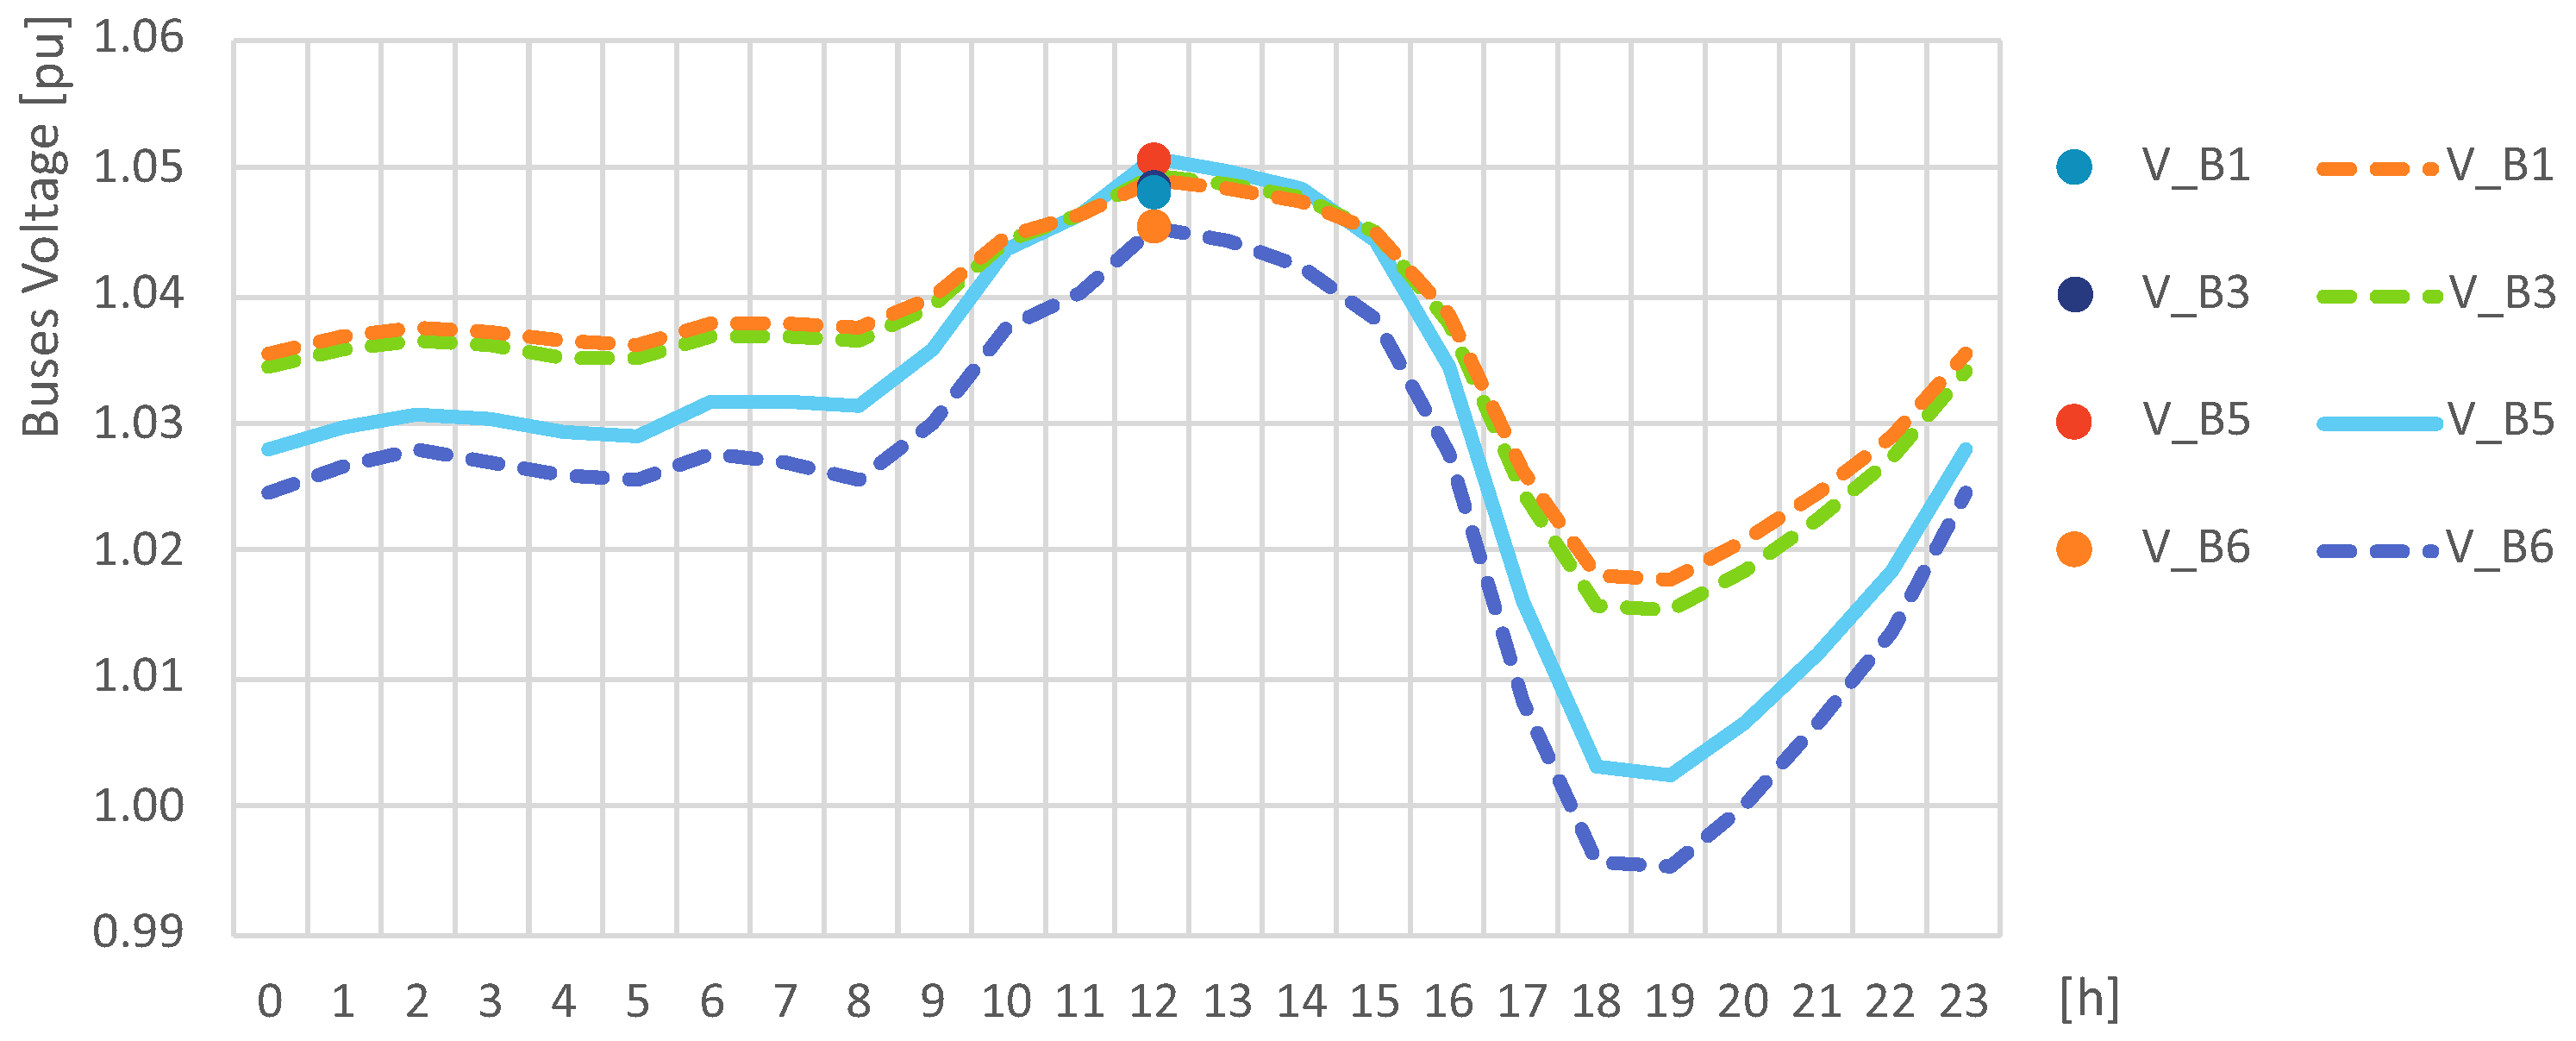
| Case 02 | 1.0453 | 1.0453 | −0.018% | |
| 1.0507 | 1.0506 | 0.004% | ||
| 1.0492 | 1.0485 | 0.070% | ||
| 1.0490 | 1.0481 | 0.085% | ||
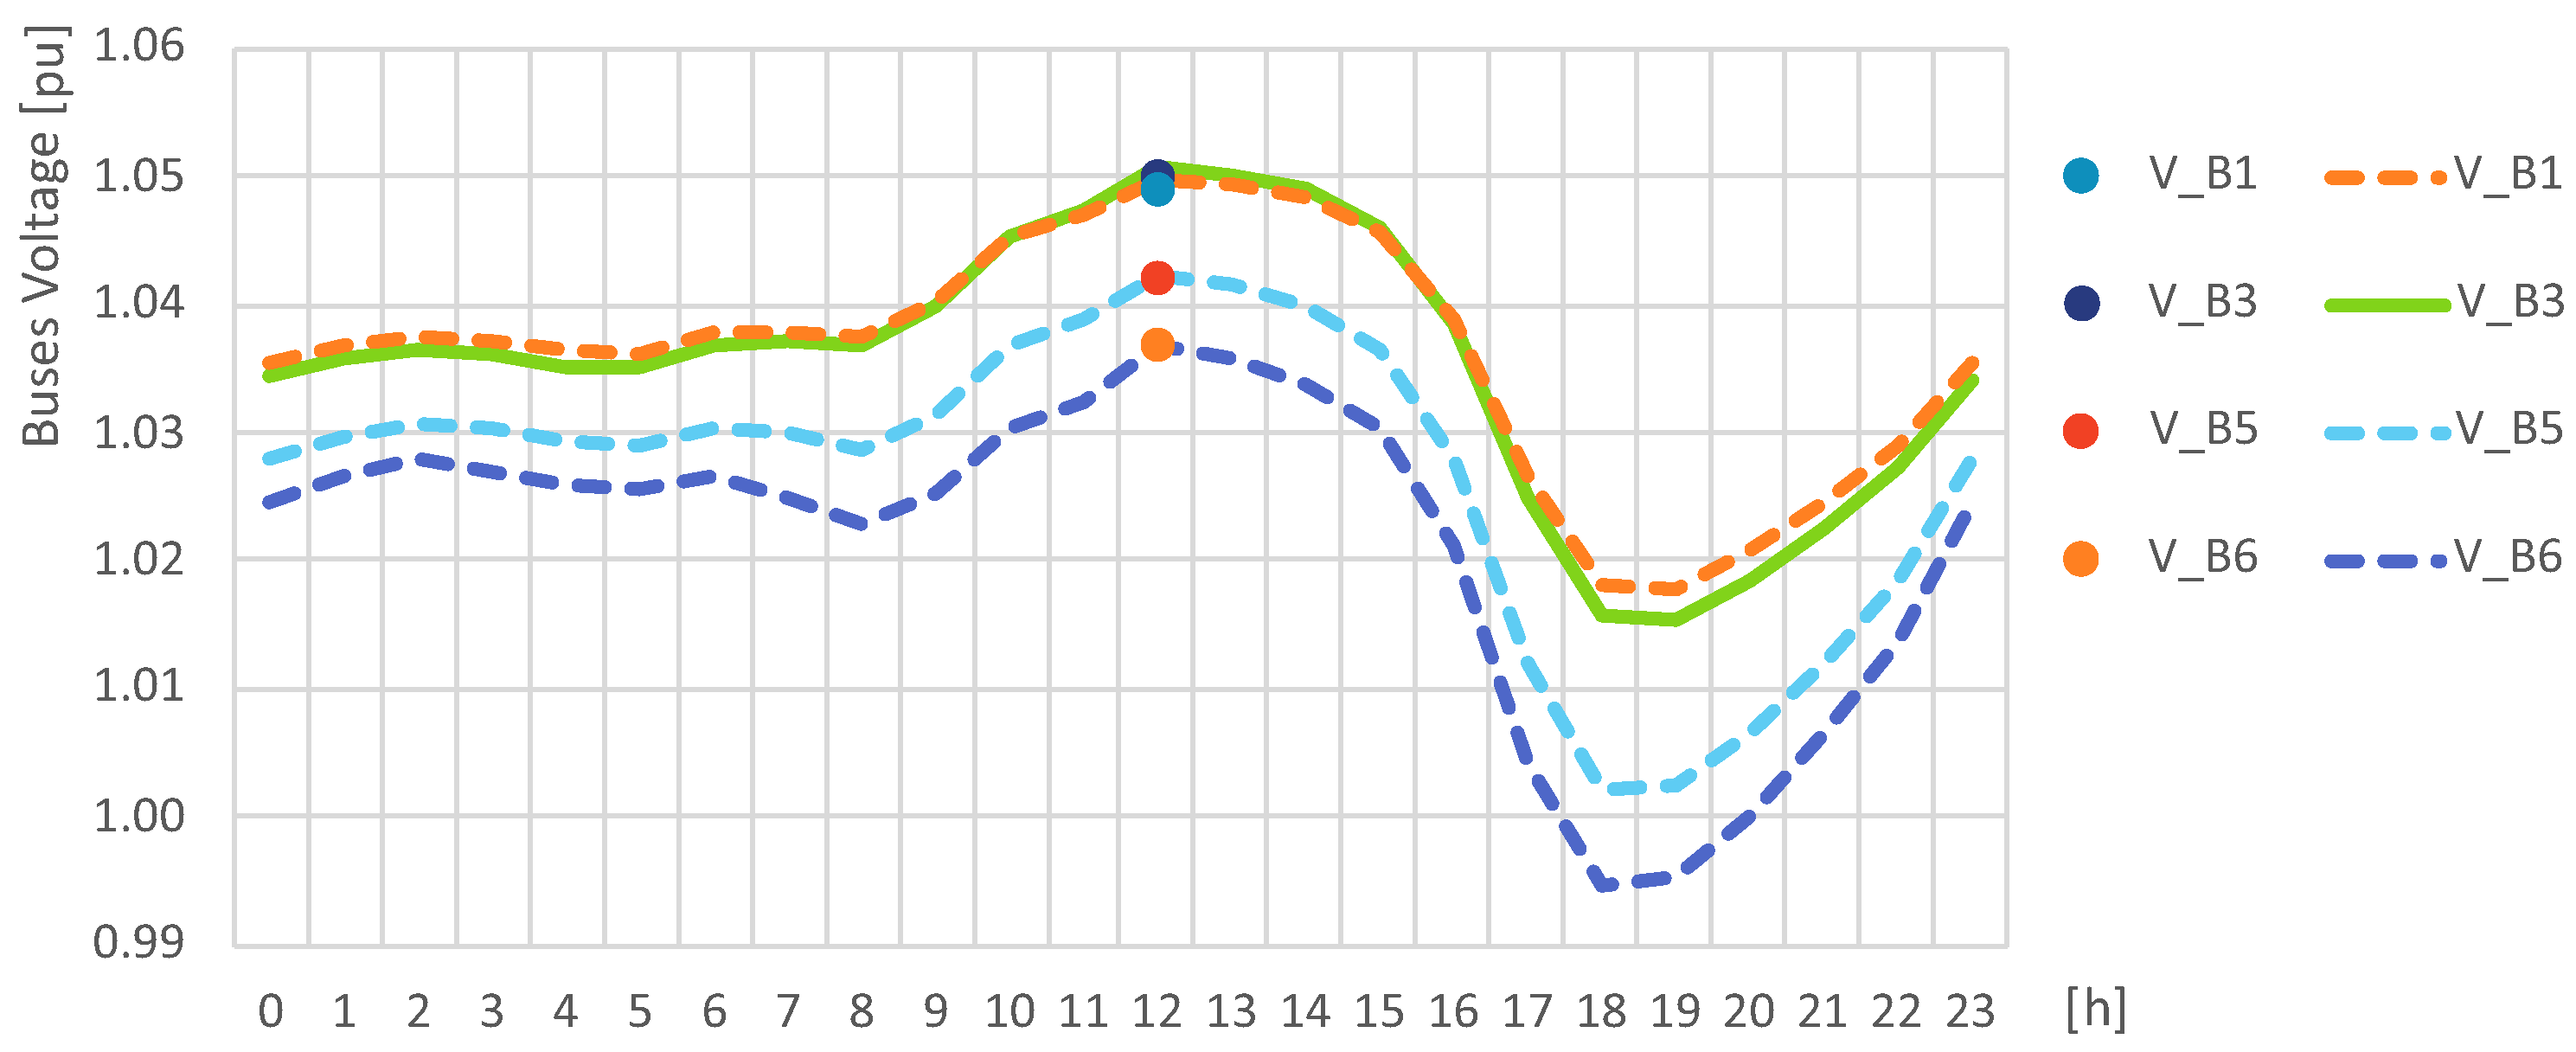
| Case 03 | 1.0368 | 1.0369 | −0.006% | |
| 1.0423 | 1.0421 | 0.017% | ||
| 1.0506 | 1.0500 | 0.060% | ||
| 1.0498 | 1.0490 | 0.077% | ||
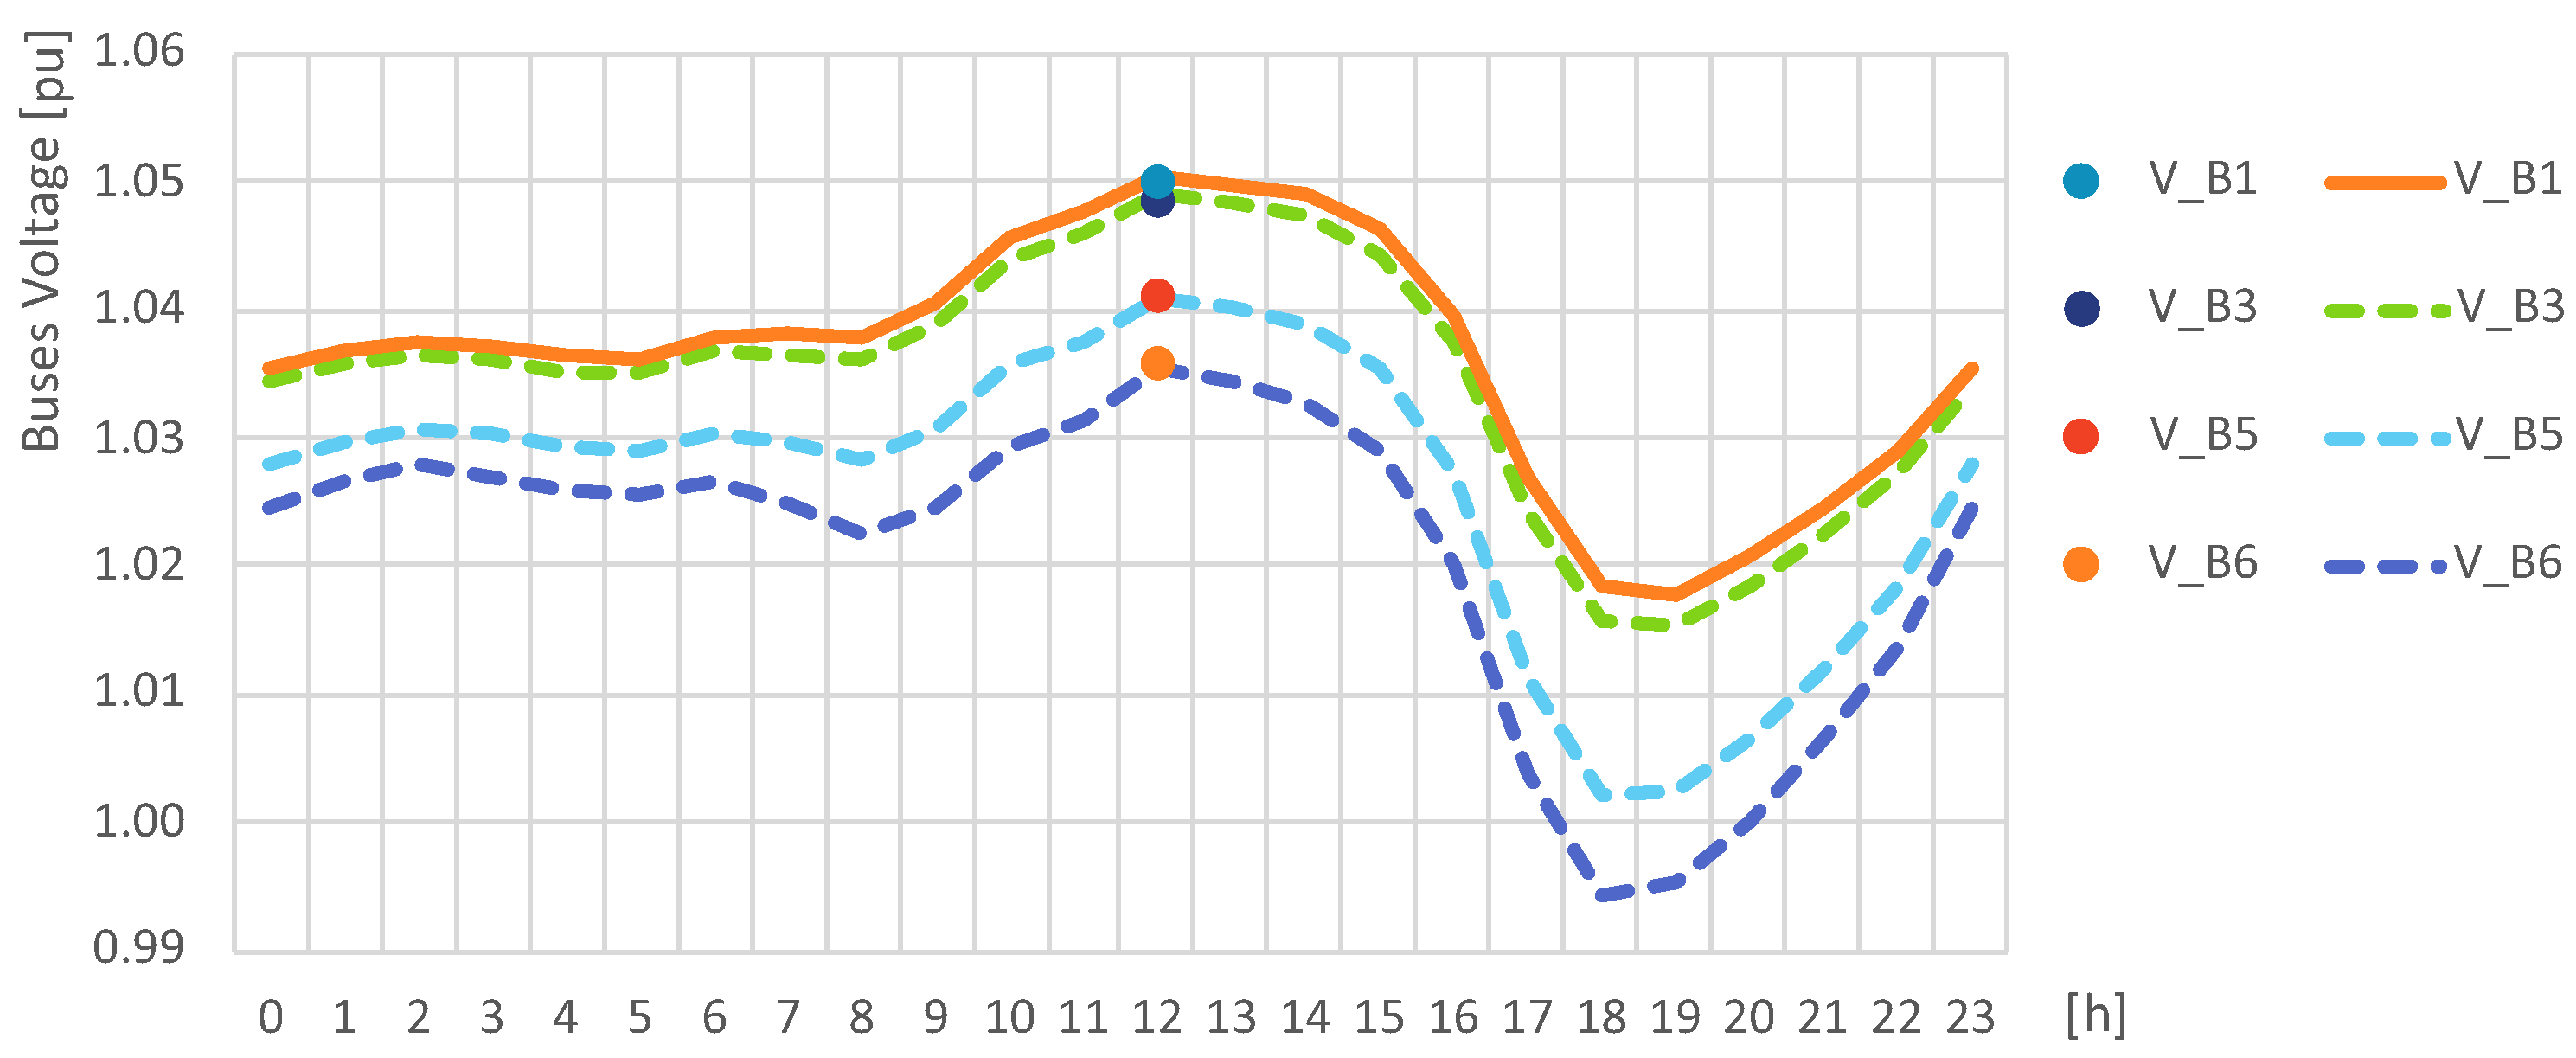
| Case 04 | 1.0355 | 1.0359 | −0.033% | |
| 1.0410 | 1.0411 | −0.010% | ||
| 1.0489 | 1.0485 | 0.035% | ||
| 1.0505 | 1.0500 | 0.045% |
Publisher’s Note: MDPI stays neutral with regard to jurisdictional claims in published maps and institutional affiliations. |
© 2022 by the authors. Licensee MDPI, Basel, Switzerland. This article is an open access article distributed under the terms and conditions of the Creative Commons Attribution (CC BY) license (https://creativecommons.org/licenses/by/4.0/).
Share and Cite
Lima, E.J.; Freitas, L.C.G. Hosting Capacity Calculation Deploying a Hybrid Methodology: A Case Study Concerning the Intermittent Nature of Photovoltaic Distributed Generation and the Variable Nature of Energy Consumption in a Medium Voltage Distribution Network. Energies 2022, 15, 1223. https://doi.org/10.3390/en15031223
Lima EJ, Freitas LCG. Hosting Capacity Calculation Deploying a Hybrid Methodology: A Case Study Concerning the Intermittent Nature of Photovoltaic Distributed Generation and the Variable Nature of Energy Consumption in a Medium Voltage Distribution Network. Energies. 2022; 15(3):1223. https://doi.org/10.3390/en15031223
Chicago/Turabian StyleLima, Ezequiel Junio, and Luiz Carlos Gomes Freitas. 2022. "Hosting Capacity Calculation Deploying a Hybrid Methodology: A Case Study Concerning the Intermittent Nature of Photovoltaic Distributed Generation and the Variable Nature of Energy Consumption in a Medium Voltage Distribution Network" Energies 15, no. 3: 1223. https://doi.org/10.3390/en15031223