Article

Investigating the Impact of Electric Vehicles Demand on the Distribution Network

1
Electrical and Computer Engineering Department, King Abdulaziz University, Jeddah 21589, Saudi Arabia
2
King Abdulaziz City for Science and Technology, Riyadh 11442, Saudi Arabia
3
Saudi Electricity Company, Riyadh 11416, Saudi Arabia
*
Author to whom correspondence should be addressed.
Energies 2022, 15(3), 1180; https://doi.org/10.3390/en15031180
Submission received: 26 December 2021 / Revised: 21 January 2022 / Accepted: 25 January 2022 / Published: 6 February 2022
(This article belongs to the Topic Power Distribution Systems)

Abstract

:
Deployment of Electric Vehicles (EV) is increasing in recent years due to economic and environmental advantages compared with fossil fuel-based vehicles. As the market of EVs grows, new challenges to the electric grid are emerging to accommodate the EVs demand, especially in the distribution networks. In this paper, we investigate the impact of EVs deployment on the electricity demand and distributed network. We propose a model to generate EV demand profiles that consider the EV users’ driving pattern such as daily energy consumption and charging schedule, in addition to the EV’s charging characteristics. The EV demand model uses data we obtained from a survey to evaluate the model’s parameters. We use the EV demand model to simulate and evaluate the impact of EVs demand on the distribution network. We present a case study with an actual model for a distribution network to evaluate the impact of EVs on the distribution network in Saudi Arabia. We analyze the simulation results and show how EVs impact the demand and the distribution network performance.

1. Introduction

Electric Vehicles (EV) deployment has been increasing in recent years. In an auspicious scenario, a report from the International Energy Agency (IEA) predicts that EVs will account for 7% of all road vehicles by 2030 [1]. In the first quarter of 2021, the sales of EVs increased by 140% compared to the same period from 2020 [1]. This increase is derived by the potential advantages of EVs such as ensuring energy security and reducing the greenhouse gas emission [2]. Many countries around the world announce plans to eliminate or reduce fossil fuel-based vehicles in the near future [1,3]. Norway for example has the most ambitious plan for phasing out all fossil-fueled vehicles by 2025 [3]. The government of the United Kingdom has decided to ban petrol and hybrid vehicle in 2035 forward in attempt to reduce greenhouse gas emission, which allows for wide utilization of EV in the country [3]. The government of United States announces a plan to increase the sales share of net-zero emission vehicles to 50% by 2030 [4]. Most recently, the Saudi Arabia government announce a target of 30% EVs in the Riyadh city by 2030 to reduce the greenhouse gas emissions [5].
The accommodation of EVs will challenge the power systems in the future. High EVs deployment rate increases electricity demand and leads to more power losses and voltage fluctuation on the power systems.The demand profile with high EVs deployment rate depends on many variables such as adoption rates of EVs, drivers’ working hours, and daily travel distance. To understand the impact of EVs on power systems, we need to model the EVs demand considering the uncertainties associated with these variables. The impact of high deployment rate of EVs can be studied at two levels: at the system’s level, and at the distribution network (or feeder) level.
The change in the electricity demand impacts the planning and operation of the power systems at the system level [6]. System operators need to understand the EVs demand to ensure adequate generation [7]. High deployment rate of EV may cause significant changes in the demand profiles at the system level and impact generation scheduling, especially since the charging pattern of EVs’ users expected to have a high correlation. The high correlation in the EV demand of different users is due to the similarities on the working hours, school times, and vacations. The change in the demand profile will be critical for the power system operation when the penetration the non-dispatchable generation such as solar energy systems increases [8,9]. For the distribution network level, the increased demand due to EVs can cause voltage drops and stress the distribution cables beyond the allowable limits. On the positive side, knowing the driving pattern of EV can support the power systems’ operation by utilizing the existing battery system. The utilization of the EV batteries to support the grid can only be fulfill by knowing the the consumers charging pattern [8,10].
Different methods are used in the literature to model the impact of EVs in the distribution grid. In [11,12,13,14], the authors study the impact of EVs demand on the distribution network using a deterministic EVs charging pattern based on reasonable assumptions. The authors of [11] evaluate the EV demand assuming the charging will be performed during off-peak hours and use three different charging patterns. While in [12], the authors use two predefined charging periods with 85% EVs charge at off-peak hours and 40% at peak hours. The authors of [14] assume the EVs charging times are overlapped with fixed starting time to simulate the worst-case scenario. While in [13], the authors use two scenarios for the charging time, i.e., regulated and unregulated, to study the impact of the EVs charging both with constant charging time. Although using a fixed charging period for EVs provides insight, the results might be misleading, especially when evaluating the impact on the peak demand.
The authors in [15] use actual data obtained from a trail [16]. The data in [16] is collected through installing meters in-vehicle and charging station, and surveying the 44 EVs owners who participated in the trail. Installing meters in-vehicle provides an accurate estimation of the actual pattern of EVs demand. However, due to the complexity of the task, the high cost of installing the meters, and the willingness of people to participate in a trail, the number of participants in the trail is low which makes it difficult generalize the EVs demand pattern. Other papers such as [17,18,19] proposed using data published by statistical organization and government statistical department to develop EV demand model. The authors of [18,19,20] use Monte-Carlo Simulation (MCS) to generate multiple scenarios through sampling over actual data and evaluate the impact of EVs charging on the power system. However, the proposed model considers only one arrival and departure times for each consumer every single day. Those assumptions are not a realistic and do not reflect consumer driving pattern since a single consumer can have several charging intervals which will impact the power demand differently.
In this paper, we propose a framework to study the impact of EVs deployment on the power system at two levels: system’s level and distribution feeder’s level. In order to build an accurate EV demand model, we surveyed the consumers to collect data about the driving patterns in Saudi Arabia. Then, we propose a probabilistic EV demand model based on the actual data to capture the consumers’ driving pattern and the EVs charging characteristics. We use an agent-based model and sequential MCS to generate different scenarios using the EV demand model. We then use the output of those scenarios to determine the load profiles of different EVs deployment rates. After that, We evaluate the output of the model for the system using a power flow analysis on an actual distribution feeder. Finally, we use the proposed framework to study the impact of EVs deployment in Saudi Arabia as a case study using actual distribution network with 72 nodes and show the impact of EVs deployment.
The main contribution of this paper is summarized as following: (1) propose a systematic framework to study the impact EVs deployment at the system level and distribution network, (2) develop a probabilistic EV demand model that captures the main characteristics of EV demand including the daily travel distance and the charging schedule considering the possibility of having multiple daily trips, (3) distribute a survey to collect an actual data about the driving pattern in Saudi Arabia and use it to evaluate the parameters of the EV demand model, (4) evaluate the impact of different EVs deployment rate on the system level and distribution network in Saudi Arabia. The results show the expected changes in the system level demand profile and the impact of EVs charging on the feeder’s demand profile, peak demand, power losses, and voltage profile.

2. Methodology

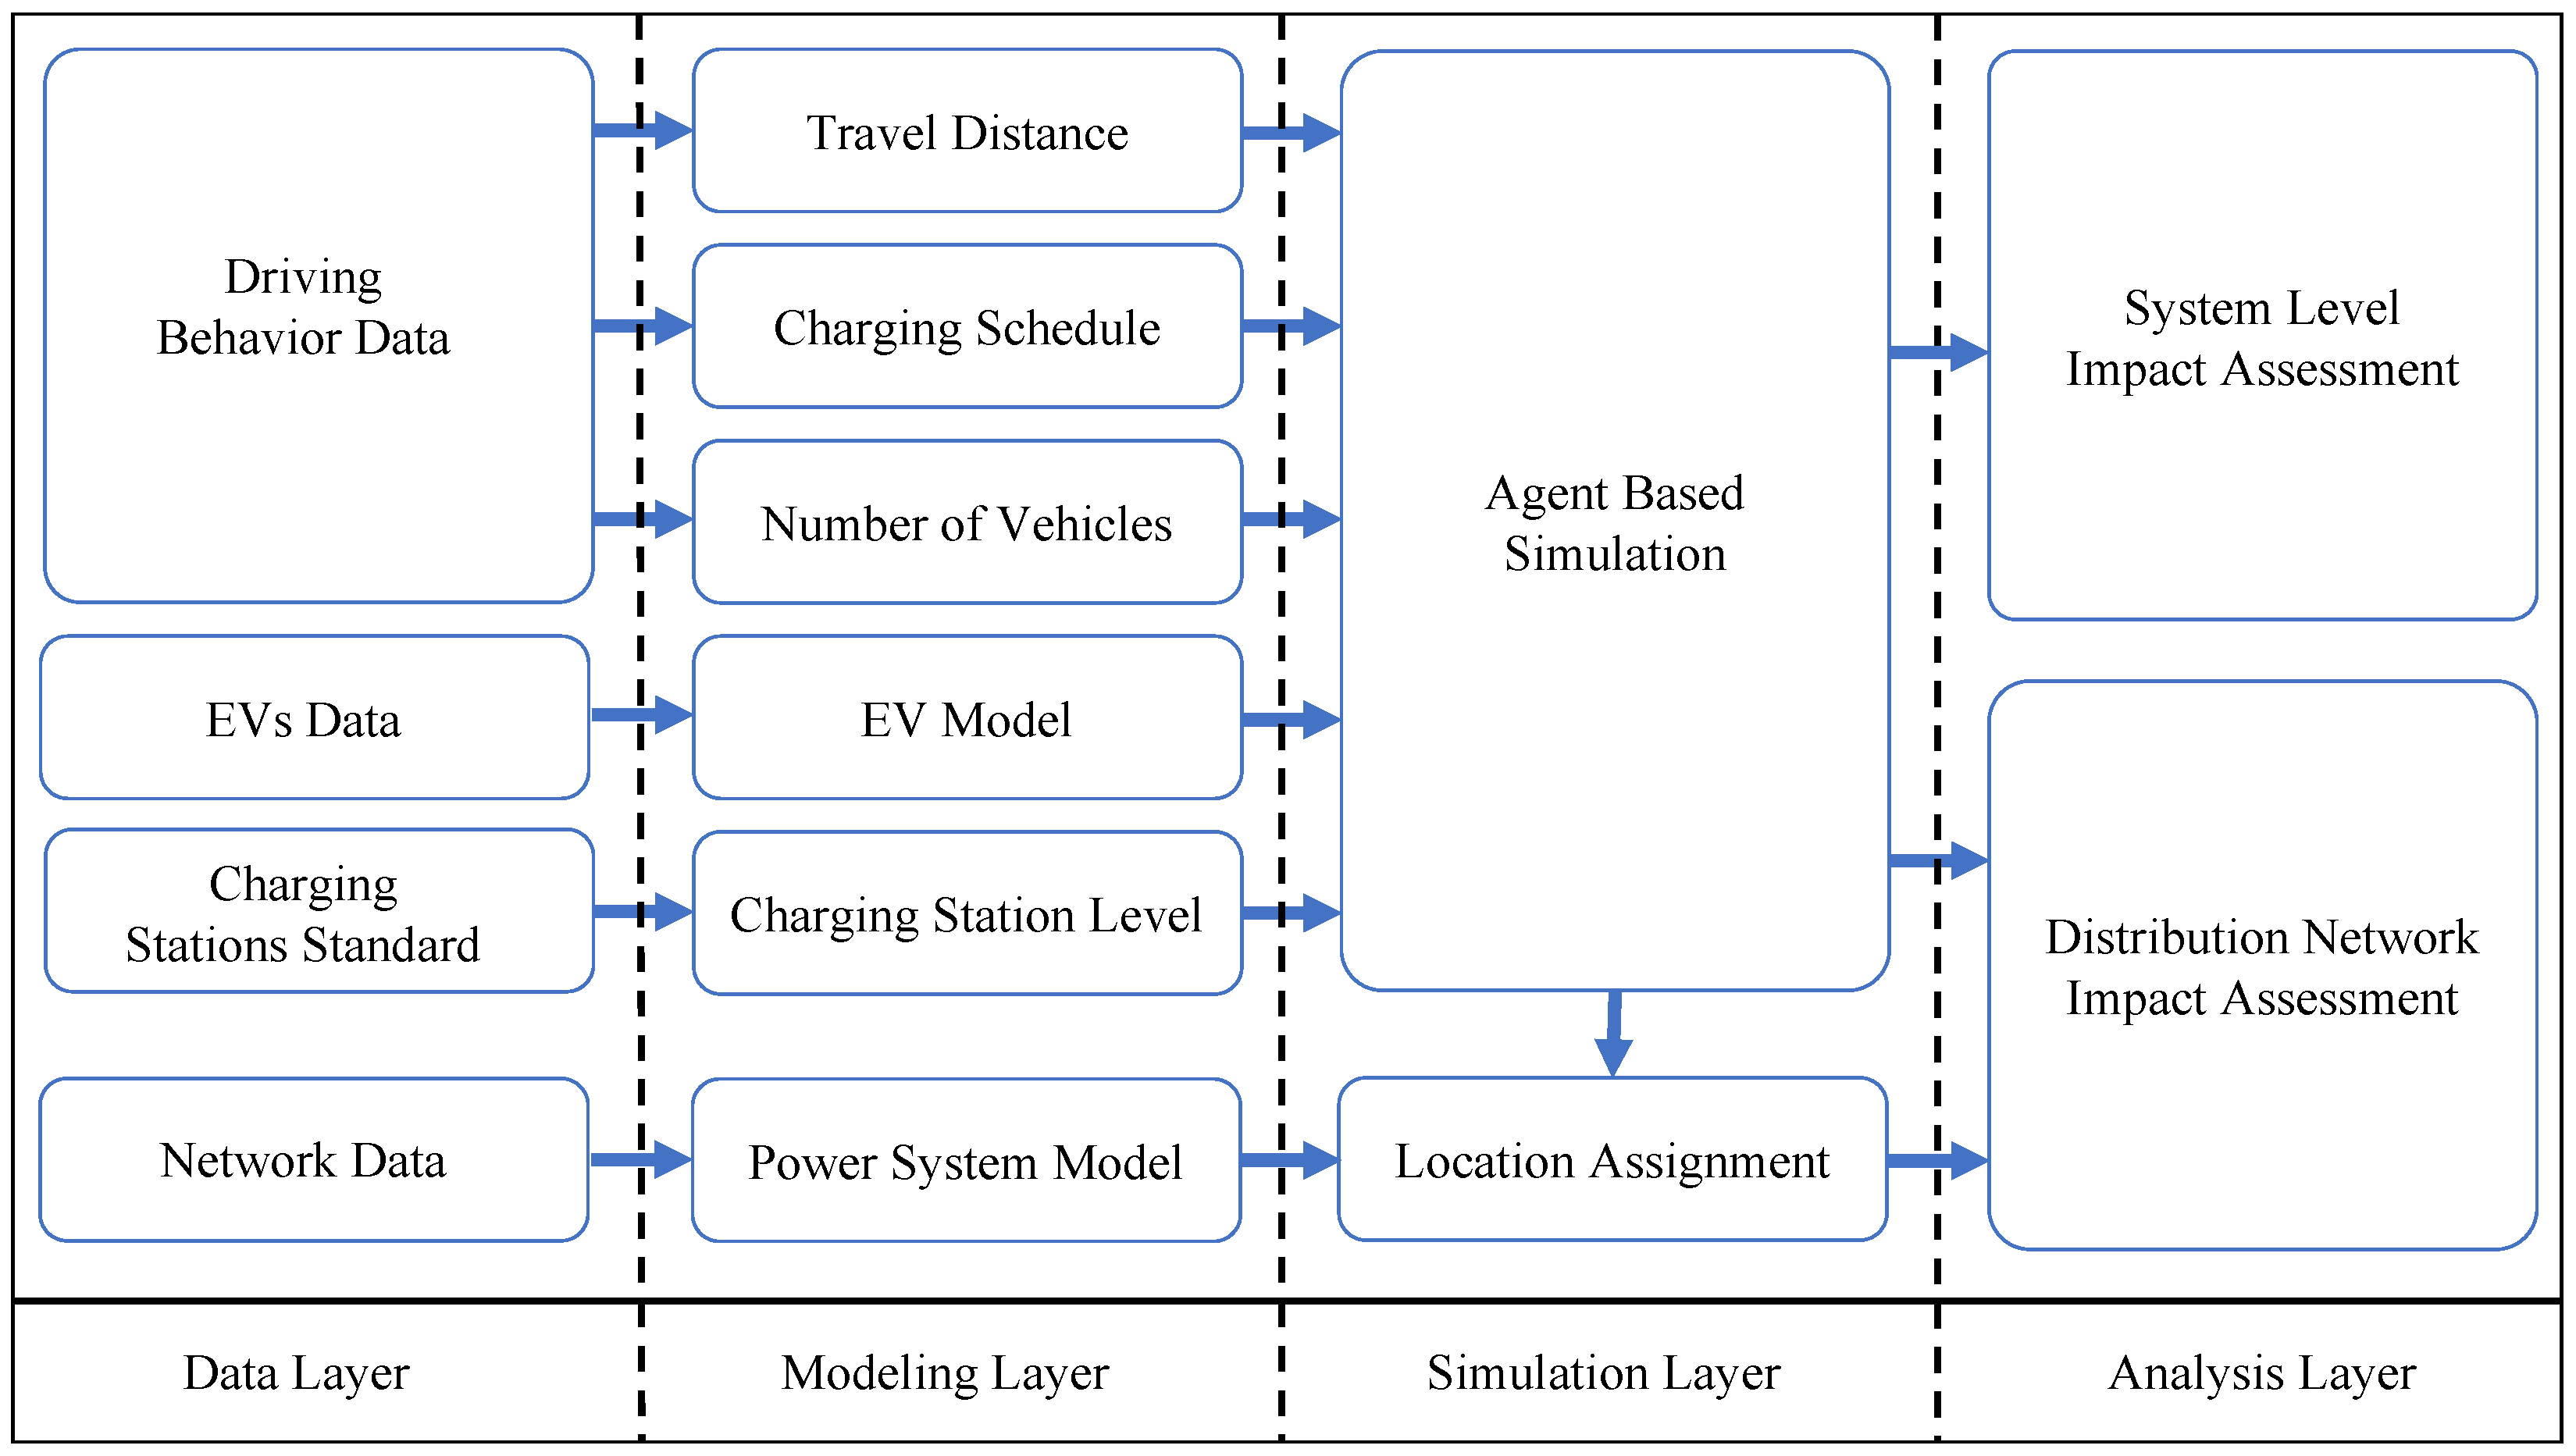
To study the impact of EVs on the electric power grid, we propose using a framework consisting of four layers: (1) Data Layer, (2) Modeling Layer, (3) Simulation Layer, and (4) Analysis Layer. The first layer is data collection, where we collect data required to evaluate the parameters of the EV demand model. The second layer is the probabilistic demand model that incorporates the variables that directly impact the EV demand. The third layer is where we generate scenarios for different deployment rates of EVs and assign a location for each EV on the distribution feeder. Finally, we assess the impact of EV’s demand using historical demand and distribution network data. Figure 1 shows the methodology and the interaction between the layers. In the following sections, we describe the proposed method in detail.

2.1. Data Layer

The data consists of EVs charging and charging station characteristics, users’ driving patterns, and network data. This section describes the datasets we use in this study. Although we use a specific dataset to illustrate the methodology and study the impact of EVs on the Saudi Arabia context, other datasets can be used with the same methodology that we propose to generalize the results to other systems.

2.1.1. Driving Pattern

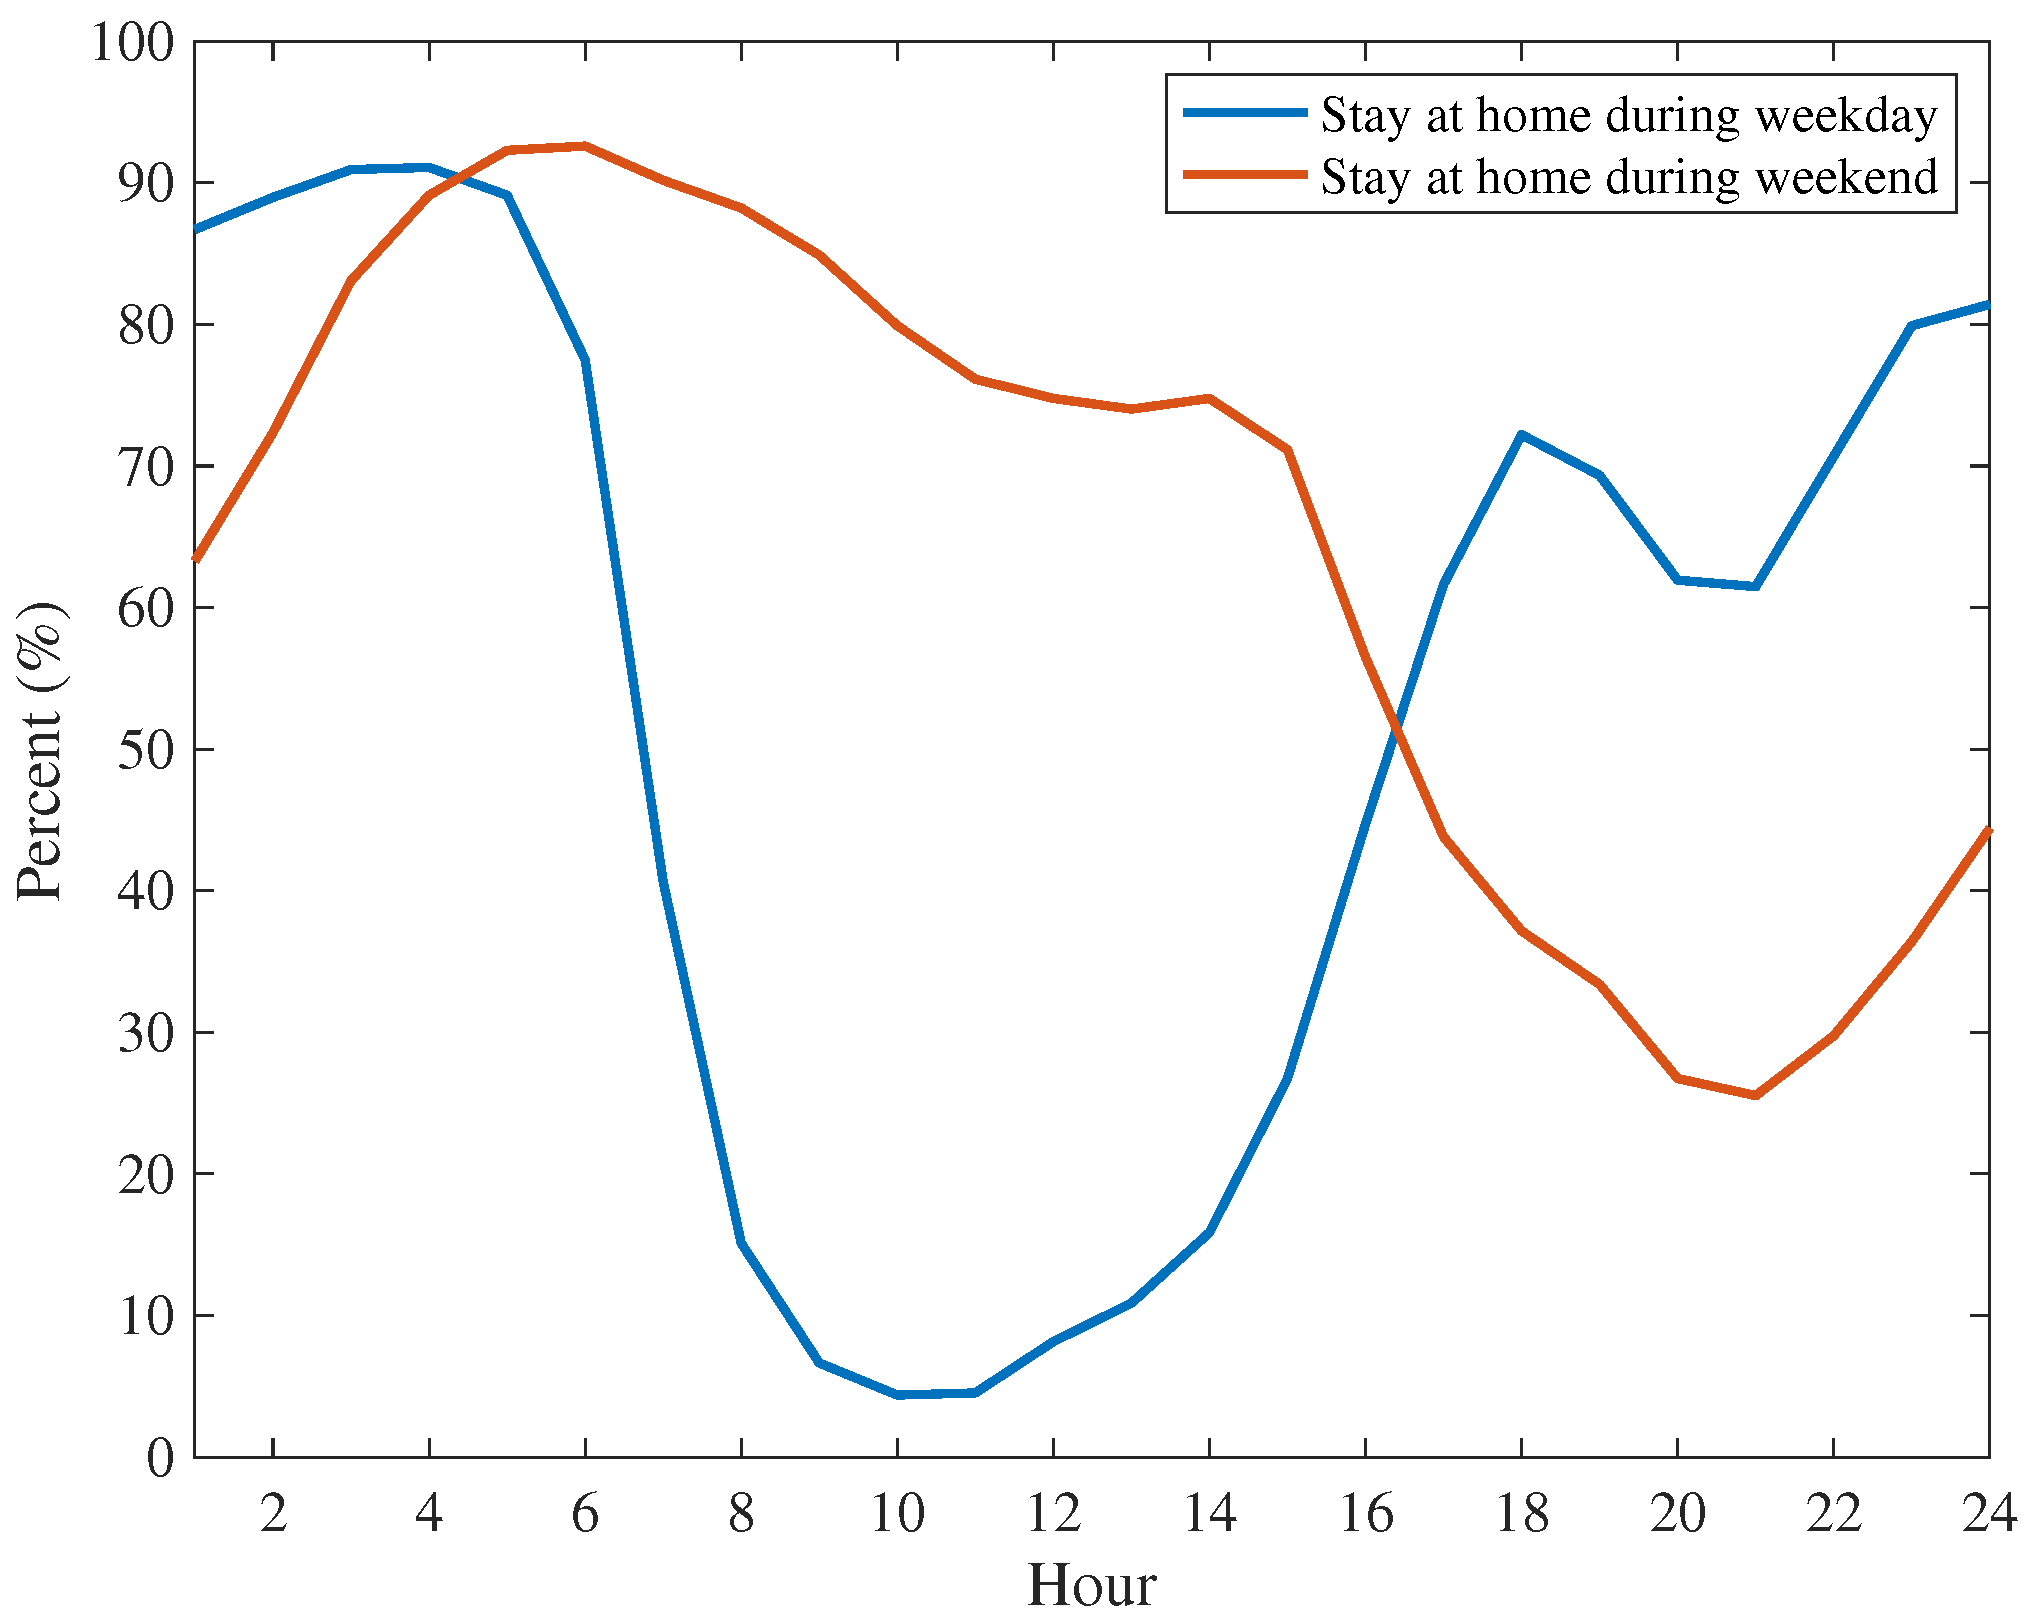
For an ideal model of EV demand, we typically would use real measurements of charging parameters for a large number of vehicles in different locations. However, such data is not readily available. Therefore, we use other approaches to collect data to model the EV demand. We distributed a survey with justified heuristic assumptions to develop the EV demand model. The dataset we use in this paper presents responses from 662 participants to an online survey distributed in July 2019. We published and shared the survey through emails and social media. The survey was open to all drivers in Saudi Arabia. We checked and verified all responses and eliminate any responses with discrepancies. The survey contains questions about the number and type of vehicles the participants own, when they are at home, and the average daily travel distance they usually travel. The survey responses and answers are summarized in the Appendix A. It is worth to note here that almost all the survey participants do not drive EVs. However, we assume that the driving pattern of the participants will not change dramatically from the current driving pattern when driving an EV.

2.1.2. EV Energy Requirements

The charging energy of an EV depends on the vehicle’s specification and charging station level. There are three main types of EVs: Battery EV, Plug-in EV, and Hybrid EV. The former two EV types are charged using electricity and store the energy in a battery system, while the hybrid type does not consume electricity from the grid [19]. The Battery EV uses a battery system as the only source of electricity, while the Plug-in EV has two engines that use electricity and gasoline. In this study, we focus on the Battery EV type since its single source of energy is from the grid and has more impact on the electricity demand compared to the Plug-in EV. Throughout the paper, we use EV to refer to the Battery EV.
The EV characteristics that impact energy consumption are battery capacity, driving efficiency, and maximum charging power. We selected several commercially available EVs in this study and obtain their specifications from [21]. The EVs type and their specifications are shown in Table 1. We use data from the survey to estimate EV type probability of similar vehicle as close as possible. we assume that 40% drive small sedan and small hatchback, 40% regular size sedan, and 10% drive large SUV.

2.1.3. Charging Station Characteristics

There are several standards govern the charging station characteristics. Although there are no established charging station standards in Saudi Arabia yet, we use the European charging station standard levels since the electricity plugs standards and voltage level in Saudi Arabia is similar to the one in United Kingdom. The standards charging levels in Europe is shown in Table 2. In this study, we use charging levels 1 and 2 since they are the typical level used in homes [14]. We assume 70% of the EVs’ users use level 1 and 30% use level 2 charging stations. We use this assumption based on the fact that level 2 chargers require additional electrical installation, while level 1 is readily available option for the EV users. Hence, we expect most of the user to utilize level 1 chargers.

2.1.4. Network Data

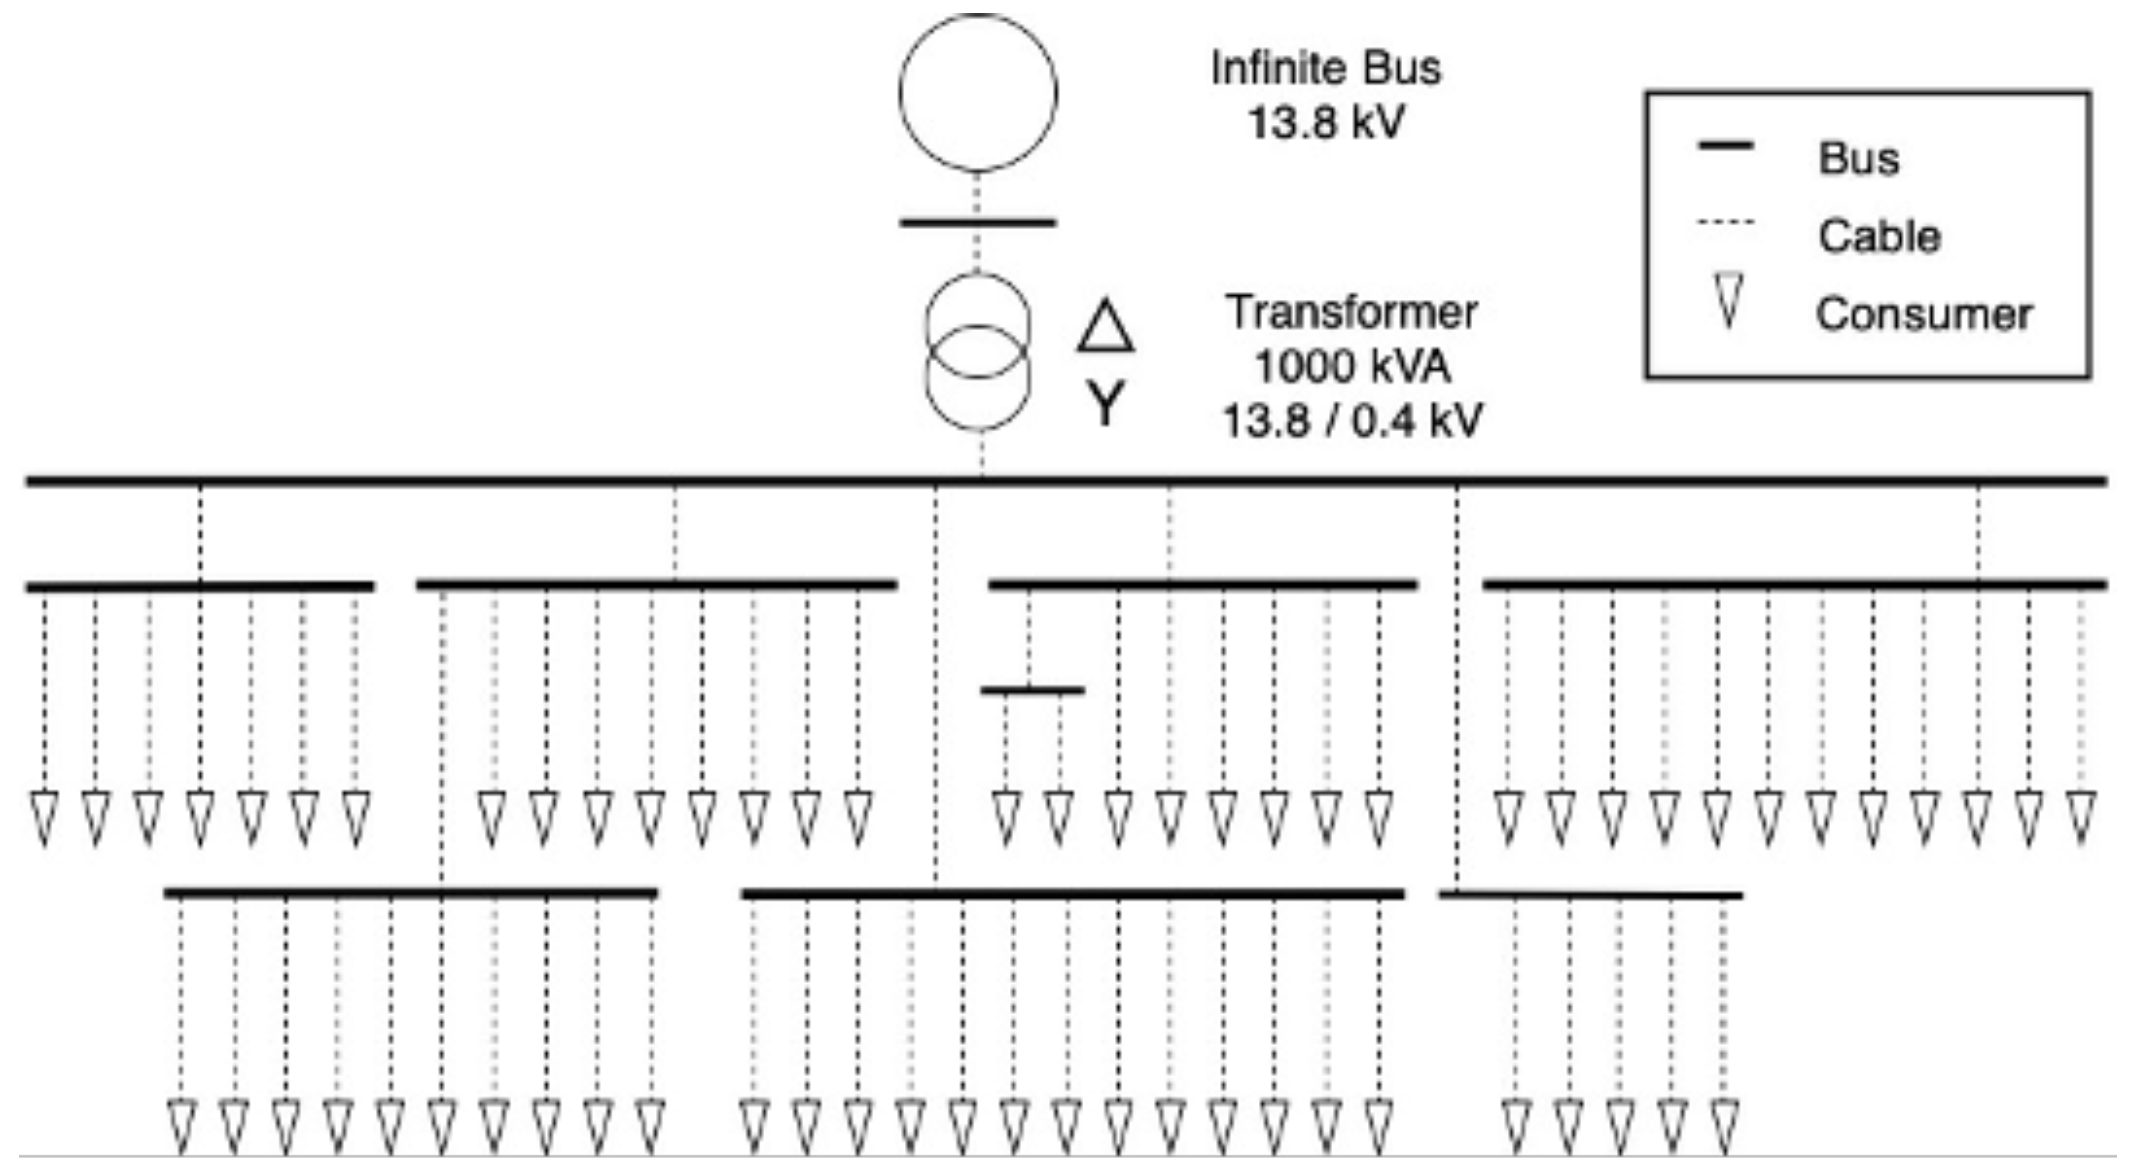
To evaluate the impact of the EVs deployment on the distribution network, we use an actual distribution feeder data. The feeder is supplied from Medium Voltage (MV) line to a distribution transformer with 1 MVA rating. The Low Voltage (LV) side of the transformer supplies 62 residential consumers. Figure 2 shows the single line diagram of the feeder.
We also use smart meters data of residential consumers in Riyadh, Saudi Arabia, to represent the feeder consumers. The data consists of one-week hourly demand of the consumers recorded between 25 June–1 July 2017. We intentionally selected a summer week as the peak demand in Saudi Arabia occurs usually occurs every year between June and September.

2.2. Modeling Layer

To model the EV demand, we use a probabilistic model to account for uncertainties associated with the EVs demand. We use the data described in the previous section to tune the proposed models. In this section, we describe the daily travel distance, the charging schedule, and network models.

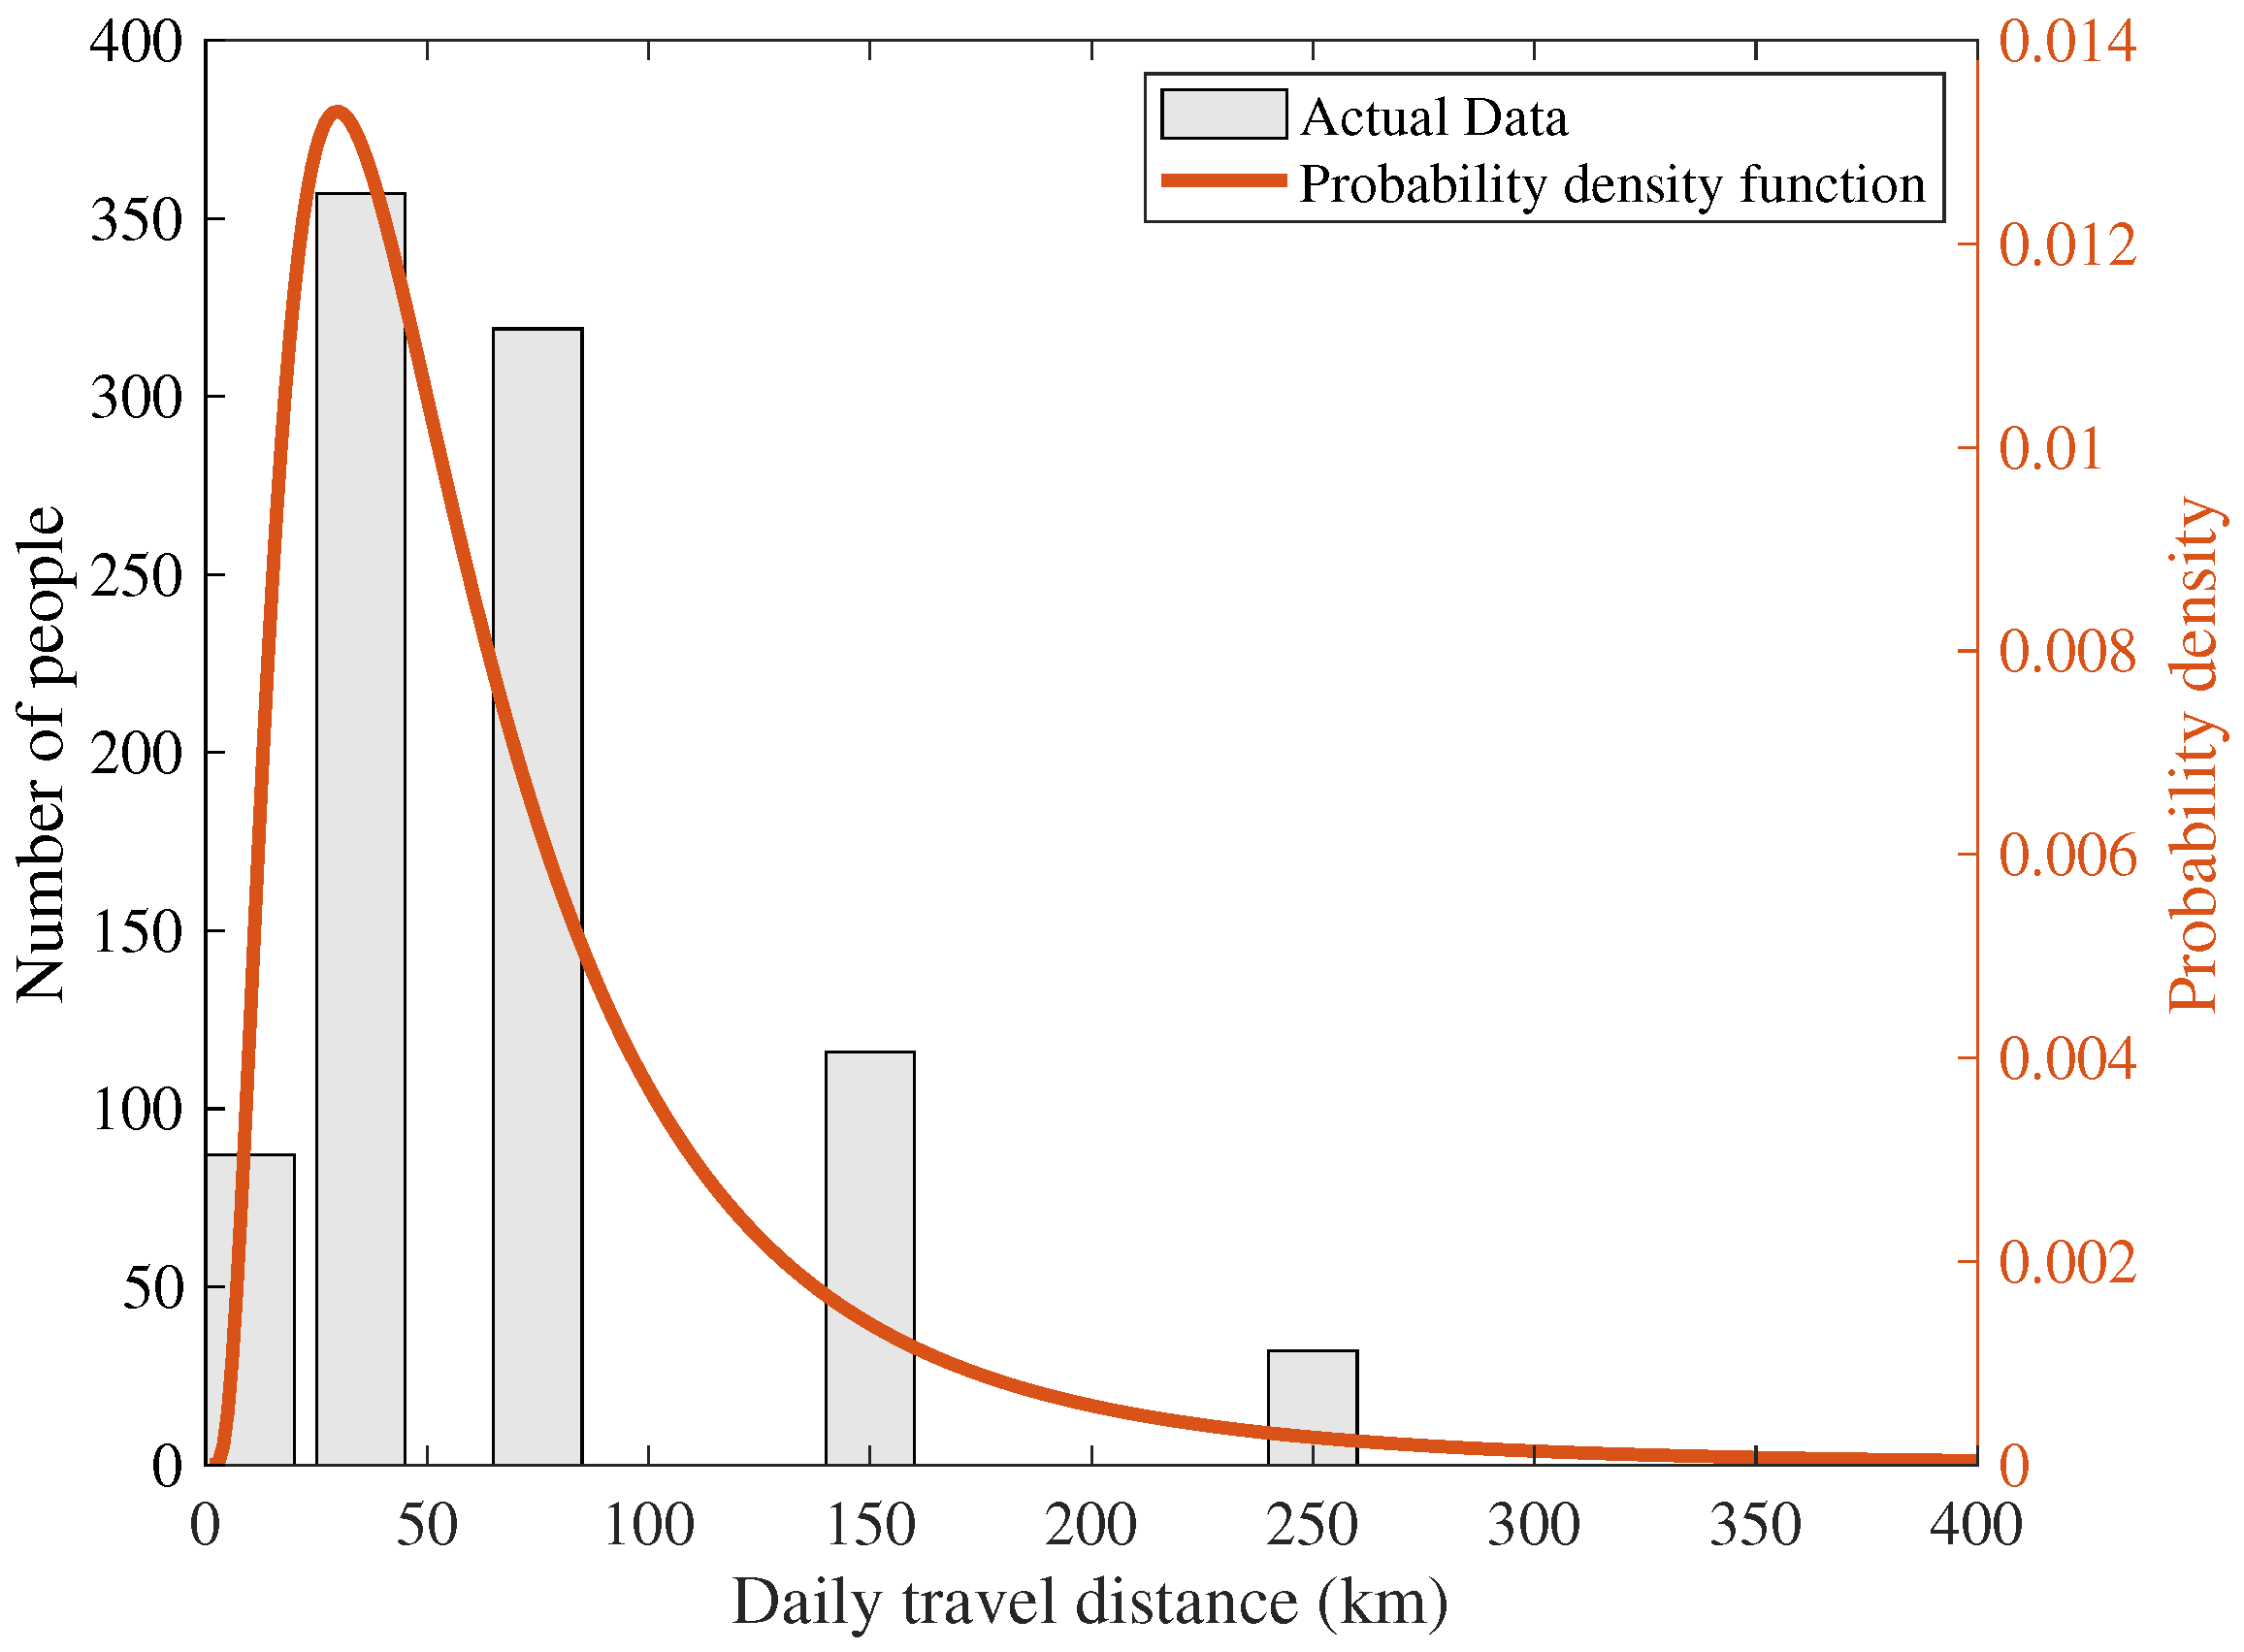
2.2.1. Daily Travel Distance

An important factor that impacts the EV demand is the daily travel distance. We model the daily travel distance through fitting the travel distance data that we obtain from the survey into a probability distribution function. We found that the travel distance data is suitably fitted with the log-normal distribution. The log-normal distributed has been used in the literature to describe the travel distance [9], which increases our confidence in the validity of the dataset. We fit the daily travel distance dataset into a log-normal distribution function with a density function shown in (1).
P [ D = x ] = 1 x σ 2 π exp ( ( ln x μ ) 2 2 σ 2 ) ,
where D is a random number represents the daily travel distance, and x is a dummy variable to evaluate the probability density function P [ D = x ] . We denote the fitting parameters of the log-normal distribution with μ and σ . We found that the parameters of the distribution function of the travel distance for the dataset we use are μ = 3.9569 and σ = 0.7734 . Figure 3 shows the actual data and the probability density function of the daily travel distance for consumers.

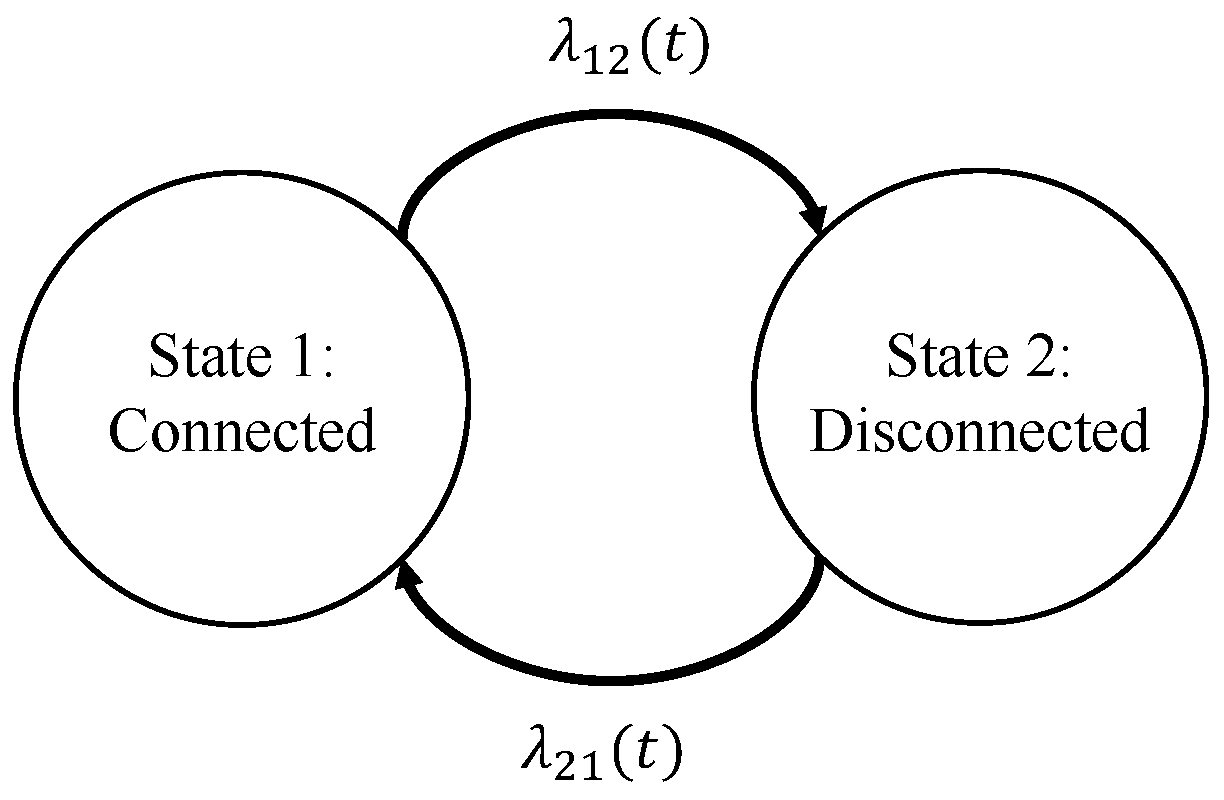
2.2.2. Charging Schedule

We model the charging and discharging schedule using two states model shown in Figure 4. State 1 ( S 1 ) represents the EV is connected to the grid, while state 2 ( S 2 ) represents the EV is disconnected. Let S S 1 , S 2 be a random variable with two states, and P [ S ( t ) ] be the probability of the state S at time t. We define the transition probabilities λ 12 τ ( t ) = P [ S ( t ) = S 2 | S ( τ ) = S 1 ] and λ 21 τ ( t ) = P [ S ( t ) = S 1 | S ( τ ) = S 2 ] as the probability of transitioning from S 1 at time τ to S 2 after a time period of t and the probability of transitioning from S 2 at time τ to S 1 after a time period of t, respectively. We note that the transition probabilities λ 12 τ ( t ) and λ 21 τ ( t ) are time-dependent and different for each time of the day denoted by τ .
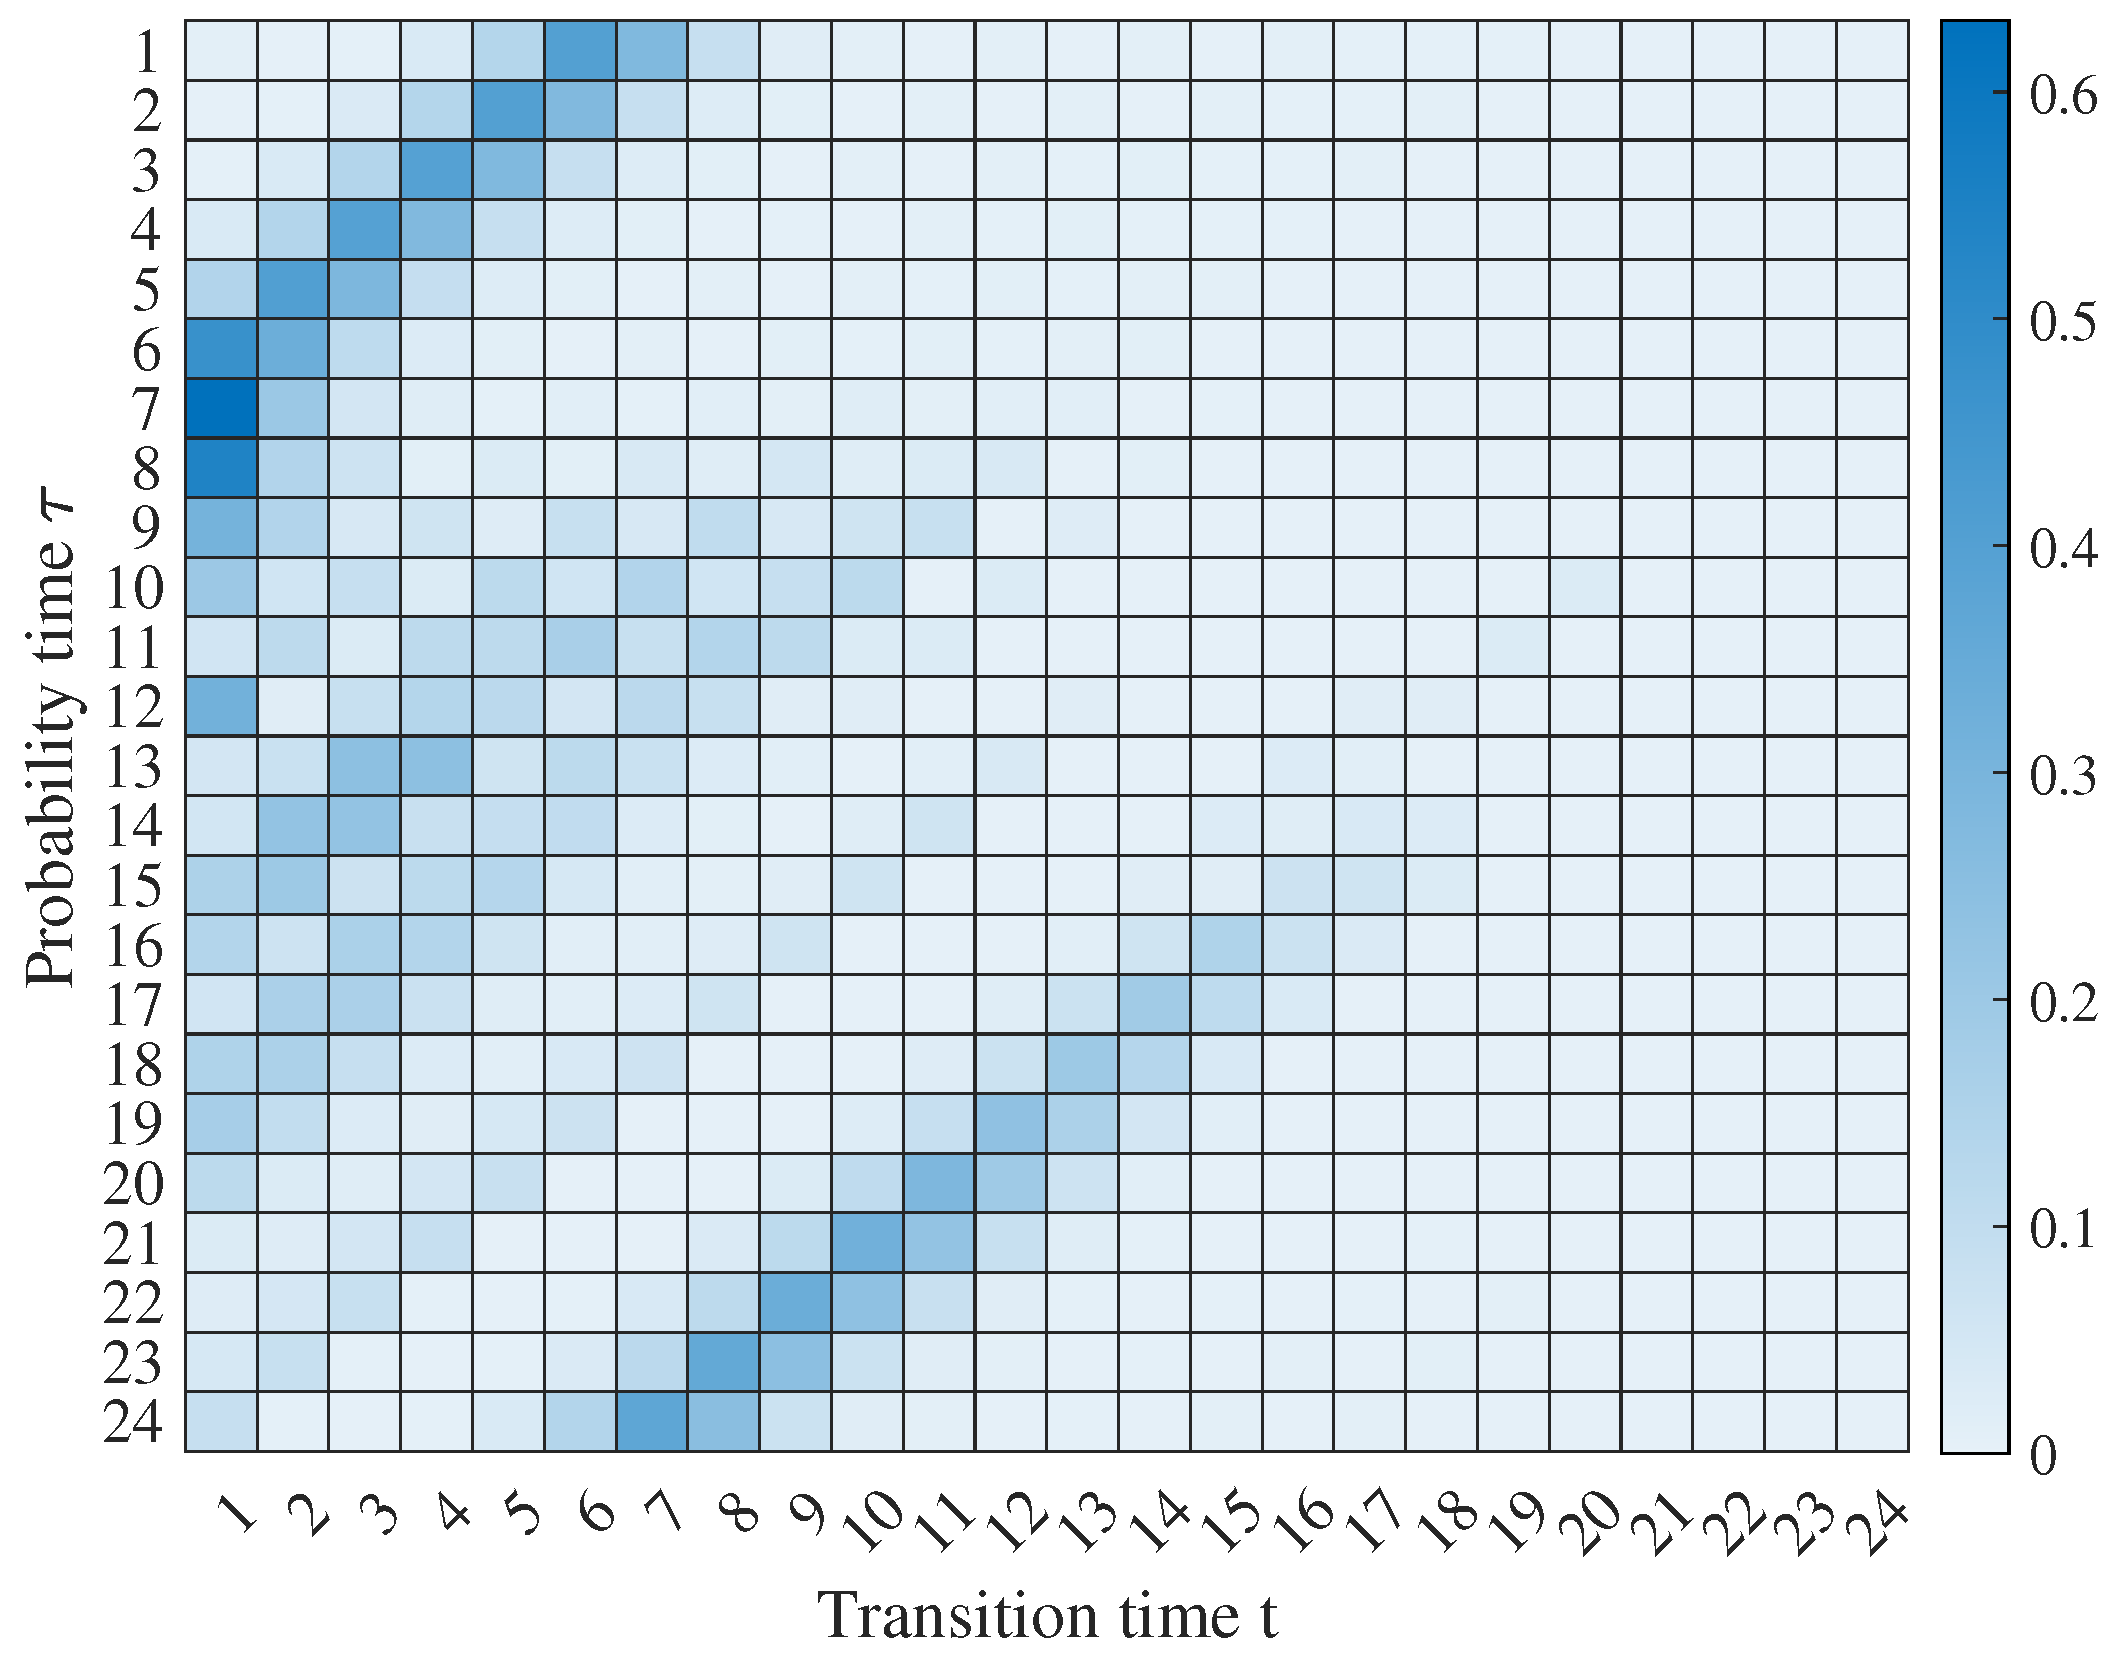
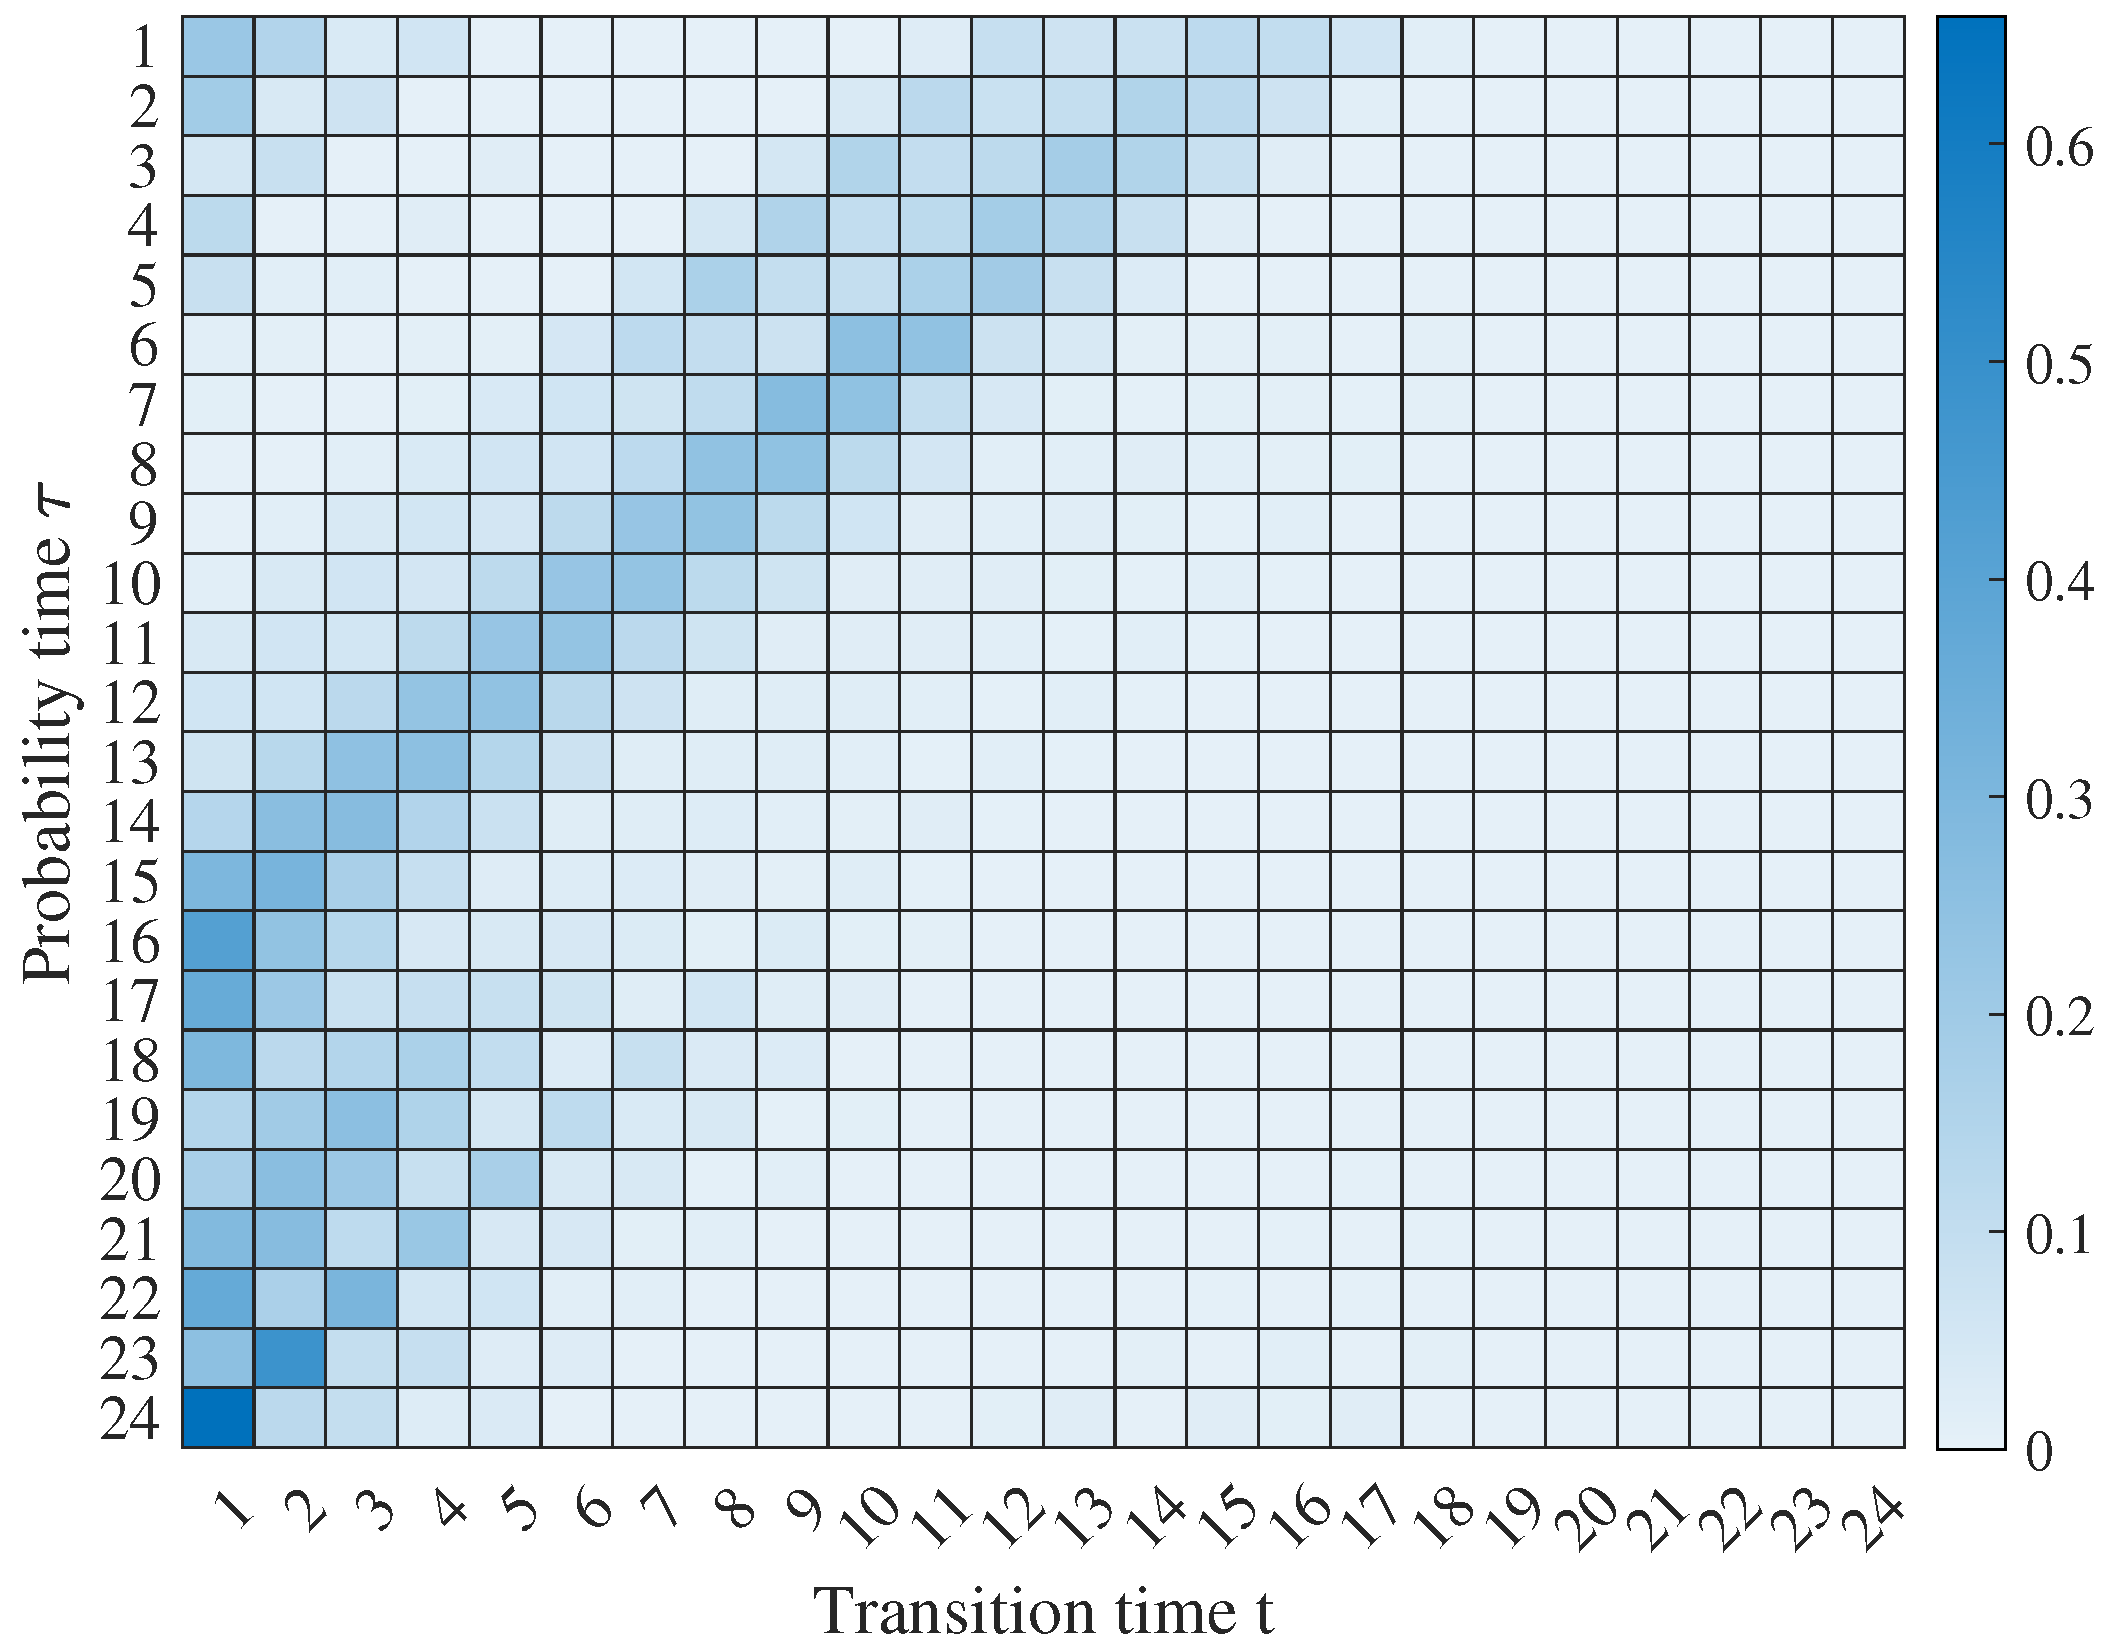
Using the dataset obtained from the survey, we estimate the transition probabilities at each hour. Figure 5 and Figure 6 show the transition probability λ 12 τ ( t ) and λ 21 τ ( t ) obtained from the survey, respectively. The y-axis refers to the probability time τ , i.e., the hour of the day the probability represent. The x-axis refers to the transition time t, i.e., after how many hours the transition occurs. The dark blue cells indicate a higher probability of the transition time. For example, the transition probability of an EV that is connected to the grid at 2 a.m. ( τ = 2 ) is depicted by the second row and the highest transition probability is at the fifth hour ( t = 5 ), meaning it is highly expected that the EV will be disconnected from the grid after 5 h (7 a.m.).
We observe that the transition probabilities shown in Figure 5 and Figure 6 identifies trends relate to the typical commuting time of the users. For instance, the working hours are depicted by the diagonal dark blue cells starting from τ = 1 , t = 6 to τ = 6 , t = 1 in Figure 5 and from τ = 6 , t = 11 to τ = 16 , t = 1 in Figure 6 indicating the daily work commute starts at 7 a.m. until 5 p.m. for most of the survey participants. Although we use simple scheduling model with two states, the model provides more information about the daily commutes of the users compared to other driving pattern models presented in [18,19,20]. For instance, the proposed model captures the possibility of having multiple trips by the same user at single day.

2.2.3. Distribution Network Model

We use a typical single-phase AC power flow to model the power system [22]. We model the upstream power system as an infinite slack bus with constant voltage magnitude and zero voltage angle. We use a single impedance model for the transformer and distribution cable, and model the loads as constant active and reactive power loads evaluated using the smart meter data of the residential consumers.

2.3. Simulation Layer

We use agent-based simulate to generate multiple scenarios using the EV demand model described in the modeling layer. Since the simulation depends on the responses from the survey and not on vehicles records or measurements, we assume each response represents a driver for the same vehicle all day. We also assume that the charging starts immediately when the vehicle is arrived at home and the EV charges at the rated power until the it is fully charged or disconnected. Moreover, we assume that the EV’s battery discharge at a constant rate when the EV is disconnected. In other words, the hourly EV consumption from the battery when the EV is disconnected is equal to the total daily consumption divided by the number of hours the EV is disconnected. This assumption is justified since we care about the charging pattern of EV. However, it might be inaccurate when the agent has more than one daily trips. The rest of this section describes the scenario generation and the energy calculation methods.

2.3.1. Scenarios Generation

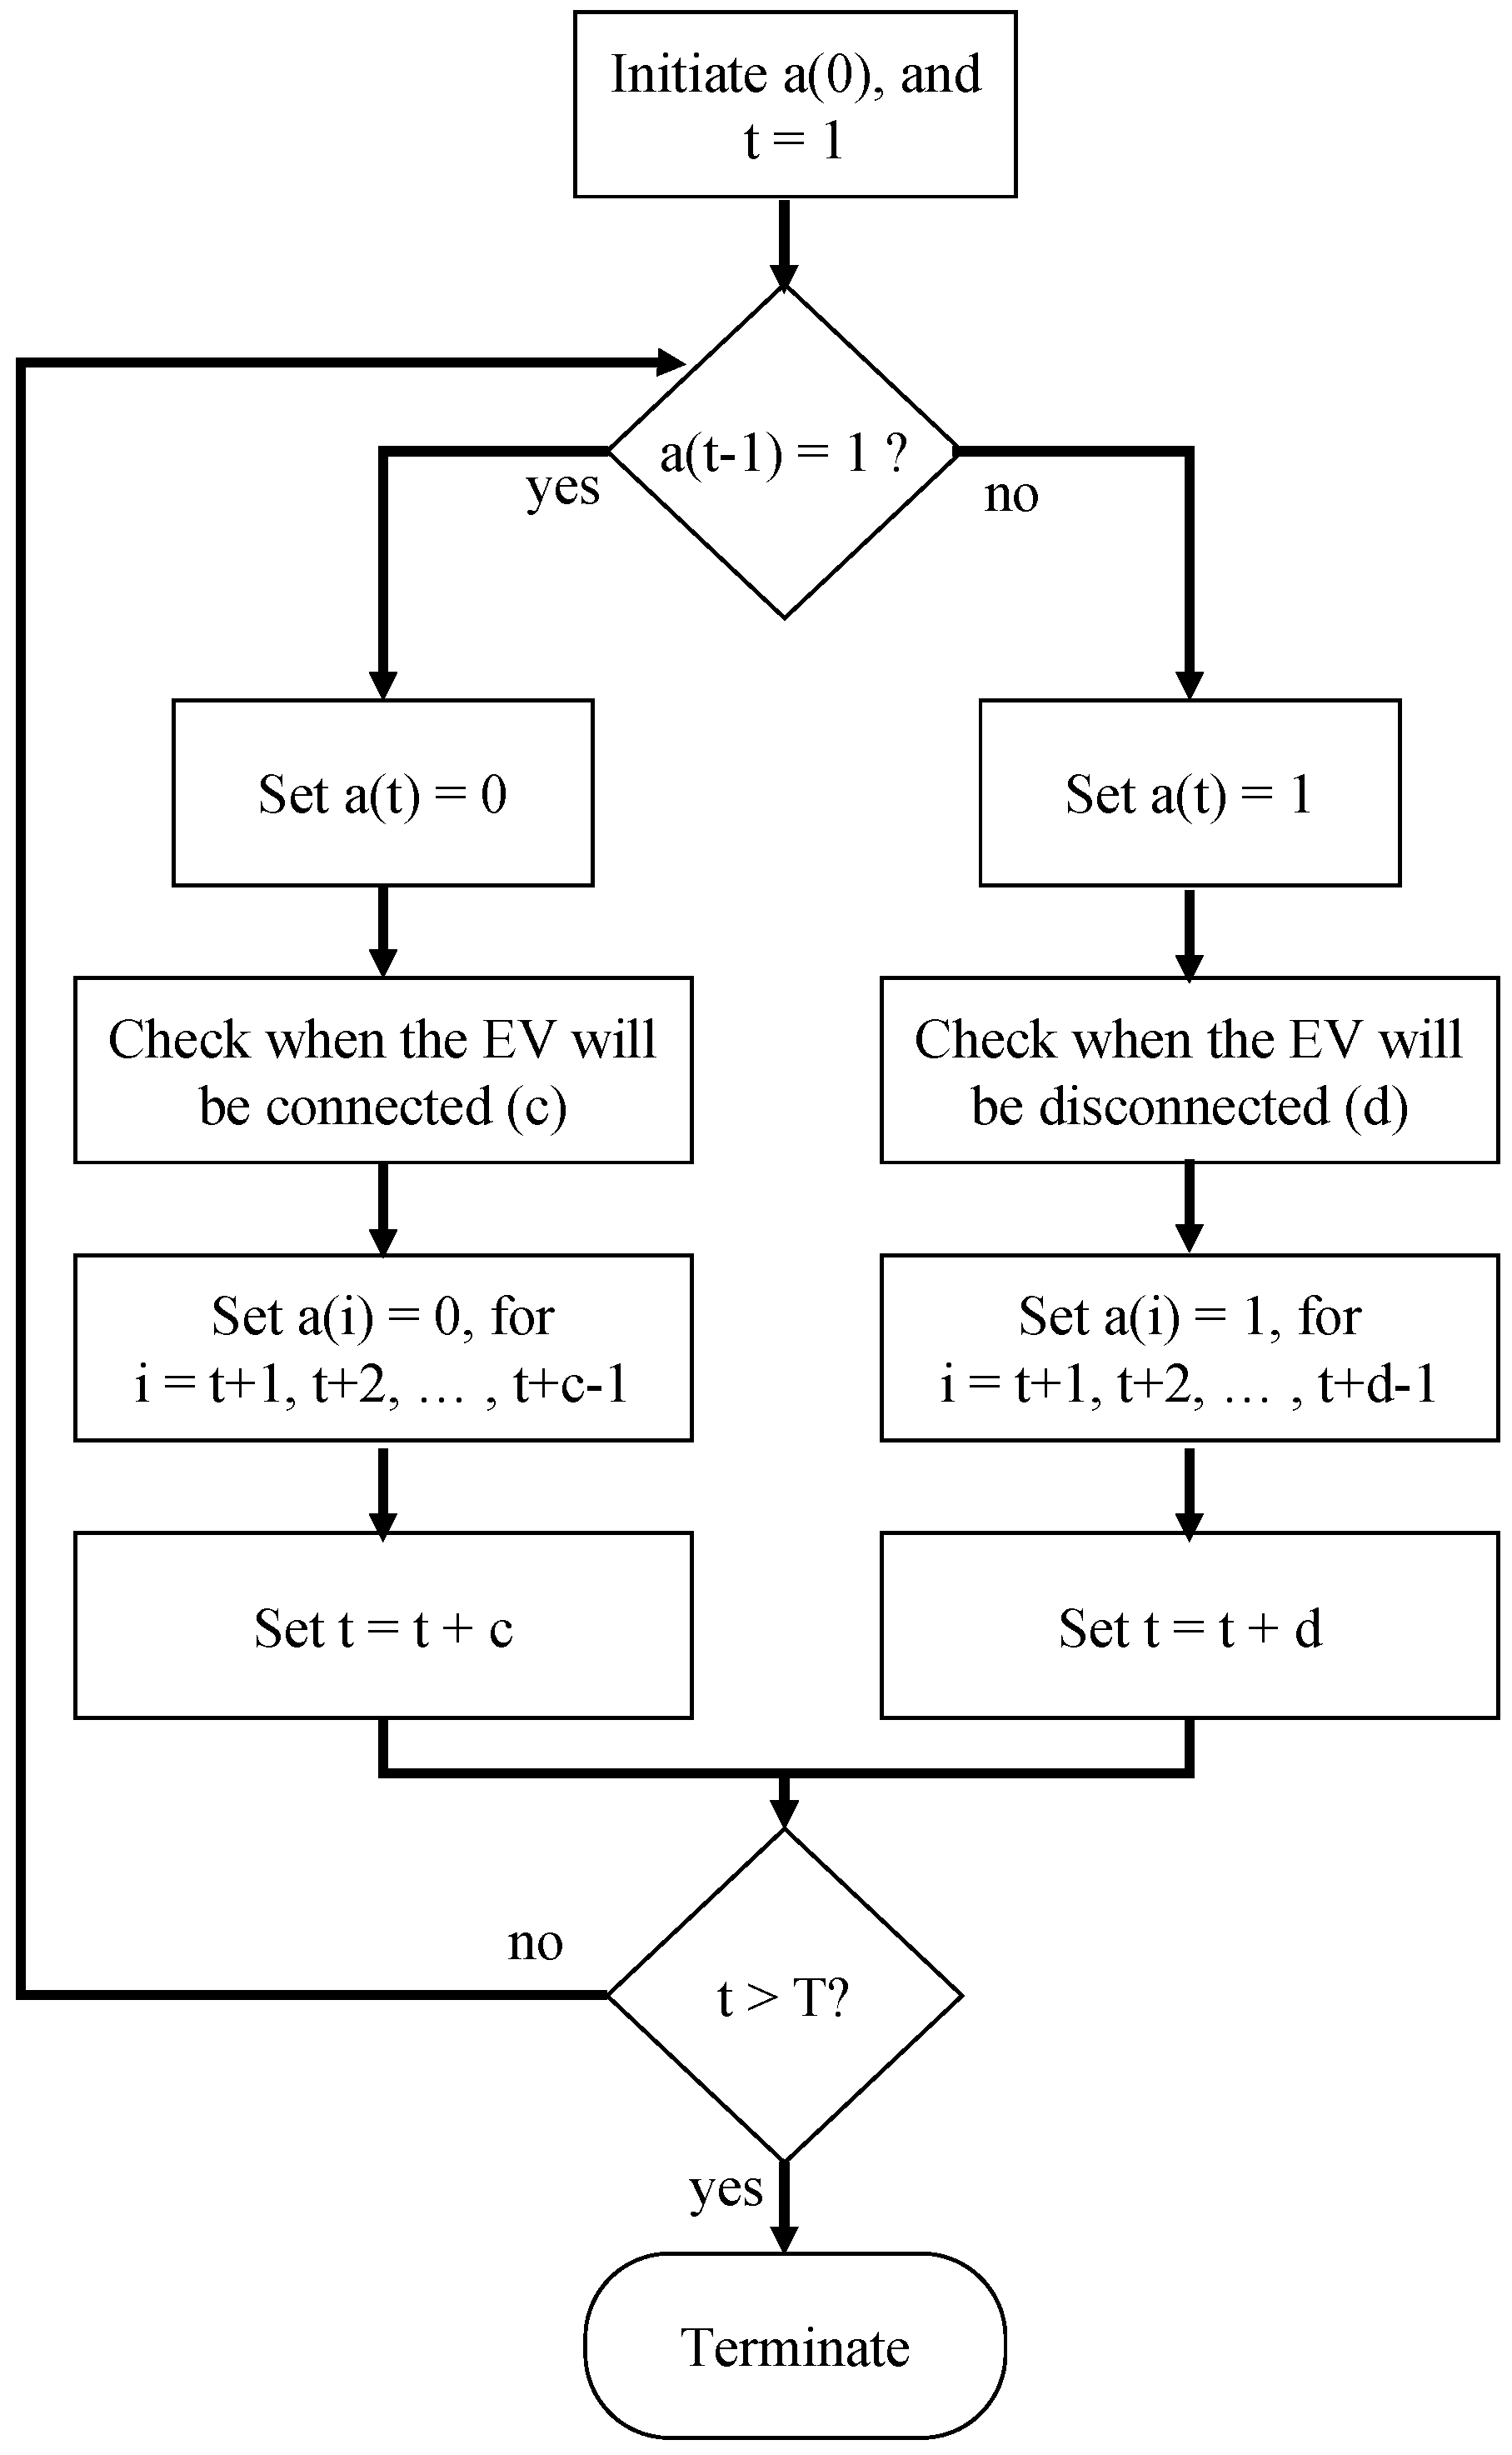
We use sequential MCS to generate multiple EV charging scheduling scenarios for each agent. We sample over the probability density function of the EV type, charging station, and daily travel distance for multiple agents to generate a single scenario. For charging schedule simulation, we introduce a binary state variable for each agent. Then, we initiate the first state by sampling over the probability of being at home at the first hour of the day. Once the initial state is assigned, we sample through the transition probability λ i j ( 0 ) to simulate the transition from state i to state j. Note that the transition probability is time dependent and change over the day. The output of the sampling over the transition probability is the duration that an agent takes to change the state. We repeats this process until completing a full-day profile as illustrated in the flowchart shown in Figure 7.
In the flowchart, we denote the state variables with a ( t ) and the simulation time horizon with T hours. Note that in the flowchart we initiate the value of the state a ( 1 ) by sampling over the probability of being connected or disconnected at the first hour, and set the value of state a ( 0 ) to be equal to the other state to make the illustration in the flowchart correct, e.g., if state a ( 1 ) = 1 , the state a ( 0 ) = 0 and the reverse is also true.

2.3.2. Energy Calculation

Once we identify the EV charging schedule, we calculate the energy consumption of each agent. We use (2) and (3) to calculate the State of Charge ( S o C ) of each agent at each time step.
S O C s ( t ) = S O C s ( t 1 ) + ( ( P s E s d s ( t 1 , t ) ) / C s ) ,
where S O C s ( t ) is the state of charge of agent s at time t. We denote the charging power with P s measured in kW, and set P s = 0 kW when the vehicle is disconnected or when the battery is fully charged. E s is the EV’s energy consumption in kWh/km. We denote the travel distance with d s ( t 1 , t ) measured in km and the EV’s battery capacity with C s in kWh. We approximate the value of energy derived from the battery to be equal at all timesteps when the EV is not connected as shown in (3).
d s ( t 1 , t ) = D s / T s ,
where D s is the total travel distance of agent s, and T s is the total time when agent s is not connected to the grid. We then calculate the energy consumption using (4).
E C s ( t ) = ( S O C s ( t ) S O C s ( t 1 ) ) C s ,
where E C s ( t ) is the energy consumption of agent s at time t. The overall process of the energy calculation is summarized in Algorithm 1. In Algorithm 1, we use the letters S to denote the set of all EVs, and T as the simulation time horizon.
Algorithm 1: Charging pattern simulation
1:
for s S do
2:
    Assign location
3:
    Assign EV type
4:
    Assign EV charging station type
5:
    Assign daily travel distance using (1)
6:
    Assign initial charging state ( a s ( 1 ) )
7:
    Generate charging scenario ( a s ( t ) , t T )
8:
     t 1
9:
    while  t T  do
10:
     if  a s ( t ) = 1  then
11:
       P s P r a t i n g
12:
     else
13:
       P s 0
14:
     end if
15:
     Calculate S O C s ( t ) using (2) and (3)
16:
     Calculate E C s ( t ) using (4)
17:
      t t + 1
18:
   end while
19:
end for
We observed that in few generated cases the EV stored energy is not adequate for some travel distance. If the simulation generates such a case, we eliminate that case and re-simulate another case with an agent that charges and discharges without violating the charging capacity limit. This reflects those people whom the charging capacity limit is not adequate for their driving pattern will not purchase EV in the first place.

2.3.3. Location Assignment

The EV distribution on the distribution network impacts the power flow and hence the voltage drop and the power losses. To identify the EV distribution on the power network, we first estimate a probability mass function for the number of cars for each household using the survey data. The probability mass function describes the maximum number of cars at a single location. We use the probability mass function to assign a number of cars at each location. In this case, each location will have a specific number of available cars that represent a possible location for an EV. We then use a uniformly random distribution to sample over all the available possible location to assign the location of the EVs based on the EVs deployment rate.

3. Results and Discussion

In this section, we present the results of applying the proposed method on the Saudi Arabia data. We first present and discuss the EVs deployment impact on the demand profile of Saudi Arabia at the system level. Then, we present the simulation results of the EVs deployment at the distribution network.

3.1. Impact on System Load Profile

To study the impact on Saudi Arabia’s power system, we first estimate the EVs demand. We generated 1000 scenarios and average the demand for each hour. The daily demand profile of 1 million EVs deployed in the electricity system of Saudi Arabia is shown in Figure 8. The results of this analysis are summarized in Table 3. The results indicates the EVs demand peaks at 5 p.m. during the weekdays and at 1 a.m. on the weekends. Further, the EVs demand during the weekdays is concentrated on the time between 2 p.m. to 8 p.m. when users return to home after work hours. While at the weekend, the demand is more dispersed over the whole days with a higher concentration between 11 p.m. and 6 a.m. Comparing this result with previous studies that use a deterministic demand model [11,13,14], the aggregate demand of EVs do not have sudden changes between consecutive hours. Moreover, the resultant demand is more dispersed over the day compared the results in [18,20], because the proposed model captures the possibility of having multiple trips which is not considered in those studies.
To estimate the system level EVs demand, we scale the average demand considering the total number of operated cars in Saudi Arabia. The total number of cars in Saudi Arabia in 2016 is estimated to be around 9.99 millions cars [23] and expected to reach 25 millions in 2030 [24]. To determine the peak change, we use a 10 millions active cars as a base number for the calculation. Further, we use the 2017 power consumption data of Saudi Arabia during the year’s peak. For the year 2017, the peak demand was on 22 August. Note that we use a different time to evaluate the system-level impact than the residential datasets. However, the evaluation of the system level and the distribution feeder impacts are independent of each other.
Table 4 shows the expected demand and peak changes with different EVs deployment rates. The results indicate for every 10% (1 million) increase in the EVs deployment rate, the power demand will increase by 1%, and the peak demand will increase by 2%. The daily demand profile with 10% (1 million) and 20% (2 millions) EVs deployment rates during the weekends and weekdays are shown in Figure 9.
Although the model estimates the EVs demand peaks at 5 p.m., the EVs demand contributes heavily to the daily peak demand since the demand peaks one hour earlier. The results also indicate that the EVs demand contributes to the peak demand more during the weekdays than the weekends.

3.2. Impact on Distribution Networks

In this part, we conduct a power flow analysis for 168-h (one week) to study the impact of EV’s on the distribution network. Using the survey data, the average number of cars in Saudi Arabia is 2.4 per household. So, we use the average number of cars per household to estimate the total number of cars in the feeder to be 149 cars. We generate 10,000 scenarios using the proposed models for the driving schedule, energy consumption, penetration levels, and charging station locations. For each scenario, we add the load profile of a given EV to the load profile of a base case (with zero EV deployment rate). Then, we run the power flow and evaluate the resulting load profiles, peak load, power losses, and voltage profiles. We use Matlab and Matpower library to solve the AC power flow [22].

3.2.1. Demand Profile

The demand profile of the single feeder with 20% of the cars are EVs (30 EVs) for the weekday and weekend are shown in Figure 10. The blue line shows the base case demand profile with no EVs, the bold black line is the average of all scenarios, and the shaded area represents the possible scenario that has been generated by one or more of the scenarios. The weekdays figure shows a clear pattern in the increase of the demand between 12 p.m. until 12 a.m. with high variability during the weekday. The scenarios average at this period of time is higher than the base case. The maximum difference is noticed at 5 p.m. with 6% increase in the demand. That suggests that the peak demand is likely to occur around 4 to 5 p.m., and will be amplified as the EVs deployment rate increases. The demand for the other period of time, between 12 a.m. to 12 p.m., is expected to be close to the base case with lower variability. During the weekends, the EV demand is more dispersed over the day with highest changes observed during the early morning hours between 12–6 a.m. The difference in the average scenarios demand and base case and variability of the demand are expected to increase as the EVs deployment rate increases.
The total daily demand of the feeder without EVs is 14.2 MWh. When the deployment rate of EVs increases by 1%, the the daily demand increase with rate of 0.1%. This implies that the feeders’ daily demand is 14.5 MWh when the deployment rate of EVs is 20%. Figure 11 shows the changes in the daily demand with respect to the EVs deployment rate.

3.2.2. Peak Change

One important characteristic of the demand profile for power system planning and operation is the peak demand. Here we are concerned about the peak magnitude change and peak time. Figure 12 shows the peak demand change with different EVs deployment rate. The result indicates a linear relationship between the deployment rate of EV and the mean peak demand of all scenarios. The variation of the peak demand between different scenarios increases as the deployment rate increase. The model suggests that an increase of 10% of EVs (15 EVs) by the 62 consumers will cause an increase of 16 kW peak. In other words, increasing the deployment rate of EV by 10% will increase the peak demand by 2.0% in average.

3.2.3. Power Losses

Another impact of EV deployment rate is on the power losses. The more EVs are used the more is the power losses. The relationship between the power losses and the deployment rate of EV is linear as Figure 13 shows. The results suggest that an increase of 1% in EVs deployment rate increases the daily power losses by 0.82 kWh (0.18%). Comparing this value with the base case we get a 10% increase in EVs deployment rate (15 EVs) leads to a 2% increase in the daily power losses.

3.2.4. Voltage Profile

As the deployment rate of EVs increases, the voltage drop increases on the distributed network. We calculate the minimum voltage magnitude values at each scenario as shown in Figure 14. We observe a linear reduction in the expected minimum bus voltage as the EVs deployment rate increases. This suggests that the impact of a high EVs deployment rate will not impact the voltage profile severely. However, this result is not conclusive as there might be clustering behavior in a specific location. To investigate this possibility, we consider the minimum voltage possibility as an approximate of the worst-case scenarios. The minimum bus voltage with 20% EVs deployment rate scenario is 0.937 p.u. compared to 0.942 p.u. obtained from averaging all scenarios.
The change in the distribution network performance metrics due to different EVs deployment rates is summarised in Table 5. As the table shows, with an extreme scenario of 100% EVs deployed, the daily demand will increase by 10%, while the peak demand and power losses will increase by 20%. We also observe that the voltage drop for the system under the study is not significant even when all the operating cars are EVs.

3.3. Sensitivity Analysis

For all the aforementioned results, we use 10,000 simulated scenarios. For each reported metric, we report the average value of all scenarios. The histograms of all simulated scenarios for the 20% EVs deployment rate of the daily demand, peak demand, power losses, and minimum voltage are shown in Figure 15. For the daily demand, peak demand, and power losses, the histogram of all scenarios follows a bell-curve shape. The variation of the minimum voltage for all scenarios follows a bell-curve shape with a tail. Although we only show the histograms of the 20% EVs deployment rate scenario in Figure 15 as a representative sample, the other scenarios have similar histograms.
To check the robustness of the model, we simulate 100,000 scenarios and check the difference with the 10,000 scenario results. We used the 20% EVs deployment rate in this comparison. The results show a difference lower than 0.9% on all the performance metrics we use to evaluate the impact on the distribution network as shown in Table 6. The largest error we found is the peak demand change with 0.89% error. These results support the robustness of using 10,000 scenarios in the simulation.

4. Conclusions

The impact of EVs on the power grid is inevitable. The large number of EVs significantly increases the demand for electricity and challenges the power system operation. In this paper, we developed a framework to study the impact of EVs demand on the power system. We use a probabilistic model and agent-based simulation to evaluate the EVs demand. The results indicate the peak demand increases by 3.4% when the deployment rate of EVs reaches 20% of the operating cars. We also show the impact of EVs on the distribution network using actual feeder data. The model shows that an increase of EVs deployment of 1% increases the daily demand of the distribution feeder by 0.1% and the peak demand and the power losses by 0.2%.
The proposed EVs demand model allows investigating the impact of EVs demand on different levels. Although we predicted a static EVs demand and run a steady-state analysis to evaluate the impact of EVs, we can utilize the model to evaluate the feasibility of smart charging schemes and optimization methods to schedule the EVs charging. In this study, we focus on evaluating the EVs demand impact at the system level and a residential feeder on the distribution network. We plan to extend the model to include the impact of EVs deployment on the transmission network by generalizing the impact of the feeder model and incorporating public charging stations on the power grid.

Author Contributions

Conceptualization, T.A., A.A. and M.A. (Mohannad Alkhraijah); Data curation, M.A. (Mohannad Alkhraijah), K.A. and S.A.; Formal analysis, T.A., A.A., M.A. (Mohannad Alkhraijah), K.A. and S.A.; Funding acquisition, T.A., A.A. and M.A. (Murad Anwar); Investigation, T.A., A.A., M.A. (Mohannad Alkhraijah), K.A. and S.A.; Methodology, T.A., A.A., M.A. (Mohannad Alkhraijah), K.A. and S.A.; Project administration, T.A., A.A. and M.A. (Murad Anwar); Software, T.A., M.A. (Mohannad Alkhraijah), K.A. and S.A.; Supervision, T.A., A.A. and M.A. (Murad Anwar); Validation, A.A., M.A. (Mohannad Alkhraijah), K.A. and S.A.; Visualization, M.A. (Mohannad Alkhraijah), K.A. and S.A.; Writing—original draft, A.A. and M.A. (Mohannad Alkhraijah); Writing—review & editing, T.A., A.A. and M.A. (Mohannad Alkhraijah). All authors have read and agreed to the published version of the manuscript.

Funding

This project has been financially supported and technically implemented by the Joint Research and Development Center for the Distribution Sector between King Abdulaziz City for Science and Technology (KACST) and Saudi Electricity Company (SEC).

Conflicts of Interest

The authors declare no conflict of interest.

Appendix A. Survey Data

The survey had 13 questions in Arabic language and covers question including anonymous driver basic information, type of accommodation, number of active cars per household, average daily distance, and daily travel pattern. The survey collected 662 responses. We checked and validate the primary dataset. Some responses were incomplete. Others had conflicting answers, for example, marking the same hours of the day as “at home” and “away”. We consider the response after cleaning the primary dataset. Out of the responses:
  • 38% were private sector employees, 32% were government civil workers and 9% were students
  • 45% were from Riyadh region, 25% from Makkah region and 15% from The Eastern region.
  • 49% live in an apartment, 32% in a multi-story villa, 10% single-story villa
  • The average monthly electricity bill was 100–500 SAR (26.7–133.3 $ US) for 43% of the participants, 500–1000 SAR (133.3–266.7 $ US) for 34% and 1000–2000 SAR (266.7–533.3 $ US) for 13%.
  • 35.65% own a single car, 23.41% own two cars, 18.43% own 3 cars, 10.27% own 4 cars, and 12.23 own 5 or more cars in single household.
  • 43.2% own small sedans, 40.63% own mid-size sedans 55.14% own mid-size SUVs, and 32.93% own large SUVs.
  • Figure A1 presents the percentage of survey participants who stay at home on weekdays and weekends for each hour.
  • Average daily travel distance is shown in Table A1.
Table A1. Responses to Travel Distance Question.
Distance (km)<2020–5050–100100–200>200
Number of Responses642602348519
Percentage (%)9.6739.2735.3512.842.87
Figure A1. Hours when participants stay at home during weekdays and weekend.
Energies 15 01180 g0a1

References

  1. International Energy Agency. Global EV Outlook 2021. Paris, France. Available online: https://www.iea.org/reports/global-ev-outlook-2021 (accessed on 20 January 2022).
  2. Hasan, S. Assessment of electric vehicle repurchase intention: A survey-based study on the Norwegian EV market. Transp. Res. Interdiscip. Perspect. 2021, 11, 100439. [Google Scholar] [CrossRef]
  3. Wappelhorst, S. The End of the Road? An Overview of Combustion-Engine Car Phase-Out Announcements Across Europe; International Council on Clean Transportation: Washington, DC, USA, 2020; Available online: https://theicct.org/sites/default/files/publications/Combustion-engine-phase-out-briefing-may11.2020.pdf (accessed on 20 January 2022).
  4. The White House: Statement and Releases. FACT SHEET: President Biden Announces Steps to Drive American Leadership Forward on Clean Cars and Trucks. Washington, DC, USA, 2020. Available online: https://www.whitehouse.gov/briefing-room/statements-releases/2021/08/05/fact-sheet-president-biden-announces-steps-to-drive-american-leadership-forward-on-clean-cars-and-trucks/ (accessed on 20 January 2022).
  5. Nereim, V. Saudi Arabia to Start Electric-Vehicle Push in Capital Riyadh. Bloomberg Green. 2021. Available online: https://www.bloomberg.com/news/articles/2021-10-23/saudi-arabia-to-start-electric-vehicle-push-in-capital-riyadh (accessed on 20 January 2022).
  6. Bowermaster, D.; Alexander, M.; Duvall, M. The Need for Charging: Evaluating utility infrastructures for electric vehicles while providing customer support. IEEE Electrif. Mag. 2017, 5, 59–67. [Google Scholar] [CrossRef]
  7. Hadley, S.W. Evaluating the impact of Plug-in Hybrid Electric Vehicles on regional electricity supplies. In Proceedings of the 2007 iREP Symposium—Bulk Power System Dynamics and Control—VII. Revitalizing Operational Reliability, Charleston, SC, USA, 19–24 August 2007; pp. 1–12. [Google Scholar]
  8. Fathabadi, H. Novel solar powered electric vehicle charging station with the capability of vehicle-to-grid. Sol. Energy 2017, 142, 136–143. [Google Scholar] [CrossRef]
  9. Mohamed, A.; Salehi, V.; Ma, T.; Mohammed, O. Real-Time Energy Management Algorithm for Plug-In Hybrid Electric Vehicle Charging Parks Involving Sustainable Energy. IEEE Trans. Sustain. Energy 2014, 5, 577–586. [Google Scholar] [CrossRef]
  10. Turker, H.; Bacha, S. Optimal Minimization of Plug-In Electric Vehicle Charging Cost With Vehicle-to-Home and Vehicle-to-Grid Concepts. IEEE Trans. Veh. Technol. 2018, 67, 10281–10292. [Google Scholar] [CrossRef]
  11. Rahman, S.; Shrestha, G. An investigation into the impact of electric vehicle load on the electric utility distribution system. IEEE Trans. Power Deliv. 1993, 8, 591–597. [Google Scholar] [CrossRef]
  12. Pieltain Fernández, L.; Gomez San Roman, T.; Cossent, R.; Mateo Domingo, C.; Frías, P. Assessment of the Impact of Plug-in Electric Vehicles on Distribution Networks. IEEE Trans. Power Syst. 2011, 26, 206–213. [Google Scholar] [CrossRef]
  13. Bosovic, A.; Music, M.; Sadovic, S. Analysis of the impacts of plug-in electric vehicle charging on the part of a real low voltage distribution network. In Proceedings of the 2015 IEEE Eindhoven PowerTech, Eindhoven, The Netherlands, 29 June–2 July 2015; pp. 1–5. [Google Scholar]
  14. Dubey, A.; Santoso, S. Electric Vehicle Charging on Residential Distribution Systems: Impacts and Mitigations. IEEE Access 2015, 3, 1871–1893. [Google Scholar] [CrossRef]
  15. Neaimeh, M.; Wardle, R.; Jenkins, A.M.; Yi, J.; Hill, G.; Lyons, P.F.; Hübner, Y.; Blythe, P.T.; Taylor, P.C. A probabilistic approach to combining smart meter and electric vehicle charging data to investigate distribution network impacts. Appl. Energy 2015, 157, 688–698. [Google Scholar] [CrossRef] [Green Version]
  16. Blythe, P.; Hill, G.; Huebner, Y.; Suresh, V.; Austin, J.; Gray, L.; Wardle, J. The north east england electric vehicle and infrastructure trials. World Electr. Veh. J. 2012, 5, 856–865. [Google Scholar] [CrossRef] [Green Version]
  17. Ul-Haq, A.; Cecati, C.; El-Saadany, E. Probabilistic modeling of electric vehicle charging pattern in a residential distribution network. Electr. Power Syst. Res. 2018, 157, 126–133. [Google Scholar] [CrossRef]
  18. Shafiee, S.; Fotuhi-Firuzabad, M.; Rastegar, M. Investigating the Impacts of Plug-in Hybrid Electric Vehicles on Power Distribution Systems. IEEE Trans. Smart Grid 2013, 4, 1351–1360. [Google Scholar] [CrossRef]
  19. Leou, R.C.; Su, C.L.; Lu, C.N. Stochastic Analyses of Electric Vehicle Charging Impacts on Distribution Network. IEEE Trans. Power Syst. 2014, 29, 1055–1063. [Google Scholar] [CrossRef]
  20. Pashajavid, E.; Golkar, M.A. Charging of plug-in electric vehicles: Stochastic modelling of load demand within domestic grids. In Proceedings of the 20th Iranian Conference on Electrical Engineering (ICEE2012), Tehran, Iran, 15–17 May 2012; pp. 535–539. [Google Scholar]
  21. Electric Vehicle Database. EV Database. 2021. Available online: https://ev-database.org (accessed on 20 January 2022).
  22. Zimmerman, R.D.; Murillo-Sánchez, C.E.; Thomas, R.J. MATPOWER: Steady-State Operations, Planning, and Analysis Tools for Power Systems Research and Education. IEEE Trans. Power Syst. 2011, 26, 12–19. [Google Scholar] [CrossRef] [Green Version]
  23. Dua, R. Estimating the Size and Efficiency of the Saudi Vehicle Fleet; King Abdullah Petroleum Studies and Research Center: Riyadh, Saudi Arabia, 2020; Available online: https://www.kapsarc.org/research/publications/estimating-the-size-and-efficiency-of-the-saudi-vehicle-fleet/ (accessed on 20 January 2022).
  24. Alriyadh Newspaper. 25 Million Active Car in Saudi Arabia’s Streets by 2030. Riyadh, Saudi Arabia, 2019. Available online: https://www.alriyadh.com/1736701 (accessed on 20 January 2022).
Figure 1. Methodology Flowchart.
Energies 15 01180 g001
Figure 2. Distribution network single line diagram.
Energies 15 01180 g002
Figure 3. Travel Distance Data and Probability Density Function.
Energies 15 01180 g003
Figure 4. Charging states diagram.
Energies 15 01180 g004
Figure 5. The transition probability from being connected to disconnected ( λ 12 τ ( t ) ).
Energies 15 01180 g005
Figure 6. The transition probability from being disconnected to connected ( λ 21 τ ( t ) ).
Energies 15 01180 g006
Figure 7. Charging schedule simulation flowchart.
Energies 15 01180 g007
Figure 8. Electricity demand in GW for 1 million EVs.
Energies 15 01180 g008
Figure 9. Demand profile on weekdays (left) and weekends (right) of Saudi Arabia grid with 10 and 20% EVs.
Energies 15 01180 g009
Figure 10. Demand profile on weekdays (left) and weekends (right) of the feeder with 20% EVs.
Energies 15 01180 g010
Figure 11. Feeder’s daily demand with different EVs deployment rates.
Energies 15 01180 g011
Figure 12. Feeder’s peak demand with different EVs deployment rates.
Energies 15 01180 g012
Figure 13. Power losses with different EVs deployment rates.
Energies 15 01180 g013
Figure 14. Daily minimum bus voltage with different EVs deployment rate.
Energies 15 01180 g014
Figure 15. The histograms of the change in daily demand (top-left), peak demand (top-right) power losses (bottom-left), and minimum voltage (bottom-right) of all simulated scenario with 20% EVs deployment rates.
Energies 15 01180 g015
Table 1. EV Types and Specifications.
EV TypeBattery Capacity
(kWh)
Energy Consumption
(kWh/km)
Charging Power
(kW)
Volkswagen e-Up32.30.1582.3–30
Nissan Leaf370.1642.3–40
Hyundai IONIQ38.30.1633.6–34
Tesla 3510.1552.3–47
Tesla Y700.1772.3–50
Table 2. EV Charging Level (EU Standards) [14].
Charging LevelVoltage LevelPower Level
Level 1230 VacUp to 4.6 kW
Level 2400 VacUp to 44 kW
Level 3 and DC480 Vdc50–150 kW
Table 3. Expected Power and Energy Addition of 1 million EVs.
DescriptionWeekdayWeekend
Peak demand (GW)1.351.35
Peak time5 p.m.1 a.m.
Daily energy consumption (MWh)430447
Table 4. Expected impact of EV’s on KSA system with 10 millions active car.
EV Deployment Rate (%)1020406080100
Daily EV Demand (GWh)9.6219.2538.4957.7476.9996.23
Demand Increase (%)0.971.943.875.817.749.68
EV Peak (GW)1.352.705.408.1010.8113.51
Peak Increase (GW)1.042.074.627.3210.0212.72
Peak Increase (%)1.713.427.6112.0616.5120.96
Table 5. Changes in Distribution Network Parameters.
Deployment Rate (%)1020406080100
Daily Demand (%)1.022.104.136.248.3310.37
Peak Demand (%)1.974.027.9111.9716.1120.32
Power Losses (%)1.723.587.1811.0415.0219.03
Minimum Voltage (%)−0.05−0.13−0.29−0.45−0.60−0.76
Table 6. Sensitivity Analysis Results.
Number of Scenarios10,000100,000Error (%)
Daily EV Demand (MWh)14.500314.50010.8920
Peak Demand (MW)0.83230.83220.0139
Average Daily Power Losses (kWh)445.7936445.79580.0005
Minimum Voltage (p.u.)0.94150.94150.0013
Publisher’s Note: MDPI stays neutral with regard to jurisdictional claims in published maps and institutional affiliations.

