Article

Smart Evaluation Index of Roof SHS Suitability

1
School of Urban Planning and Municipal Engineering, Xi’an Polytechnic University, Xi’an 710048, China
2
College of Optical and Electronic Technology, China Jiliang University, Hangzhou 310018, China
*
Authors to whom correspondence should be addressed.
Energies 2022, 15(3), 1164; https://doi.org/10.3390/en15031164
Submission received: 21 December 2021 / Revised: 19 January 2022 / Accepted: 31 January 2022 / Published: 4 February 2022
(This article belongs to the Topic Building Energy and Environment)

Abstract

:
The instability of solar energy and its resource distribution characteristics make it difficult to judge its suitability in practical engineering applications, which hinders its promotion and application. In order to better promote the effective use of solar energy and promote the solar heating system, it is necessary to put forward a simple method of judging the suitability of the solar heating system for engineering application. This study puts forward “F, Q” as the basis for judging the suitability of solar heating systems built on the roof. Two types of public buildings, office buildings and three-star hotels, are taken as the research objects. DeST software is used to change the heating area of the building by superimposing floors to simulate the heat load of the building when the heating area changes. A dynamic simulation coupling model of solar heating system is established in the TRNSYS software to analyze the operating status of the system under all working conditions. The functional relationship between “F, Q” and solar energy guarantee rate is established, and the solar energy contribution rate is divided into three regions of F < 30%, 30% ≤ F ≤ 50%, and F > 50%. The evaluation standard of the building suitability of the solar energy heating system is established according to the scope of “F, Q” in different regions (An office building for, e.g., if the contribution rate of solar heating system is required to be greater than 50%, the “F” of these four areas should be greater than 0.11388, 0.15543, 0.10572, and 0.04511.), and the effectiveness of “F” is verified through actual cases verified by other scholars in the research. The method proposed in this paper is helpful to judge the suitability of solar heating systems in different regions and different types of conventional buildings, so as to better promote solar heating systems.

1. Introduction

With the population growth and economic development, the global energy consumption is rapidly growing in recent decades. As one of the most energy-consuming areas, building energy consumption accounts for about 28% of China’s energy consumption [1,2], nearly 40% of which is related to heating, ventilation, and air-conditioning systems [3]. At present, the energy structure of is still dominated by fossil energy in China. The fossil energy not only brings great progress to industrial development, but also brings more and more serious environmental and climate problems [4]. In the context of low carbon, energy has become an issue of global consensus, how to ensure energy security and achieve the goal of “carbon peak, carbon neutralization” is the main problem the world faces. Energy saving and emission reduction in the field of buildings is the key to achieve the goal of carbon peak and carbon neutralization. Therefore, more and more attention has been paid to how to develop and utilize renewable energy in the field of architecture. Renewable energy includes solar energy, wind energy, geothermal energy, etc., among which solar energy is recognized as an important renewable energy because of its uniform distribution and cleanness. As a well-known form of solar thermal application, solar water-heating system accounts for 80% of the world’s solar thermal utilization [5]. Martinopoulos et al. [6] showed that although solar heating system is a mature technology, its market penetration and public acceptance are relatively low. Obviously, the instability of solar energy and the characteristics of its resource distribution make it difficult to judge its suitability in practical engineering applications, which hinder its promotion and application. Therefore, many scholars have studied and improved the solar energy collecting device and the heat storage device of the solar energy heating system [7,8,9].
In terms of suitability evaluation, Wang et al. [10] established the suitability assessment model of solar thermal system for residential buildings based on energy efficiency, economic, social, and environmental factors, according to the multi-attribute decision analysis method and GIS technology, and conducted a comprehensive evaluation of the suitability of solar thermal system for 31 provincial capital cities in China. Gassawd et al. [11] analyzed the regional, technical, and economic performance of solar hot-water systems throughout the United States. Hansen et al. [12] evaluated the potential of solar photothermal utilization and its impact on the energy systems of Germany, Austria, Italy, and Denmark by analyzing the existing energy system. Zhou et al. [13] studied the applicability of daily total solar radiation calculation models for different climate regions in China, and determined the most suitable model form for each climate region. Based on this model, a general calculation model of the daily total solar radiation applicable to different climatic regions in China was established.
In addition, there are many studies that evaluate the suitability of a particular solar water-heating system. Chen et al. [14] proposed a comprehensive evaluation method for regional adaptability of solar hot-water systems in college bathrooms, and evaluated the regional adaptability of 33 provincial capitals in China. Raisul et al. [15] analyzed the performance characteristics of different types of solar hot-water systems, and analyzed their economy. Stefano et al. [16] studied the economic benefits and main performance indicators for evaluating solar heating systems, and proposed an economic comparison based on deterministic systems for optimization. The results show that with the decrease in heating dates and the increase in solar energy resources, the benefits generated by solar heating have been significantly improved.
Comprehensive analysis of existing studies shows that most of the current studies on the suitability of solar heating systems focus on regional suitability analysis and the analysis and evaluation of the suitability of a specific solar hot water system [17,18,19,20]. In practical engineering, the judgment of the suitability of solar heating systems often involves multiple factors, such as local meteorological conditions, building types, heating area, and system characteristics, which brings certain difficulties to engineering applications. In order to solve the above problems, a simple index F for evaluating suitability is proposed, and the research method is as follows: take two types of public buildings, an office building and a three-star hotel, as the research object; maintain the same heating area; change the floor number to change the heating area; analyze the solar energy contribution rate of the building when the heating area changes; and evaluate the building suitability.

2. Proposal of Simple Evaluation Index

Two types of public buildings, an office building and a three-star hotel, as the research object, in order to analyze the change rule of solar energy contribution rate when the heating area changes. Modeling in the DeST software, the simulation building is gradually superimposed from one layer to ten layers by stacking the floor, and the heating area also increases regularly. In the process of overlaying the floor, the area of the top floor of the building remains unchanged, and the area of the solar collector laid on the top floor of the building remains unchanged. This paper analyzes the solar energy contribution rate of the building when its heating area changes, and evaluates the SHS suitability.

2.1. Ratio of Solar Collecting Heat to Building Heating Load

According to the Technical Standards for Solar Heating Engineering [21], the total area of solar collectors of a direct solar heating system with short-term heat storage shall be calculated according to Formula (1):
A c = 86400 Q J f J T η cd 1 η L  
In the formula:
A c —short-term direct thermal storage system collector total area, m2;
Q J —Design load of solar collector system, W;
J T —Average daily solar irradiation in December on the lighting surface of the local collector, [J/(m2·d)];
f Solar energy guarantee rate, %;
η cd —Average collector efficiency based on total area, %;
η L —Heat loss rate of pipelines and heat storage devices, %.
According to the above formula, the contribution rate of solar system is proportional to the heat collected by solar collector and inversely proportional to the building heat load. Additionally, “Solar Heating Engineering Technical Standards” determines the richness of solar energy resources by solar energy contribution rate, as shown in Table 1 [21].
Based on the above, the ratio of heat collection to building heat load can be used as the basis to judge the building suitability of solar heating system. The collector heat load ratio “Q” is proposed as (2).
Q = S j H j  
In the formula:
Q—the ratio of the total heat collected by the Q-solar collector to the cumulative heat load of the building;
S j —Total heat collected by solar collector in heating season, kW·h;
H j —Building heat load, namely cumulative heat load of building in heating season, kW·h.
When the “Q” increases or decreases, the change also presents certain correlation and regularity with the change of solar energy contribution rate of the building. Therefore, “Q” can be used as a variable to analyze and evaluate the building suitability of solar heating system by analyzing the relationship between “Q” and solar energy contribution rate.

2.2. Ratio of Solar Collector Effective Area to Building Heating Area

Since the calculation of “Q” requires the heat collected by the solar collector and the building heat load, the calculation of these two parameters is more complicated when achieving the accurate results. For most conventional buildings, the building heat load will change regularly when the heating area is changed without considering the effect of the shape coefficient. When the solar collector area changes, it will affect the heat collected by the solar system. Both of the changes will ultimately change the contribution of the overall solar heating system.
Based on the above, the index of “F” is proposed,
F = A j S t  
In the formula:
F—the ratio of solar collector effective area to building heating area;
A j —total effective area of solar collector on top floor of building, m2;
S t —building heating area, m2.
The building suitability of SHS could be evaluated by the relationship between “F” and solar contribution rate.

3. Research Methods and Purposes

In this paper, two index of “F” and “Q” are proposed to evaluate the suitability of solar heating system in different regions and different types of conventional buildings. The specific research process is as follows:
(1)
Building model is established in DeST software, and two types of public buildings, an office building and a three-star hotel, are taken as the research objects. The specific parameter settings are shown in Table 2.
Changing the heating area by overlaying it from one floor to ten floors, ten groups of incremental data are obtained. Four cities with different abundance of solar energy resources (Hanzhong, Xi’an, Xining, and Lhasa) are selected to simulate the heat load of the two types of buildings by DeST software, and the hourly heat load, hourly unit area heat load index, and the maximum heat load in heating season under different conditions are obtained.
(2)
According to the requirements of this research, the corresponding solar heating system is designed, as shown in Figure 1a, which is mainly composed of solar collector array, plate heat exchanger, heat pump, heat exchange pump, heat storage water tank, auxiliary heat source, heat pump, and indoor heating terminal. The solar energy heating system converts solar energy into heat energy by solar collector, and stores solar radiation energy by regenerative water tank, when the regenerative water tank reaches the heating temperature, the indoor heat shall be supplied, and when the regenerative temperature of the regenerative water tank does not meet the heating requirements, the supplementary heat shall be supplied by the auxiliary heat source; when the temperature of the water tank is less than the temperature of the backwater, the heating backwater shall be directly reheated by the auxiliary heat source, and the regenerative water tank shall not participate in the heating process.
According to the designed solar heating system, the dynamic simulation coupling model is established in TRNSYS software, as shown in Figure 1b. The operation state of the solar heating system is analyzed when the heating area changes, and the parameters characterizing the performance of the system, such as fluid temperature, flow rate, and auxiliary heat source heating, are obtained.
(3)
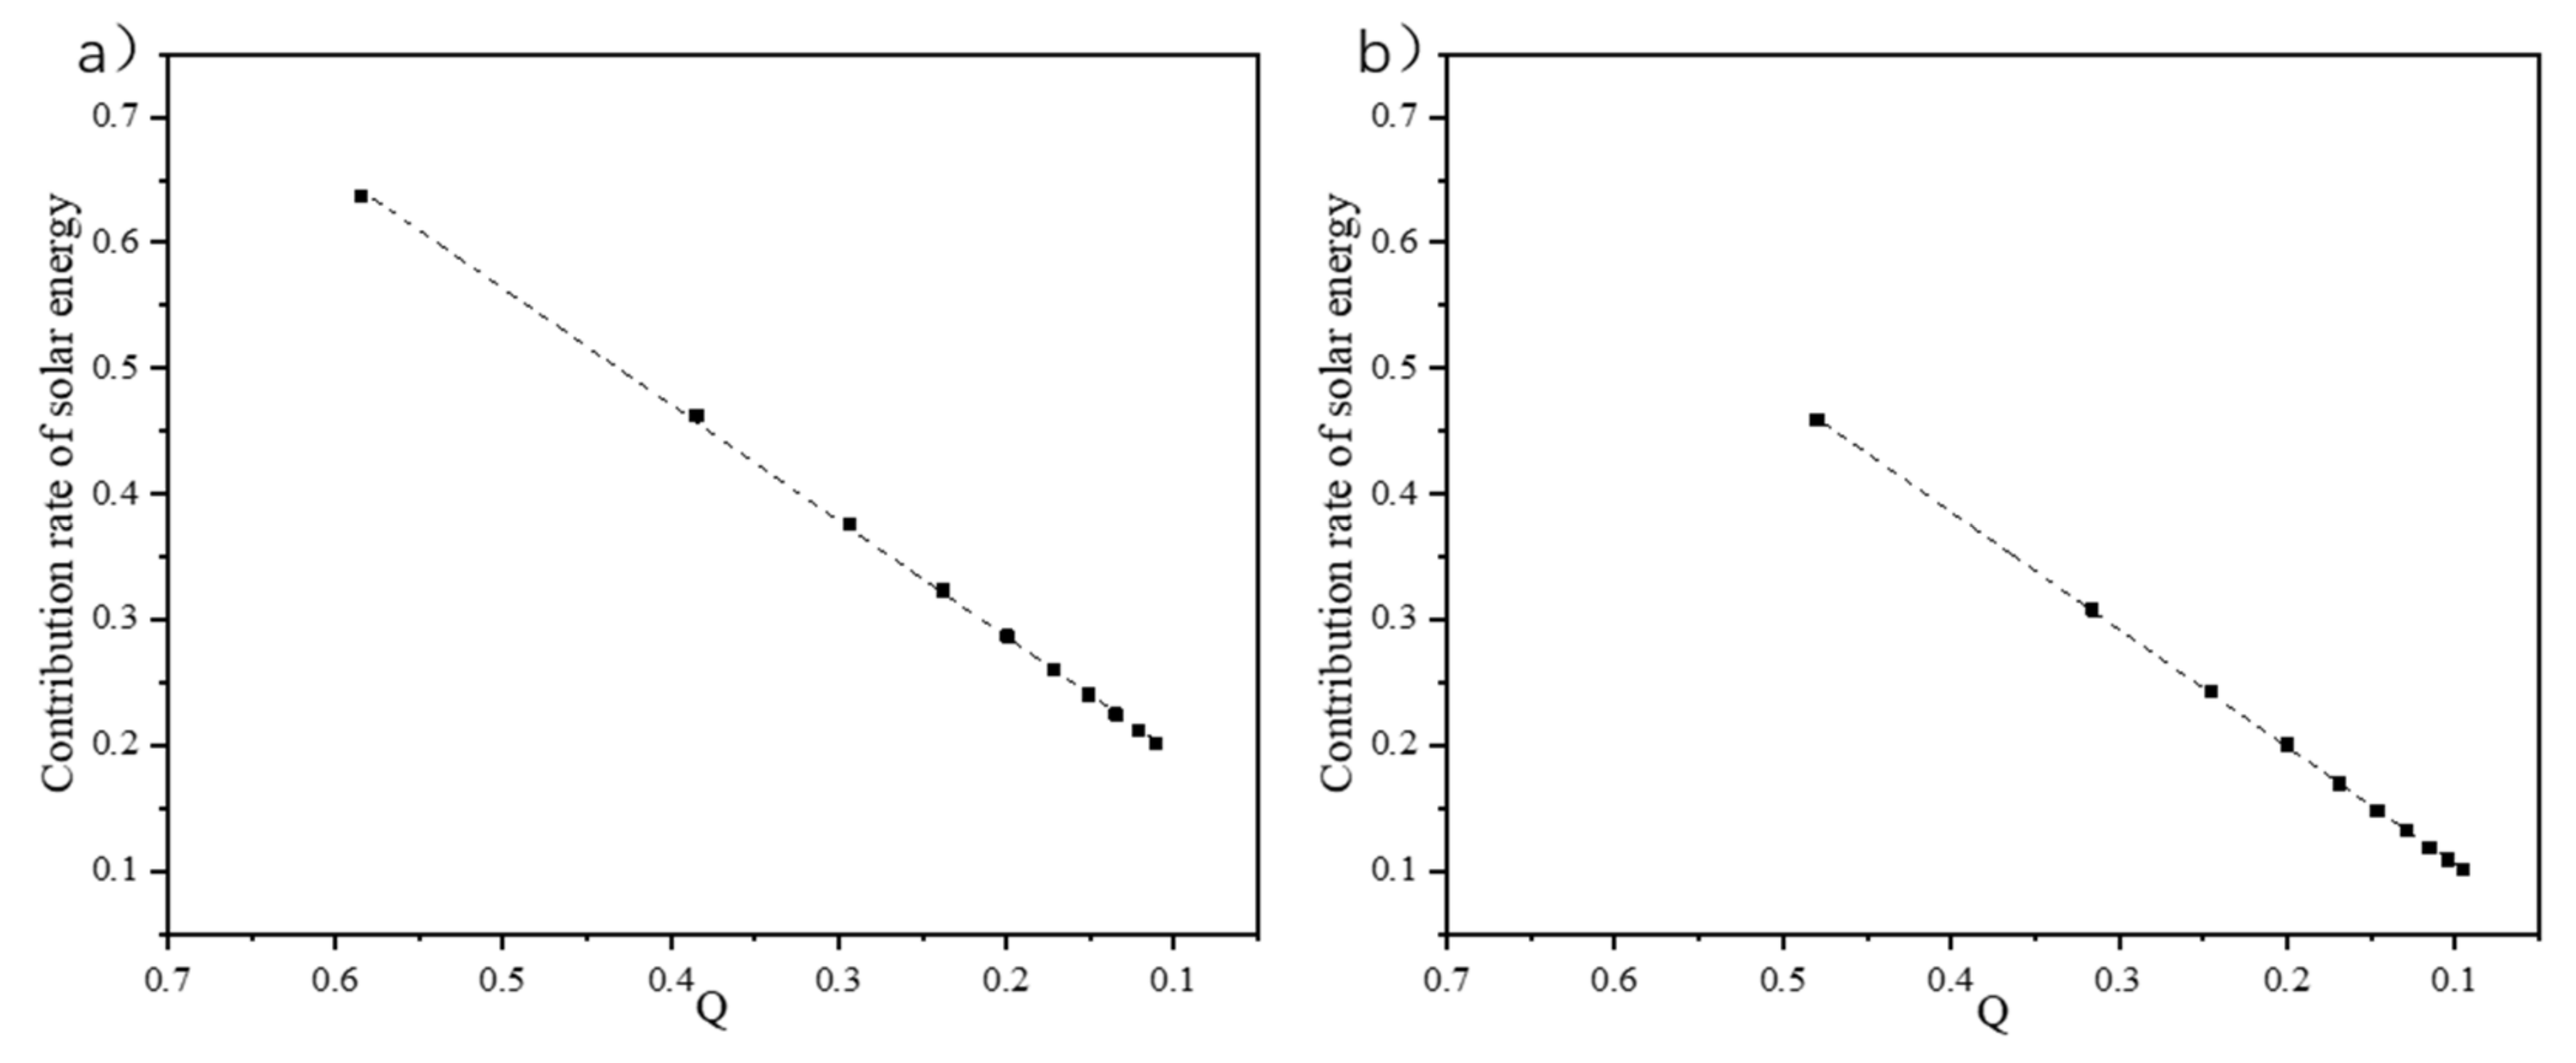
By processing and calculating the data obtained in the first and second steps, ten groups of “F, Q” and their corresponding solar contribution rates are obtained, respectively; the functional relationship between “F, Q” and solar energy contribution rate is established by fitting regression.
The mathematical models used in the regression analysis of this study are mainly as follows:
(1)
Logarithmic regression formula model:
y = a ln x + b  
(2)
Unitary linear regression formula model:
y = ax + b  
According to the Technical Standard of Solar Heating Engineering, the contribution rate of solar energy is divided into three regions, and the range of “F, Q” is determined by the established function relationship [21].

4. System Operation Status and Suitability

4.1. Solar Energy Contribution Rate in Xi’an

Taking Xi’an as an example, an architectural model is established in DeST software, and two types of public buildings, an office building and a three-star hotel, are the research objects. According to the preliminary design conditions, the heating end is selected as the hot water floor radiation, and the inlet water temperature is 40 °C. The layout of the solar collectors should consider the placement of the roof area, and, finally, 120 collectors were arranged. The effective heat collection area is 1.92 m2, and every 4 blocks are connected in series. According to the “Technical Specification for Solar Heating Engineering”, the hot water storage tank is selected as a 100 L/square meter heat collector, and the total hot water storage tank is 25 m3. The operation status of the same solar heating system in two different types of buildings is analyzed [21].
The area of each floor remains the same, and when the heating area gradually increases from one floor to ten floors by superimposing floors, the “F” keeps shrinking and keeps approaching zero.
Figure 2a,b show the variation trend of building thermal load, auxiliary heating, and solar heat collection when “F” is taken as an independent variable for two types of buildings, and office building and a three-star hotel. It can be seen that the three kinds of heat are gradually increasing, but with the decrease in “F”, the building heat load, and the auxiliary heat increase rapidly, while the change of solar heat collection is small. This is mainly because the volume of the building increases in the process of stacking floors but the area of the top floor does not change, that is, the total area of solar collectors laid on the top floor remains the same, so the growth of solar heat collection is limited and the change is small.
Figure 2c,d show the changing trend of the solar energy contribution rate of two types of buildings, an office building and a three-star hotel, with the decrease in “F”. The mathematical model is established by fitting regression to the data of ten coordinate points in the figure, and the corresponding regression equation and R2 (coefficient of determination) are obtained.
Among them, the solar energy contribution rate of an office building when “F” is the independent variable, the change trend is determined by regression analysis as shown in Figure 2c, and the corresponding regression equation and R2 are as follows:
y = 0.1914ln(x) + 0.8563
R2 = 0.9746
The solar energy guarantee rate of three-star hotel with “F” as the independent variable, through regression analysis to determine the trend as shown in Figure 2d, the corresponding regression equation and R2 are as follows:
y = 0.1562ln(x) + 0.6344
R2 = 0.9716
Figure 3a,b show the change trend of the solar energy contribution rate of the two types of buildings as “Q” decreases. By fitting regression to the data of ten coordinate points in the figure, the corresponding linear regression equation and R2 are established and obtained.
Among them, the solar energy contribution rate of an office building when “Q” is used as the independent variable, the change trend is determined by regression analysis as shown in Figure 3a, and the corresponding regression equation and R2 are as follows:
y = 0.9247x + 0.1012R2 = 0.9995
R2 = 0.9995
The solar energy contribution rate of a three-star hotel with “Q” as the independent variable, through regression analysis to determine the trend as shown in Figure 3b, the corresponding regression equation and R2 are as follows:
y = 0.9349x + 0.0117
R2 = 0.9999
From Figure 2 and Figure 3, it can be seen that with the decrease in “F/Q”, the solar energy contribution rate of the two buildings shows a downward trend. However, the difference is that the mathematical model established when fitting regression to the change of solar energy contribution rate with “F” as the independent variable is the logarithmic regression equation; the mathematical model established with “Q” as the independent variable is the unary linear regression equation. That is, under the condition of “F” and “Q” as independent variables, the solar energy contribution rate presents two different trends. As the calculation of solar energy contribution rate is more complicated, the calculation of “F/Q” is relatively simple. Therefore, after establishing the functional relationship between “F, Q” and solar energy contribution rate, the range of solar energy contribution rate can be determined by calculating “F” or “Q”, so as to make a simple evaluation of the building suitability of solar heating system.

4.2. Analysis of Building Suitability of Solar Heating System

Based on the above conclusions, this study selected four cities: Hanzhong, Xi’an, Xining, and Lhasa, and evaluated and judged the suitability of solar heating systems in the local buildings using “F” and “Q” methods, and analyzed and compared the pros and cons of the two methods.
Figure 4a,b, respectively show the analysis results of the solar energy contribution rate of office buildings and three-star hotels in the four regions when “F” is used as the independent variable. According to the “Technical Specification for Solar Heating Engineering”, the contribution rate of solar energy can be divided into three regions [21],
(1)
The area where the value of solar energy contribution rate is less than 0.3;
(2)
The area where the value of solar contribution rate is between 0.3 and 0.5;
(3)
It is the area where the value of solar energy contribution rate is greater than 0.5.
The greater the value of the solar energy contribution rate, the better the suitability of the building for the solar heating system.
Regression analysis was performed on the solar energy contribution rate of the four regions when “F” was used as the independent variable, and the fitted curve is shown in Figure 4. The established mathematical model, and the regression equation and R2 obtained are shown in Table A1 in Appendix A.
When the solar energy contribution rate is divided into the three regions of “(1) (2) (3)”, the value of “F” can be inversely deduced through the established functional relationship to determine the range of “F” in the three regions. According to the mathematical model established in Table A1 in the Appendix A, the “F” range of each region is derived, and the results are shown in Table A2 in the Appendix A.
Table A2 divides the “F” of the two types of buildings in the four regions, that is, the ratio of the area of the collector to the heating area. Take the office building in Xi’an as an example, when F < 0.05467, it can be judged that the solar energy contribution rate of the building is less than 30%; when 0.05467 ≤ F ≤ 0.15543, it can be judged that the solar energy contribution rate of the building is within the range of 30~50%; when F > 0.15543, it can be judged that the solar energy contribution rate of the building is greater than 50%. Therefore, in actual engineering, a preliminary judgment can be made on the suitability of the building’s solar heating system by calculating the “F” of the building.
When “Q” is used as the independent variable, and the relationship between “Q” and solar energy contribution rate is analyzed, the suitability of the building for solar heating system can also be judged accordingly.
Figure 5 and Figure 6, respectively show the analysis results of the solar energy contribution rate of office building and three-star hotels in the four regions when “Q” is used as the independent variable. Divide the solar energy contribution rate into the same three regions as above, and perform regression analysis on the solar energy contribution rate of the four regions when “Q” is used as the independent variable. The fitted curves are shown in Figure 5 and Figure 6. Additionally, the mathematical model was established and the regression equation and R2 were obtained as shown in Table A3 in Appendix A.
From the above, the contribution rate of solar energy is divided into three areas “(1)(2)(3)”, and the value of “Q” can be deduced through the established functional relationship to determine “Q” in the three areas. Range from the mathematical model established in Table A3, the range of “Q” in each area is deduced, and the results are shown in Table A4 in the Appendix A.
Table A4 divides the “Q” of the two types of buildings in the four regions, that is, the “ratio of solar heat collection to building heat load”. Take the office building in Xi’an as an example. When Q < 0.21499, it can be judged that the solar energy contribution rate of the building is less than 30%; when 0.21499 ≤ Q ≤ 0.43128, it can be judged that the solar energy contribution rate of the building is within the range of 30–50%; When Q > 0.43128, it can be judged that the solar energy contribution rate of the building is greater than 50%. Therefore, in actual engineering, a preliminary judgment can be made on the suitability of the building’s solar heating system by calculating the “Q” of the building.

4.3. Case Validation

In this study, the effectiveness of the proposed method is verified by referring to the case of solar heating system in the research results of other scholars, and according to the functional relationship established in the proposed method.
According to Li Yue, Long T, and other scholars’ research on solar heating systems, the research objects are all office buildings in the Lhasa area [22,23,24]. As can be seen from the above, when “F” is used as the basis for judging office buildings in Lhasa, the established regression equation is as follows:
y = 0.2127ln(x) + 1.1591
R2 = 0.9838
The results obtained according to the regression equation established in this study and the solar contribution rates obtained by other scholars in the case studies verified by actual measurements are shown in Table 3:
It can be seen that there are some errors between the solar contribution rate calculated by the method based on “F” proposed in this study and the research results verified by other scholars through actual measurement, but they are basically consistent. It can be seen that the evaluation criteria based on the method proposed in this study have certain reference value.
The deviations may be caused by the following problems: (1) The main work of this study is simulation calculation. Due to the limitations of simulation software, there may be deviations from the experimental results in reality; (2) The indoor parameters of the building model used in this study are set according to the specifications, but in actual cases, the interior design parameters of the same type and different buildings, such as personnel, equipment, and lighting, may not be exactly the same, which will affect the calculation of the building thermal load; (3) There may be some differences between the solar heating system used in the actual case and the solar heating system designed in this study.

4.4. Discussion

Through the above research results, the pros and cons of the two methods “F” and “Q” for evaluating the suitability of solar heating systems are compared, and the following conclusions are obtained:
(1)
Compared with “F”, the calculation of “Q” is more complicated. This is mainly because “F” is the ratio of the area of the solar collector to the heating area, and “Q” is the ratio of the solar heat collection to the heat load of the building. The calculation of the area of the solar collector and the heating area is relatively simple, while the calculation of the solar heat collection and the heat load of the building in the actual project is more cumbersome;
(2)
By comparing the R2 value (coefficient of determination) of the regression equations in Table A1 and Table A3, it can be found that the regression equation fitted is better when analyzing the contribution rate of solar energy with “Q” as the independent variable. That is, compared with “F”, the regression equation with “Q” as the independent variable is more accurate in judging the solar energy contribution rate;
(3)
Compared with “Q”, “F” is more limited. This is mainly because “F” is used as an independent variable to judge the suitability of solar heating systems, at present, it can only be temporarily applied to conventional buildings with similar body shape coefficients. The difference between the shape coefficients of buildings with the same volume will affect the judgment of the building’s heat load, which will increase the error of the solar energy contribution rate and make the accuracy of the regression equation obtained with “F” as the independent variable worse.

5. Conclusions

In this paper, the building model is established by DeST software, and the dynamic simulation model of solar heating system is established by TRNSYS software. In the process of analyzing the architectural suitability of solar heating systems in the four cities of Hanzhong, Xi’an, Xining, and Lhasa based on simulation data, the following research results have been mainly achieved:
(1)
The indexes of “F/Q” are proposed as a basis for judging the suitability of solar heating systems;
(2)
In the DeST simulation software, the heating area is changed by superimposing the floors, and the simulated building is superimposed from one to ten to make the “F/Q” change regularly, and the TRNSYS software is used to analyze and obtain the corresponding solar energy contribution rate. Establish the functional relationship between “F/Q” and solar energy contribution rate by fitting regression, and the results are shown in Table A1 and Table A3;
(3)
The solar energy contribution rate is divided into three regions of F < 30%, 30% ≤ F ≤ 50%, and F > 50%. The value of “F,Q” is inversely deduced through the functional relationship between “F/Q” and solar energy contribution rate, and the range of “F/Q” in the three divided regions is determined. The results are shown in Table A2 and Table A4. (Take an office building, for example, when the contribution rate of solar heating system is less than 30%, “F” of Hanzhong, Xi ‘an, Xining and Lhasa is less than 0.00919, 0.01166, 0.00932, and 0.00361, respectively. If the contribution rate of solar heating system is required to be greater than 50%, the “F” of these four areas should be greater than 0.11388, 0.15543, 0.10572, and 0.04511. Additionally, for a three-star hotel, the “Q” should be, respectively, greater than 0.52302, 0.52230, 0.51001, and 0.52379 when it is required to be greater than 50%).
(4)
The validity of the “F” proposed in this study is verified by comparison with the actual cases verified by other scholars in their studies. It can be seen that the method proposed in this study has certain reference value and provides a new idea for the suitability evaluation of solar heating system.
This paper puts forward “F” and “Q” as the simple method for judging the contribution rate of roof solar heating system built. It is helpful to better analyze and evaluate the suitability of solar heating system in different types of conventional buildings in actual projects, so as to better promote solar heating system and promote its application in winter heating.

Author Contributions

Conceptualization, J.Z. and P.L.; methodology, J.Z.; software, Y.B.; validation, P.L., T.Q. and J.G.; formal analysis, Y.B.; resources, J.Z.; data curation, Y.B.; writing—original draft preparation, J.Z. and Y.B.; writing—review and editing, J.G.; visualization, T.Q.; supervision, P.L.; project administration, P.L.; funding acquisition, Xi’an Polytechnic University. All authors have read and agreed to the published version of the manuscript.

Funding

This research was funded by [Xi’an Polytechnic University], grant number [107020491].

Data Availability Statement

Not applicable.

Conflicts of Interest

The authors declare no conflict of interest.

Appendix A

Table A1. The mathematical model established when F is the independent variable.
Building TypeCityRegression Equation
y = a*ln(x) +b
Standard ErrorR2 (Decision Coefficient)
Office buildingHanzhongy = 0.2074ln(x) + 0.9506a ± 0.00841
b ± 0.02412
R2 = 0.987
Xi’any = 0.1914ln(x) + 0.8563a ± 0.01093
b ± 0.03138
R2 = 0.9746
Xiningy = 0.228ln(x) + 1.0123a ± 0.01291
b ± 0.03707
R2 = 0.975
Lhasay = 0.2127ln(x) + 1.1591a ± 0.00964
b ± 0.02766
R2 = 0.9838
Three-star hotelHanzhongy = 0.1781ln(x) + 0.7391a ± 0.00918
b ± 0.02634
R2 = 0.9792
Xi’any = 0.1562ln(x) + 0.6344a ± 0.00945
b ± 0.02712
R2 = 0.9716
Xiningy = 0.1872ln(x) + 0.7559a ± 0.012
b ± 0.03443
R2 = 0.9682
Lhasay = 0.2147ln(x) + 1.0818a ± 0.00729
b ± 0.02091
R2 = 0.9909
Table A2. Results of regional division using F for two types of buildings.
Building TypeCity(1)(2)(3)
Office buildingHanzhongF < 0.009190.04342 ≤ F ≤ 0.11388F > 0.11388
Xi’anF < 0.011660.05467 ≤ F ≤ 0.15543F > 0.15543
XiningF < 0.009320.04398 ≤ F ≤ 0.10572F > 0.10572
LhasaF < 0.003610.01761 ≤ F ≤ 0.04511F > 0.04511
Three-star hotelHanzhongF < 0.018420.08497 ≤ F ≤ 0.26119F > 0.26119
Xi’anF < 0.025740.11756 ≤ F ≤ 0.42298F > 0.42298
XiningF < 0.018970.08757 ≤ F ≤ 0.25487F > 0.25487
LhasaF < 0.005460.02622 ≤ F ≤ 0.06655F > 0.06655
Table A3. The mathematical model established when Q is the independent variable.
Building TypeCityRegression Equation
y = a*x + b
Standard ErrorR2 (Decision Coefficient)
Office buildingHanzhongy = 0.8942x + 0.1115a ± 0.00321
b ± 0.0097
R2 = 0.9991
Xi’any = 0.9247x + 0.1012a ± 0.00195
b ± 0.00702
R2 = 0.9995
Xiningy = 0.9459x + 0.1073a ± 0.00169
b ± 0.00516
R2 = 0.9998
Lhasay = 0.8131x + 0.1583a ± 0.01145
b ± 0.02156
R2 = 0.9944
Three-star hotelHanzhongy = 0.9233x + 0.0171a ± 0.00143
b ± 0.00478
R2 = 0.9999
Xi’any = 0.9349x + 0.0117a ± 0.00068
b ± 0.00296
R2 = 0.9999
Xiningy = 0.9639x + 0.0084a ± 0.00036
b ± 0.00136
R2 = 1
Lhasay = 0.8534x + 0.053a ± 0.00917
b ± 0.01623
R2 = 0.998
Table A4. Results of regional division of two types of buildings using Q.
Building TypeCity(1)(2)(3)
Office buildingHanzhongQ < 0.210800.21080 ≤ Q ≤ 0.43447Q > 0.43447
Xi’anQ < 0.214990.21499 ≤ Q ≤ 0.43128Q > 0.43128
XiningQ < 0.203720.20372 ≤ Q ≤ 0.41516Q > 0.41516
LhasaQ < 0.174270.17427 ≤ Q ≤ 0.42024Q > 0.42024
Three-star hotelHanzhongQ < 0.306400.30640 ≤ Q ≤ 0.52302Q > 0.52302
Xi’anQ < 0.308380.30838 ≤ Q ≤ 0.52230Q > 0.52230
XiningQ < 0.302520.30252 ≤ Q ≤ 0.51001Q > 0.51001
LhasaQ < 0.289430.28943 ≤ Q ≤ 0.52379Q > 0.52379

References

  1. Ma, H.T.; Du, N.; Yu, S.J.; Lu, W.Q.; Zhang, Z.Y.; Deng, N.; Li, C. Analysis of typical public building energy consumption in northern China. Energy Build. 2016, 136, 139–150. [Google Scholar] [CrossRef]
  2. Masoso, O.T.; Grobler, L.J. The dark side of occupants’ behaviour on building energy use. Energy Build. 2010, 42, 173–177. [Google Scholar] [CrossRef]
  3. Yu, H.; Niu, J.L.; Chung, T.M. Study on performance of energy-efficient retrofitting measures on commercial building external walls in cooling-dominant cities. Appl. Energy 2013, 103, 97–108. [Google Scholar]
  4. Ge, T.S.; Wang, R.Z.; Xu, Z.Y.; Pan, Q.W.; Du, S.; Chen, X.M.; Ma, T.; Wu, X.N.; Sun, X.L.; Chen, J.F. Solar heating and cooling: Present and future development. Renew. Energy 2017, 126, 1126–1140. [Google Scholar] [CrossRef]
  5. Wang, Z.Y.; Yang, W.S.; Qiu, F.; Zhang, X.M.; Zhao, X.D. Solar water heating: From theory, application, marketing and research. Renew. Sustain. Energy Rev. 2015, 41, 68–84. [Google Scholar] [CrossRef]
  6. Martinopoulos, G.; Tsalikis, G. Active solar heating systems for energy efficient buildings in Greece: A technical economic and environmental evaluation. Energy Build. 2014, 68, 130–137. [Google Scholar] [CrossRef]
  7. Yang, X.H.; Guo, J.F.; Yang, B.; Cheng, H.N.; Wei, P.; He, Y.-L. Design of non-uniformly distributed annular fins for a shell-and-tube thermal energy storage unit. Appl. Energy 2020, 279, 115772. [Google Scholar] [CrossRef]
  8. Guo, J.F.; Liu, Z.; Du, Z.; Yu, J.B.; Yang, X.H.; Yan, J.Y. Effect of fin-metal foam structure on thermal energy storage: An experimental study. Renew. Energy 2021, 172, 57–70. [Google Scholar] [CrossRef]
  9. Guo, J.F.; Liu, Z.; Yang, B.; Yang, X.H.; Yan, J.Y. Melting assessment on the angled fin design for a novel latent heat thermal energy storage tube. Renew. Energy 2022, 183, 406–422. [Google Scholar] [CrossRef]
  10. Wang, L.Z.; Tan, H.W.; Zhuang, Z.; Lei, Y. Regional adaptability evaluation of solar thermal system based on multiple attribute decision making method. Acta Energ. Sol. Sin. 2014, 35, 649–655. [Google Scholar]
  11. Cassard, H.; Denholm, P.; Ong, S. Technical and economic performance of residential solar water heating in the United States. Renew. Sustain. Energy Rev. 2011, 15, 3789–3800. [Google Scholar] [CrossRef]
  12. Hansen, K.; Mathiesen, B.V. Comprehensive assessment of the role and potential for solar thermal in future energy systems. Sol. Energy. 2018, 169, 144–152. [Google Scholar] [CrossRef]
  13. Zhou, Y.; Liu, Y.F.; Wang, D.J.; Liu, X.J. Applicability analysis of daily total solar radiation calculation model and optimization of general calculation model in Different climatic regions of China. Acta Energ. Sol. Sin. 2021, 217, 1–7. [Google Scholar]
  14. Chen, S.Q.; Pan, Y.Y.; Tan, H.W. Comprehensive evaluation of regional adaptability of solar hot water system in university bathroom. J. Zhejiang Univ. Eng. Sci. 2017, 51, 8. [Google Scholar]
  15. Islam, M.R.; Sumathy, K.; Khan, S.U. Solar water heating systems and their market trends. Renew. Sustain. Energy Rev. 2013, 17, 1–25. [Google Scholar] [CrossRef]
  16. Poppi, S.; Sommerfeldt, N.; Bales, C.; Madani, H.; Lundqvist, P. Techno-economic review of solar heat pump systems for residential heating applications. Renew. Sustain. Energy Rev. 2018, 81, 22–32. [Google Scholar] [CrossRef]
  17. Ding, Y.; Liu, X.; Li, B.Z. Application suitability analysis of solar hot water in chongqing. Acta Energ. Sol. Sin. 2014, 35, 299–305. [Google Scholar]
  18. Fan, M.; Liang, H.B.; You, S.J.; Zhang, H.; Yin, B.Q.; Wu, X.T. Applicability analysis of the solar heating system with parabolic trough solar collectors in different regions of China. Appl. Energy 2018, 221, 100–111. [Google Scholar] [CrossRef]
  19. Thygesen, R. An Analysis of Different Solar-Assisted Heating Systems and Their Effect on the Energy Performance of Multifamily Buildings—A Swedish Case. Energies 2017, 10, 88. [Google Scholar] [CrossRef] [Green Version]
  20. Yang, W.B.; Zhang, H.; Liang, X.F. Experimental performance evaluation and parametric study of a solar-ground source heat pump system operated in heating modes. Energies 2018, 149, 173–189. [Google Scholar] [CrossRef]
  21. Ministry of Housing and Urban-Rural Development of the People’s Republic of China. Technical Code for Solar Heating System; GB 50495-2019; China Architecture & Building Press: Beijing, China, 2019. [Google Scholar]
  22. Li, Y.; Fan, R.; Xiao, H.H. Research on Optimization of Solar Heating System in Tibet, China. Build. Sci. 2019, 35, 21–28. [Google Scholar]
  23. Long, T.H.; Qiao, Z.Y.; Wang, M.L.; Li, Y.C.; Lu, J.; Li, W.Y.; Zheng, L.; Zeng, L.Y.; Huang, S. Performance analysis and optimization of a solar-air source heat pump heating system in Tibet, China. Energy Build. 2020, 220, 110084. [Google Scholar] [CrossRef]
  24. Cheng, J. Application Study of Solar Energy and Water Source Heat Pump Combined Heating in Xizang; Southwest Jiaotong University: Chengdu, China, 2005. [Google Scholar]
Figure 1. (a) TRNSYS dynamic simulation flow chart; (b) Structure diagram of solar heating system.
Energies 15 01164 g001
Figure 2. When F is the independent variable: the analysis of the three kinds of heat of office building and three-star hotel is shown in graph (a) and graph (b); the analysis of solar energy guarantee rate is shown in graph (c) and graph (d).
Energies 15 01164 g002
Figure 3. When Q is the independent variable, the analysis of solar guarantee rate of office building and three-star hotel is shown in graph (a) and graph (b).
Energies 15 01164 g003
Figure 4. When F is the independent variable, in the four regions, the solar guarantee rate of office buildings and three-star hotels is shown in graph (a) and graph (b).
Energies 15 01164 g004
Figure 5. When Q is the independent variable, the solar energy contribution rate of office building in the four regions.
Energies 15 01164 g005
Figure 6. When Q is the independent variable, the solar energy contribution rate of three-star hotels in the four regions.
Energies 15 01164 g006
Table 1. Range of recommended values for solar guarantee rate of solar heating systems in different areas.
Resource RegionalizationSolar Guarantee Rate of Short-Term Heat Storage SystemSolar Guarantee Rate of Seasonal Heat Storage System
Ⅰ Resource-richer area≥50%≥60%
Ⅱ Resource-rich area30~50%40~60%
Ⅲ Resource-general area10~30%20~40%
Ⅳ Resource-poor area5~10%10~20%
Table 2. Indoor parameters.
Indoor ParameterOffice BuildingThree-Star Hotel
Date of heatingFrom 15 November to 15 March of the following year, a total of 120 days
Heating time07:00~20:0024 h continuous heating
Personnel density0.1/m20.07/m2
Lighting power18 W/m215 W/m2
Equipment power13/m213 W/m2
Indoor temperature25 °C26 °C
Table 3. Model Validation.
ParameterCase 1Case 2Case 3
Solar collector area580.7m2198.47 m2--
Heating area4750 m27500 m2--
“F”0.122250.026460.49
Contribution rate of Solar energy (In the case of other scholars)70%42.79%99.8%
Contribution rate of Solar energy (Obtained in this study)71.2%38.65%100.7%
Publisher’s Note: MDPI stays neutral with regard to jurisdictional claims in published maps and institutional affiliations.

