1. Introduction
The global energy consumption practices are going through essential reforms to cope with growing energy demand and severe climate challenges [
1]. One characteristic problem is that underdeveloped countries face a double challenge. On the one hand, they must increase their power capacities and, on the other hand, reduce CO
2 emissions. Several dynamic solutions are furnished now and, in the future, to address these concerns. Many South Asian countries like Pakistan, India, Bangladesh, Sri Lanka, and the Maldives have relied on fossil fuels. Due to the depletion of fossil fuels, an alarming situation for adopting alternative energy sources has occurred. Integrating renewable energy (RE) plays a significant role in progressive changes among alternative energy sources. Renewable energy sources (RES) provide immense environmental benefits and can revamp the global power system. According to the International Energy Agency (IEA) report of 2020, hydro, solar, bioenergy, and wind power sources will share almost 40% of the global electricity supply by the end of 2030. However, the extensive integration of variable renewable energy (VRE) creates complexities in controlling the power system due to its intermittent nature. With limited storage and backup capacity, VRE causes problems maintaining the demand and supply balance.
This inherent variability critically imposes the addition of flexible sources to enhance the system’s overall resilience [
2]. Different modeling tools with multiple details are used according to the requirement to optimize RES’s integration extent in any specific power system. More than 85 adequate modeling and simulation tools are available to design energy system models on different planning horizons and scales, including types of generation technologies used, time frames, range of demands, construction types, investment magnitudes, and geographic coverage [
3]. Most of the models assist in planning the sustainable integration of RES into the national energy system. The selection of a specific model depends on the prime objective, analytical approach, data availability, time horizon, underlying assumptions, and sectoral coverage [
4]. A comprehensive review is offered by comparing different modeling tools for energy and electricity systems with large shares of variable renewables [
5].
Various research has adopted MESSAGE, LEAP, IAM, OSeMOSYS, EnergyPLAN, EPPA, MARKAL, and others to build an optimal energy system planning and simulation model. The Mixed Integer Linear Programming (MILP) model is used in Malaysia for electricity generation planning with different RES schemes, especially to meet the CO
2 reduction goals [
6], and in Romania to model an optimal power system for 2040 [
7]. The integration of RES in Turkey’s long-term energy planning is optimized by applying a genetic algorithm [
8]. The PLEXOS modeling tool is used to assess the impact of RE integration in the national policies of North-West Europe [
9]. Multi-objective optimization is used to explore electric vehicles’ long-term impacts and RES integration in Croatia’s power system [
10].
Another captivating research is related to energy storage due to RE’s variable supply in support of conversion towards a 100% renewable power system and suggested using fossil energy as the backup source [
11]. Moreover, Reference [
11] also forecasts that solar energy can pay a 70% share in the total world’s electricity supply based on a Levelized Cost of Electricity (LCOE) analysis. The RES development having immense potential to elevate electricity trading has been proven by research on countries belonging to the Association of Southeast Asian Nations (ASEAN) [
12]. Applying the objective function model, solar and wind penetration for an isolated system is accessed with a diesel generator and backup batteries [
13]. The solar and micro-hydropower plant optimal capacities were determined using HOMER software by the particle swarm optimization (PSO) technique [
14]. A Long-range Energy Alternative Planning (LEAP) model, including baseline and GHG mitigation scenarios and EnergyPLAN models, to plan the electricity generation expansion for Tamil Nadu until 2030, was shown in Reference [
15]. An optimization process on Grey Wolf Optimizer was combined with the EnergyPLAN model to present an alternative scenario and energy mix for Poland in Reference [
16]. The application of EnergyPLAN provided a low carbon electricity system for India in 2030 with a multi-objective assessment in Reference [
17]. A business-as-usual case and eight alternative scenarios with 40% renewable electricity were explored in Reference [
18] using EnergyPLAN. National level energy planning was suggested by using the EnergyPLAN simulation approach to minimize natural gas demand in buildings in Iran [
19]. Reference [
20] focused on sustainable energy transitions for Finland and Italy. Solar and wind energy installation for electricity generation in a specific area in China was analyzed in Reference [
21]; EnergyPLAN was used to perform a dynamic simulation to model low carbon electricity generation scenarios and integrate hydrogen energy and electric vehicles.
Objectives
A brief evaluation of the energy problems of South Asian countries related to the transition of less carbon-intensive power generation;
Pakistan is chosen as an example for implementing the EnergyPLAN model for investigating the national electricity system;
Technical analysis to determine the required utmost feasible percentage share of RES in Pakistan’s national energy system for the long term;
CO2 emission analysis with a high share of RES compared to the current energy mix practices based on the significant replacement of thermal energy by VRE;
Concise economic analysis of the additional grid integration cost of VRE for comprehensive power system modeling;
Recommending suitable energy policy tailored for South Asian countries serving the transition towards sustainable power generation by high-level RES integration.
This study’s prime purpose as an essential part of the planning considers a low-carbon strategy with maximum technically feasible renewable energy sources integrated into the energy system. Furthermore, according to the current availability potential of RES, this study estimates the optimum level of penetration of wind energy and solar energy into the national power system. Almost all the South Asian countries, despite having a high potential of RES, are facing multiple energy problems, most of them are directly associated with poor energy planning. The prudent integration of RE is inevitable to diminish these energy crises. However, appropriate schemes are imperative for integrating significant renewable energy sources. For predicting the approximate extent of RES integration with the corresponding outcomes, the EnergyPLAN modeling tool is used to survey different scenarios for Pakistan as an example. We suggest a long-term electricity model, which is according to the actual demand and supply balance. The reference model was validated according to legitimate and authentic data, and then, the technically most feasible renewable energy-based alternate scenario was built. The authors believe this example will be easily replicable in future studies for other South Asian countries, even in cases of slightly similar attributes. This study consists of five major sections. The first section comprises the introduction. The second section highlights the scope of the works with baseline information about the energy systems of South Asian countries and highlights the problems to be solved. The third section outlines the technical analysis of electricity system modeling using EnergyPLAN. To elaborate on this section, as a case study, Pakistan was chosen. The current energy mix, modeling tool, applied methodology, data source, and alternate RE scenario are summarised with the economic analysis related to the grid integration costs of VRE. The fifth section summarises suitable recommendations to the electricity framework’s overall planning and financial, economic, and political aspects. The last section provides the conclusion and recommendations. The concept of the work is summarized in the Graphical Abstract.
2. Materials and Methods
2.1. Energy Resources and Challenges in South Asian Countries
Several developing South Asian countries, like Pakistan, India, Sri Lanka, Afghanistan, and Nepal, are looking for alternate energy sources such as solar, wind, hydro, and biomass for sustainable power generation to promote enough electricity with a possible low CO
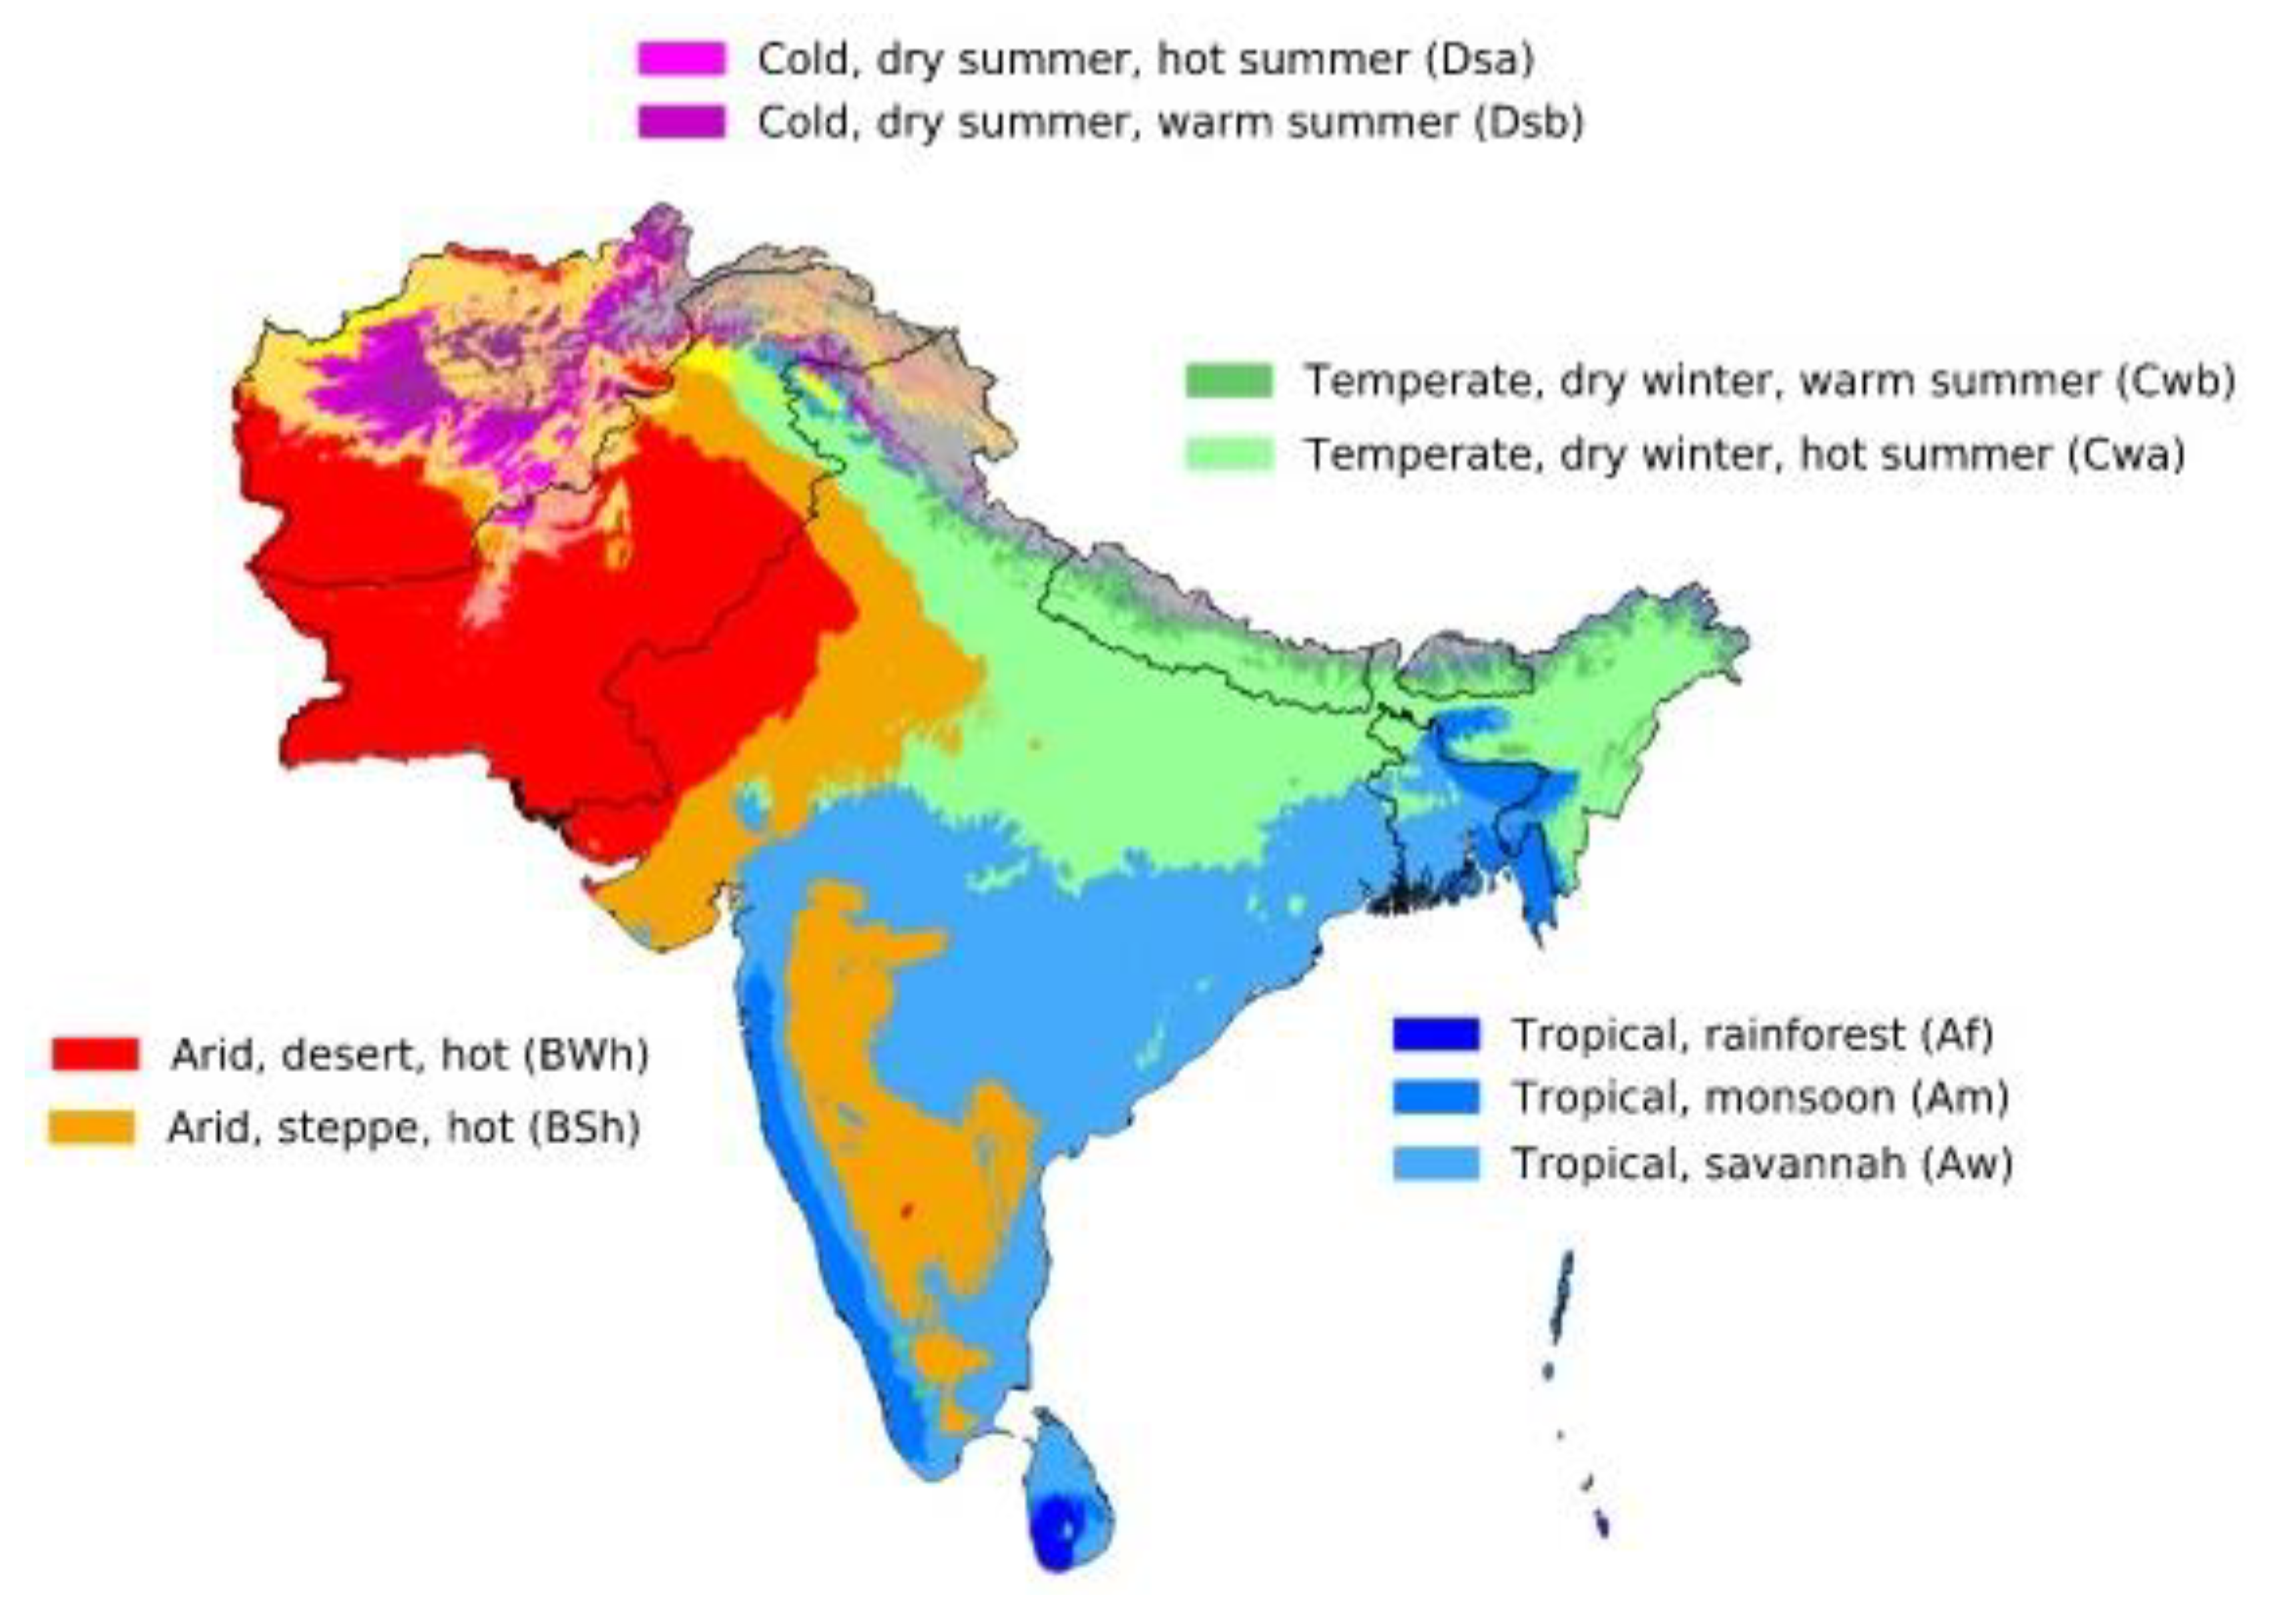
2 emission. South Asian countries have initiated significant efforts to reduce the overdependence on fossil fuels and move towards alternative energy types, specifically renewable energy, to manage the growing demand. Geographically, South Asian countries have different climatic conditions and have easy access to various renewable energy sources.
Table 1 and
Table 2 offer a brief description of the current energy mix and renewable energy potential.
Figure 1 shows the climate variations of the countries in this study.
South Asian countries face numerous energy challenges, despite having huge RE potential. The lack of quality information about RE resources and erroneous policies leads the South Asian countries towards unbalanced energy demand and supply or high-cost electricity generation with severe environmental damage. If timely planning for alternate energy sources is not started, a significant gap arises between the potential fossil fuel supply and the energy demand to achieve new social and economic development targets of South Asian countries. Further, renewable energy is an inevitable choice for South Asian countries due to the increasing attention on greenhouse gas mitigation in that region.
Figure 2 summarizes significant RE development challenges in South Asian countries.
Sufficient information of alternative energy sources and energy efficiency for efficient policies has become essential for South Asian countries due to continuously depleting fossil fuel sources. South Asian countries’ capacity limitations for RE integration and analysis of the current energy statistics with the targeted RE development projects are listed in
Table 3.
South Asia encompasses 3.4% of the world’s land, while the region accommodates almost one-fourth of the world’s total population [
27]. Such massive population growth of South Asian countries has amplified the energy demand and environmental degradation. The general electrification of the region is 74% [
22]. South Asian countries face energy security issues due to high dependence on a single source for electricity production that varies from country to country. South Asian governments have realized that appropriate and comprehensive power generation schemes are crucial to optimize their countries’ energy structures and essential for the normal functioning of domestic and industrial activities.
Many researchers have scrutinized the energy system situation of South Asian countries, mainly competitive assessment of the wind power industry [
28], status and potential of hydroelectric power generation, and the evaluation of mitigation measures for ecological conservation [
29]. Other researchers have reviewed economic rise and poverty mitigation by adopting clean energy in South Asia, challenges, and barriers related to sustainable development in the region [
30]. The conceptual framework built is related to the environmental sustainability of South Asian countries using a weighted Data Envelopment Analysis for the years 2001–2015 in Reference [
31]. The analysis concluded that, by combining energy, environmental, and economic factors, Maldives ranked first, with a maximum stable score in the region, and Nepal came second, while India, Pakistan, and Siri Lanka scored poor in the region.
Meanwhile, many scholars have explored the importance of energy system planning and examined the progress of associated implementation strategies. Still, several internal and external factors are not considered in the detailed framework of national action plans of energy systems. Thorough research and development of South Asian countries may lead to establishing an extensive energy plan to deal with the current energy crisis. It is an essential requirement for the social and economic development of the region. The country-specific long-term planning results can be summarized as follows, while Pakistan’s case is dealt with later in a separate section in more detail.
Table 3.
Current and prospective energy statistics of South Asian countries.
Table 3.
Current and prospective energy statistics of South Asian countries.
| South Asian Countries and RE Planning | Total Population (millions) | Population Lacking Electricity (millions) | Population Electrified (%) | Rural Population Electrified (%) |
|---|
| Country | Pakistan |
| | 197 | 57 | 71 | 63 |
| Renewable EnergyTargets | 25% of generation capacity from alternative and renewable energy technologies by 2025, including solar, wind, geothermal, biomass, biogas, syngas, waste-to-energy, storage systems, ocean/tidal and hybrids 30% from alternative and renewable energy technologies by 2030 30% large-scale hydro (more than 50 MW) in total generation
|
| Plans related to achieving those targets | |
| Country | India |
| | 1339 | 93.7 | 93 | 89 |
| Renewable Energy Targets | 40% of installed power generation capacity from clean energy sources by 2030 175 GW from RES by 2025, including 100 GW solar, 60 GW wind, 10 GW bio-power, 5 GW small-scale hydro
|
| Plans related to achieving those targets | |
| Country | Sri Lanka |
| | 21.4 | - | 98 | 99 |
| Renewable Energy Targets | |
| Plans related to achieving those targets | |
| Country | Bangladesh |
| | 164 | 31.3 | 88 | 81 |
| Renewable Energy Targets | |
| Plans related to achieving those targets | |
| Country | Afghanistan |
| | 38 | - | 98.7 | 98 |
| Plans related to achieving RE targets | |
| Country | Nepal |
| | 28 | - | 93 | 93.4 |
| Plans related to achieving RE targets | |
2.1.1. India
The primary issue of India related to power generation is the abundance of coal use that deteriorates the environmental quality adversely. India ranked 177 out of 180 nations in the Environment Performance index of 2018 [
36]. A comprehensive National Action Plan on Climate Change (NAPCC) program was launched in 2008 to reduce carbon emissions and increase the share of solar energy. Later, the Indian government set a goal to increase the RE capacity up to 275 GW by 2027. To achieve ambitious RES targets in India, in a recent study [
17], a novel combination of multi-objective and multi-criteria assessment approaches were interlinked to a sustainable modeling framework. This study showed that a 25.5–41.2% RES share with an estimated 29% RES growth by 2030–31 is one of the best solutions for the country’s sustainable future, and a high-resolution RES model was optimized multiple times to explore the wide decision space. It concluded that utility solar and onshore wind scenarios should be prioritized for climate change mitigation while nuclear, offshore wind, and river hydro are the least preferred scenarios.
2.1.2. Nepal
Since Nepal does not have coal, natural gas, and petroleum products, there is a high dependence on traditional energy sources [
37]. However, being rich in water resources and diverse geography, Nepal meets its energy needs principally from hydropower generation [
38]. Still, the Nepalese government must spend a large share of its GDP to import electricity, mainly from India, especially during the dry season. The CO
2 neutral power generation for the country is relatively less challenging than the other countries of the region, since it depends on hydropower. The Nepalese government planned to promptly increase the RE integration share from less than 1% to at least 10% and elevate this target from 10% to 30% within the next 20 years [
39].
2.1.3. Bangladesh
RE integration has already started in Bangladesh according to various plans. The river flow in many Bangladeshi rivers has not hit its target (because of its death), making the hydro project’s growth tentative. Small renewables, particularly Solar Home System (SHS), give a ray of hope for the RE development goals of the country [
40]. SHS is a proven technology applied in Bangladesh, and 4.13 million systems have been installed across the country since 2003 [
41]. However, SHS is not very satisfying, with various problems, especially during monsoon season when severe issues erupt.
A proficient study analyzed the greening of economic growth in Nepal and Bangladesh between 1985 and 2016, and the imperial evidence was scrutinized [
42]. Historical progress of the countries inspected a few green growth indicators, looking ahead to the sustainable development goals of 2030. The structural change from agriculture to service-based economies for low- to middle-income countries drives economic improvement. The technological transition from biomass to RES is requisite to deliver green growth in Bangladesh and Nepal.
2.1.4. Siri Lanka
Before 1990, electricity generation was covered by hydropower (100% renewable). Various fuel (coal, LNG, and oil)-based thermal plants were maintained to serve the increasing demand, resulting in traditional hydropower comprising only 41% in 2018. (It is worth mentioning that hydropower generation is very fluctuating, for example, 2018: 6401 GWh, 2017: 4021 GWh, 2016: 42,221 GWh, and 2015: 5969 GWh, resulting in different shares reported in the literature.) Solar, wind, and biofuel together make up only 3.4%. LTEGP 2018–2037 reports the development of 1.4 GW solar and 1.2 GW wind projects, and an increased role is addressed for the biomass and mini-hydro capacities [
43]. The 100% renewable-based generation is targeted for 2050. There is a vision to implement RE penetration with India–Siri Lanka HVDC interconnection. The proposed interconnection is economical for RE initial integration, and after achieving 100% energy self-sufficiency, it might facilitate the export of excess electricity [
44]. Sri Lanka has already started initial actions to use only renewable energy in electricity generation by the end of 2050. According to the United Nations Development Bank estimate, a 54–56 billion US
$ investment is required to execute the 100% renewable energy scenario. The targeted 100% renewable power generation without integrated waste management decommission the existing thermal power plant, large-scale PV plant, and wind plant considerable impacts on the environment [
45].
2.1.5. Afghanistan
Due to the damaged infrastructure of energy generation, the transmission and distribution country’s energy sector is still the least developed sector in the region [
46]. The energy scenarios of the country are precarious. Almost 80% of the grid power is imported from neighboring countries. Unfortunately, RES’s are underexploited in Afghanistan because of the war-torn status of the country. The Afghan government has set the target to generate 5000 MW RE-based domestic power generation by 2032, equivalent to meeting 95% of the country’s electricity demand [
47]. A feasibility study of various projects has been conducted, but because of transboundary water-sharing conflict, lack of budget, and unavailability of technology, implementation of the plans is still un-operational [
48].
2.2. Energy Transition for Pakistan
As a case study, this section demonstrates how an ambitious energy scenario can be introduced for a more extensive integration of RES in the national electricity system.
The first study related to energy and power planning for Pakistan was modulated in the late 1960s [
49]. After that, several short- to medium-term, more likely five-year, plans were proposed to the government by experts and researchers. Different wind, solar, and biomass penetration scenarios in the national power system were discussed using the MESSAGE framework. The hourly demand–supply balance was investigated by projecting the demand from 430 to 566 TWh by 2050 [
50]. Another study conducted by using The Long-range Energy Alternative Planning (LEAP) modeling software to address the energy mix for the next 20 years (2011–2030) and RE share up to 46%, coal 14%, and the remaining amount fulfilled by conventional sources was suggested for 2030 in Reference [
51]. Two different scenarios, 50% RE share and 60% RE share, were monitored using TIMES software to analyze the feasible RE integration and proved the sustainability of these two scenarios compared to the base scenario [
52].
The LUT energy transition model is used to assess the energy and cost demand for the national energy system’s complete transition to 100% RES by 2050. The model comprises five-year steps and results in declining the LCOE from 106 €/MWh in 2015 to 46 €/MWh in 2050 [
50]. Coping with Pakistan’s energy crises, another effort was made by employing a Strengths, Weaknesses, Opportunities, and Threats (SWOT) analysis to address the regional (mainly Baluchistan and Sindh) RES diversity and potential according to demand. Then, the Fuzzy Analytical Hierarchy Process (Fuzzy AHP) approach was applied to access the technical, economic, social, and environmental issues. According to Reference [
53], wind ranked number one, then solar and biomass, as the potential source.
In the recent literature, very few studies with advanced modeling and planning tools have been conducted for the Pakistani power system’s long-term planning. Moreover, after reviewing the previous studies, bottom-up approach-based modeling software was selected for this study. EnergyPLAN modeling software was employed for the first time to simulate the electrical demand and production, according to the available energy resources, to estimate the generation cost and emissions of the Pakistani national power system.
Before, EnergyPLAN was employed for different studies worldwide to estimate the technical and economic modeling of energy systems. Following the proportion capacity of energy resources and the penetration potential of RES, the regulation strategy is diversified to design an alternate balanced energy system by using the built-in features of the EnergyPLAN tool. EnergyPLAN has been employed in different scenarios, like in hydro-dominating countries [
54,
55], conversion towards 100% RE systems [
56], for the estimation of large-scale RES integration, demand response technologies [
57], for addressing the storage alternatives [
58,
59], and transport incorporation [
60].
Furthermore, the European Renewable Energy Council (EREC) projected in 2018 that renewable energy sources must meet at least 50% of the world’s energy needs by 2040 [
61]. Hence, developing countries like Pakistan should comply with this strategy to pursue the global development goals.
2.2.1. The Energy Mix of Pakistan
The total installed capacity of Pakistan is 34.3 GW against the maximum demand of 25.7 GW, according to the 2020 World Bank report [
23]. The domestic side consumes more than a 50% share of the total demand; therefore, the industrial, agriculture, and commercial consumption is 25%, 10%, and 7%, respectively. The current primary source contributions are hydro 28%, nuclear 3.8%, renewable energy (wind solar and bagasse) 4.6%, and thermal sources 63.4%. (
Table 4 and
Table 5 provide further specific illustrations.)
2.2.2. Energy Resources
Undoubtedly, Pakistan has plentiful energy resources, mainly RES, but unfortunately, a significant proportion of these resources are unexploited. Presently, extensive wind, solar, and biomass sources are available, indicating that the current demand–supply gap can be maintained with these environmental-friendly resources. Nowadays, RE contributes less than 5% of the country’s total power generation, significantly less than the obtainable potential. The total installed capacity of wind power is 1086 MW against the 100–150 GW available wind power potential. Solar power generation is similar to wind, with a 430-MW capacity is installed while the considerable potential of 100 GW is present [
62].
Pakistan has enormous potential for bioenergy, being an agriculture country, and agriculture covers 25% of the country’s total GDP. The Annual Energy Development Board (AEDB) reported that, considering all the possible bioenergy production sources, 4–6-GW potential is available [
63]. The overall hydropower potential in Pakistan is almost ~60 GW [
64].
2.2.3. Emissions
Pakistan is not the most significant contributor to greenhouse gas (GHG) emissions worldwide. However, oil and gas utilization produce a significant proportion of the country’s total emissions; therefore, the fuel mix for power generation must change.
According to the Global Climate Risk Index, Pakistan is the seventh-most vulnerable country on the planet, as far as overall climate change is concerned [
65]. The United Nations Framework Convention on Climate Change (UNFCCC) impels its participant countries to formulate emission inventories to simplify the timely shift towards RES based on their level of emissions. The Global Climate Impact Study Centre (GCISE) compiled Pakistan’s emission inventories, since the country is a UNFCCC convention party. Emissions from five major sectors were reported: energy, industry, forestry, agriculture, and waste and land use change. As per the last report of 2015, the total emissions of the country were 405 Mt per year, and there was no emission record afterwards about the current level of emissions of the country [
65,
66,
67].
2.3. Methodology of Modeling Pakistan’s Electricity System
This section demonstrates the methodology used to plan Pakistan’s electricity model and selects a particular modeling tool. The data source, schematic scenarios, and sufficient assumptions related to this study are described.
2.3.1. Modeling Tool
With the continuous development in energy systems, their challenges and complexities are also growing. Moreover, timely energy planning is compulsory to cope with the upcoming challenges. As we mentioned earlier in the Introduction section, various energy modeling tools are available with specific purposes and characteristics, and no individual tool is proficient enough to deal with all the constraints of energy systems. The selection of a particular tool depends on many factors; an energy analyst’s choice is one. We adopted a bottom-up approach to compare our results with the reference study in this study. The EnergyPLAN software tool developed at Alborg University in Denmark is used to simulate national long-term energy planning scenarios [
68]. It results in a shorter time using analytical programming with high resolution (hourly). According to the resources availability and conversion technologies, this tool simulates a system to obtain an alternate energy system with the highest RES penetration.
Figure 3 shows the schematic diagram of EnergyPLAN.
With EnergyPLAN, the results are generated based on two major categories, technical or market–economic regulation. The technical study focuses on minimum fuel consumption alternatives, and the objective of the market–economic strategy is to forecast the least-cost options. This study follows the technical strategy to estimate the minimum thermal fuel consumption for the annual demand and supply balance. The integration of RES is approximated according to the CO
2 emissions and the system’s annual cost.
Figure 4 shows the comprehensive framework of the EnergyPLAN model for Pakistan’s power system.
2.3.2. Reference Model and Data
EnergyPLAN requires several inputs to calculate specific results; hence, we can validate the system against the actual datasets according to the complete validation process guide. Based on the electricity data of the year 2019 (year 2020 is a general reference in the planing and forecasting literature, but due to the pandemic situation, the real yearly statistical data cannot serve for evalutating the former forecasts for 2020), the introduced reference model precisely explains the country’s power sector’s current situation. The reference model dataset is extracted from detailed information provided in the World Bank report of 2020 [
23] and State of Industry Report [
70]. According to these reports, the country’s average electricity demand for the reference year was 173.8 TWh/year, and the installed capacity in MW of each different source is listed in
Table 4. All the thermal energy sources are listed in a cumulative form, making the calculations simple. However,
Table 5 lists the detailed shares of each thermal source with the exact values. The country’s renewable share in the total power generation is approximately 5%, despite the enormous RE potential, as
Table 2 showed earlier.
2.3.3. Energy System Scenarios
The reference model is validated by applying actual data in EnergyPLAN software to perform a technical analysis. The baseline scenario for 2040 was developed according to the World Bank 2020 annual report’s forecasted data. By this report, the annual average demand of the country’s power sector in 2040 will reach 700 TWh/year, and the installed capacities in MW of each source are listed in
Table 4 and
Table 5. The data was optimized using the same bottom-up approach but using different modeling software. The PLEXOS (optimum/base) model was used to plan Pakistan’s energy system for 2040 in the World Bank 2020 report. PLEXOS is a different model compared to EnergyPLAN. The methodology in PLEXOS is dispatch, and the language is mixed-integer, while, in EnergyPLAN, the methodology is a simulation, and the language is heuristic [
71].
The baseline scenario is a business as usual (BaU) scenario. Still, this scenario has the potential for alterations in resource shares. Therefore, to estimate the technically feasible share of the integration of the renewable source, the following three main scenarios are analyzed, and the demand is considered equal for all future derived scenarios:
2.3.4. Scenario 1—High Wind
The BaU2040 scenario is used to calculate the maximum technically feasible wind capacity with the minimum overall system cost from the simulation result of EnergyPLAN. The results and discussion section explains more details about high wind (HW2040).
2.3.5. Scenario 2—High Solar
The same is the case for solar energy; using the BaU2040 scenario, the maximum technically feasible solar capacity is calculated by considering the overall system cost from the simulation results of EnergyPLAN. The results and discussion section explains more details about high solar (HS2040).
2.3.6. Scenario 3—RE Combination
This scenario is not just based on BaU2040. The authors’ combination of high wind and high solar scenarios is considered for the RES integration into the national power system. Further bioenergy addition, nuclear reduction in the share, and thermal fuel limitations are also considered inputs to develop this scenario. A list of all the proper actions implemented to develop this final RE combination (RE2040) scenario for 2040 is explained in the results and discussion section.
2.4. Results and Discussion of Pakistan’s Electricity System Transitions
This section discusses the results of the reference, BaU, and alternate scenarios. First of all, a validation of the reference scenario of 2019 is presented; then, a detailed discussion of the maximum penetration potential of RES is outlined. All the models’ technical analysis and main findings from the ultimate scenarios are introduced in the last part.
2.4.1. Reference Model Validation
Before starting to build future scenarios, the system’s reliability must be assessed for the absolute certainty of the model. For validating the system, the specific reference scenario outputs are compared with actual data provided in different but authentic (domestic or international) sources. In this study, a reference model was developed by using data from the year 2019.
The annual CO
2 emission value from the reference scenario of 2019 with the data provided in other studies, done by the TIMES model [
67] and LEAP model [
72], was compared for a validity check of our model. No emissions data were available for the country after 2015, which is why they were compared with other authentic studies. The actual power-related CO
2 emission calculated for reference year 2019 by EnergyPLAN was 68 Mt. While Reference [
67] forecasted 80 Mt for 2020 and Reference [
72] 70 Mt for 2019. The reason behind choosing 2019 as the reference is due to COVID-19, and regardless of the difference between 2019 and 2020, the 2019-based model is suitable for future energy planning for Pakistan.
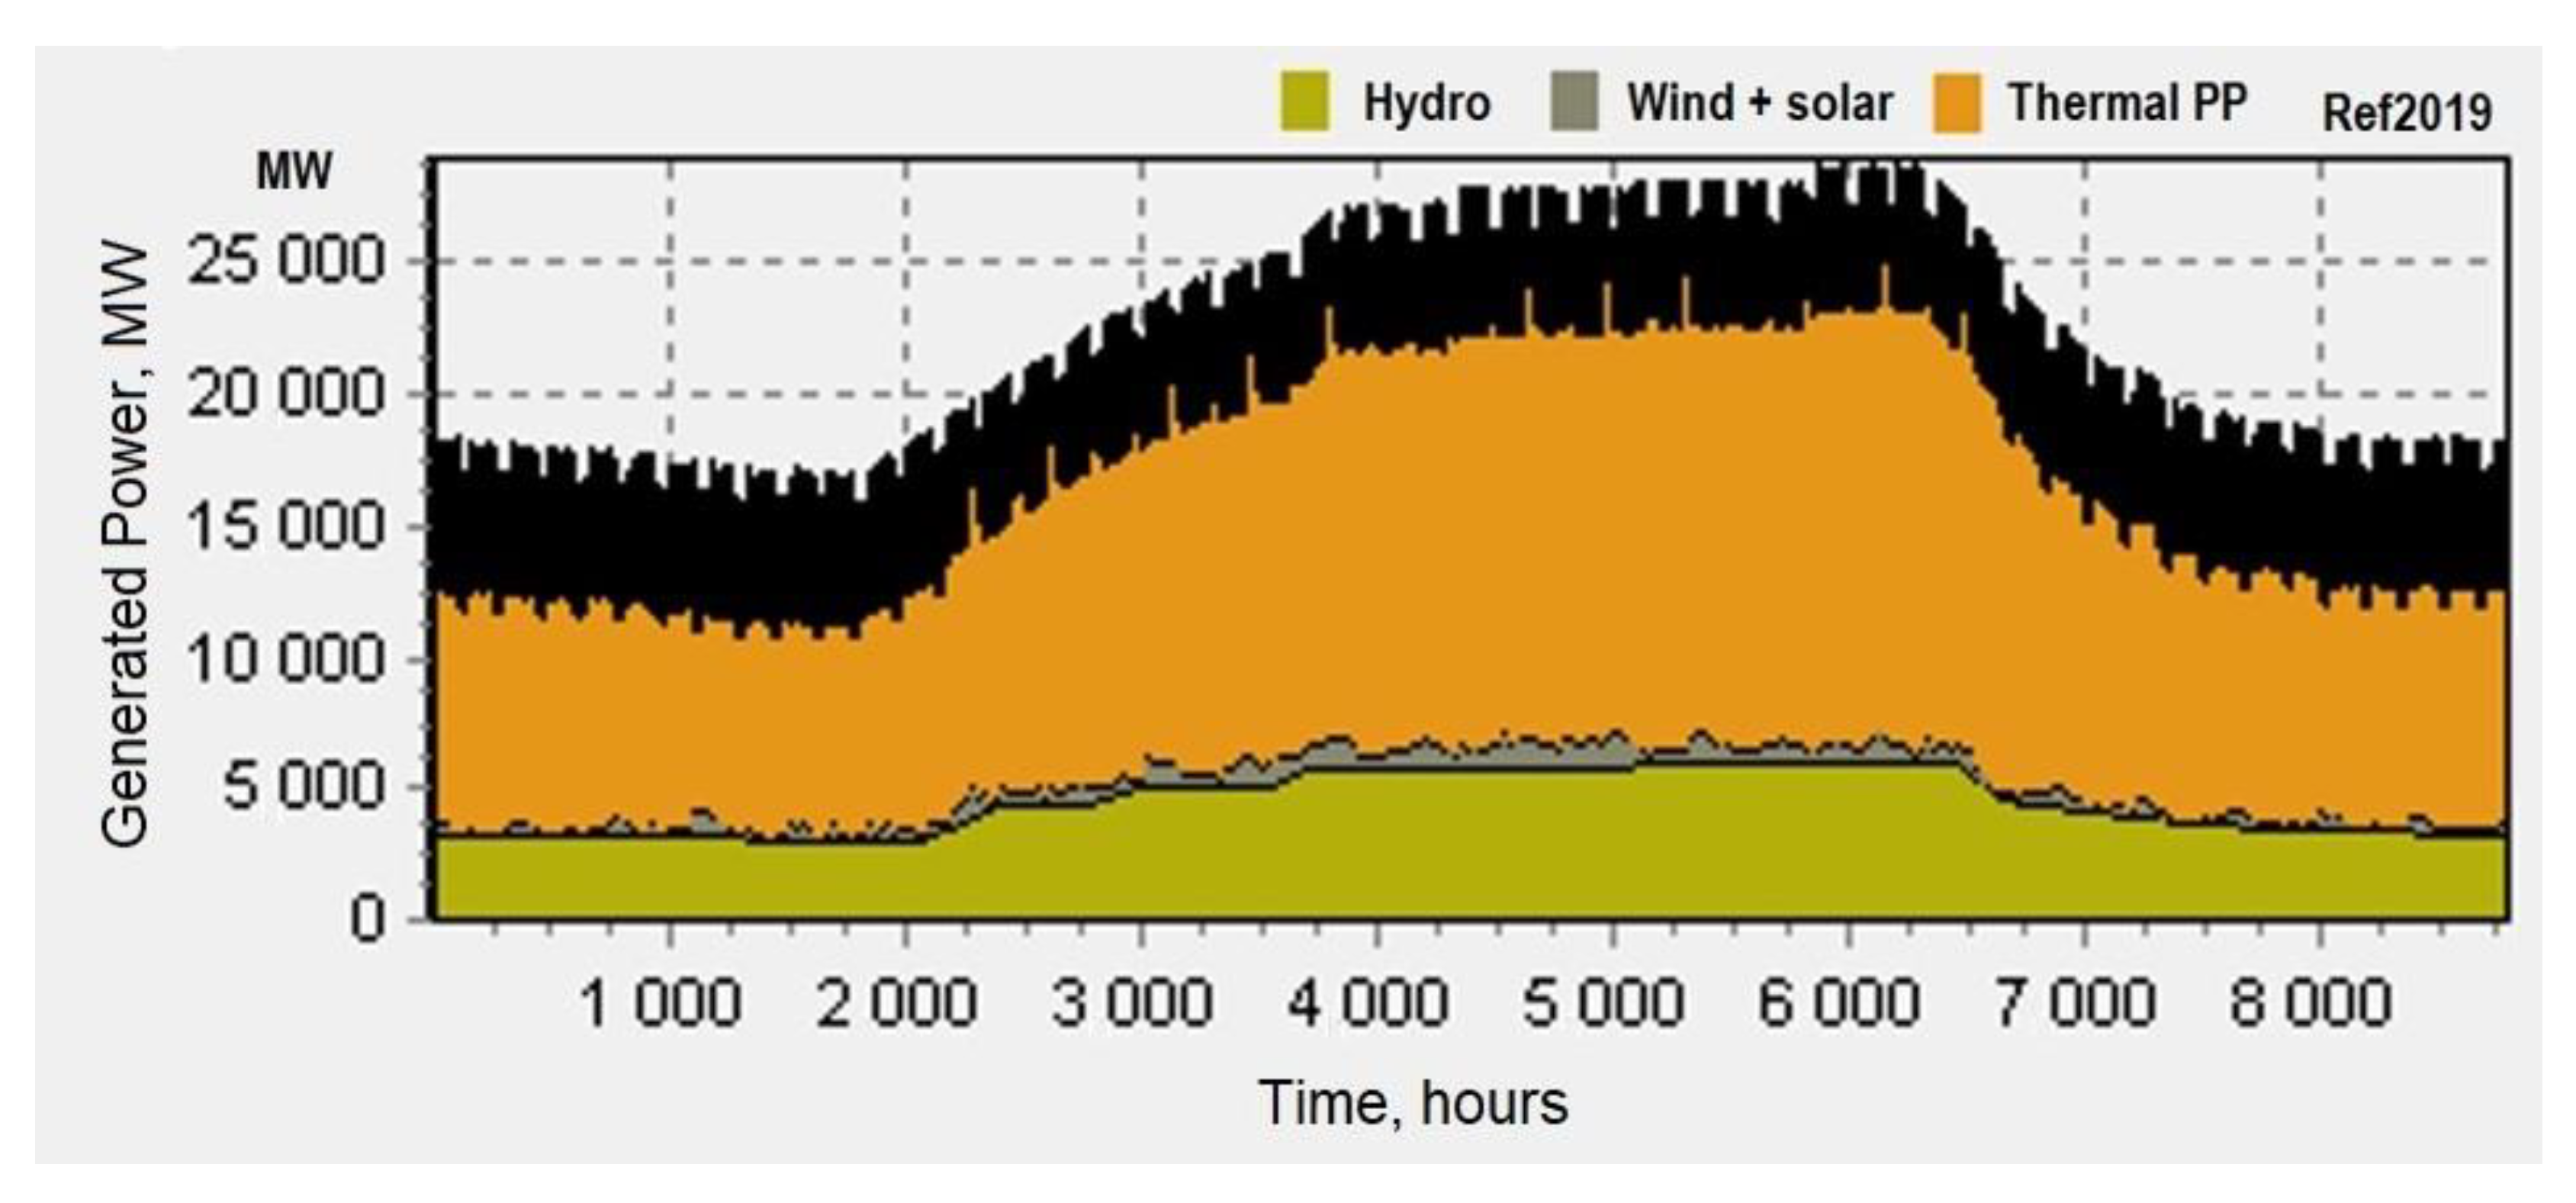
Secondly, the monthly electricity demand calculated with EnergyPLAN is compared with the observed (2019) maximum demand of 25,753 MW, as reported in the State of Industry Report 2020 [
70].
Table 6 illustrates the demand per month for 2019, calculated by EnergyPLAN, compared to the observed demand [
70]. The results remain within the limits defined by the country’s annual report and are shown in
Figure 5. The slight difference occurs because EnergyPLAN is a long-term planner, so the minimal difference is evident if we develop a short-term model. The wind and solar generations are marginal. The hydropower generation is tailored to the demand instead of steady operation as the installed capacity, and the yearly hydel generation data are required. The generation profile is constructed by considering today’s and future dam capacities and the yearly rain periodicity. (The effect of the zoom out of time is visualized in
Figure 6 to help in follow the results shown in
Figure 5 and
Figure 7.)
2.4.2. Limits of RE Penetration
This section provides a detailed method for investigating the limits of wind and solar power integration. The maximum technical level of penetration is calculated. Later, those calculated values are used for generating an alternately combined RE integration scenario to develop the country’s power system’s most feasible model.
2.4.3. The High Wind Scenario
Table 4 shows that wind supplies almost 3.2% of the country’s total power generation. The BaU2040 scenario is used to calculate the maximum technical wind penetration for 2040 with EnergyPLAN. We varied the installed wind capacity from 25 GW to 275 GW by 25-GW steps, and the overall system costs were calculated. The values of the overall system cost decreased until 150 GW of wind penetration, then started increasing with the further increase in the built-in wind capacity. Therefore, ~150 GW was the maximum technically feasible value for the built-in wind capacity, which accounted for 32,640 million USD as the total annual cost of the overall system.
2.4.4. High Solar Scenario
Table 4 shows that solar power currently covers only 1.27% of the country’s total power generation. The BaU2040 scenario is the basis for calculating the maximum technical solar power penetration for 2040. Varying the installed solar capacity from 25 GW to 275 GW by 25-GW steps, the overall system cost is calculated. The values of the overall system cost decreased until 125 GW of the built-in solar capacity, then started increasing with the further increase of solar power penetration. Therefore, ~125 GW was the maximum technically feasible value of the solar power capacity installation, with 46,146 million USD as the annual cost of the overall system.
It should be mentioned here that 150-GW wind and 125-GW solar capacity installation are overestimated in VRE grid integration. (The EnergyPLAN model does not contain the VRE integration costs that can only be neglected when the VRE percentage is less than 10% [
73].) As the VRE share increases above the installation unit cost and O&M cost, the increasing VRE integration costs appear. The latter analysis introduces the details. Here, we mention that the limitations for the wind and solar capacities are determined in two steps. First, EnergyPLAN is used to determine the total annual cost for a series, and later, the grid integration costs are calculated. The total minimum cost means the limitation for the integrable capacities.
2.4.5. RE Combination Scenario Optimization
In this part, we consider all significant findings of the previous sections in developing the final optimum VRE penetration scenario, along with the maximum biomass and bagasse addition and reduction of thermal fuel, according to the country’s current policies. This scenario is absolute in the context of forecasting the country’s overall power system, with a practical share of each source (renewable and nonrenewable).
In this scenario, the share of hydropower is the same as in the BaU2040 scenario.
Table 5 represents the reduction of thermal fuel. In thermal power generation, a subsequent reduction is made to avoid further greenhouse gas emissions [
67]. The bagasse amount is increased according to the resource potential, because currently, just 273 MW is the installed capacity of bagasse in Pakistan, while bioenergy is a leading energy source contributing 44% of the total RES worldwide [
74]. Currently, 4407 MW nuclear [
75] is included in this scenario, and no further addition is forecasted due to the high operation and maintenance costs (see
Table 5). A total 39,274 MW thermal fuel is added in the final model to maintain the system’s reliability. The VRE share is optimized for the total electricity generation in this RE2040 scenario. No doubt, its further extension is feasible. At a higher penetration, a large storage capacity coupled with excess renewable energy is required, driving the overall system cost to be less economical.
The total wind and solar sources are 35-GW wind and 65-GW solar in RE2040. The inclination more towards solar power generation for power systems is due to many factors. One of them is the higher operation and maintenance costs of wind power shown in
Table 7, and the smaller wind ratio incurs fewer GRID integrations costs [
73]. Based on all these logical assumptions, the RE2040 scenario is performed with EnergyPLAN, and the results are concluded. The total CO
2 emission in this scenario is 139 Mt, with 47 181 million USD annual system costs without the GRID integration costs. The monthly electricity demand for 2040 is calculated by EnergyPLAN, as shown in
Table 8, and the per year electricity demand and production for 2040 with the RE2040 model is shown in
Figure 7. The system balance includes import electricity, which, on the one hand, can be reduced by increasing the hydro capacity, and on the other hand, it may be assumed that the developed regional cooperation can maintain this in the future.
In RE2040, for the final wind–solar ratio determination, we used the VRE grid integration analysis results.
2.4.6. Technical Analysis of Electricity Production Scenarios
After completing the simulation for all the five scenarios (Ref2019, BaU2040, HW2040, HS2040, and RE2040) in EnergyPLAN,
Table 9 illustrates the compared outcomes based on two technical points: (1) CO
2 emission and (2) overall system cost. The overall system costs per unit fuel price and operation and maintenance costs for 2019 and 2040 are calculated, as shown in
Table 7 and
Table 10. The model’s cost is based on the IRENA database [
3], on the database used for the HeatRoad4 EU project EnergyPLAN model [
76], and on the National Power System statistics [
77]. The authors constructed the hourly load profile based on the workday and weekend day demands reported by NEPRA in Reference [
70]. The wind and solar production hourly data were generated by calculating the region’s weighted mean potentials following the HeatRoad4 EU project reports [
78].
2.4.7. VRE Integration Cost Analysis
Replacing the existing thermal sources with VRE has become inevitable due to depleting the oil and gas reserves. VRE is undoubtedly the most appropriate alternative energy source, but a high share of VRE challenges the power system due to inherent intermittency and uncertainty. The additional integration cost is another significant penalty for both the power system and consumers to cope with VRE temporal fluctuation and geographical dispersion. The appropriate estimation of integration costs provides foresight for power system planners and policymakers. The quantitative investigation of such integration costs is challenging, because it is “additional”.
The additional cost of VRE integration is stated by different terms like “hidden cost”, “variability cost”, and “balancing cost”; however, the term integration cost is widely used. Similarly, calculation methodologies of VRE integration costs differ in the literature, because the power system pays when VRE is included in the generation mix by replacing thermal fuel, depending clearly on the research target and system boundaries. The integration cost of VRE differs significantly in the literature, depending on the research target, system boundary, main assumptions, and power system features. There are two main categories of VRE integration costs: estimates from the market price of VRE and estimates from power system modeling [
79]. Our study investigates the limits of the VRE capacity, while there is no operational market, so our calculations follow the power system modeling way. In developed economies where the VRE integration has reached a significantly higher level than South Asian countries, the VRE integration cost modeling follows estimates from the market prices and the system modeling applied in the earlier state of renewable energy penetration. South Asian countries’ power systems nowadays in the transition towards this VRE integration level justify following the methodologies used, for example, investigating electricity systems in EU countries earlier [
80]. The VRE integration costs apply to both the supply and demand sides, and the costs increase with the VRE penetration level. However, solar power has less integration costs than wind power due to more consistent power outputs.
2.4.8. VRE Grid Integration Cost and Challenges
The following are the essential components that require significant attention while calculating the grid integration costs.
Defining the boundaries of each category
Grid costs are primarily specific to the systems and projects, and the general and typical costs have a greater margin of inaccuracy
Future grid expansion parameters
Room for new and planning with low-cost approaches
As mentioned above, the cost of VRE integration is project-specific. It is found that, if the market share is 30–40% for wind, then the integration cost is 30–42
$/MWh [
73]. With 10% penetration of onshore wind power, the integration cost reduces to 11–15.6
$/MWh. Similarly for solar integration, the cost is 32–38.4
$/MWh [
81]. However, according to the current estimations, these results vary widely. As per the latest research, VRE integration values are slightly different on the supply and demand sides; they range 2.3–12.1
$/MWh for 5–30% wind penetration, and for a similar level of solar penetration, it ranges 5.5–7.1
$/MWh. While the demand side costs much higher, almost 7.3–186
$/MWh [
79].
2.4.9. Limitations of VRE Capacity Installation
According to the GreenNet model in Reference [
80], the two-step model contains (1) assumptions about the extra grid reinforcement cost and (2) short-term system balancing. The authors believe that applying only the extra grid reinforcement cost in the long-term planning period is enough to derive additional criteria in determining the limits of the VRE integration. The grid reinforcement costs related to solar and wind penetration from References [
73,
79,
80,
81] were collected into an Excel sheet, and a second-order polynomial function was applied for the investigated power range for calculating that specific costs:
GRC means the Grid Reinforcement Cost in USD/MWh, and p means wind or solar penetration in terms of the generation ratio of the total demand.
2.4.10. Wind Capacity
Calculating the wind-related grid reinforcement cost according to Equation (1), the following values were used: a = 161, b = −16, and c = 2.5. Our estimation function resulted in, for example, if p = 0.1, 0.2, and 0.3, then GRC = 2,5, 5.7, and 12.2 USD/MWh, respectively.
The application of Equation (1) elaborates the natural trend that increasing wind energy production means a greater increase compared to linear dependence.
The BaU2040 reference includes 13.49-GW wind and 35.4-GW solar power. When we investigate the maximum rate for wind power, the additional (“penalty”) wind production is subject only to the calculations.
Table 11 illustrates the details of the calculations.
The total cost is seen as empirical results, and with a second-order estimation, the absolute maximum (limitation) for the wind power capacity is 57.8 GW, with a total yearly cost of 45,903 million USD.
2.4.11. Solar Capacity
For solar power, the maximum (limitation) capacity is followed similarly to wind.
Table 12 summarizes the results. The surplus production is calculated over 35.4-GW production, as this value is in BaU.
Calculating the solar-related grid reinforcement cost according to Equation (1), the following values were used: a = 17.357, b = 0.3079, and c = 5.443. Our estimation function results in, for example, if p = 0.1, 0.2, and 0.3, then GRC = 5.6, 6.2, and 7.1 USD/MWh, respectively.
The total cost is seen as the empirical results, and with a second-order estimation, the absolute maximum (limitation) for the solar power capacity is 88.9 GW, with a total yearly cost of 50,308 million USD.
3. Results
3.1. Policy Responses in South Asian Countries
This study tracks the energy scenarios and the renewable energy resource potentials of South Asian countries and the challenges for renewable energy development. Based on that, suitable recommendations are suggested for the electricity framework’s overall planning, and the financial, economic, and political aspects are summarized.
3.2. Development of Substantial RE Plans
The RE planning process includes a demand and supply balance, resources potential, market trends, and financial stability. More specifically, it is based on technological and economic strategies. Services in system design, installation, operation, and maintenance are requisites for RE data collection, implementation, and development analysis. Moreover, establishing dedicated departments is mandatory for working and promoting RE integration at a large and small scale. Overall, among other challenges, public awareness towards RE adaptability is a crucial obstacle in South Asian countries, because most of the population resides in rural areas. The availability of local manufacturers and skilled workers in particular areas should be promoted to stabilize the energy and market infrastructures simultaneously. Most South Asian counties have planned their short-term or long-term RE development targets.
3.3. RE Establishment Support
A remarkable connection between RE generation and its utilization market helps stabilize both infrastructures. It generates a demand for significant skills and expertise that defiantly benefit the job market. Since the RE development industry is directly associated with many other markets, the government’s special attention is obligatory to encourage stakeholders to adopt RE development plans. The government should devise a plan to provide essential security, an attractive incentive to investors, and decreased import duty and sales tax. Independent RE plant construction in remote areas and local manufacturing should be promoted.
3.4. Mandatory Policy and Follow-Up
It is necessary to prioritize environmental sustainability. Well-organized, eco-friendly, and established technologies should be adopted. Long-term planning and goals must be clear. Short-term targets should be followed up accurately. From time to time, an audit and a proper evaluation should be considered as part of the plan of all the subjective targets. It is compulsory to introduce a good regulatory mechanism for monitoring and management.
4. Conclusions
This study emphasized that long-term energy system planning is compulsory to cope with South Asian energy problems, and VRE is recommended as the most suitable alternative energy source. The level of penetration of VRE in the planning phase is entirely according to the geographical location and resource potential level. Based on the study of communications and literature sources from national and international organizations, we summarized the region’s characteristics and the different characteristics of each country. Among the significant problems in the region are energy poverty, the single source of electricity generation in each country, and moderate or poor financing issues. Various programs have been announced in the region’s countries to address these problems, which are essentially characterized by increasing the involvement of RES.
Providing more realistic insight, our study investigated the limits of the VRE integration capacity by the EnergyPLAN model for the conversion of the Pakistani electricity system. A more intensive scenario was developed compared with the official national plan, considering the system integration costs associated with the increase in the VRE share. Alternative scenarios were formulated, such as the increased level of renewable energies and their combination regarding the national plan as the BaU scenario to set more appropriate but, at the same time, ambitious targets.
With the help of the EnergyPLAN model for the conversion of the Pakistani electricity system, we developed a more intensive scenario compared to the official program, considering the system integration costs associated with the increase in VRE share. On the one hand, Pakistan’s selection criteria included that the country has the second-largest wind and solar potential after Afghanistan, and on the other hand, we found less ambitious plans to transform the electricity system into a RES base. Although several studies have found that 100% renewable electricity generation is insanity for countries in the region, we believe that it is more appropriate to set more realistic but, at the same time, ambitious targets. This can usually be achieved by formulating alternative scenarios, such as an increased level of renewable energies and their combination and regarding the official programs as the BaU scenario. The results show that this method is effective and can be extended to other countries in the region, and the long-term energy planning method helps countries achieve their climate goals.
This study focused on the generation side and considered those areas that are connected to electricity and did not deal with areas not connected to electricity. We see the electrification of these areas as feasible rather than expanding the electricity network, with a technological leap of sorts, in line with the views of many other researchers, where small- and medium-sized local networks are created in cooperation with new market methods like blockchain technology. We see the need to develop long-term planning further that these new technologies include in the design toolkits.


