Article

Study on Thermophysical Properties of Arc Plasma for Melting Magnesium Oxide Crystals at Atmospheric Pressure

School of Metallurgy, Northeastern University, Shenyang 110819, China
*
Authors to whom correspondence should be addressed.
Energies 2022, 15(3), 1036; https://doi.org/10.3390/en15031036
Submission received: 30 December 2021 / Revised: 27 January 2022 / Accepted: 27 January 2022 / Published: 29 January 2022
(This article belongs to the Topic Advanced Systems Engineering: Theory and Applications)

Abstract

:
The thermodynamic and transport properties of magnesium oxide crystal arc plasma have been researched under local thermodynamic equilibrium in this paper. The pure CO2 plasma in the arc initiation stage and Mg-CO mixtures plasma in the stable melting stage were selected. The parameter-variation method combined with Levenberg–Marquardt algorithm (PVM-LMA) is used to solve the plasma equilibrium compositions model established by mass action law from higher to lower temperature in sequence. Taking Mg50%-CO50% plasma as an example, the plasma number density of 7500 K is calculated according to 8000 K. The results show that the PVM-LMA algorithm has the advantages of fast and high precision. The comparisons to the results of pure CO2 in previous literature are displayed and our work shows better agreement with theirs. The results of Mg-CO mixtures indicate that the chemical properties of Mg atoms are more active and easier to ionize, which can effectively improve the electrical conductivity and thermal conductivity of plasma and reduce its viscosity.

1. Introduction

Magnesium oxide crystals have the characteristics of high purity, good calcium-silicon ratio, large crystal size and stable physical and chemical properties. It is an important material in metallurgical, chemical, electrical, aerospace, and other industrial fields. Magnesium oxide crystals are the product of magnesite after high temperature melting and cooling. The melting point of magnesium oxide crystals is higher, reaching above 3100 K. Electric arc furnaces are the only smelting equipment used to obtain magnesium oxide crystals. At the same time, smelting magnesium oxide crystal by electric arc furnace is also a work of high energy consumption, for instance, the theoretical energy consumption of smelting 1 ton magnesium oxide crystal is 2000 kilowatt-hours, and the actual production energy consumption up to 2900 kilowatt-hours. There is a large space for energy saving and it is of great significance to study the thermal process in the arc region. To my knowledge, we have not discovered any research or reports on the equilibrium compositions, thermodynamic and transport properties of melting magnesium oxide crystal plasma, or the arc performance research of magnesium oxide crystal arc furnaces. Therefore, it is of great significance to study the arc performance of magnesium oxide furnaces to further study the working process of electric arc furnaces.
The arc of a magnesium oxide crystal is a typical submerged arc, and most direct measurement methods are invalid. Currently, the most effective method for obtaining the corresponding physical properties is numerical calculation based on the basic theory of thermochemistry. The CO2 and Mg-CO mixture are the main components of the arc in a magnesium oxide crystal smelting furnace and are derived from MgCO3(s) →MgO(s) + CO2(g), MgO(s) + C(s) → Mg (g) + CO (g) and CO2(g) + C(s) → 2CO (g) reactions. MgCO3 is the main component of magnesite, the free carbon atom mainly originates from the heated electrode and arc agent; CO2 and caustic burned magnesia (MgO), are the intermediate products of magnesium oxide crystal, decomposed from magnesite. The plasma of the Mg-CO mixture is relatively special and rare, because Mg and CO are easily oxidized and cannot exist in the usual state, but it is the main form of the whole smelting process, while CO2 only exists briefly in the arc initiation stage. In this study, pure CO2 and different proportions of Mg-CO mixture plasma were analyzed and calculated to find the influence of Mg on the change in plasma thermomechanical properties.
Many studies have been carried out on plasma doped with metal vapor. Several phenomena in daily life are involved, such as high-pressure sodium lamps using mercury vapor and sodium vapor discharge, and fluorescent lamps [1] that emit visible light from fluorescent powder by emitting ultraviolet light from mercury vapor at low pressure. High-intensity discharge (HID) lamps [2] utilize the emissions from mercury, and other metals are combined such as sodium, scandium, and indium, to provide intense emissions for floodlighting, street lighting, and data projection. For some special plasma industrial processes, the influence of metal vapor on the performance of the plasma is obvious. The presence of Cu enhances the electrical conductivity of SF6-Cu plasmas, as discussed by Chervy et al. [3], Paul et al. [4] and Wang et al. [5]. The study of the composite diffusion coefficient by Zhong et al. [6], indicated that increasing the proportion of copper generally increases the magnitude of the four diffusion coefficients. Cressault et al. [7] also revealed the significant influence of metal vapor on SF6 and air plasma, and the results indicated that the peak value of the combined ordinary diffusion coefficient switched to the highest temperatures when the metal proportion increased, and the diffusion coefficient decreased when pressure increased. The presence of metal vapor in arc welding has a major influence on the thermodynamic, transport and radiative properties of the arc. It also determines the size and shape of the weld pool [8], and the distributions of the temperature, current density, and heat flux of the arc area. Murphy [9] also studied the role of shielding gas properties, and metal vapor in thermal plasmas for arc welding. Schnick et al. [10] presented a gas-metal arc welding (GMAW) model that considers metal vapor, and the influence of different values for the net radiative emission coefficient of iron vapor was examined.
However, the research of doped Mg metal or Magnesium oxide crystal arc plasma has not been reported, despite being an urgent task to provide new technical support for energy saving and emission reduction in the fused magnesium industry. The calculation process of the plasma transport parameters is divided into three main steps. The equilibrium composition model was constructed and solved, the collision integral was calculated according to the principle of interaction between particles, and the transport parameters were obtained by the Chapman–Enskog method.
The first step in calculating thermodynamic and transport properties is to obtain the composition distribution of the plasma. The equilibrium compositions under local thermodynamic equilibrium are constructed using the SAHA and Guldberg–Waage equations combined with mass conservation, the electric neutrality principle, and Dalton’s partial pressure law. In fact, the Jacobian matrix of the algebraic equations abstracted by this model is singular and it has always been a difficult problem to solve singular nonlinear equations. The minimization method proposed by Gordon and McBride [11] is the popular method to obtain plasma number density, and essentially uses Lagrange multipliers and Newton–Raphson iteration to solve the nonlinear equation system [12,13,14]. However, this approach must be sensitive to the initial value of the iteration. PVM is an algorithm that does not rely on initial values and solves the equations by introducing auxiliary equations, but the premise is that the parametric equation composed of the original equation and auxiliary equation must be non-singular, which also means that PVM can’t directly solve singular nonlinear equations. The Levenberg–Marquardt algorithm (LMA) can solve singular nonlinear equations [15] and reduce the probability of falling into local optimum by adjusting the trust region. In this study, the parameter-variation method [16] combined with LMA [17,18] (PVM-LMA) is adopted for batch solution from a higher to a lower temperature.
The collision integral is another important part for calculating the transport parameters. For a mixture of plasma doped with Mg, the collision integral of metal Mg with other neutral molecules is a difficult point in the study, because they cannot be obtained directly from the existing literature. Accordingly, the Lennard–Jones like phenomenological model potential [19] is introduced to calculate the interactions between particles, and hence their collision integrals. For collision integrals between other particles, we refer to the latest parameters and calculation methods. Finally, the Chapman–Enskog method is applied to calculate the transport parameters of the plasma based on the number density and collision integral.
The research in this paper is divided into four parts, and the research contents are as follows:
In Section 2, the plasma equilibrium compositions model under local thermodynamic equilibrium is built by the law of mass action. The PVM-LMA is adopted to batch solve this model from a higher to a lower temperature. The calculation method of the partition function of different types of particles and the relevant data and their sources are given simultaneously.
In Section 3, the model of thermodynamic and transport properties is selected to obtain the density, enthalpy, thermal conductivity, electrical conductivity, and viscosity of the pure CO2 and Mg-CO mixture plasma.
The collision integral as important information for calculating transport properties is detailed in Section 4. The interactions and collision cross section between particles i and j (i could be equal to j), are disposed by methods or data provided by the latest literature.
In Section 5, the equilibrium compositions, thermodynamic and transport properties are obtained over a wide temperature range at atmospheric pressure. The results of pure CO2 plasma are compared with those obtained in literature, and the influence of Mg metal on transport parameters was analyzed.

2. Equilibrium Compositions Model and PVM-LMA

2.1. Equilibrium Compositions
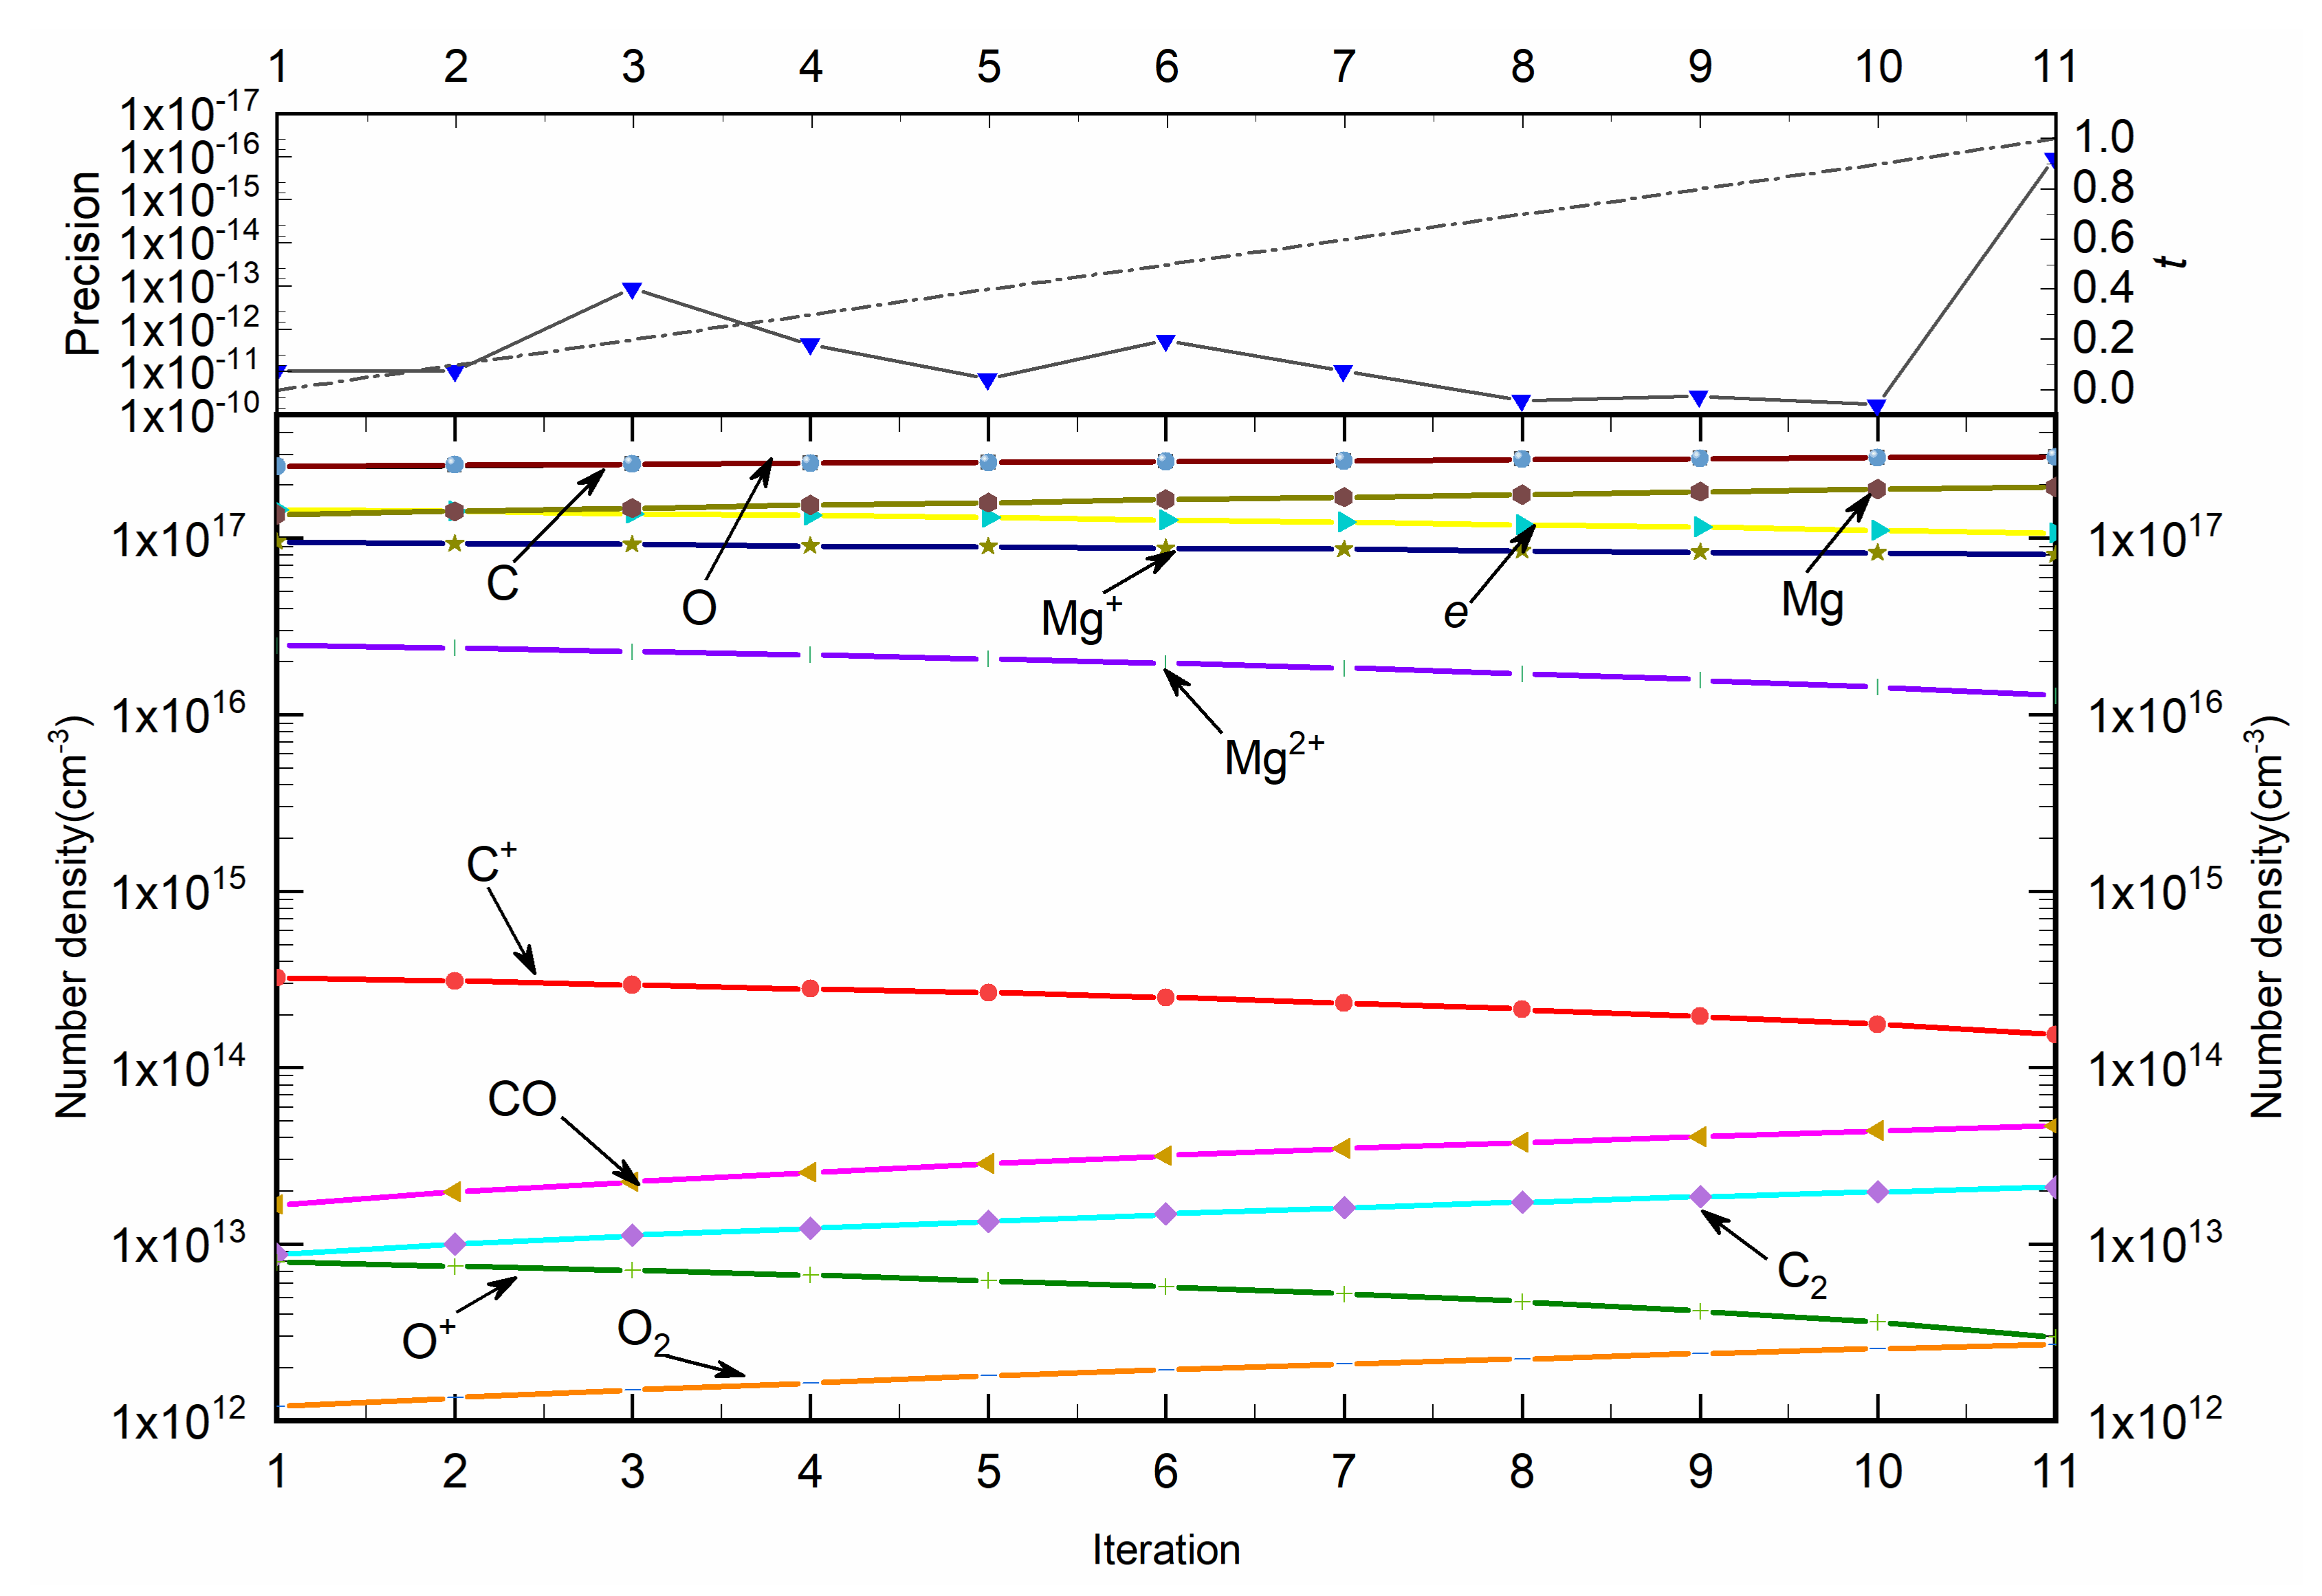
The plasma equilibrium compositions model under the local thermodynamic equilibrium condition, consists of four parts: Saha and Guldberg–Waage equations, mass conservation, charge conservation and Dalton’s law. For magnesium oxide crystal arc plasma, there are eight neutral molecules, 10 ions and electrons, along with five dissociation reactions and 10 ionization reactions, which are listed in Table 1 for molecules and Table 2 for reactions.
The equations of the compositions model are expressed by Equation (1). The first equation displays charge conservation; the second indicates that the ratio of two different elements is constant; this equation does not exist if the element number is 1 and there are Ne − 1 equations of this type, Ne is the element number (Ne = 3 in Mg-CO plasma and Ne = 2 in pure CO2 plasma); the third is the expression of Dalton’s law; the fourth and fifth equations are Saha’s equation, marking the ionization reaction, and Guldberg–Waage’s equation, indicating the dissociation reaction. For different chemical reactions, the coefficient values of the equation vary greatly, causing Equation (1) to exhibit an obvious weak singular characteristic.
F = f 1 n 1 , n 2 , , n N   = i n i z i = 0 f m n 1 , n 2 , , n N   = i n i l m , i c o n s t i n i l 1 , i = 0 f N e + 1 n 1 , n 2 , , n N   = i n i k B T p = 0 f n 1 , n 2 , , n N   = n e n r + 1 2 Q r + 1 Q r 2 m e π k T h 2 3 / 2 exp E I , r + 1 k B T n r = 0 f n 1 , n 2 , , n N   = n A n B Q A Q B Q A B 2 π m A m B k T m A B h 2 3 / 2 exp E d k B T n A B = 0
where p is ambient pressure, and ne and ni are the number density of electron and the i-th particle, respectively. kB is the Boltzmann constant, and T is the temperature. nzi is the number density of i-th atom element. zi is the charge on the i-th particle. Qr and Qr+1 are the partition functions of the r valence molecule or cation and the r + 1 valence cation of the molecule, respectively. Q is the internal partition functions, subscript AB, A B are molecular species. EI,r+1 is reaction energy of ionization reaction and Ed is energy of the dissociation reaction.

2.2. PVM-LMA

In this study, magnesium oxide crystal arc plasmas at a temperature range from 300 K to 30,000 K and atmospheric pressure were studied. At higher temperatures (T > 20,000 K), the electron and the highest cation are the main components of the plasma, and it is easy to calculate the number density of the plasma by taking them as the initial value of the numerical calculation. However, this assumption cannot satisfy the solution requirements at a lower temperature. The control equations are expressed as:
F x , t = t F x 1 t F x 0 = 0
where, F(x) and F(x,t) are solving and parameter control equations, and t is the variational parameter, 0 ≤ t ≤ 1. x(0) is the initial value of the iteration. It attempts to solve a set of N nonlinear equations F(x,t) = 0, by introducing one or more variational parameters t, and then solving the equations. It is easy to see that the two important parameters using this method are to determine N, and to obtain x(0) which is as close as possible to solution x*. The parameter control equation F(x,t) = 0 is also a Jacobian singular nonlinear system, and LMA can quickly solve singular equations with the given initial values. In this study, the equilibrium composition at a temperature, which is the minimum of higher than the current temperature is used to set x(0).
The PVM-LMA is proposed to solve the equilibrium compositions model in batches from higher to lower temperature. The calculation flow of PVM-LMA is shown in Figure 1. Tmax is any temperature that is higher than the solution temperature and have more accurate compositions. The calculation flow is divided into three parts. First, solve the value of parameter-variation number N. Second, according to the parameter value t, the parameter-variation equations is solved in sequence. Finally, if it fails, a local calculation method is proposed to reduce the variation frequency of parameters t to ensure the calculation accuracy. The authors summed up an immature experience, and suggested the difference ΔT = T(k+1)T(k), that if T > 15,000 K, then ΔT = 1000 K; if T > 8000 K, then ΔT = 500 K; if T > 5000 K, then ΔT = 100 K; if T > 3000 K, then ΔT = 50 K, else ΔT = 10 K. These suggestions can effectively bridge the gap between x(0) and x*, and can decrease N to improve the calculation efficiency.
The numerical density of Mg50%-CO50% mixture plasma at an atmospheric pressure of 7500 K is calculated by example based on 8000 K. The variations in each particle number density and precision with iteration are demonstrated in Figure 2. Many molecular number density values are too low to be displayed in the figure, such as CO+, O2+, MgO, C++, etc. It is not difficult to see from the figure that C and O atoms only have first-order ionization in the temperature range of 7500–8000 K, and some Mg atoms have lost two electrons, which is determined by the chemical properties of active metal Mg atoms. Ten LMA calculations were performed in the whole process, and calculation accuracy was 1.16 × 10⁻¹⁶.

2.3. Partition Functions

The internal partition function, Q, is the bridge connecting the microscopic state with the macroscopic thermophysical properties. Equations (3), (4) and (7) are the formulas for calculating the partition functions of atomic, diatomic and triatomic molecules, respectively [20]. For atoms, consider each electronic level states. For diatomic molecules, it involves the electronic, vibrational and rotational states. For polyatomic molecules, a simple harmonic partition function is adopted on the premise of ignoring rotational levels. In particular, the electron partition function Q = 2.
For atom:
Q = i w i exp ε i k B T
where, wi is the degeneracy and is a dimensionless constant, and εi is the atomic energy level term value of the i-th energy level, cm−1. The atomic energy level term values can be obtained from the National Institute of Standards and Technology (NIST) [21].
For diatomic molecule:
Q = e v r g e exp ε e k B T g v exp ε v k B T g r exp ε r k B T
ε and g are the diatomic molecular energy level term value and degeneracy, the subscript e, v, r represents the electrical, vibrational and rotational state, respectively.
The vibration energy of the v-th vibrational state and the e-th electronic state can be computed as follows:
ε v i b e , v h c = ω e v + 1 2 ω e x e v + 1 2 2 + ω e y e v + 1 2 3 +
ε r o t e , v , J h c = B v J J + 1 D v J 2 J + 1 2
where, B v = B e α e v + 1 / 2 and D v = D e β e v + 1 / 2 . ωe, ωexe, ωeye, Be, De, αe, and βe are the spectroscopic constants, and the Dv term is ignored because it is usually very small. Table 3 lists the spectroscopic constants for different energy levels of the diatomic molecules.
For polyatomic molecules:
Q = i m 1 exp h c ω i k T 1
m is the vibrational degrees of freedom, for linear molecules, m = 3n − 5, and nonlinear molecule m = 3n − 6, n is the number of atoms. In this study, only the CO2 molecule is considered, and it is a linear molecule with vibration freedom m = 4 and degenerate vibration frequencies of 2349 cm−1, 1337 cm−1 and 667 cm−1 (doubly degenerate).

3. Model of Thermodynamic and Transport Properties

3.1. Thermodynamic Properties

The average density ρ in Equation (8), internal energy e in Equation (9), specific enthalpy h in Equation (10), and constant-pressure specific heat cp in Equation (11) have been listed. According to statistical thermodynamics, the thermodynamic properties can be computed given the compositions and partition functions. The expressions are as follows:
ρ = m i n i
e = 3 2 k B ρ i n i T + 1 ρ i n i E i + k B ρ i n i T 2 ln Q i int T
h = 5 2 k B ρ i n i T + 1 ρ i n i E i + k B ρ i n i T 2 ln Q i int T
c P = h T
where, n, m, and E are the number density, mass, and formation enthalpy of the molecule and Qint is the internal part of the partition functions.

3.2. Transport Properties

The transport properties reflect the parameters of material conduction, heat transfer energy and flow state. For plasma, it is performed by Chapman–Enskog method, and assuming that the molecular number density distribution is a first-order perturbation to the Maxwellian distribution, which is then expressed in a series of Sonine polynomials [32], finally leading to a system of linear equations that can be suitably solved to obtain different transport properties. In this study, the expressions reported by Devoto [33,34] were adopted to calculate the transport properties.

3.2.1. Diffusion Coefficients

The binary diffusion coefficients D i j b for the i-th and j-th species are computed by:
D i j b = 3 k B T i T j 16 p μ i j Q i j 1 , 1
where Ti, and Tj are the temperatures of the i-th and j-th species, respectively. p is the total pressure of plasma. Q(1,1) is the first-order collision integral given by Equation (25). μij is the reduced mass, and the expression is
μ i j = m i m j m i + m j
mi, and mj are the molecular masses of the i-th and j-th species, respectively.
The multivariate diffusion coefficient Dij is obtained by the first-order approximation of the binary diffusion coefficient, and is expressed as follows:
D i j = F j i F i i m j F
F i j = 1 ρ n i D i j b + l i n l m j m i D i l b 1 δ i j
F is a two-dimensional matrix composed of Equation (15). δij is the Kronecker delta function. Fji is the cofactor of F, and |F| is the determinant of matrix F.

3.2.2. Thermal Conductivity

Thermal conductivity is the summation of the electron translational, heavy species translational, internal and reactive thermal conductivities. The expression of the plasma thermal conductivity is given by [14]
λ = λ t r , e + λ t r , h + λ r + λ int
where, λ, λtr,e, λtr,h, λr and λint represent the total thermal conductivity, electron translation, heavy particles translation, reactive and internal thermal conductivities, respectively. The translational part makes a distinction between electrons and heavy particles, second-order and first-order approximate calculation methods were adopted, respectively, and they are represented by Equations (17) and (18).
λ t r , e = 75 n e 2 k B 8 2 π k B T m e 1 / 2 q 11 q 12 2 q 22 1
The formula for qij is detailed in the [34,35].
λ t r , h = 75 k B 8 2 π k B T q q i j 00 q i j 01 q i j 10 q i j 11 n i n j / m j
where q m n i j has been introduced by Brokaw [33].
The internal thermal conductivity is caused by the existence of vibrational and rotational degrees of freedom in the molecules and electrons do not exist. The internal thermal conductivity of heavy particles was calculated by Eucken [32] and expression reported by Capitelli et al. [36].
λ int = i e p D i i R T h C p , i 5 2 R j e x j D i i x i D i j 1
where, R, Cp,i are the gas constant and constant-pressure specific heat of the i-th particle, respectively. xi and xj are the mole fractions of the i-th and j-th particles, respectively.
The reaction thermal conductivity describes energy changes of two chemical reactions, including an endothermic process for the forward reaction and exothermic process for the reverse reaction. Exothermic processes occur mainly at low temperatures. Equation (20) is the expression given by Brokaw [37].
λ r = 1 k B T 2 A A 11 A 1 M Δ H 1 A M 1 A M M Δ H M Δ H 1 Δ H M 0
where ΔHi is the reaction enthalpy of the i-th reaction. A is a two-dimensional matrix and Aij can be obtained by
A i j = k = 1 M 1 l = k + 1 M k B T p D k l b x k x l ν i k x k ν i l x l ν j k x k ν j l x l
vik is the stoichiometric coefficient of k-th particle in i-th reaction.

3.2.3. Electrical Conductivity

Electrical conductivity can be computed using the expression reported by Ghorui [38], neglecting the contribution of the ions.
σ = 3 π 2 k B T e m e 1 / 2 e 2 n e 2 q 11 q 12 q 21 q 22 q 00 q 01 q 02 q 10 q 11 q 12 q 20 q 21 q 22

3.2.4. Viscosity

Viscosity in the first-order approximation is given by
μ = 5 2 π k B T h 2 q ^ i j 00 n j m j n j 0 q ^ i j 00 1
q ^ h k 00 = 8 n h m h m k l n l m l m h + m l 3 / 2 10 3 Q h l 1 , 1 δ h k δ k l m k + 2 m l Q h l 2 , 2 δ h k + δ k l
where the elements q ^ h k 00 , which take into account collision integrals, are reported in Devoto [39].

4. Collision Integral

Collision integrals, which are averaged over a Maxwellian distribution of the transport collision cross-sections for the binary interaction between species, are the determinants for calculating transport properties. Collision integrals for the interaction between species i and j are defined as:
Q ¯ i j l , s T i j * = 2 l + 1 s + 1 ! 2 l + 1 1 l 0 + e γ 2 x 2 γ + 3 Q i j l ε d x
where γ 2 = μ i j g i j 2 / 2 k B T . The transport cross-section of the order l can be computed using Equation (26), if the tabulations of the collision integrals are invalid.
Q i j l = 2 π 0 + 1 cos l χ b d b
where b and χ are the impact parameter and the angle of deflection, respectively; the angle of deflection is given by the expression:
χ = π r c d r / r 2 1 2 υ r / μ i j g 2 b 2 / r 2
where r and υ(r) are the distance and interaction potential between the particles, respectively.

4.1. Neutral–Neutral Interactions

For neutral–neutral interactions, the exponential repulsive potential is adopted to calculate the collision integral between nonmetallic neutral particles, and can be expressed as
φ i j r = V 0 exp β r
where, V0 and β are the coefficients, and most of them are available from references [40,41].
Regarding the interaction potential between Mg and other non-metal particles, the author did not find direct supporting data. The Lennard–Jones like phenomenological model potential is an improvement of the Lennard–Jones function, proposed by Laricchiuta and Colonna et al. [19]. This potential is valid in the entire interaction range and could allow the direct evaluation of collision integrals for different atmospheres. The interaction expression of the Lennard–Jones like phenomenological is
φ i j x = ε 0 m n x m 1 x n x n x n x m 1 x m
where x = r/re, and n(x) = β + 4x2. For the neutral–neutral case, the values of m = 6 and neutral–ion cases are m = 4. The value of the β parameter can be estimated by the following empirical formula Equation (30) and it ranges from 6 to 10 depending on the hardness of the interacting electronic distribution densities [42].
β = 6 + 5 s i + s j
where the subscripts i and j identify the colliding partners. The softness s is defined as the cubic root of polarizability. The polarizabilities of molecules can be found in book “Handbook of Chemistry and Physics” [43]. For open-shell atoms and ions, a multiplicative factor, which is the ground state spin multiplicity, should also be considered.
The phenomenological method represents the binding energy, ε0, and the equilibrium distance, re, in terms of polarizabilities of the interacting partners, α, by the following correlation formulas [44]
r e = 1.767 α 1 1 / 3 + α 2 1 / 3 α 1 α 2 0.095
ε 0 = 0.72 C d r e 6
where re is given in Å, α in Å3, and ε0 in eV. The Cd constant (eV Å6) is an effective long-range London coefficient
C d = 15.7 α 1 α 2 α 1 / N 1 + α 2 / N 2
where, N is the effective number of electrons that contribute to the polarization of the neutral species.
In this study, we calculated the equilibrium distance and binding energy between Mg and C, Mg-Mg, and Mg-O particles. The relationship between the reduced phenomenological and reduced distance is illustrated in Figure 3. The equilibrium distance is 4.55Å, and the binding energy is 7.65 × 10⁻³ eV for Mg-C particles, 4.51 Å and 4.05 × 10⁻³ eV are the related values for Mg-O, and 4.96 Å and 0.029 eV is the equilibrium distance, and binding energy of Mg-Mg particles, respectively. In regard to the collision integral, the Ω(1,1), Ω(1,2), Ω(1,3) and Ω(1,4) for different particles have been computed, Figure 4 illustrates the curves of collision integrals of Mg-C, Mg-Mg and Mg-O as a function of temperature.

4.2. Neutral–Ion Interactions

For neutral–ion interactions, two processes should be considered: purely elastic collisions and inelastic resonant charge-exchange processes [45]. When l is 1 or 3, the second process plays an important role in obtaining the collision integrals Ω i j l , s . The total collision integrals are estimated using Equation (34):
Ω l , s = Ω i n l , s 2 + Ω e l l , s 2
Ω l , s is the total collision integral ignoring the subscripts i and j, Ω i n l , s and Ω e l l , s are the elastic collision integrals and inelastic collision integrals for particle i and j.
The interactions with charge exchange transport cross-sections are given by
Q i j l = 2 A B ln g 2
where, g is the relative velocity between particles; A and B are constants, which can be obtained from experimental data or theoretical calculations. The values for O and O+ could obtain by Rutherford and Vroom [46]; For O2 and O2+, this have been studied by Capitelli, Giordano and Gorse C et al. [47]; About C and C+, we can refer to André, Aubreton and Clain et al. [48].
For elastic collisions, the polarization potential model was being selected and its expression is
φ i n r = 1 4 π ε 0 2 Z i e 2 α n 2 r 4
where, Zi is the ion charge number and αn is the polarizability of the neutral species. ε0 is the permittivity of vacuum and e is the electron charge. For the polarization potential, collision integrals were obtained quickly in a closed form, and the calculation formula has been listed by Wang and Rong et al. [45] and Bruno and Catalfamo et al. [49].

4.3. Electron–Neutral Interactions

When differential cross-section data are available, transport cross-sections can be directly calculated using Equation (25). Table 4 lists the calculation methods of collision integrals between electrons and different neutral particles, which are directly quoted in this study.

4.4. Charged–Charged Interactions

The interaction between charged particles adopts the screened Coulomb potential formula,
φ i j r = Z i Z j e 2 r 2 exp r λ D
where, Zi, and Zj are the charges of charged particles i-th and j-th, respectively, e is the charge of an electron charge, and λD is the Debye length of these plasmas, which can be expressed as follows:
λ D = ε 0 k B T e 2 n e
where, ε0, and ne are the permittivity of vacuum and the electron number density, respectively.

5. Results and Discussion

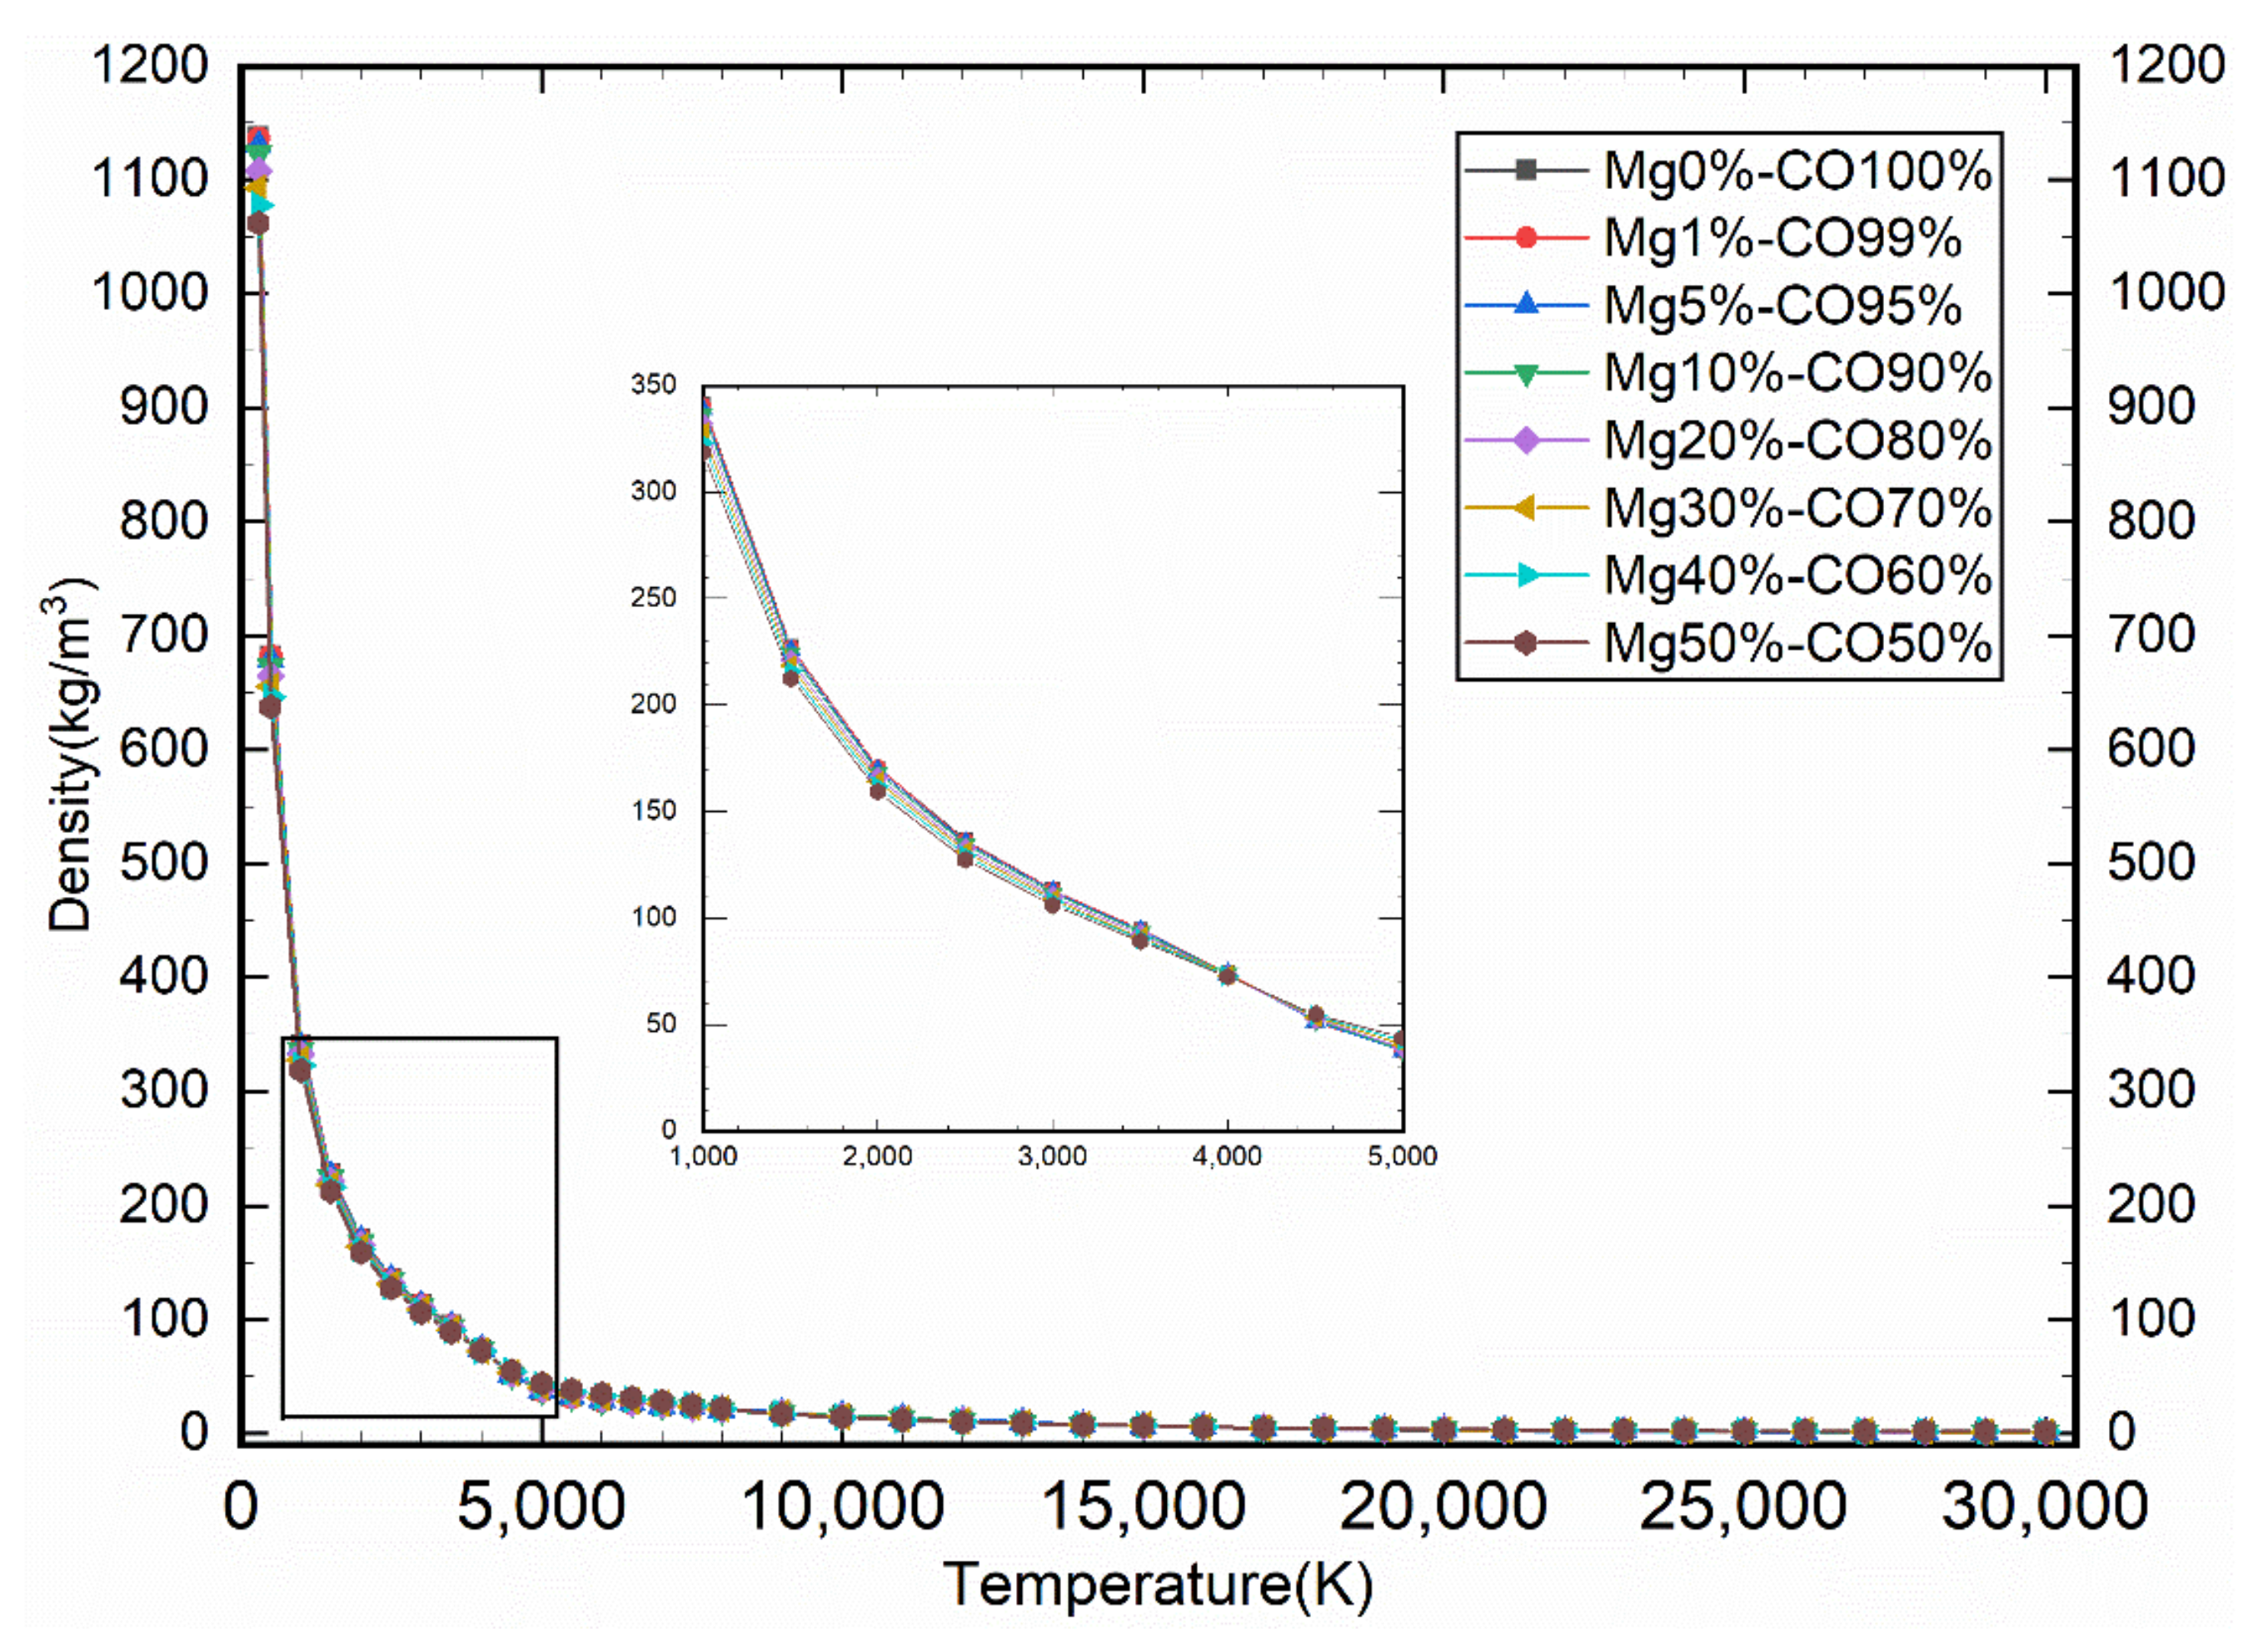
5.1. Equilibrium Compositions

The plasma composition, which is required to obtain thermodynamic parameters, transport coefficients and radiative characteristic parameters, was calculated assuming chemical equilibrium. In this study, the number densities of pure CO2, Mg0%-CO100%, Mg1%-CO99%, Mg5%-CO95%, Mg10%-CO90%, Mg20%-CO80%, Mg30%-CO70%, Mg40%-CO60% and Mg50%-CO50% mixtures at temperatures ranging from 300 to 30000 K, under atmospheric pressure were calculated, and the results are illustrated in Figure 5 and Figure 6. This picture shows that the first ionization of O occurs at about 10,000 K and C and at 14,000 K. Figure 5 shows that these results are in good agreement with those of Yang et al. [58]. We inferred that electron and highest atomic cations (e, C3+, O3+, Mg2+, N3+) are the main components at higher temperatures, such as T > 25,000 K. The decomposition reaction of polyatomic molecules is more thorough, and the ionization reaction of atomic molecules is deeper. In the temperature range of 2000 K to 8000 K, all types of reactions exist in parallel, including dissociation, recombination and ionization reactions.
It was observed that the number density of the intermediate product experienced a parabolic process of increase and then decrease, as CO2, C2 and O2. With an increase in temperature, the intensity of the ionization reaction of O2 (O2 ⇌ O2+ + e) is obviously higher than that of O2 (O2 ⇌ O + O), and the number density of O2+ is higher than that of O2.
It can also be observed from Figure 6 that the chemical properties of Mg are relatively active, and its ionization reaction occurs at a lower temperature than the decomposition reaction of CO. The temperature of the first-order and second-order ionization reaction occurs at 2600 K and 4200 K, which is obviously earlier than the first and second order ionization of C and O atoms. Mg2+ molecules have higher molar coefficients at lower temperatures. The presence of MgO is extremely low and almost impossible to detect. Concurrently, owing to the low ionization reaction temperature of the Mg atom, the electron overflow temperature of the plasma containing Mg atoms is approximately 2600 K earlier than that of pure CO plasma.

5.2. Thermodynamic Properties

Thermodynamic parameters are the most direct data for studying the temperature distribution in the arc macroscopically. The comparisons to the results of pure CO2 density and enthalpy in previous literature are displayed in Figure 7. Compared to the results of Yang et al. [58], our work shows better agreement with theirs. The calculated densities and enthalpies at different proportions for Mg and CO are illustrated in Figure 8 and Figure 9. As illustrated in these figures, the relationship between the density and temperature presents an approximate exponential function. With an increase in temperature, the density of plasma drops sharply until it remains at a low level, but the overall trend continues to decline. The enthalpy of all plasmas indicated an upward trend. When the temperature was lower than 5000 K, the value remained at a low level. In the range of 5000–15,000 K, the enthalpy increases rapidly, and the growth rate slows down after 15,000 K.
Evidently, from Figure 8, at the same temperature, the higher the ratio of Mg molecules, the lower the density of the plasma, because the molecular weight of Mg is lower than that of CO. In particular, the difference in plasma density of different proportions of Mg below 6000 K is higher than that at temperatures above 6000 K, which is caused by the fact that the total number density of the plasma gradually decreases while the proportion of Mg atoms does not change.
Evident from Figure 9, the enthalpy value overturns in the temperature range of 7000–8000 K, and the enthalpy value of Mg50%-CO50% changes from the maximum to the minimum at the same temperature. This is because after 7300 K, Mg exists mainly in the form of Mg2+, the first-order ionization reaction (Mg ⇌ Mg+ + e) is completely completed, and the number of Mg+ particles is quite negligible. Specifically, the intensity of the reaction Mg+⇌ Mg2+ + e is extremely low, and the enthalpy value caused by the chemical reaction is approximately 0. With an increase in the proportion of Mg, the enthalpy decreased. When the temperature is higher than 15,000 K, the particles in the plasma are mainly electrons and the highest value of atomic ions. The enthalpy increase caused by the chemical reaction decreases with an increase in temperature, therefore the enthalpy increase tends to slow down.

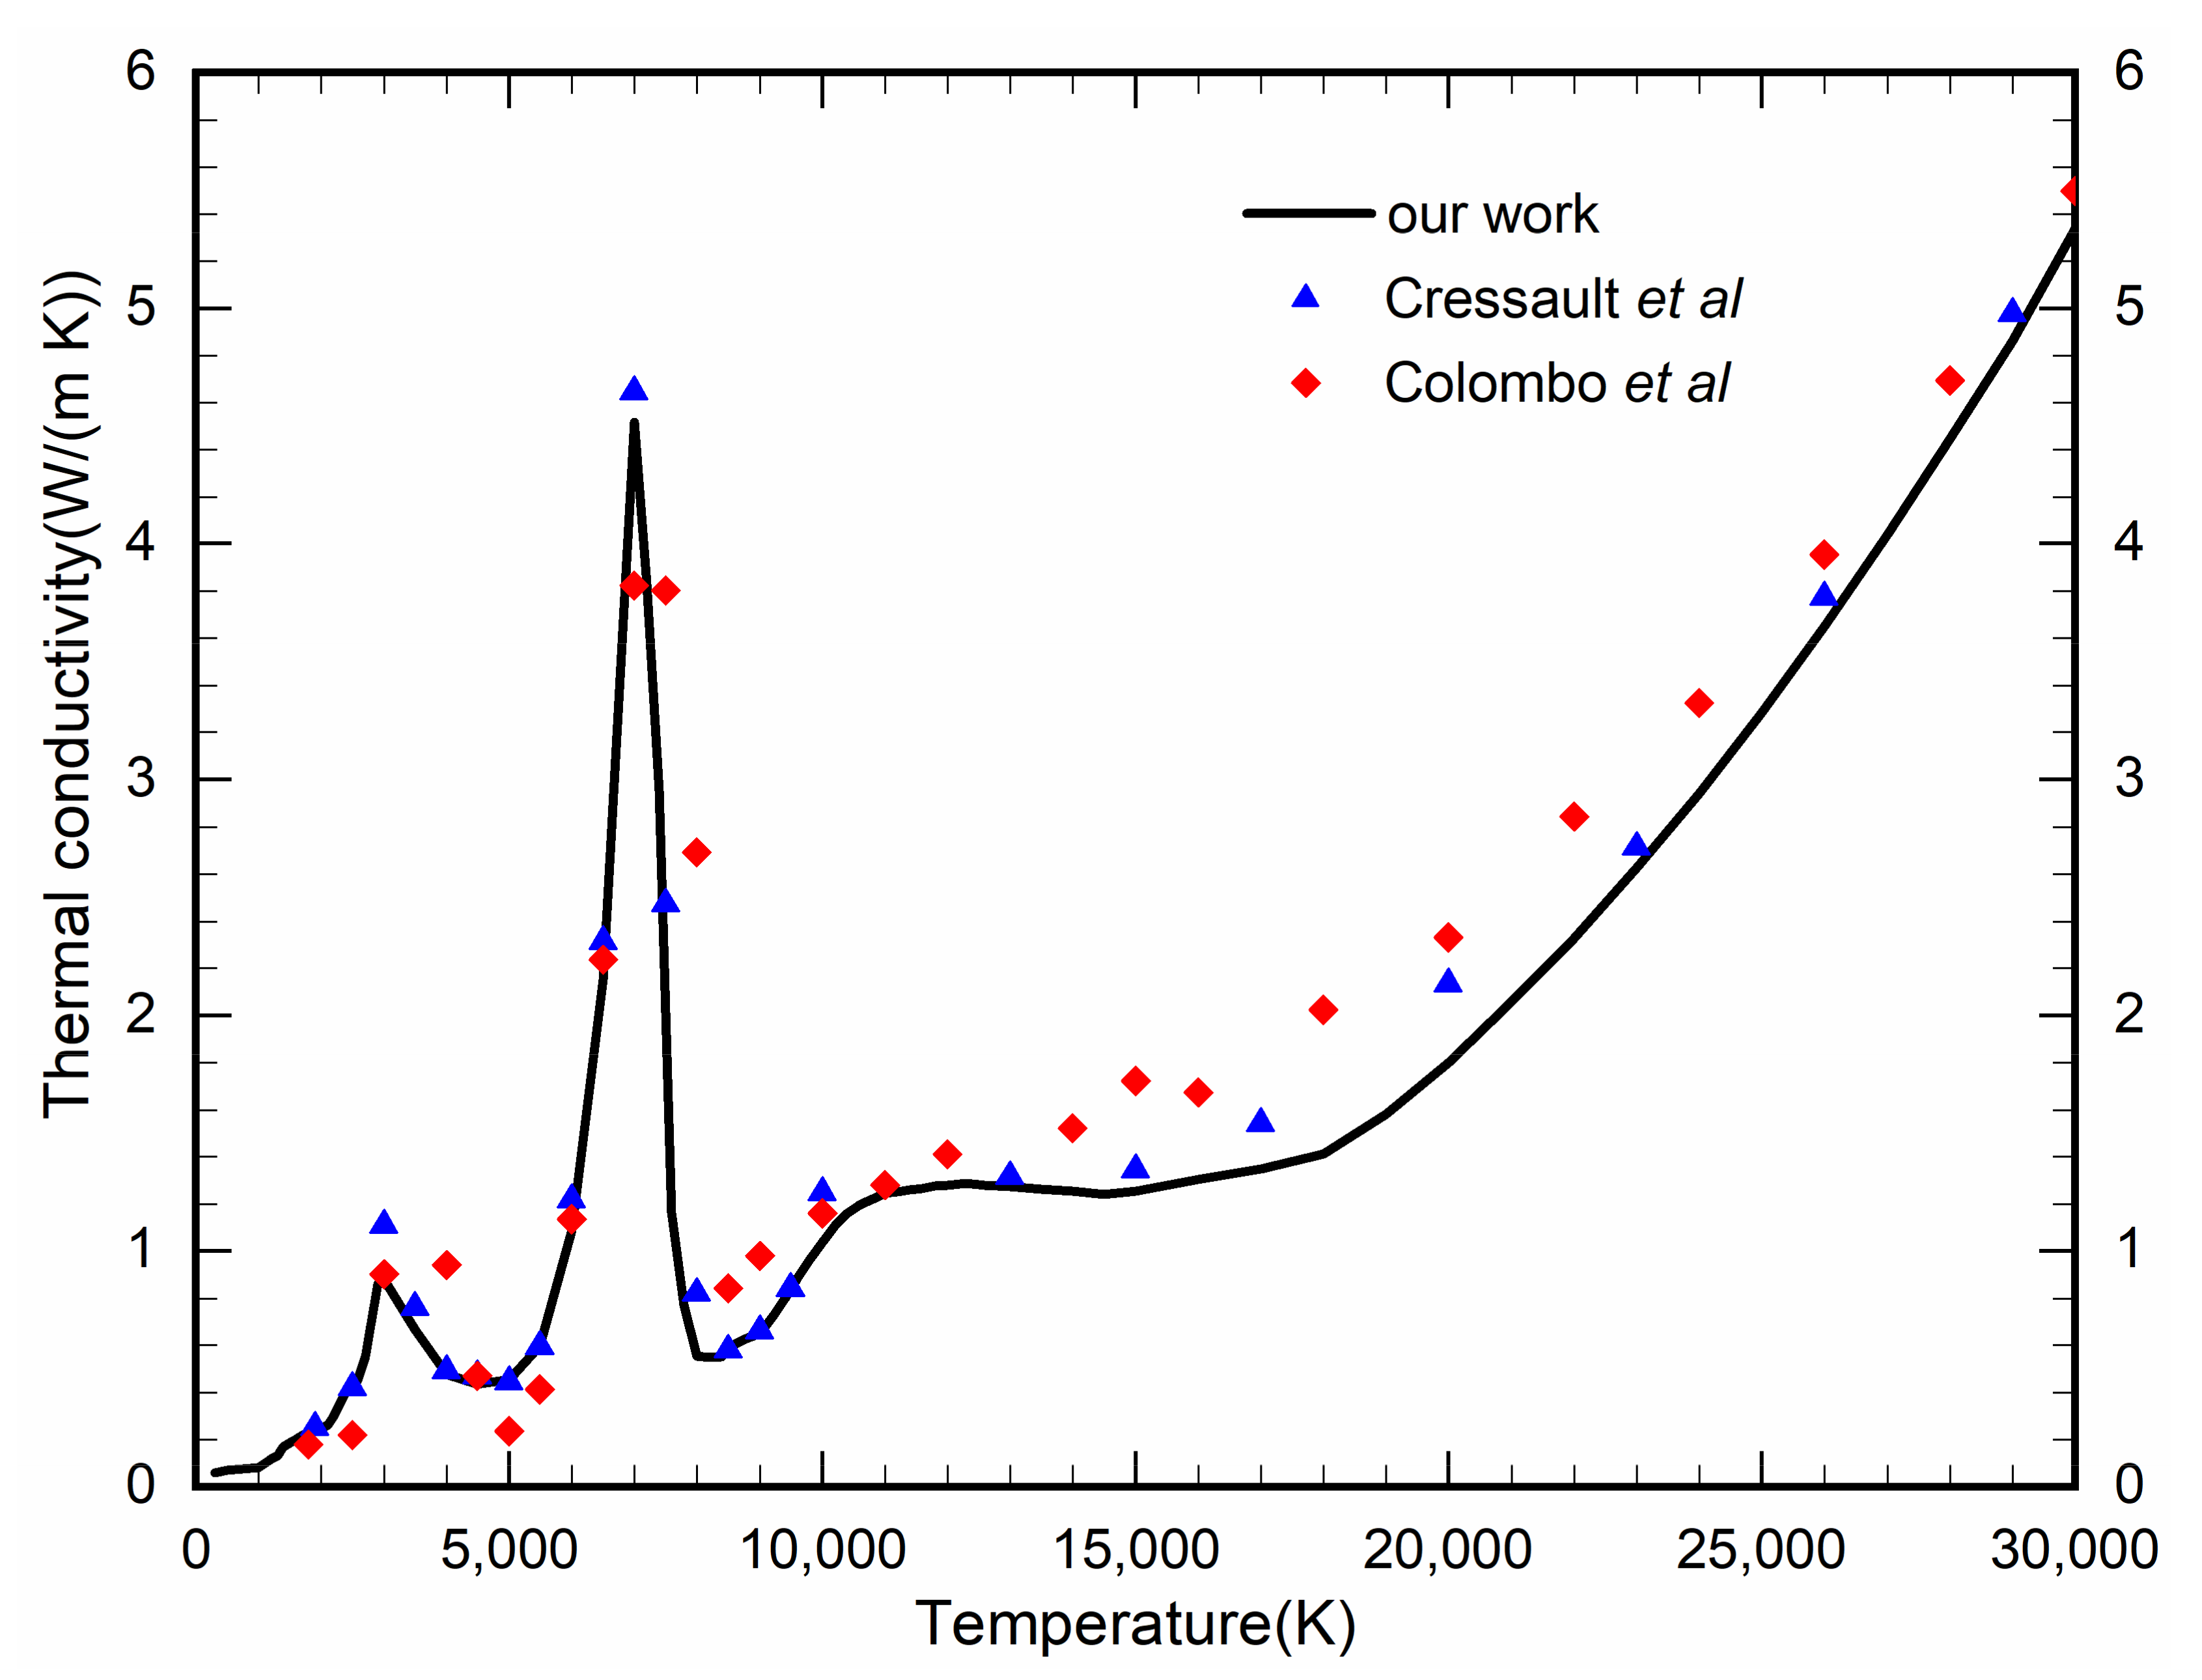
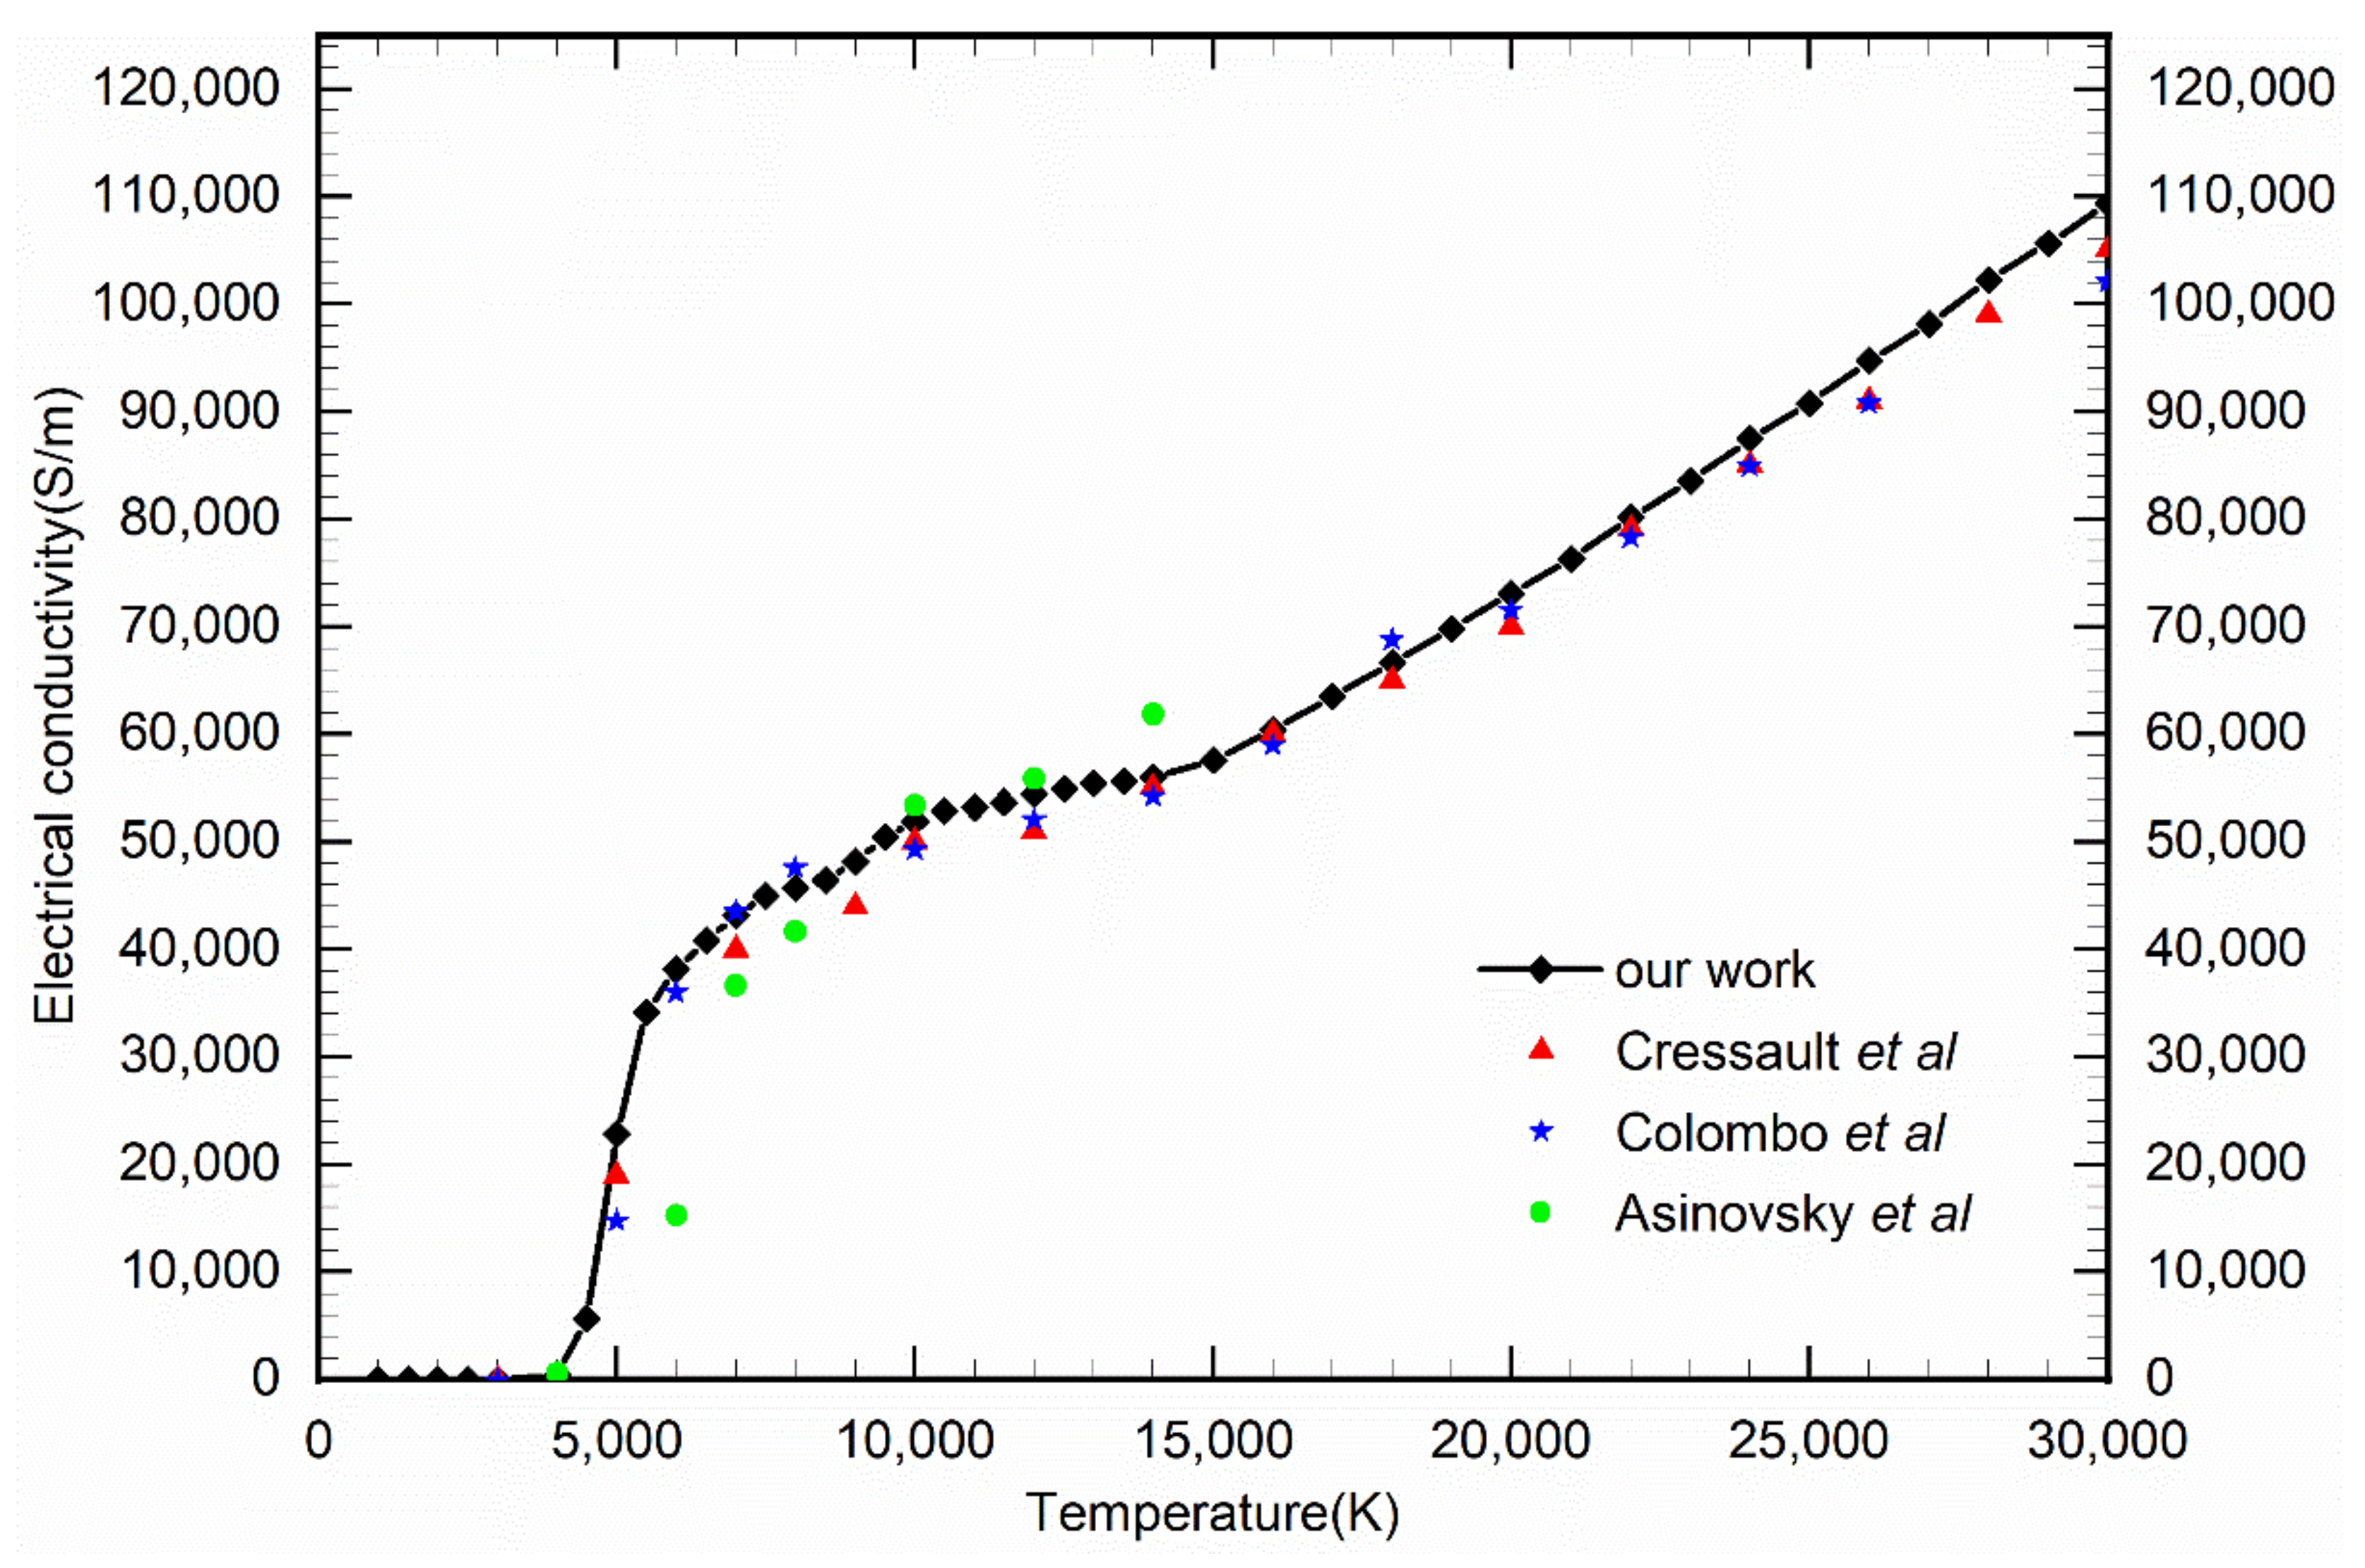
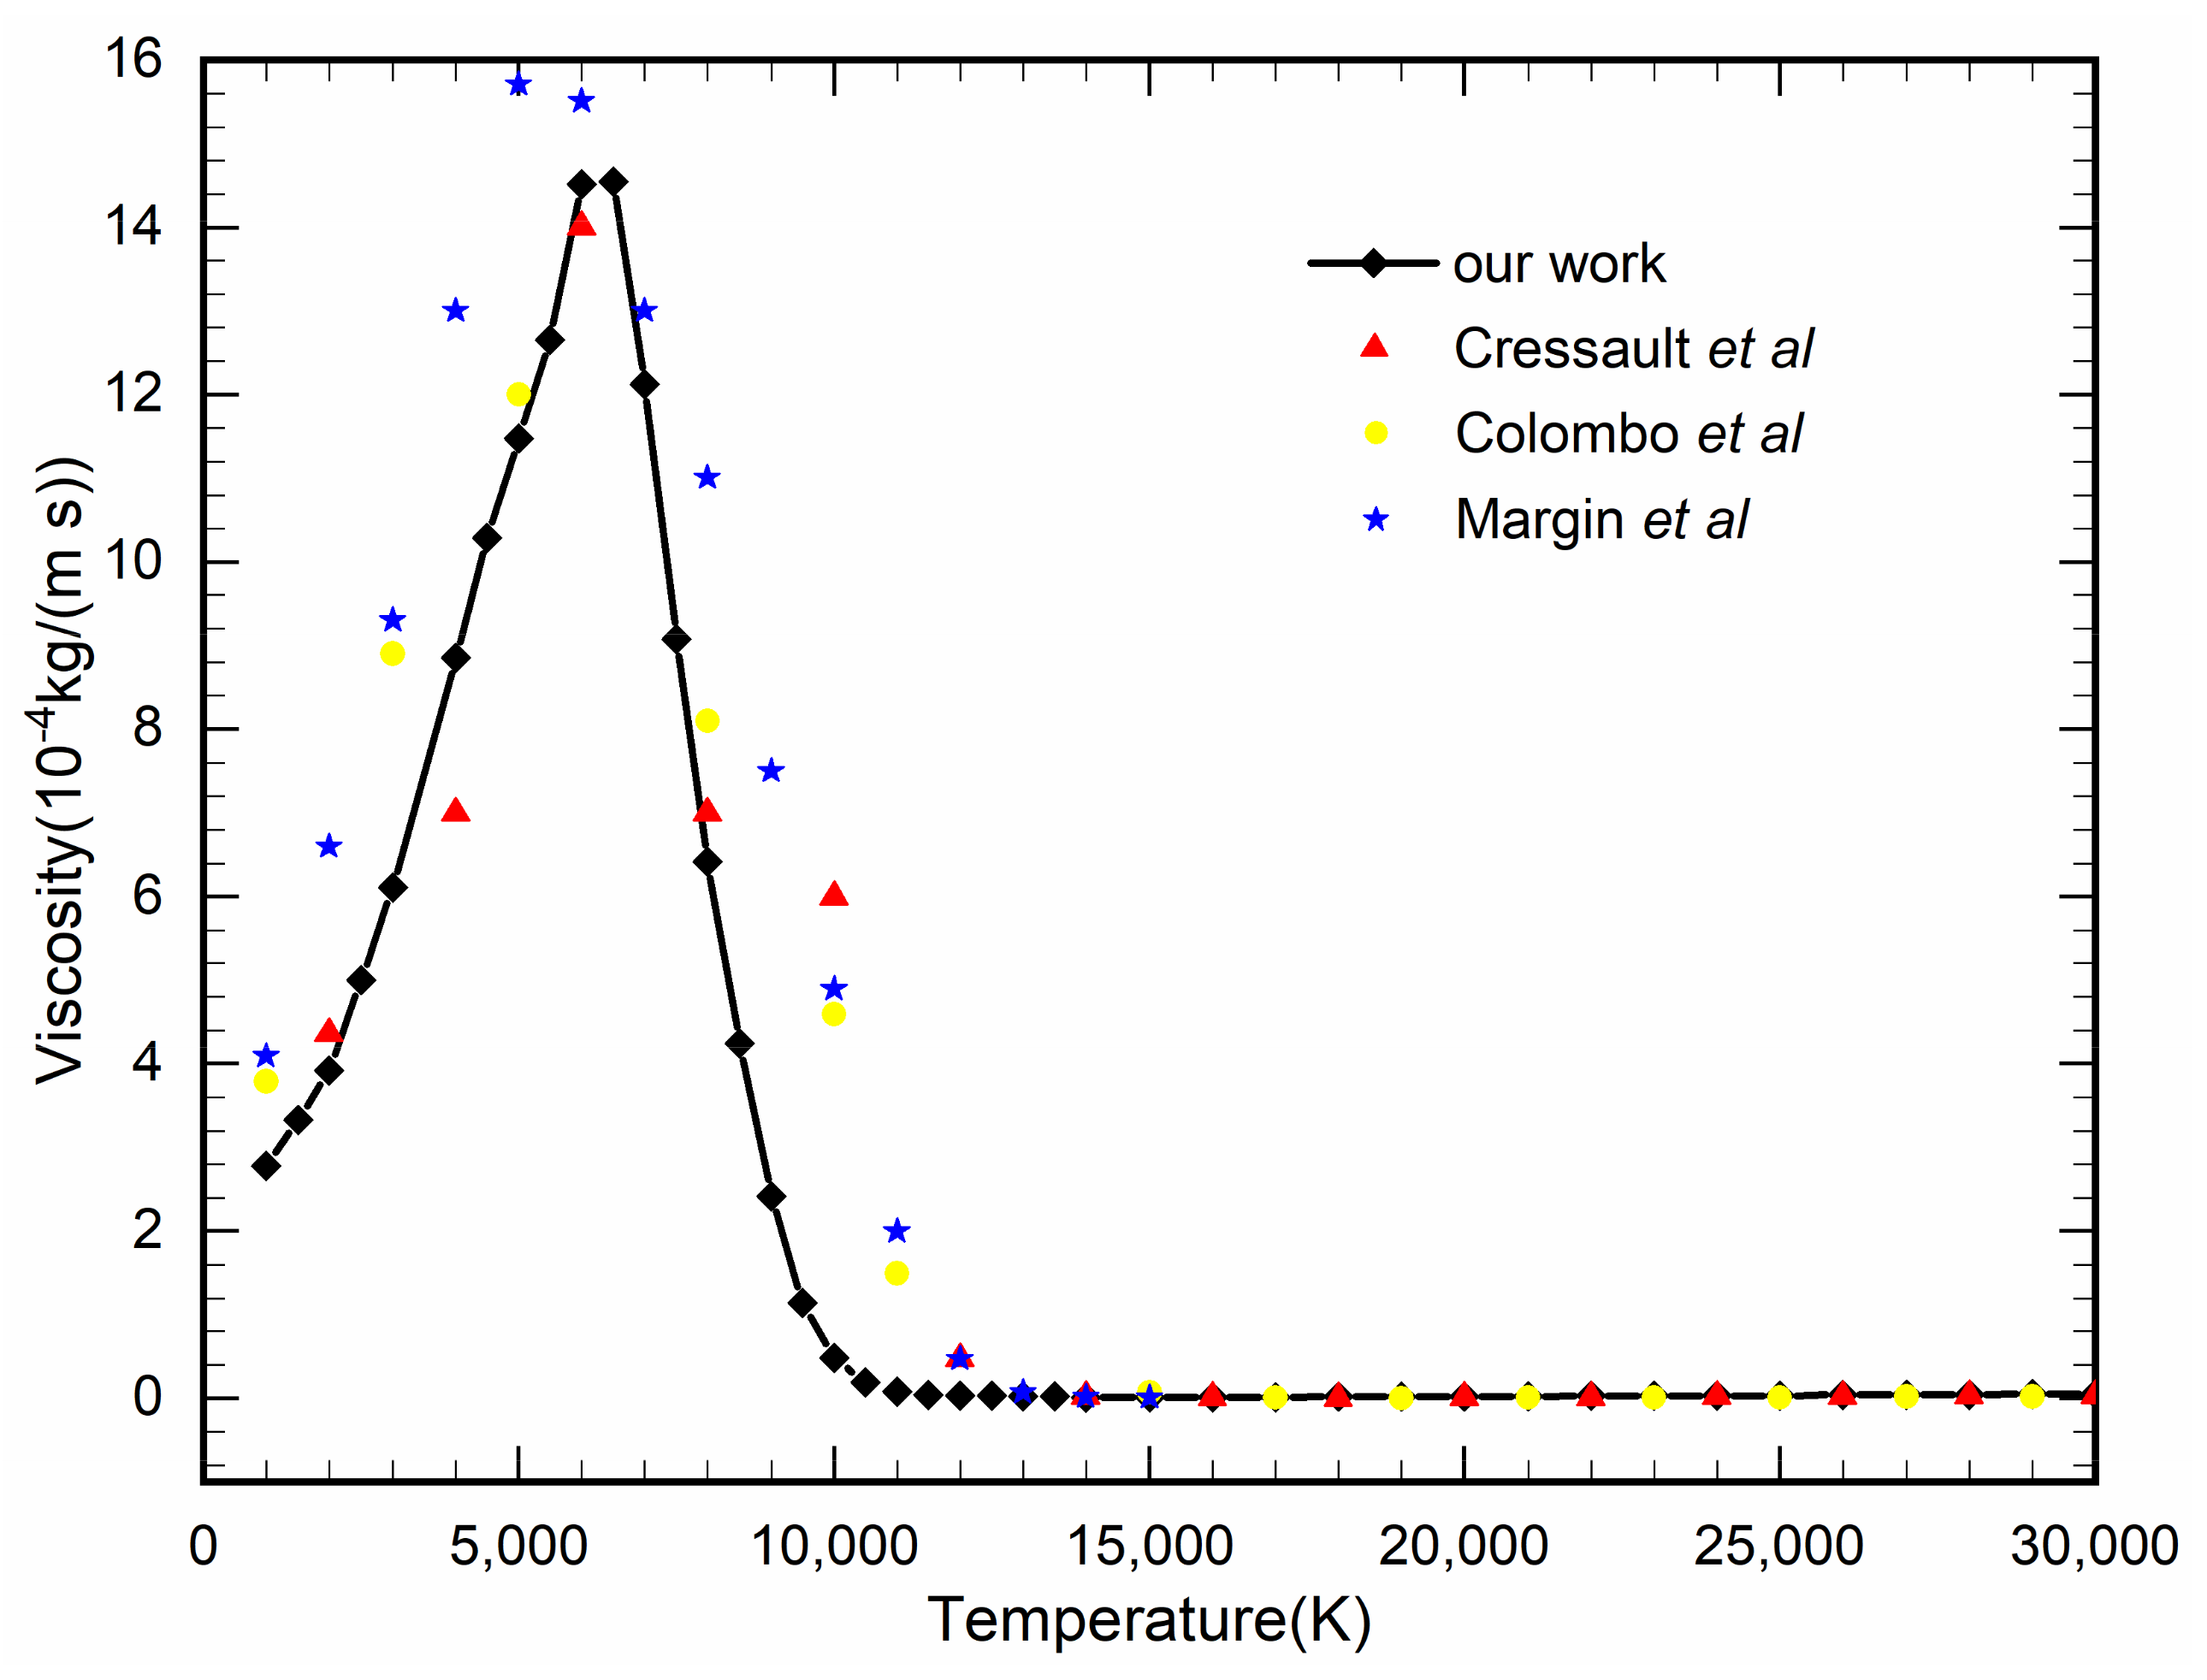
5.3. Transport Properties

Figure 10, Figure 11, Figure 12, Figure 13, Figure 14 and Figure 15 illustrate the curves of thermal conductivity, electrical conductivity and viscosity for pure CO2 and Mg-CO plasma in the 300–30,000 K temperature range at 0.1 MPa. The comparisons to the results of pure CO2 thermal conductivity, electrical conductivity and viscosity in previous literature are displayed in these figures. Compared to the results of other authors, our work shows better agreement with Cressault et al. [59] and Colombo et al. [60] for thermal conductivity, Cressault et al. [61], Colombo et al. [61] and Asinovsky et al. [62] for electrical conductivity and Cressault et al. [61], Colombo et al. [60] and Margin et al. [62] for viscosity. Such as, the electrical conductivity value presented by Cressault et al. at 5000 K is about 20,000 S/m, our result is 20,600 S/m; The maximum thermal conductivity value of Cressault et al. is about 4.43 W/m/K, our result is 4.4 W/m/K; The maximum viscosity value presented by Cressault et al. is about 14 × 10−4 kg/m/s, occurring at about 6000 K, our result is 14.1 × 10⁻⁴ kg/m/s at the same temperature.
Figure 11 illustrates the variation curve of total thermal conductivity with temperature under different Mg element proportions. Consider the entire temperature range from 300 to 30,000 K, the thermal conductivity increases with the temperature. However, in the range of 5000–10,000 K, the value of total thermal conductivity is significantly enhanced, which is caused by the variety and intensity of chemical reactions in this temperature range. When the temperature is lower than 5000 K, the thermal conductivity is negligible, and it also varies very little with temperature. Higher than 10,000 K, the thermal conductivity gradually increases, and the increase is getting faster and faster. These are determined by the number density of the most active electron.
It is also easy to deduce from Figure 11 that the thermal conductivity is different owing to the different proportions of Mg in different temperature ranges. The entire temperature range can be approximately divided into three parts: below 5000 K, 5000–10,000 K, and above 10,000 K. In the first interval, the higher the concentration of Mg, the higher the thermal conductivity. This is caused by the ionization reaction of the Mg atoms at a lower temperature. The larger the Mg atom proportion, the greater the thermal conductivity of the reaction and the greater the total thermal conductivity. In the intermediate temperature range, the major contributor to the thermal conductivity is the reaction thermal conductivity of other atoms. The intensity of the chemical reactions related to Mg has been reduced, and its contribution has decreased. Thus, the higher the proportion of Mg atoms, the lower the total thermal conductivity.
The curve of conductivity of Mg-CO plasma with temperature in the range of 300–30,000 K is illustrated in Figure 13. From a global perspective, the electrical conductivity increases with increasing temperature. The main factor affecting the electrical conductivity is the electron number density, the higher the electron number density; the stronger the electrical conductivity. The chemical properties of Mg atoms are relatively active, and ionization reactions can occur at a lower temperature, thus precipitating electrons. In contrast, the ionization temperature of pure CO gas is much higher than that of Mg atoms, which can be directly seen in this figure. In the case of low temperature, the larger the Mg atomic proportion, the higher the electron number density obtained by the ionization reaction and the stronger the electrical conductivity. The same was true at higher temperatures.
The curves of viscosity for different proportions of Mg-CO mixture plasma at temperatures of 300–30,000 K and 0.1 MPa is illustrated in Figure 15. Momentum transport is responsible for the viscosity of the plasma. This is due to the increase in particle velocity with temperature. Viscosity mainly depends on the momentum transmission of heavy particles, lower temperature, and the smaller speed of heavy particles, resulting in a drop in momentum transport, and decrease in viscosity values. For temperatures higher than 10,000 K, the long-range Coulomb force between charged particles increases because of an increase in charged particles, and a decrease in the viscosity. Mg atoms ionize at a lower temperature and generate charged particles, resulting in a long-range Coulomb force as early as possible to exert a blocking effect. The larger the proportion of Mg, the lower the viscosity value.

6. Conclusions

In this study, magnesium oxide crystal arc plasma was studied and analyzed. The pure CO2 plasma and different proportions for Mg-CO mixtures plasma of Mg0%-CO100%, Mg1%-CO99%, Mg5%-CO95%, Mg10%-CO90%, Mg20%-CO80%, Mg30%-CO70%, Mg40%-CO60% and Mg50%-CO50% are selected. The equilibrium plasma composition model under local thermodynamic equilibrium condition was established by the Saha and Guldberg–Waage equations combined with the mass and charge conservation equations, and Dalton’s law. The PVM coupled with the LMA algorithm was adopted to solve this model from higher temperatures to lower temperatures. The Chapman–Enskog method was adopted to construct an accurate plasma transport properties model. For the interaction between metallic Mg atoms and nonmetallic molecules, the Lennard–Jones like phenomenological model potential was adopted to calculate the collision integral. The thermodynamic parameters of the mixtures were also calculated. Results are as follows:
The PVM combined with the LMA algorithm can solve the singular nonlinear equations of the Jacobian matrix and this algorithm can solve the plasma composition model in batches with high solution accuracy.
As an active metal, Mg can significantly increase the thermal and electrical conductivities at low temperatures.
The ionized electrons from Mg can promote the ionization of other molecules, and the long-range Coulomb force between charged particles effectively reduces the viscosity of the plasma.

Author Contributions

Conceptualization, Z.C. and W.Z.; methodology, Z.C.; software, Z.C.; validation, Z.C., Q.Y. and W.Z.; formal analysis, Z.C. and Q.Y.; investigation, Q.Y.; resources, W.Z.; data curation, Z.C.; writing—original draft preparation, Z.C.; writing—review and editing, Z.C.; visualization, Z.C.; supervision, W.Z. and Q.Y.; project administration, Z.C.; funding acquisition, W.Z. and Q.Y. All authors have read and agreed to the published version of the manuscript.

Funding

This research was funded by [the National Key Research and Development Program of China] grant number [2017YFA0700300] and The APC was funded by [2017YFA0700300].

Acknowledgments

This study was supported by the National Key Research and Development Program of China [grant number 2017YFA0700300], the Fundamental Research Funds for the Central Universities [grant number N2025032], and the Liaoning Provincial Natural Science Foundation [grant number 2020-MS-362].

Conflicts of Interest

The authors declare no conflict of interest.

References

  1. Hu, W.-B.; Liu, Z.; Yang, M. Luminescence characteristics of mercury-free flat fluorescent lamp with arc-shape anodes. IEEE Trans. Consum. Electron. 2010, 56, 2631–2635. [Google Scholar] [CrossRef]
  2. Lister, G.G.; Lawler, J.E.; Lapatovich, W.P.; Godyak, V.A. The physics of discharge lamps. Rev. Mod. Phys. 2004, 76, 541–598. [Google Scholar] [CrossRef]
  3. Chervy, B.; Gleizes, A.; Razafinimanana, M. Thermodynamic properties and transport coefficients in SF6-Cu mixtures at temperatures of 300–30000 K and pressures of 0.1–1 MPa. J. Phys. D Appl. Phys. 1994, 27, 1193–1206. [Google Scholar] [CrossRef]
  4. Paul, K.C.; Sakuta, T.; Takashima, T.; Ishikawa, M. The dynamic behaviour of wall-stabilized arcs contaminated by Cu and PTFE vapours. J. Phys. D Appl. Phys. 1997, 30, 103–112. [Google Scholar] [CrossRef]
  5. Wang, X.; Zhong, L.; Cressault, Y.; Gleizes, A.; Rong, M. Thermophysical properties of SF6-Cu mixtures at temperatures of 300–30,000 K and pressures of 0.01–1.0 MPa: Part 2. Collision integrals and transport coefficients. J. Phys. D Appl. Phys. 2014, 47, 495201. [Google Scholar] [CrossRef]
  6. Zhong, L.; Wang, X.; Rong, M.; Wu, Y.; Murphy, A. Calculation of combined diffusion coefficients in SF6-Cu mixtures. Phys. Plasmas 2014, 21, 103506. [Google Scholar] [CrossRef]
  7. Cressault, Y.; Gleizes, A. Calculation of diffusion coefficients in air–metal thermal plasmas. J. Phys. D Appl. Phys. 2010, 43, 434006. [Google Scholar] [CrossRef]
  8. Murphy, A.B. The effects of metal vapour in arc welding. J. Phys. D Appl. Phys. 2010, 43, 434001. [Google Scholar] [CrossRef]
  9. Murphy, A.B.; Tanaka, M.; Yamamoto, K.; Tashiro, S.; Sato, T.; Lowke, J.J. Modelling of thermal plasmas for arc welding: The role of the shielding gas properties and of metal vapour. J. Phys. D Appl. Phys. 2009, 42, 092006. [Google Scholar] [CrossRef]
  10. Schnick, M.; Fuessel, U.; Hertel, M.; Haessler, M.; Spille-Kohoff, A.; Murphy, A. Modelling of gas–metal arc welding taking into account metal vapour. J. Phys. D Appl. Phys. 2010, 43, 434008. [Google Scholar] [CrossRef] [Green Version]
  11. McBride, B.; Gordon, S. Computer Program for Calculation of Complex Chemical Equilibrium Compositions and Applications. I: Analysis; NASA: Washington, DC, USA, 1996.
  12. Wang, W.Z.; Murphy, A.B.; Yan, J.D.; Rong, M.Z.; Spencer, J.W.; Fang, M.T.C. Thermophysical Properties of High-Temperature Reacting Mixtures of Carbon and Water in the Range 400–30,000 K and 0.1–10 atm. Part 1: Equilibrium Composition and Thermodynamic Properties. Plasma Chem. Plasma Process. 2011, 32, 75–96. [Google Scholar] [CrossRef]
  13. Gleizes, A.; Chervy, B.; Gonzalez, J.J. Calculation of a two-temperature plasma composition: Bases and application to SF6. J. Phys. D Appl. Phys. 1999, 32, 2060–2067. [Google Scholar] [CrossRef]
  14. Colombo, V.; Ghedini, E.; Sanibondi, P. Thermodynamic and transport properties in non-equilibrium argon, oxygen and nitrogen thermal plasmas. Prog. Nucl. Energy 2008, 50, 921–933. [Google Scholar] [CrossRef]
  15. Kanzow, C.; Yamashita, N.; Fukushima, M. Levenberg–Marquardt methods with strong local convergence properties for solving nonlinear equations with convex constraints. J. Comput. Appl. Math. 2004, 172, 375–397. [Google Scholar] [CrossRef] [Green Version]
  16. Smith, W.R.; Missen, R.W. Chemical Reaction Equilibrium Analysis: Theory and Algorithms; Wiley: Hoboken, NJ, USA, 1982. [Google Scholar]
  17. Martínez, J.M. Algorithms for solving nonlinear systems of equations. In Algorithms for Continuous Optimization: The State of the Art; Spedicato, E., Ed.; Springer: Dordrecht, The Netherlands, 1994; pp. 81–108. [Google Scholar]
  18. Dartmann, G.; Zandi, E.; Ascheid, G. A Modified Levenberg–Marquardt Method for the Bidirectional Relay Channel. IEEE Trans. Veh. Technol. 2014, 63, 4096–4101. [Google Scholar] [CrossRef] [Green Version]
  19. Laricchiuta, A.; Colonna, G.; Bruno, D.; Celiberto, R.; Gorse, C.; Pirani, F.; Capitelli, M. Classical transport collision integrals for a Lennard-Jones like phenomenological model potential. Chem. Phys. Lett. 2007, 445, 133–139. [Google Scholar] [CrossRef]
  20. Wang, W.; Rong, M.; Spencer, J.W. Nonuniqueness of two-temperature Guldberg-Waage and Saha equations: Influence on thermophysical properties of SF6 plasmas. Phys. Plasmas 2013, 20, 113504. [Google Scholar] [CrossRef]
  21. Kramida, A.; Ralchenko, Y.; Reader, J.; NIST ASD Team. NIST Atomic Spectra Database (Ver. 5.8); National Institute of Standards and Technology: Gaithersburg, MD, USA, 2021. Available online: https://physics.nist.gov/asd (accessed on 29 December 2021).
  22. Farrenq, R.; Guelachvili, G.; Sauval, A.J.; Grevesse, N.; Farmer, C.B. Improved Dunham coefficients for CO from infrared solar lines of high rotational excitation. J. Mol. Spectrosc. 1991, 149, 375–390. [Google Scholar] [CrossRef]
  23. Ostrowska-Kopeć, M.; Piotrowska, I.; Kepa, R.; Kowalczyk, P.; Zachwieja, M.; Hakalla, R. New observations and analyses of highly excited bands of the fourth-positive (A1Π → X1Σ+) band system in 12C16O. J. Mol. Spectrosc. 2015, 314, 63–72. [Google Scholar] [CrossRef]
  24. Eidelsberg, M.; Roncin, J.-Y.; le Floch, A.; Launay, F.; Letzelter, C.; Rostas, J. Reinvestigation of the vacuum ultraviolet spectrum of CO and isotopic species: The B1Σ+ ↔ X1Σ+ transition. J. Mol. Spectrosc. 1987, 121, 309–336. [Google Scholar] [CrossRef]
  25. Kępa, R.; Kocan, A.; Ostrowska-Kopeć, M.; Piotrowska-Domagała, I.; Zachwieja, M. New spectroscopic studies of the Comet–Tail (A2Πi–X2Σ+) system of the CO+ molecule. J. Mol. Spectrosc. 2004, 228, 66–75. [Google Scholar] [CrossRef]
  26. Bembenek, Z.; Domin, U.; Kępa, R.; Porada, K.; Rytel, M.; Zachwieja, M.; Jakubek, Z.; Janjić, J. New Bands and New Analyses in the Spectrum of the Baldet-Johnson (B2Σ+-A2Πi) System of CO+. J. Mol. Spectrosc. 1994, 165, 205–218. [Google Scholar] [CrossRef]
  27. Shi, D.; Li, W.; Sun, J.; Zhu, Z.; Liu, Y. MRCI study of potential energy curves, spectroscopic and molecular properties of the CO+ cation. Comput. Theor. Chem. 2011, 978, 126–137. [Google Scholar] [CrossRef]
  28. Liu, H.; Shi, D.; Sun, J.; Zhu, Z.; Shulin, Z. Accurate calculations on the 22 electronic states and 54 spin-orbit states of the O2 molecule: Potential energy curves, spectroscopic parameters and spin-orbit coupling. Spectrochim. Acta Part A Mol. Biomol. Spectrosc. 2014, 124, 216–229. [Google Scholar] [CrossRef]
  29. Laher, R.R.; Gilmore, F.R. Improved Fits for the Vibrational and Rotational Constants of Many States of Nitrogen and Oxygen. J. Phys. Chem. Ref. Data 1991, 20, 685. [Google Scholar] [CrossRef] [Green Version]
  30. Kirby, K.; Liu, B. The valence states of C2: A configuration interaction study. J. Chem. Phys. 1979, 70, 893. [Google Scholar] [CrossRef]
  31. Chase, M. NIST-JANAF thermochemical tables. J. Phys. Chem. Ref. Data 1998, 9, 1539. [Google Scholar]
  32. Hirschfeler, J.O.; Curtiss, C.F.; Bird, B. Molecular Theory of Gases and Liquids; Wiley: Hoboken, NJ, USA, 1954. [Google Scholar]
  33. Mason, E.A.; Munn, R.J.; Smith, F.J. Transport Coefficients of Ionized Gases. Phys. Fluids 1967, 10, 1827. [Google Scholar] [CrossRef]
  34. Devoto, R.S. Simplified Expressions for the Transport Properties of Ionized Monatomic Gases. Phys. Fluids 1967, 10, 2105. [Google Scholar] [CrossRef]
  35. Aubreton, J.; Elchinger, M.F.; Fauchais, P. New Method to Calculate Thermodynamic and Transport Properties of a Multi-Temperature Plasma: Application to N2 Plasma. Plasma Chem. Plasma Process. 1998, 18, 1–27. [Google Scholar] [CrossRef]
  36. Capitelli, M.; Colonna, G.; Gorse, C.; D’Angola, A. Transport properties of high temperature air in local thermodynamic equilibrium. Eur. Phys. J. D At. Mol. Opt. Plasma 2000, 11, 279–289. [Google Scholar] [CrossRef]
  37. Brokaw, R.S. Thermal Conductivity of Gas Mixtures in Chemical Equilibrium. II. J. Chem. Phys. 1960, 32, 1005–1006. [Google Scholar] [CrossRef]
  38. Trelles, J.P.; Heberlein, J.V.R.; Pfender, E. Non-equilibrium modelling of arc plasma torches. J. Phys. D Appl. Phys. 2007, 40, 5937–5952. [Google Scholar] [CrossRef] [Green Version]
  39. Devoto, R.S. Transport Properties of Ionized Monatomic Gases. Phys. Fluids 1966, 9, 1230. [Google Scholar] [CrossRef]
  40. Cubley, S.J.; Mason, E.A. Atom-molecule and molecule-molecule potentials and transport collision integrals for high-temperature air species. Phys. Fluids 1975, 18, 1109. [Google Scholar] [CrossRef]
  41. Ryabov, V.V. Transfer coefficient of multicomponent air with sublimation products of graphite. J. Eng. Phys. 1988, 55, 786–791. [Google Scholar] [CrossRef]
  42. Capitelli, M.; Cappelletti, D.; Colonna, G.; Gorse, C.; Laricchiuta, A.; Liuti, G.; Longo, S.; Pirani, F. On the possibility of using model potentials for collision integral calculations of interest for planetary atmospheres. Chem. Phys. 2007, 338, 62–68. [Google Scholar] [CrossRef]
  43. Haynes, W.M. CRC Handbook of Chemistry and Physics, 95th ed.; CRC Press: Boca Raton, FL, USA, 2016. [Google Scholar]
  44. Pirani, F.; Cappelletti, D.; Liuti, G. Range, strength and anisotropy of intermolecular forces in atom–molecule systems: An atom–bond pairwise additivity approach. Chem. Phys. Lett. 2001, 350, 286–296. [Google Scholar] [CrossRef]
  45. Wang, W.; Rong, M.; Murphy, A.B.; Wu, Y.; Spencer, J.W.; Yan, J.D.; Fang, M.T.C. Thermophysical properties of carbon–argon and carbon–helium plasmas. J. Phys. D Appl. Phys. 2011, 44, 355207. [Google Scholar] [CrossRef]
  46. Rutherford, J.A. The reaction of atomic oxygen with several atmospheric ions. J. Chem. Phys. 1974, 61, 2514. [Google Scholar] [CrossRef]
  47. Capitelli, M.; Gorse, C.; Longo, S.; Giordano, D. Collision Integrals of High-Temperature Air Species. J. Thermophys. Heat Transf. 2000, 14, 259–268. [Google Scholar] [CrossRef]
  48. André, P.; Aubreton, J.; Clain, S.; Dudeck, M.; Duffour, E.; Elchinger, M.F.; Izrar, B.; Rochette, D.; Touzani, R.; Vacher, D. Transport coefficients in thermal plasma. Applications to Mars and Titan atmospheres. Eur. Phys. J. D 2010, 57, 227–234. [Google Scholar] [CrossRef]
  49. Bruno, D.; Catalfamo, C.; Capitelli, M.; Colonna, G.; de Pascale, O.; Diomede, P.; Gorse, C.; Laricchiuta, A.; Longo, S.; Giordano, D.; et al. Transport properties of high-temperature Jupiter atmosphere components. Phys. Plasmas 2010, 17, 112315. [Google Scholar] [CrossRef]
  50. Itikawa, Y. Cross Sections for Electron Collisions with Carbon Dioxide. J. Phys. Chem. Ref. Data 2002, 31, 749–767. [Google Scholar] [CrossRef]
  51. Itikawa, Y. Cross Sections for Electron Collisions with Oxygen Molecules. J. Phys. Chem. Ref. Data 2009, 38, 1–20. [Google Scholar] [CrossRef]
  52. Itikawa, Y. Cross Sections for Electron Collisions with Carbon Monoxide. J. Phys. Chem. Ref. Data 2015, 44, 013105. [Google Scholar] [CrossRef] [Green Version]
  53. Michelin, S.; Oliveira, H.; Soares, L.; Veiteinheimer, E.; Luz, C.; Mazon, K.; Fujimoto, M.; Lee, M.-T. Cross sections for electron–C2 collisions. Chem. Phys. 2005, 309, 177–182. [Google Scholar] [CrossRef]
  54. Neynaber, R.H.; Marino, L.L.; Rothe, E.W.; Trujillo, S.M. Low-Energy Electron Scattering from Atomic Nitrogen. Phys. Rev. 1963, 129, 2069–2071. [Google Scholar] [CrossRef]
  55. Itikawa, Y.; Ichimura, A. Cross Sections for Collisions of Electrons and Photons with Atomic Oxygen. J. Phys. Chem. Ref. Data 1990, 19, 637–651. [Google Scholar] [CrossRef] [Green Version]
  56. Laher, R.R.; Gilmore, F.R. Updated Excitation and Ionization Cross Sections for Electron Impact on Atomic Oxygen. J. Phys. Chem. Ref. Data 1990, 19, 277–305. [Google Scholar] [CrossRef] [Green Version]
  57. McEachran, R.P.; Blanco, F.; García, G.; Stokes, P.W.; White, R.D.; Brunger, M.J. Integral Cross Sections for Electron–Magnesium Scattering Over a Broad Energy Range (0–5000 eV). J. Phys. Chem. Ref. Data 2018, 47, 043104. [Google Scholar] [CrossRef]
  58. Yang, A.; Liu, Y.; Sun, B.; Wang, X.; Cressault, Y.; Zhong, L.; Rong, M.; Wu, Y.; Niu, C. Thermodynamic properties and transport coefficients of high-temperature CO2 thermal plasmas mixed with C2F4. J. Phys. D Appl. Phys. 2015, 48, 495202. [Google Scholar] [CrossRef]
  59. Cressault, Y.; Connord, V.; Hingana, H.; Teulet, P.; Gleizes, A. Transport properties of CF3I thermal plasmas mixed with CO2, air or N2 as an alternative to SF6plasmas in high-voltage circuit breakers. J. Phys. D Appl. Phys. 2011, 44, 495502. [Google Scholar] [CrossRef]
  60. Colombo, V.; Ghedini, E.; Sanibondi, P. Two-temperature thermodynamic and transport properties of carbon–oxygen plasmas. Plasma Sources Sci. Technol. 2011, 20, 035003. [Google Scholar] [CrossRef]
  61. Asinovsky, E.; Kirillin, A.; Pakhomov, E.; Shabashov, V. Experimental investigation of transport properties of low-temperature plasma by means of electric arc. Proc. IEEE 1971, 59, 592–601. [Google Scholar] [CrossRef]
  62. Magin, T.; Degrez, G.; Sokolova, I. Thermodynamic and transport properties of Martian atmosphere for space entry application. In Proceedings of the 33rd Plasmadynamics and Lasers Conference, Maui, Hawaii, 20–23 May 2002; American Institute of Aeronautics and Astronautics: Reston, VA, USA, 2002. [Google Scholar]
Figure 1. Calculation flow chart of PVM-LMA for solving the plasma compositions.
Energies 15 01036 g001
Figure 2. Variations in the control parameter, the precision, and the number density of each particle with the iteration for the Mg50%-CO50% mixture plasma.
Energies 15 01036 g002
Figure 3. Reduced phenomenological potential for neutral-neutral interaction (m = 6).
Energies 15 01036 g003
Figure 4. The curve of collision integrals as a function of temperature. (a) Mg-C; (b) Mg-Mg; (c) Mg-O.
Energies 15 01036 g004
Figure 5. Equilibrium compositions of pure CO2 mixture plasma at temperatures of 300–3000 K and a pressure of 0.1 MPa.
Energies 15 01036 g005
Figure 6. Equilibrium compositions of Mg-CO mixture plasma at temperatures of 300–3000K and a pressure of 0.1 MPa. (a) CO100% (b) Mg1%-CO99% (c) Mg5%-CO95% (d) Mg10%-CO90% (e) Mg20%-CO80% (f) Mg30%-CO70% (g) Mg40%-CO60% (h) Mg50%-CO50%.
Energies 15 01036 g006
Figure 7. The density and enthalpy of pure CO2 at 0.1MPa. The result is shown for comparison.
Energies 15 01036 g007
Figure 8. The curves of density for different proportion Mg-CO mixtures plasma at a temperature of 300–30,000 K and 0.1 Mpa.
Energies 15 01036 g008
Figure 9. The curves of enthalpies for different proportion Mg-CO mixtures plasma at a temperature of 300–30,000 K and 0.1 Mpa.
Energies 15 01036 g009
Figure 10. The thermal conductivity of pure CO2 at 0.1 MPa. The calculated results are shown for comparison.
Energies 15 01036 g010
Figure 11. The curves of thermal conductivities for different proportion Mg-CO mixtures plasma at a temperature of 300–30,000 K and 0.1 Mp.
Energies 15 01036 g011
Figure 12. The electrical conductivity of pure CO2 at 0.1 MPa. The calculated results are shown for comparison.
Energies 15 01036 g012
Figure 13. The curves of electrical conductivity for different proportion of Mg-CO mixtures plasma at a temperature of 300–30,000 K and 0.1 Mpa.
Energies 15 01036 g013
Figure 14. The viscosity of pure CO2 at 0.1 MPa. The calculated results are shown for comparison.
Energies 15 01036 g014
Figure 15. The curves of viscosity for different proportion Mg-CO mixtures plasma at a temperature of 300–30,000 K and 0.1 Mpa.
Energies 15 01036 g015
Table 1. The list of molecules in magnesium oxide crystal arc plasma.
Neutral particlesCO2, CO, O2, C2, O, C, Mg, MgO
IonsO2+, CO+, O+, O++, O+++, C+, C++, C+++, Mg+, Mg++
Electrone
Table 2. The chemical reactions list of in magnesium oxide crystal arc plasma.
Serial NumberReactionSerial NumberReaction
1CO2 ⇌ CO + O9C+ ⇌ C++ + e
2CO ⇌ C + O10C++ ⇌ C+++ + e
3MgO ⇌ Mg + O11O ⇌ O+ + e
4C2 ⇌ C + C12O+ ⇌ O++ + e
5O2 ⇌ O + O13O++ ⇌ O+++ + e
6CO ⇌ CO+ + e14Mg ⇌ Mg+ + e
7O2 ⇌ O2+ + e15Mg+ ⇌ Mg++ + e
8C ⇌ C+ + e
Table 3. The spectroscopic constants for different energy levels of diatomic molecules.
MoleculeElectronic StateTe/cm−1ωe/cm−1ωexe/cm−1ωeye/cm−1Be/cm−1αe/cm−1reVmax
COX1Σ+ [22]02159.313.60.02161.93130.01751.13250
A1Π [23]65,358.71514.2419.40.76581.61150.023251.24122
B1Σ+ [24]86,926.92161.7539.8401.9610.02621.121
CO+X2Σ+ [25]02214.12715.094−0.01171.976940.018941.115920
A2Πi [25]20,732.0371561.80613.47850.008651.589390.0194941.244325
B2Σ+ [26]45,841.251734.827.11660.3261.799540.03121.169410
C2Δ [27]62,953.71142.8933.8770.6111.347960.04071.354710
O2X3Σg [28]01581.6110.0390.050181.43760.0125391.206819
B3Σu [28]51,025.73723.610.7560.747420.82560.0135961.597815
O2+X2Πg [29]01906.0716.50.02111.68960.01931.11720
a4Πg [29]40,068.189913.7260.011.06170.01941.40820
A2Πg [29]32,524.31035.1310.115−0.03311.104760.01551.38220
b4Σg [29]491911197.217.1720.01181.287660.02191.2820
C2X1Σg+ [30]01855.0113.555−0.1321.820.0181.242521
a3Πu [30]8391.31608.212.055−0.0121.61650.01691.318435
b3Σg [30]43,239.81829.5713.9401.83320.01961.23822
A1Πu [30]716.21641.3511.6701.63420.016631.311933
C1Πg [30]6434.81470.411.1550.01391.49860.01631.318423
d3Πg [30]9124.22085.918.62301.9210.01261.2317
e3Πg [30]20,022.51788.2216.457−0.5011.7550.0191.266113
D1Σg+ [30]40,796.71106.5639.262.811.19220.02421.535112
MgOX1Σ+ [31]0785.15.1800.57430.0051.74910
A1Π [31]3503.3664.43.900.50500.0041.86410
B1Σ+ [31]20,004824.14.7600.58220.00451.73710
D3Δ [31]29,775632.55.300.50140.00481.87210
Table 4. Method and references for computation of collision integrals between electron and neutral particles.
MoleculesMethodReferences
e-CO2Tabulated collision integrals[50]
e-O2Tabulated collision integrals[51]
e-COTabulated collision integrals[52]
e-C2Tabulated collision integrals[53]
e-CTabulated collision integrals[54]
e-OTabulated collision integrals[55,56]
e-MgTabulated collision integrals[57]
Publisher’s Note: MDPI stays neutral with regard to jurisdictional claims in published maps and institutional affiliations.

