Article

CO2 Capture and Crystallization of ATH Using Sodium Aluminate Solution in a Bubble Column Scrubber

Department of Chemical and Materials Engineering, Lunghwa University of Science and Technology, Taoyuan 33306, Taiwan
*
Author to whom correspondence should be addressed.
Energies 2022, 15(3), 1031; https://doi.org/10.3390/en15031031
Submission received: 10 November 2021 / Revised: 21 January 2022 / Accepted: 28 January 2022 / Published: 29 January 2022

Abstract

:
In this work, sodium aluminate alkaline solution was used to capture CO2 in a continuous bubble column scrubber and aluminum tri-hydrate (ATH) precipitates were produced. As the sodium carbonate could be recycled after the filtrated solution was crystallized by evaporation, a novel CO2 capture process was developed successfully. There were five experimental operation variables, including solution flow rate (A), concentration of the solution (B), gas flow rate (C), CO2 gas concentration (D), and liquid temperature (E), with four levels to each variable. The influence of each variable on absorption efficiency (EF), absorption rate (RA), absorption factor (φ), mass transfer coefficient (KGa), and precipitation rate (RP) in a steady state was explored in this study. The Taguchi experimental design was adopted, and 16 experiments were performed; as the optimum operating conditions found in Taguchi analysis required further verification, there were a total of 21 experiments in the end. According to S/N analysis, the overall order of importance was D > A = B > C > E, meaning D (CO2 concentration) was most important and E (liquid temperature) was least important. In addition, the result also showed that the Rp was 1.25–2.0 times higher than the RA. The obtained powder was mainly ATH according to XRD analysis, with the crystal size ranging between 8.14 and 27.97 nm. However, the BET analysis showed its particle size range being 17.6–283.7 nm, indicating agglomeration for primary particles. The SEM analysis showed that there were flower-like, irregular, urchin-like, elongated, and amorphous particles. The solutions from five groups of optimum conditions were used to recycle the sodium carbonate experiments. After evaporation and crystallization of the filtrated solutions, the energy loading was found to be 1.70–2.56 GJ/t-solvent, illustrating the superiorities of low energy consumption. The precipitated powders were verified to be sodium carbonate by FTIR, which is a valuable constituent.

Graphical Abstract

1. Introduction

As the greenhouse effect results in climate anomalies, humans are bearing the adverse consequences. Therefore, the global warming goal requires reducing greenhouse gases (GHG) emissions by 40–70% by 2050 relative to 2010 levels and achieving neutral to negative emissions by the end of the century [1]. Among the GHG, CO2 makes up the majority, reaching over 80%. Among various emission sources, the thermal power plants, steel plants, petrochemical industry, and cement industry emit the most and concentrated CO2, with the total amount higher than 50%. Therefore, considerable manpower and expenses have been devoted to study the capture, storage, and reutilization of CO2 around the world. The CO2 capture techniques have been developed rapidly, and the developed techniques are diversified, including the absorption process, adsorptive process, freezing method, chemical cycle method, and calcium cycle method [2,3,4]. Part of the studies developed toward using recovered CO2 to culture microalgae [5], prepare urea [6] and carbonic allyl ester, and the methanol economy [7]. The CO2 emitted from fossil fuels is 5–20% according to the literature, so the absorption process is the main choice for capturing CO2 [2]. This is a mature technique, which employs a two-tower plant, including a scrubber and a stripper. Therefore, carbon capture and storage (CCS) and carbon capture and utilization (CCU) have become important techniques of greenhouse gas reduction in the world. The international power companies have been developing CCS for 10 or 20 years, yet there are still some difficulties. For example, according to the CCS development path diagram planned by the IEA (International Energy Agency) in 2009, it was optimistically expected that the capacities of thermal power generation would be 22 GW and 1140 GW in 2020 and 2050, respectively, with 131 and 5510 Mt CO2/a being captured, respectively. However, there have been merely two sets of CCS in commercial operation until now, and the CO2 capture is 2.4 Mt/a, much lower than the expected value. Besides technical difficulties, low economic benefit and deficient social and policy supports are the contributing reasons as well. Therefore, the enhancement of efficiency of absorbents, improvement of absorbers, and enhancement of heat regeneration efficiency [8,9,10] have become the research directions, and how to effectively reduce the electric power cost has become key to the success or failure of CCS.
As a result, taking CO2 as a raw material for capture and reutilization has become an important strategy, which is CCU. For example, CO2 can be used as a raw material to synthesize methanol, and it can also be used as a raw material and captured by seawater to become a carbon source for cultivating seaweeds [5,7]. All these are a part of CCU. However, the methanol synthesis technique remains to be broken through. As CO2 is an acidic gas, it can be captured by alkaline solutions. As CO2 is dissociated into HCO3 and CO32− when it is absorbed in alkaline solutions, CO2 can be captured by Ca(OH)2 suspension, and the CaCO3(s) solid is subsequently generated. Nonetheless, this technique has difficulties in continuous operation. Moreover, important methods have been proposed for a dynamic and multi-scale decision-making for the integration of CCU applications with the EWF (Energy, Water and Food) nexus [1]. However, the use of solvent regeneration is a significant contributor to the emissions of CO2 and related to the global warming potential (GWP), so the development of environmentally sustainable sorbents is one of the challenges for both CCS and CCU [11]. Although, on average, the GWP of CCS is significantly lower than those of the CCU options, on the other hand, from an economic viewpoint, CCU appears to be a better option than CCS. However, the cost-effectiveness and the environmental impacts of CCU have to be evaluated carefully on a life cycle basis to ensure a positive economic and environmental balance. Recently, three routes, i.e., CCS, CCU, and BIO, have been acknowledged to be the only possible approaches that enable a carbon-neutral chemical industry in net-zero-CO2 emissions [12].
However, if the NaAlO2 solution is used as the absorption liquid, as the aqueous NaAlO2 solution is alkaline, it could capture CO2 and generate ATH and the Na2CO3 solution, and continuous operation would be workable. The ATH mainly acts as an environmentally friendly flame retardant and other applications, and it can also be used as a water conditioning agent, toothpaste, and an antiacid reagent. The Na2CO3 is an important bulk chemical, applicable to metallurgical, textile, dyeing, glass, and paper industries, with the specific uses being shown in Figure 1. Therefore, developing a new process to capture CO2 and generate ATH and Na2CO3 is a challenging work that is worth exploring.
Using NaAlO2 solution to capture CO2 and prepare ATH and recover Na2CO3 is a new conception. On the one hand, CO2 can be captured, and the energy consumption can be reduced during solvent regeneration; on the other hand, ATH can be prepared, and Na2CO3·nH2O can be recovered (wherein n can be 0, 1, 7, or 10) (https://en.wikipedia.org/wiki/Sodium_carbonate, 2012), performing two things at the same time. Therefore, the importance of how to obtain the optimum conditions and parameters for absorbing CO2 to prepare ATH and regenerate solvent has become a new challenge.
To carry out this process, the mechanism of CO2 absorption of the aqueous solution is described below:
C O 2 ( g ) C O 2 ( a q )
C O 2 ( a q )+ O H ( a q ) H C O 3 ( a q )
H C O 3 ( a q )+ O H ( a q ) C O 3 2 ( a q )+ H 2 O ( a q )
If the dissociated component concentration divided by total carbonate concentration (CT = [H2CO3*] + [HCO3] + [CO32−]) is defined as αi, the pH is drawn with logαi, as shown in the previous work (Figure 1) [13]. When the pH is 7–10, as α1 in the figure, the main component of the solution is bicarbonate radicals. When the pH is larger than 12, as α2 in the figure, the main component of the solution is carbonate. When the pH is smaller than 6, the main component of the solution is carbonic acid (H2CO3*), so the pH has an important effect on the carbonate distribution.
The CO2 dissociation and absorption reactions after NaAlO2 is dissolved in water are expressed below:
N a 2 O · A l 2 O 3 ( a q )+4 H 2 O ( a q )2 N a + ( a q )+2 A l ( O H ) 3 ( s )+2 O H ( a q )
2 N a + ( a q )+ C O 3 2 ( a q ) N a 2 C O 3 ( a q )
The net reaction is expressed below:
N a 2 O · A l 2 O 3 ( a q )+4 H 2 O ( a q )2 N a + ( a q )+2 A l ( O H ) 3 ( s )+2 O H ( a q )
The following reaction takes place if there is excessive CO2 [10]:
N a A l O 2  (aq) + C O 2  (g) + H 2 O  (aq)  N a H C O 3  (aq) + A l ( O H ) 3  (s) 
Thus, it can be seen that the reaction mechanism is mainly determined by CO2 in a phase transition from the gas phase to the liquid phase in the first step, and this is the procedure controlling the overall reaction. As CO2 is acidic when being dissolved in water, it can neutralize the strong base NaOH generated by the hydrolytic reaction of NaAlO2 (Equation (4)), while forming the sodium carbonate solution and synthesizing the ATH particles. As the solubility products of ATH and Na2CO3(s) are 3.16 × 10⁻³⁴ and 81.4 (17 °C), respectively, meaning ATH is hard to dissolve in water, Na2CO3(s) is freely soluble in water. This indicates that only ATH is yielded after the absorption reaction, and no Na2CO3(s) solid is generated. According to Equations (6) and (7), a high concentration of CO2(g) is favorable for the generation of ATH. According to Equation (1), capturing more CO2(g) will increase CO2(aq), so a high pH liquid condition is favorable for CO2 absorption and favorable for the formation of CO32−, as shown in Equation (3). According to Equation (4), a high pH value represents a high [OH-] concentration, adverse to the generation of ATH. However, Equations (6) and (7) show that the absorption rate increases in the course of absorbing more CO2; subsequently, the ATH precipitation rate increases as well. It can be inferred that there exists a relation between the two.
The prior industrial ATH preparation methods include the Bayer method, soda-lime sintering process, and Bayer and sintering combined process. In the laboratory, it is generally prepared by the reaction of NaOH solution and aluminum sulfate solution. However, over the past ten years, some scholars studied the preparation of ATH in succession, and some of them used the high-gravity rotating packed-bed and admitted CO2 gas into NaAlO2 solution to prepare ATH of nanoparticle size [14,15,16,17,18,19]. In addition, Li et al. [20] employed the NaHCO3 and NaAlO2 neutralization process to prepare ATH. Wang et al. [18] adopted a hypergravity system to study ATH crystallization and found that the temperature, pH, gas concentration, gas–liquid flow ratio, and the concentration of NaAlO2 could influence the generation of ATH, including yield, particle size, and crystallographic form. The result showed that ATH of smaller particle size could be obtained when the operating temperature was 30–40 °C. In the discussion about the effect of NaAlO2 concentration, the pH was 12–12.5 when the concentration was 1–2.5 M and the operating time was 8–16 min; however, the pH dropped from 13.6 to 12.8 when the concentration was 3 M, and returned to 13.5 in 14 min. Additionally, the minimum particle size was obtained when the concentration was 2.0–2.5 M, and the yield was higher. The gas–liquid flow ratio G/L also influences the particle size and pH; a smaller particle size can be obtained when this ratio is 0.8–1.0. The ATH-generating mechanism analysis proposed that the first 8 min (pH drops from 13.5 to 12.4) is the induction stage, 8–9.5 min (pH about 12.4) is the nucleation stage, and 9.5–15 min (pH drops from 12.4 to 12.2) is the growth stage. The ATH crystallization mechanism was proposed by other scholars [21]; these studies mostly put emphasis on the preparation of ATH material.
In addition to absorption and reutilization by many scholars in the past, this laboratory also obtained some research findings in recent years for the absorption and reutilization of CO2, including bubble columns, packed beds, and Higee processes, as shown in previous studies [14,22,23,24]. The absorption factor concept is established herein, different absorbents were employed to build the theoretical model of mass transfer and absorption rate, and the precipitate recovery and solvent reutilization were studied. The Taguchi experimental design, scale-up, and experimental plant site operation experiences were imported in experiments, and these results were helpful to subsequent studies of this team. Therefore, using NaAlO2 solution for simultaneous CO2 absorption and ATH crystallization is a new thinking direction. In terms of NaAlO2-CO2-Al(OH)3 system operation, to allow a continuous feed and solid precipitate simultaneously, bubble columns, which are different from the high-gravity rotating packed-bed, can be an alternative option. In the operation of bubble columns, the gas usually flows up from the bottom with the liquid flowing down, and the gas and liquid contact each other in the column for mixing, absorption, reaction, and precipitation. Bubble columns are characterized by a simple structure, high mass transfer coefficient, high removal efficiency, and controlling the mean residence time of liquid with high absorption factors [25]. The high-gravity rotating packed-bed has a short gas–liquid contact time and low absorption factor. As the NaAlO2 solution requires a sufficient contact time for absorbing CO2 to increase the yield, the contact time can be better controlled by using bubble columns. Additionally, no document has discussed this technique for CO2 capture up to now, meaning that this study can provide another option for the CO2 capture and reutilization procedure. As the input flow rate of NaAlO2, concentration of NaAlO2, reaction temperature, CO2 concentration, and gas flow rate are key factors in CO2 capture, they influence the generation of ATH solid and the generation of Na2CO3, and they are important variables. If bubble columns are used as an absorber, at a certain gas input flow rate and concentration, the NaAlO2 solution is imported at a set flow rate and concentration to make contact with the gas from the bottom. The equations of CO2 absorption in the scrubber are illustrated by Equations (1)–(6). The mixing, absorption, reaction, and precipitation continue in the column. While the suspension is exported with overflow and filtered by solid–liquid separation, the obtained solid is ATH, which can be dried to obtain ATH product. Moreover, as the obtained filtrate contains Na+ and CO32+, the Na2CO3(s) can be recovered by the crystallization technique [26,27].
In addition, a comparison of economics cost between the MEA absorption and stripping process and NaAlO2 solution absorption process is required. Considering a 600 GW coal-fired power plant, the total emission of CO2 per year was about 3 × 10⁷ t/a. The capture cost, including absorption, stripping, and compression, was USD 60/t [28]. Therefore, the total cost for the MEA process was USD 1.8 billion per year. The cost increased to USD 2.34 billion per year when considering the storage cost. On the other hand, the capture cost for the NaAlO2 solution absorption process was less than that of the MEA process, because the materials price for MEA is USD 1350–1600/t as compared with USD 600–900/t NaAlO2. However, two points need to be considered for the NaAlO2 process: first, there is no storage cost required for the NaAlO2 process; second, the process can produce valuable products, Al(OH)3 (600–900 USD/t) and Na2CO3 (200 USD/t), which can be sold, reducing the capture cost. However, it needs to be evaluated in detail further. Due to this, the NaAlO2 process is the better option.
This study aimed to develop a novel CO2 capture and reutilization technique. Bubble columns were operated continuously to explore the phenomena of NaAlO2 solution absorbing CO2 and generating ATH precipitate in bubble columns. The concerned operating variables included the effects of input flow rate of NaAlO2, concentration of NaAlO2, reaction temperature, CO2 concentration and gas flow rate on the absorption efficiency, absorption rate, absorption factor, overall mass transfer coefficient, and precipitation rate. The upper and lower limits of the gas–liquid flow ratio were obtained, and the influential factors in the ratio of absorption rate to precipitation rate were explored. Finally, the feasibility of preparing Na2CO3(s) in the recovered solvent and solvent reutilization was discussed. The obtained data were regressed to obtain related empirical equations as the reference for a scale-up.

2. Research Method

The research framework of this project is shown in Figure 2. It shows the structure diagram of the Taguchi experimental design for the absorption and precipitation of ATH and the evaporation crystallization study for sodium carbonate. Three parts have been explored in the CO2 capture and reuse studies; the first is the Taguchi experiment, the second is the verification of optimum conditions, and the third is the evaporation crystallization tests. The operating variables include the solution flow rate (A), concentration of the solution (B), gas flow rate (C), CO2 gas concentration (D), and liquid temperature (E), and each has four levels. Theoretically, there should be 45 = 1024 experiments. Therefore, a Taguchi experimental design was adopted, and the number of experiments was reduced to L16 (45) = 16 (https://www.minitab.com/en-us/, 2015); thus, we could save the working time and experimental cost [24,29]. After the Taguchi experiments, the absorption efficiency (EF), absorption rate (RA), absorption factor (φ), overall mass transfer coefficient (KGa), and precipitation rate (RP) were calculated, and then, the Taguchi analysis was performed. The optimum operating conditions were determined by the S/N (signal/noise) ratio, the parameter importance was analyzed, and the validation was performed. Consequently, there were an additional five experiments, so this research had a total of 21 experiments. Moreover, the feasibility of recycling Na2CO3(s) in the evaporation crystallization of filtrated solution was explored, and the optimum five groups were taken for testing.

3. Experimental Features

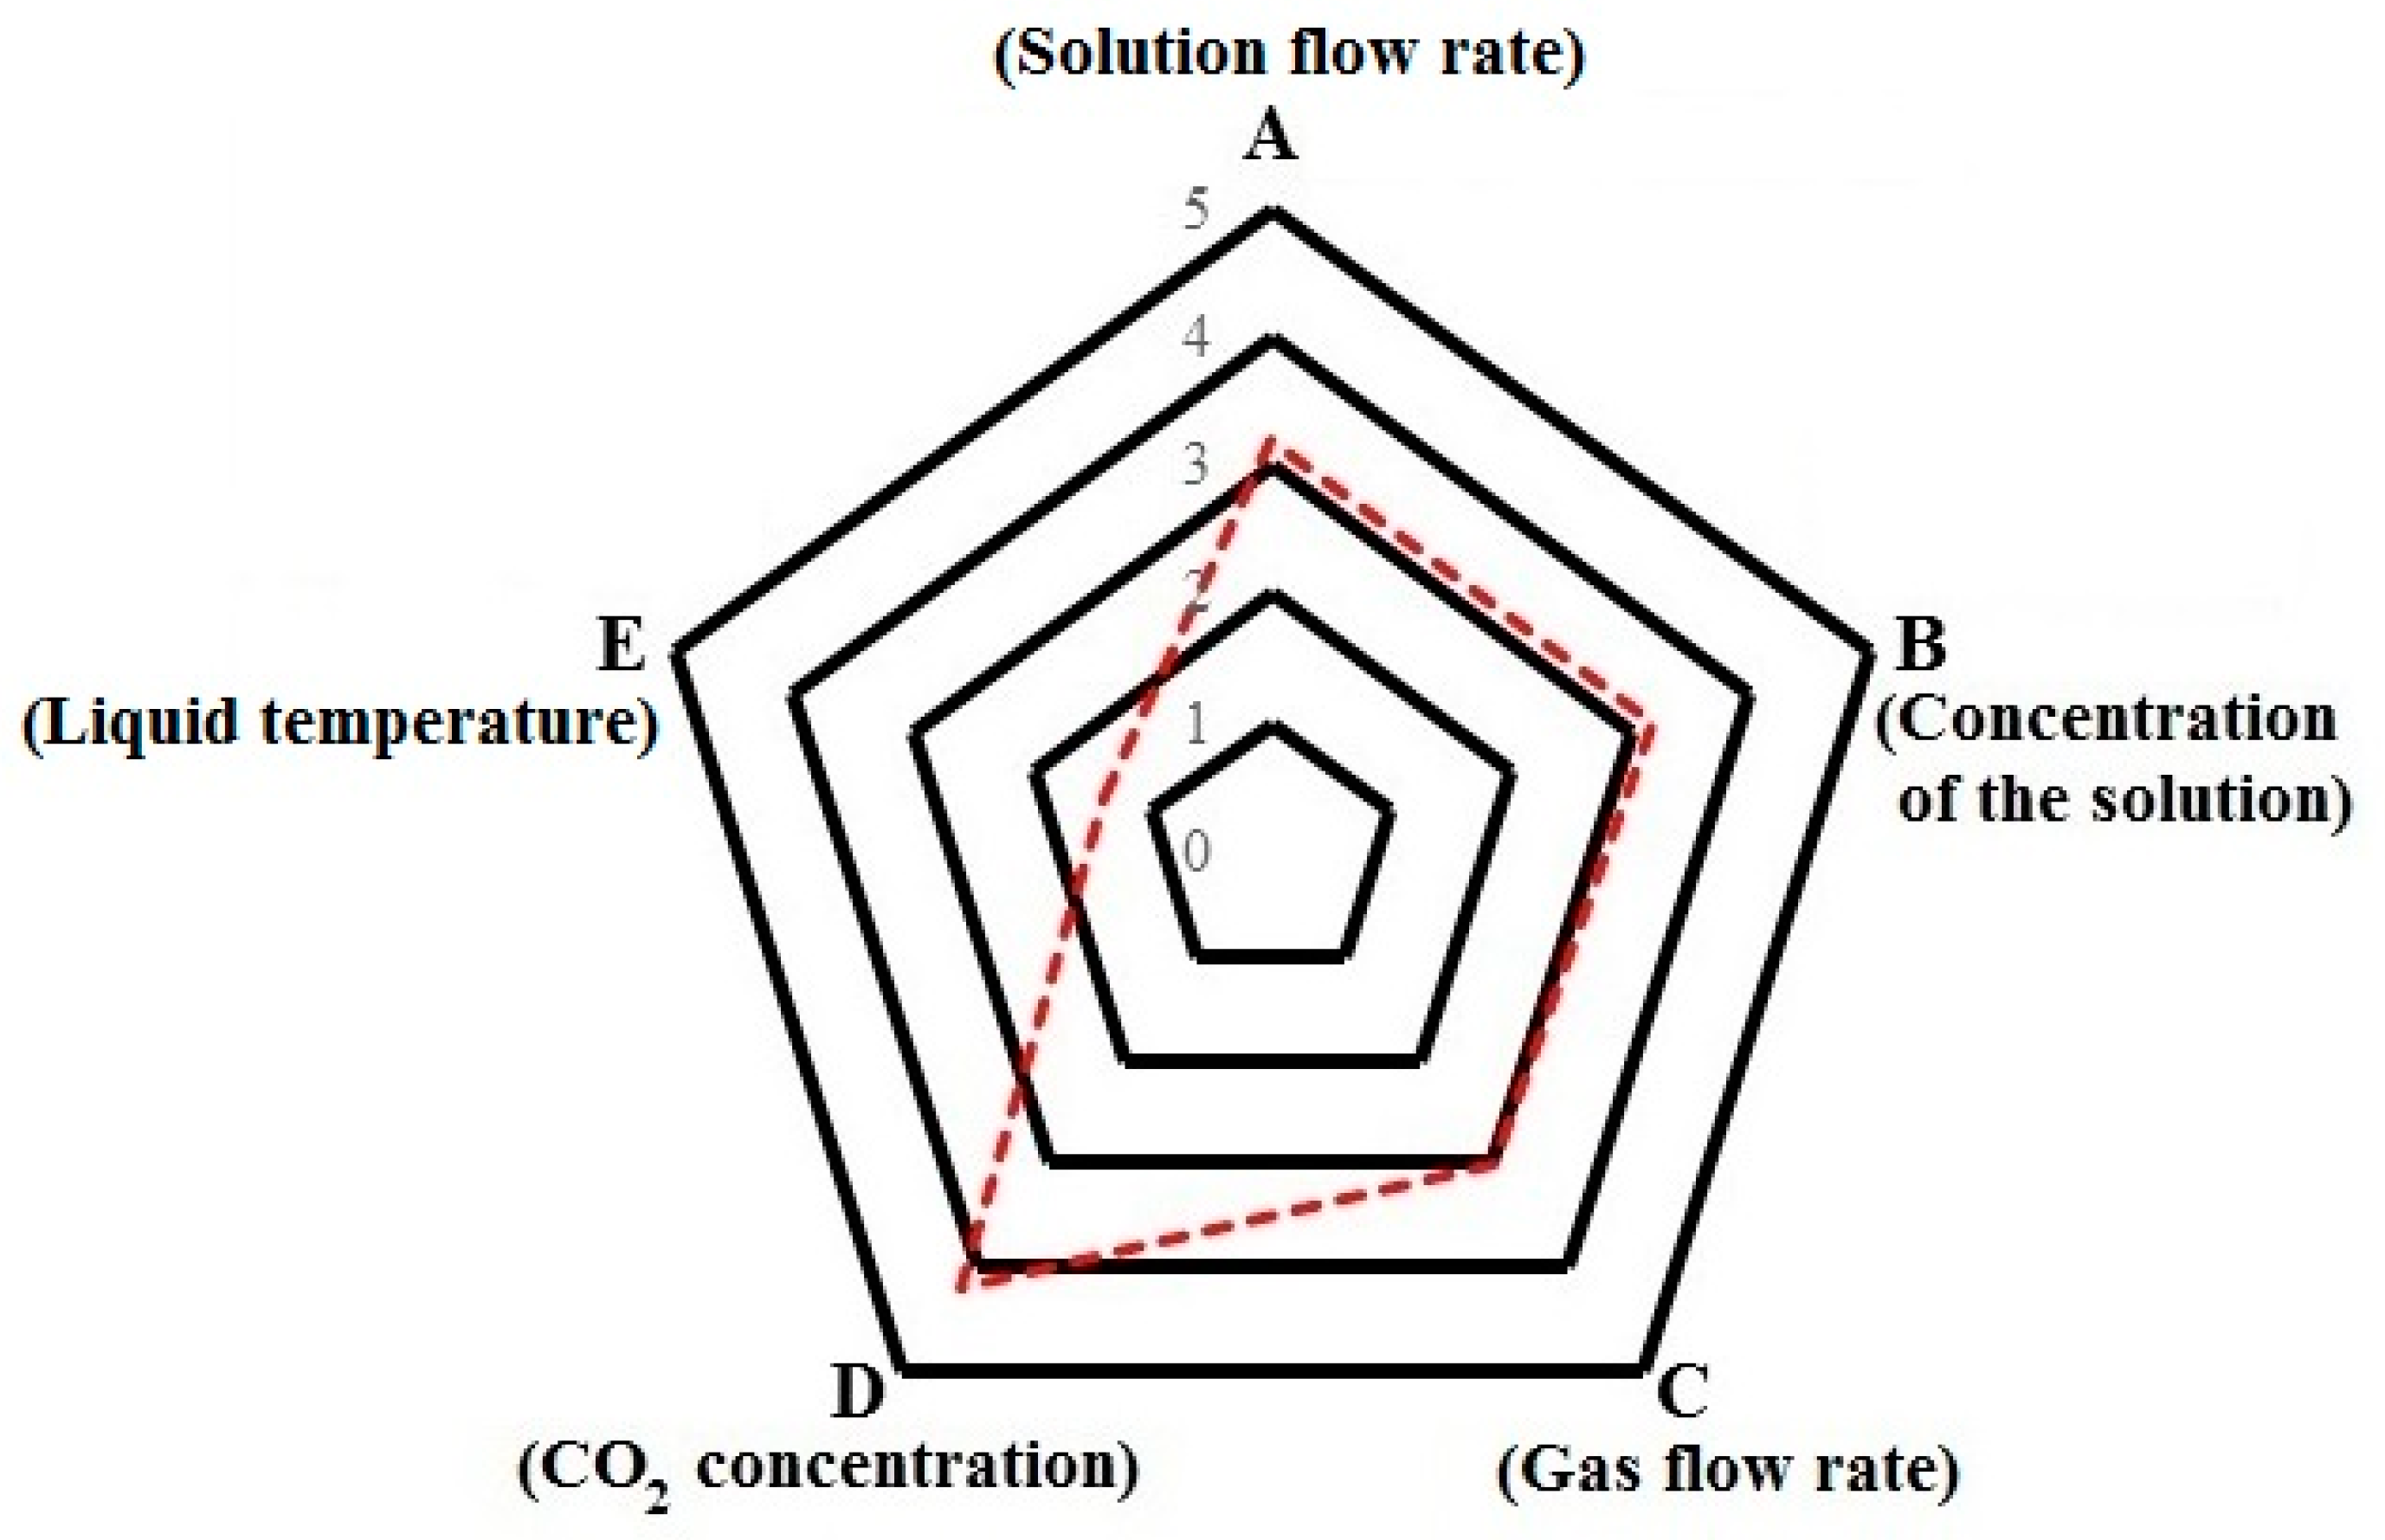
3.1. Design of Experiments

Table 1 shows the factors and levels of design of experiments; there are five factors with four levels for each factor. Table 2 is the orthogonal array. The factors in Table 1 include liquid flow rate (A), concentration of solution (B), gas flow rate (C), CO2-gas concentration (D), and liquid temperature (E). For this study, the range of liquid flow rate (A) was 0.1–0.4 L/min; the range of fluid strength (B) was 1.0–2.5 M; the range of gas flow rate (C) was 3–12 L/min; the gas concentration (D) was 5–20%; and the range of liquid temperature (E) was 25–40 °C. The main reference is the concentration of boiler and flue gas emission; B is the concentration of NaAlO2, determined by the operating range in the literature, which is 1–3 M [14]; C is the inlet gas flow rate; and D is the flow rate of NaAlO2 solution. Both C and D were determined according to prior experience of this laboratory and some document information [29].

3.2. Procedure

There are two parts: (1) absorption and ATH precipitation experiment and (2) solvent recovery and Na2CO3 crystallization experiment.

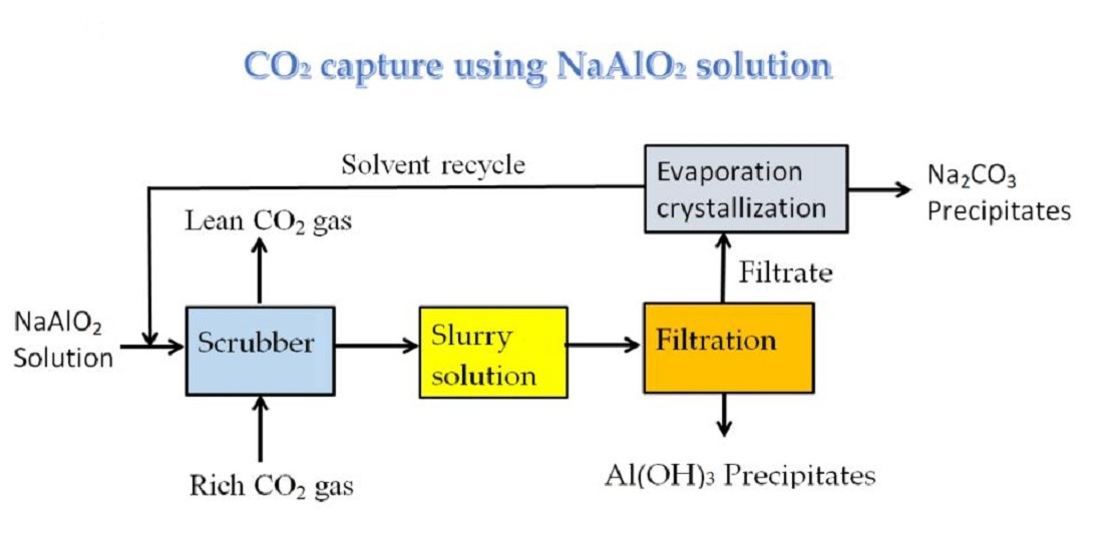
3.2.1. Absorption and ATH Precipitation Experiment

The research facilities for the absorption of the bubble column absorber are shown in Figure 3. CO2 was absorbed by a continuous bubble column absorber in this experiment. First, the thermometer and pH meter were fixed to the scrubber, and the simulated CO2 (A) and N2 (B) mixed gas was modified by the mass flow controller to the required concentration and admitted into bubble columns, and then preheated to 50 °C. When the prepared absorbent was poured into the column, the cooling unit was started. Afterward, the absorption liquid was imported from the column top continuously to contact the gas feed from the bottom of the column. As the pH and temperature would change after the absorbent absorbed CO2, along with the generation of the ATH precipitate, it was a self-regulating system. The mixed liquor was exported by overflowing continuously, and the outlet CO2 concentration was detected by the CO2 determinator during operation. When the detected CO2 at the outlet was constant, meaning steady-state operation has been achieved, the recorded pH, pressure, and temperature tended to be constant. The CO2 mass balance was taken in the steady state, and the absorption efficiency, absorption rate, mass transfer coefficient, absorption factor, and precipitation rate were determined. The influence of flow rate, temperature, and concentration in the absorption process was actively controlled by using this method. The operating variables were A, B, C, D, and E. The input volume of the NaAlO2 solution was recorded during operation. The liquid feeding was stopped after the experiment, the suspension was completely extracted by a peristaltic pump, and the gas feeder was turned off. After the collected suspension was filtered upon completion of the experiment, the liquid volume was measured and recorded, the obtained solid was dried, and then the XRD (Rigaku, D/MAX-2200/PC, Tokyo, Japan), FESEM (Jeol, JSM-6500F, Tokyo, Japan), and BET (PMI BET 201-APCW, NY, USA) analyses were performed. According to XRD analysis, the polymorphs and particle sizes of ATH solid products could be determined, and the composition of the filtered solution was analyzed by a titrator as a reference for analyzing carbonate and recovering sodium carbonate. Among the 16 Taguchi experiments, five optimum groups were validated and a total of 21 experiments were conducted. The solution obtained in the optimum groups was used as the mother liquor of recovered sodium carbonate for solution return and sodium carbonate crystallization tests.

3.2.2. Solvent Recovery and Na2CO3 Crystallization Experiment

Subsequently, to recover the solvent and obtain Na2CO3·nH2O(s), the evaporation method can be used for crystallization to recover Na2CO3·nH2O(s). When the evaporation method is used, heat energy should be provided for evaporating the moisture [26,27], and the consumed energy must be evaluated. Here, the evaporative crystallization process was used; the water vapor is cooled and collected, and the energy consumption for recovering sodium carbonate can be calculated according to the collected volume of liquor and temperature change. When the evaporation at a constant temperature is selected for crystallization, the crystallization operation of removing moisture by evaporation can remain at a certain temperature (boiling temperature) for the solvent recovery and reutilization test. Afterward, a 300 mL recovery solution was put in the beaker with the electromagnetic heating stirrer being employed for evaporation, and the heater temperature was controlled at 250 °C. Once the experiment began, the temperature changes were recorded, and the volume of evaporated water was recorded after the operation. It required evaporation of the solution, and the heating was stopped when a small amount of solution was presented. The high-temperature solution was cooled naturally to form a supersaturated solution, and the solid was separated naturally to form a suspension. After the cooled suspension was filtered by degassing, the liquid volume was measured, and the solid portion was dried in a 40 °C oven, ground in a mortar box, and weighed. Finally, the composition was verified and analyzed by FTIR (Thermo Nicolet i55).

4. Results and Discussion

4.1. Steady-State and Data Calculation

Various data of this study were calculated in steady-state. Taking No. 1 as an example, the CO2 concentration, temperature of liquid in the column, gas input temperature, pH, and gauge pressure of inlet gas were determined, as shown in Figure 4, wherein the y-axis is defined as Y = (variation value/initial value or setting value). According to the experiment data plot, the amplitude of variation was significant in the time diagram of outlet CO2 concentration and pressure, but generally speaking, the temperature of liquid in the column, gas input temperature, or pH became stable after 30 min of experiment. In view of this, No. 1 was identified as steady-state operation, which is the criterion of steady-state operation in the other experiments (No. 2–No. 21).
Therefore, the data of absorption efficiency (EF), absorption rate (RA), overall mass transfer coefficient (KGa), gas–liquid molar flow ratio (γ), and absorption factor (ϕ) can be obtained. The calculated equations of outcome data are given in Table 3:
Table 3. Equations with two-film model evaluated at steady-state. Developed from [3,29,31].
E F = y A 1 y A 2 y A 1 × 100 %
R A = F A 1 V L 1 1 y A 1 y A 1 y A 2 1 y A 2
K G a = Q g V L × ln C A 1 C A 2
ϕ = γ × E V × y A 1
R p = M T × Q L V L
The data were calculated as shown in Table 4. The EF range was 10.00–78.43%; the RA range was 8.4 × 10⁻⁵–7.53 × 10⁻⁴ mol/s·L; the KGa range was 0.035–0.192 1/s; the γ range was 0.94–10.09; the φ range was 0.0828–0.4117 mol/(mol·L); the RP range was 1.45 × 10⁻⁴–18.46 × 10⁻⁴ mol/(s·L); and the pH was 11.90–13.52. The findings above illustrate that the data range was extensive, meaning that the effect of operating conditions was significant. Table 5 shows the comparison between the findings of different absorption systems and the data of this study using bubble columns, including MEA-H2O-CO2, NaOH-H2O-CO2, NH3-H2O-CO2, and NaGly-H2O-CO2 systems. In terms of EF, the absorption efficiency of MEA and NH4OH could be 100%, and the maximum value of this study was only 84%, close to that of sodium glycinate. The RA was lower than those of MEA, NaOH, NH3, and NaGly, but higher than that of MEA-CaCl2-H2O-CO2. Additionally, the KGa was lower than that of MEA but higher than that of MEA-CaCl2-H2O-CO2, close to those of the other systems. Therefore, there are two conditions. In the first condition, there are crystals after absorption, such as NH3-H2O-CO2, MEA-CaCl2-H2O-CO2, and NaAlO2-H2O-CO2, wherein the NH3-H2O-CO2 includes systems with crystals and without crystals; the pH of the system with crystals was 9.5. In the second condition, there are no crystals after absorption, such as MEA-H2O-CO2, NaOH-H2O-CO2, and NaGly-H2O-CO2. The EF and KGa were lower than those of the absorption system without crystals in general, but the RA of the absorption system of NH3-H2O-CO2 crystal was 5.08 × 10⁻⁴–10.99 × 10⁻⁴ mol/(s·L), lower than that of the MEA-H2O-CO2 system but higher than those of the other systems. Obviously, the absorption effect of the CO2 absorption system was influenced by the system and solid particles, and the solid particles adhered to the bubble surface and existed in the solution, obstructing the mass transfer of CO2, so the values of EF, RA, and KGa decreased. Generally speaking, the MEA-H2O-CO2 system had the best absorption. In terms of crystallizing system, the NH3-H2O-CO2 system was a little higher than this system NaAlO2-H2O-CO2 compared with EF, RA, and KGa, but the absorption efficiency of the NH3-H2O-CO2 crystallizing system was 15.9–26.7% only if pH = 9.5, the pH of this system NaAlO2-H2O-CO2 was 11.90–13.52, the absorption efficiency was 10–84%, and it was more elastic. However, the pH of this project was mostly 12–13.52, close to 12–13.6 in the literature [18].

4.2. Taguchi Analysis

This study discusses absorption efficiency, absorption rate, overall mass transfer coefficient, absorption factor, and precipitation rate to achieve optimization, so the larger-the-better equation was used for calculation. It is shown below:
S N =10×log 1 n 1 n 1 Z i 2
The data in Table 4 were calculated by the S/N ratio equation of the Taguchi method. Various data were substituted in Equation (13) to obtain the optimum operating conditions and the order of importance of various data. Taking EF as an example, the data of EF of No. 1–No. 16 groups were substituted in Equation (13). The Delta is the basis of the order of importance of the Taguchi method; it is calculated by subtracting the minimum value from the maximum value of the four-level data after the larger-the-better value analysis. For example, the maximum value of Group A is Level 4 (31.16), the minimum value is Level 3 (26.13), and the difference is 5.03. The other groups are calculated in the same way; various data are substituted according to the distribution of the orthogonal array, and then the S/N (signal to noise ratio) factorial can be obtained. Table 6 shows the factorial effect data of the S/N ratio of absorption efficiency. The order of importance of various variables to absorption efficiency was C (gas flow rate) > D (CO2 concentration) > A (liquid flow rate) > B (NaAlO2 concentration) > E (liquid temperature), so the flow rate and concentration of gas were the main factors, and the liquid temperature had the minimum effect. The optimum operating conditions were A4B3C1D1E3: liquid flow rate, 50 mL/min; NaAlO2 concentration, 2 M; gas flow rate, 3 L/min; CO2 concentration, 5%; liquid temperature, 35 °C.
The S/N ratios resulting from EF, RP, KGa, RA, and φ are discussed below. A summary of optimum operating conditions and the order of importance derived from the Taguchi analysis of various data is shown in Table 7. Due to the five items of importance in Table 7, to discuss the overall importance, the five-point method is used. For example, the order of importance of efficiency (EF) is C > D > A > B > E, wherein the scores of C, D, A, B, and E are 5, 4, 3, 2, and 1, respectively. The quantized values of the importance of the output data corresponding to various operating factors are shown in Table 8, and the overall sequence is D > A = B > C > E, meaning D (CO2 concentration) is most important and E (liquid temperature) is least important. Figure 5 shows the radar chart, showing the overall importance of parameters.

4.3. Validation of Optimum Operating Conditions

No. 1–No. 16 data (in Table 4) of the Taguchi experiment were compared with the data of the optimum group. The obtained data are listed in Table 9, and the EF, RP, RA, KGa, and φ were optimized, as shown in the red brackets, meaning the Taguchi method was feasible for the design of experiments. The RA was coincident with the Rp to some extent and the effects of temperature were different: the former one increased with temperature while the latter one decreased with temperature. The Rp and RA were drawn, including the data of the Taguchi experiment and optimum group experiment, as shown in Figure 6. The Rp increased with RA, the solid line slope was 2.0, and the dotted line slope was 1.25, meaning Rp was 1.25–2.0 times higher than RA, but the ratio was 2 or 1 according to Equations (6) and (7). In the view of stoichiometry, Rp was 1–2 times higher than RA, which may be the result of the reaction according to stoichiometry. The slope was 1–2, which is reasonable, not induced by the reaction according to stoichiometry. This finding contributes to the discussion of the precipitate ATH generated by the NaAlO2-H2O-CO2 system.

4.4. Characterizations of Solids and Crystal Sizes
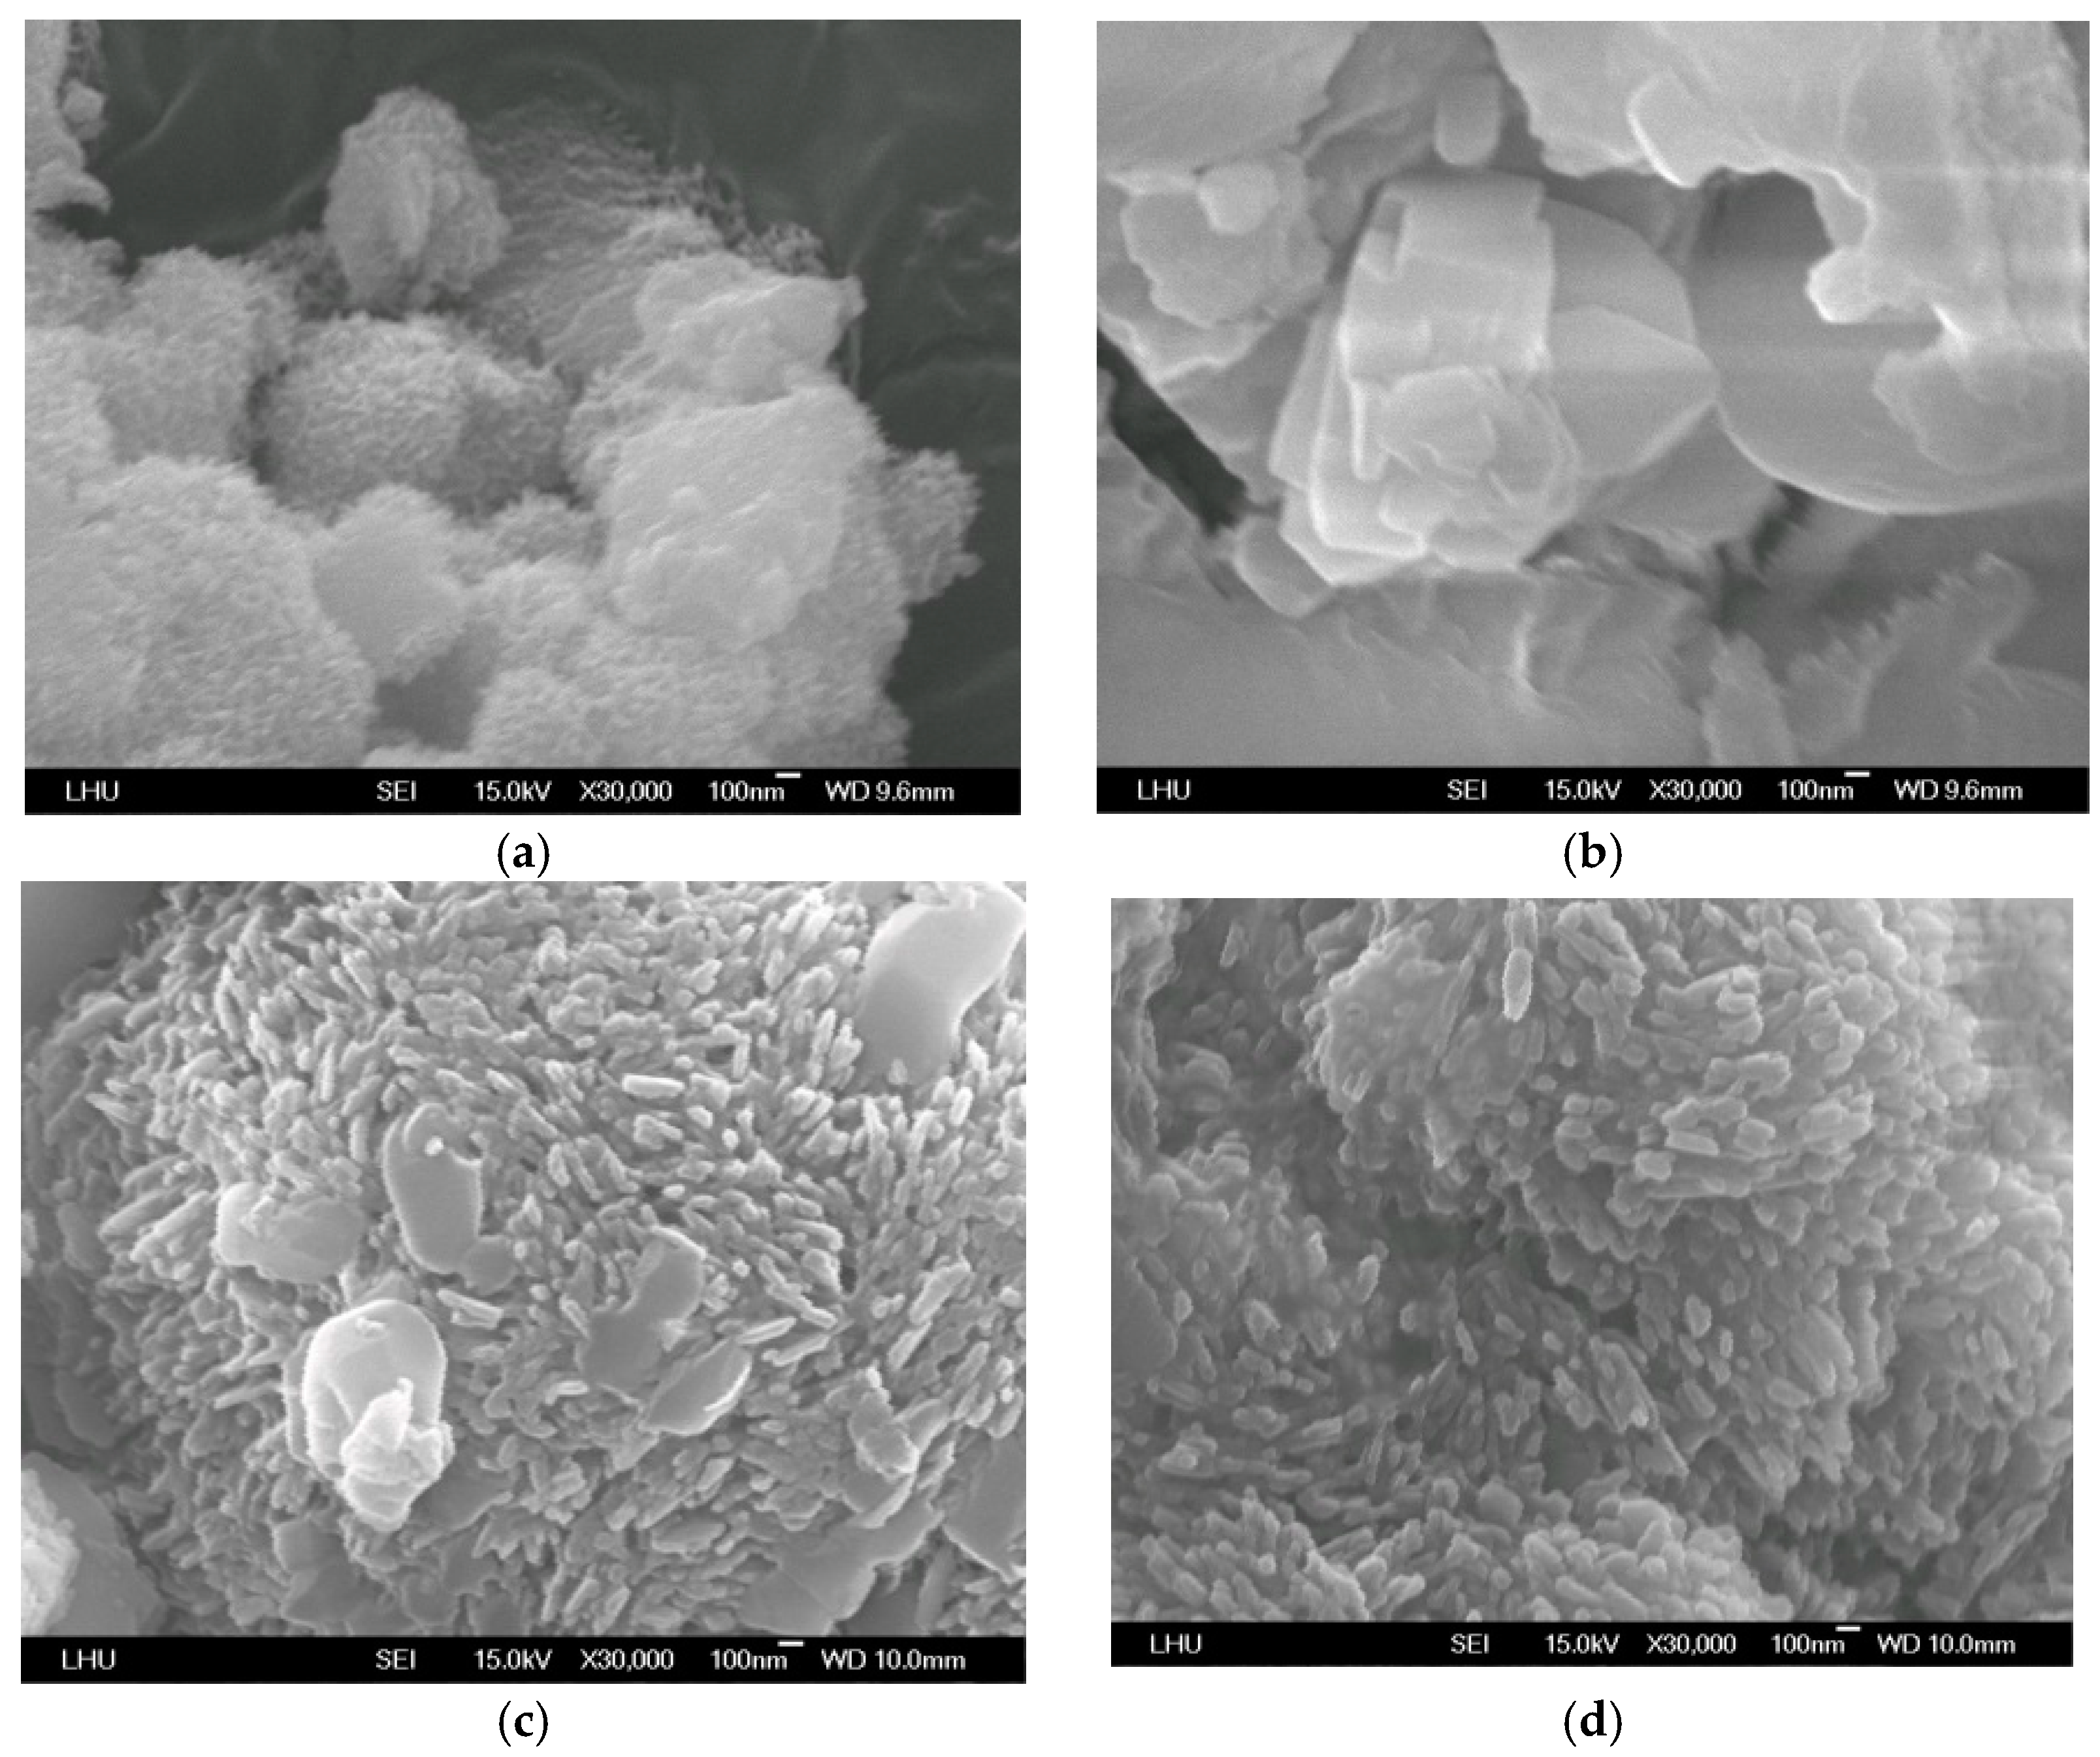
The lattice, crystallographic form, Miller index, and Full width at half maximum (FWHM) of the powder obtained in this study can be analyzed by XRD, so as to determine the composition, polymorphs, and crystal size of the powder. In the X-ray diffraction analysis overlay of 21 experiments, including 16 Taguchi experiments and 5 validation groups, the main component of the obtained powder was gibbsite, i.e., one of the states of aluminum hydroxide. The absorption peaks of Taguchi experiments are shown in Figure 7. The gibbsite has three polymorphs, including bayerite, doyleite, and nordstrandite. The obtained aluminum hydroxide was mainly bayerite, which is monoclinic. In addition, No. 3 was of boehmite crystallographic form. The boehmite is also known as aluminum oxyhydroxide, and its main molecular structure is AlOOH, which is orthorhombic. No. 5 and No. 21 (not shown in the figure) were free of peaks, so the composition could not be determined, but they were analyzed by FTIR. Figure 8 shows the FTIR analysis results of No. 5 and No. 21 groups. The absorption peak of the No. 5 group matches the α-Al2O3 in the literature; it is a sort of alumina. No. 21 and No. 3 are boehmites compared with the literature.
Additionally, the crystal size was analyzed by XRD in this study, i.e., FWHM, and the elementary crystal size of powder was determined with the Scherer equation. Taking No. 1 as an example, the copper target wavelength λ = 0.15406 nm, FWHM β = 0.288, and diffraction angle θ = 9.3905 were substituted in the Scherer equation, expressed as Equation (14):
d= 0.9 λ β cos θ
The crystal size of No. 1 was 27.97 nm and the other groups were calculated in the same way. The data of various groups are listed in Table 10. The crystal size of the 19 groups other than No. 5 and No. 21 was 8.14–27.87 nm, meaning that the primary crystals of ATH were nanosized.
To further understand the structure of powder particles and to determine the particle size of No. 5 and No. 21, the specific surface area of powder was measured by the specific surface area analyzer. The most used method is the BET gas adsorption method, whereas the multipoint method is the most accurate. This method uses the adsorption–desorption curve of N2 in liquid condition (77 K) to analyze the specific surface area of the aluminum hydroxide powder prepared in this study [14]. The specific surface areas of 16 groups of the Taguchi experiment and five optimum groups were analyzed, and the specific surface area of aluminum hydroxide was 8.36–134.50 m2/g. The relationships of the particle size, specific surface area, and particle size analyzed by the measured specific surface area are expressed as follows.
d B E T = 6 ρ S W
where ρ (g/cm3) and SW (m2/g) represent density and specific surface area, respectively. Taking experiment No. 1 as an example, the specific surface area and density are 9.89 m2/g and 2.53 g/cm3, respectively, and when they are substituted into Equation (15), the particle size is 239.79 nm. The analysis results of 21 experiments are shown in Table 10. The particle size range was 30.91–269.49 nm, and the particle sizes of experimental group No. 5 and optimum group No. 21 of the absorption factor were 19.06 nm and 33.42 nm, respectively, meaning that the particle size could not be determined by XRD but could be determined by the BET analyzer instead. The particle size from BET was quite different from those crystal sizes from XRD, and the difference between some groups was over 10 times; this may be because the ATH powder prepared in this study showed severe agglomeration.

4.5. SEM Analysis

The crystallographic form and microstructure of the ATH powder prepared in this study were analyzed by FE-SEM. The magnification of 30,000 was used for observation, and the voltage was 15 kV. No. 1–No. 4 are taken as examples, and the SEM analysis result is shown in Figure 9 with No. 1 showing a flower-like appearance, No. 2 and No. 3 being aggregate structures composed of irregular particles, and No. 4 being an urchin-like aggregated structure. Figure 10 shows the SEM crystallographic form and microstructure of No. 5–No. 8, with No. 5 looking similar to No. 4 as amorphous, No. 6 being a plate-like structure, and No. 7 and No. 8 being elongated aggregates. The shapes of No. 9, 10, 11, 13, and 15 powders were similar to those of No. 7 and No. 8, which were elongated aggregates. The shapes of No. 14, 17, 18, and 20 powders were similar to that of No. 1, and the shape of the No. 19 powder was similar to those of No. 2 and No. 3, being an aggregate structure composed of irregular particles. It can be determined that the operating conditions had a certain effect on the crystallographic form of aluminum hydroxide. Figure 11 shows the SEM particle form and microstructure of No. 5 and No. 21, which were amorphous, particle-like, and had little agglomeration and well-dispersed particles, unlike the other groups. A smaller particle size by BET than the other groups can validate the previously mentioned findings. The amorphousness and little agglomeration may be related to charges on the particle surface. The phenomenon of being amorphous, or a noncrystal and amorphous solid, means that the atoms thereof are arranged not according to a certain spatial sequence, contrary to crystals, as shown in Figure 11b. As the atoms have not yet been arranged into the thermodynamically crystalline lattice or skeleton before losing their moving speed, the possible distribution of atoms in a liquid state remains.

4.6. Recovery of Sodium Carbonate and Loading of Energy

There were five optimum groups of recovered solutions obtained in this study. The moisture in the solvent was evaporated by heating, but not recovered. The supersaturated solution was generated after evaporation so that the precipitate solid could be separated. First, the electromagnetic heater was fixed at 250 °C, and the liquid temperature was recorded every 10 min during magnetic stirring. Figure 12 shows the time diagram of liquid temperature of each group. It is noticeable that the temperature rose slowly from the initial time to about 50 min; this is sensible heat. The temperature stabilized gradually after 50 min; this is latent heat. The heating time was two hours at least. Then, heating was stopped, and the solution was cooled and precipitates were formed gradually at room temperature. When reaching room temperature, the solid was filtered by degassing. The filtered powders were then dried in the 40 °C oven and weighed, and the final volume of liquid was measured, with the result shown in Table 11. The temperature exceeded 100 °C in the late stage of operation, meaning that the solution contained other constituents besides water, hence increasing the boiling point. This part should be put into consideration in future analysis.
This study employed the evaporation method for the sodium carbonate recovery test, and then the energy loading was evaluated. Here, the pH of initial solution was in excess of 12, indicating that only CO32− was present in the solution, as shown in Equation (5). In addition, no carbamate existed in the solution; therefore, no heat of absorption was required to be evaluated. There were only two heat energies herein, sensible heat and latent heat, and the total heat energy is:
Q=m C P ΔT+ m ˙ H v a p
Therefore, the total heat energy can be obtained until the sensible heat and latent heat are obtained [32].
The heat load data of No. 17–No. 21 groups are shown in Table 11, with the range 1.70–2.46 GJ/t. Table 12 shows the heat load data range for regeneration of different systems in the literature. This laboratory used a gas stripping column to regenerate MEA+AMP solvent, and the heat loading range was 5.52–18.94 GJ/t-solvent [23]. In addition, the heat load range of regenerated sodium glycinate solvent (NaGly) of Chen and Lin [24] was 3.68–10.75 GJ/t-solvent. As this study has a lower heat load, the developed method has development potential. All five groups of solvent regeneration experiments generated solids, of which their compositions were analyzed by FTIR. The FTIR analysis overlay of No. 17 (E), No. 18 (RP), No. 19 (RA), No. 20 (KGa), and No. 21 (ϕ) is shown in Figure 13, and the solids from the five groups have similar transmittance properties (absorption peaks), with the main transmittance of 1450 cm−1. According to the literature, this is the transmittance of sodium carbonate [33], meaning that the product of solvent evaporation crystallization is sodium carbonate.

5. Conclusions

This study employed bubble columns as the scrubber and sodium aluminate solution as the absorbent, and adopted continuous bubble column operation to absorb CO2 and generate ATH precipitates. The EF, RA, KGa, φ, and RP were calculated under the steady-state conditions, and the optimum operating conditions and the order of importance of various data were analyzed and verified by the S/N of the Taguchi method. The crystallization and energy loading of the five optimum operation groups were studied by the evaporation method, and the solution evaporation and crystallization to obtain sodium carbonate by condensing were studied. The quantized overall sequence of D > A = B > C > E showed that CO2 concentration was most important and liquid temperature was least important. The verified optimum values were found to be EF = 84.0%, RA = 7.77 × 10⁻⁴ mol/s·L, KGa = 0.196 1/s, φ = 0.6396 mol/(mol·L), and RP = 17.48 mol/(s·L). The RP was 1.25–2.0 times higher than RA, between stoichiometric reaction 1 and 2; hence, the theory was coincident with the experiment. The prepared ATH powders were agglomerated with tiny particles in the range of 8.14–27.97 nm. In addition to apparent agglomeration, the particle morphologies were flower-like, irregular, urchin-like, elongated, and amorphous particles. According to the evaporation and crystallization of sodium carbonate, the energy loading was found to be 1.70–2.46 GJ/t, which is better as compared with the other systems. Finally, the economic products of ATH and sodium carbonate could be prepared with a lower energy loading. Therefore, this study has reference values for plant-scale operations of related industries.

Author Contributions

Conceptualization, P.-C.C.; methodology, P.-C.C.; software, S.-H.Z. and J.-H.J.; validation, P.-C.C., S.-H.Z. and J.-H.J.; formal analysis, S.-H.Z. and J.-H.J.; investigation, P.-C.C.; resources, P.-C.C.; data curation, S.-H.Z. and J.-H.J.; writing—original draft preparation, S.-H.Z.; writing—review and editing, P.-C.C.; visualization, S.-H.Z. and J.-H.J.; supervision, P.-C.C.; project administration, P.-C.C.; funding acquisition, P.-C.C. All authors have read and agreed to the published version of the manuscript.

Funding

The APC was funded by MOST 109-2221-E-262-004, Taiwan.

Conflicts of Interest

The authors declare no conflict of interest.

References

  1. Ghiat, I.; Al-Ansari, T. A review of carbon capture and utilisation as a CO2 abatement opportunity within the EWF nexus. J. CO2 Util. 2021, 45, 101432. [Google Scholar] [CrossRef]
  2. Han, K.; Ahn, C.K.; Lee, M.S. Performance of an ammonia-based CO2 capture pilot facility in iron and steel industry. Int. J. Greenh. Gas. Control 2014, 27, 239–246. [Google Scholar] [CrossRef]
  3. Yu, C.H.; Huang, C.H.; Tan, C.S. A review of CO2 capture by absorption and adsorption. Aerosol Air Qual Res. 2012, 12, 745–769. [Google Scholar] [CrossRef] [Green Version]
  4. Yang, H.; Xu, Z.; Fan, M.; Gupta, R.; Slimane, R.B.; Bland, A.E.; Wright, I. Progress in carbon dioxide separation and capture: A review. J. Environ. Sci. 2008, 20, 14–27. [Google Scholar] [CrossRef]
  5. Razzak, S.A.; Ali, S.A.M.; Hossain, M.M.; deLasa, H. Biological CO2 fixation with production of microalgae in wastewater—A review. Renew. Sustain. Energy Rev. 2017, 76, 379–390. [Google Scholar] [CrossRef]
  6. Barzagli, F.; Mani, F.; Peruzzini, M. Carbon dioxide uptake as ammonia and amine carbamates and their efficient conversion into urea and 1, 3-disubstituted ureas. J. Util. 2016, 13, 81–89. [Google Scholar] [CrossRef]
  7. Luu, M.T.; Milani, D.; Bahadori, A.; Abbas, A. A comparative study of CO2 utilization in methanol synthesis with various syngas production technologies. J. CO2 Util. 2015, 12, 62–76. [Google Scholar] [CrossRef]
  8. Oyenekan, B.A.; Rochelle, G.T. Energy performance of stripper configurations for CO2 capture by aqueous amines. Ind. Eng. Chem. Res. 2006, 45, 2457–2464. [Google Scholar] [CrossRef]
  9. Oyenekan, B.A.; Rochelle, G.T. Alternative stripper configurations for CO2 capture by aqueous amines. AIChE J. 2007, 53, 3144–3154. [Google Scholar] [CrossRef]
  10. Lin, P.H.; Wong, D.S.H. Carbon dioxide capture and regeneration with amine/alcohol/water blends. Int. J. Greenh. Gas. Control 2014, 26, 69–75. [Google Scholar] [CrossRef]
  11. Cuéllar-Franca, R.M.; Azapagic, A. Carbon capture, storage and utilisation technologies: A critical analysis and comparison of their life cycle environmental impacts. J. CO2 Util. 2015, 9, 82–102. [Google Scholar] [CrossRef]
  12. Gabrielli, P.; Gazzani, M.; Mazzotti, M. The role of carbon capture and utilization, carbon capture and storage, and biomass to enable a net-zero-CO2 emissions chemical industry. Ind. Eng. Chem. Res. 2020, 59, 7033–7045. [Google Scholar] [CrossRef] [Green Version]
  13. Chen, P.C.; Yu, S.C. CO2 capture and crystallization of ammonia bicarbonate in a lab-scale scrubber. Crystals 2018, 8, 39. [Google Scholar] [CrossRef] [Green Version]
  14. Chen, P.C.; Yang, L.C. Optimization and Characterization of Nano Aluminum Trihydrate-Based Flame-Retardant Materials in the Rotating Packed Bed Reactor. Mater. Sci. Appl. 2018, 9, 1036. [Google Scholar] [CrossRef] [Green Version]
  15. Lefevre, G.; Fedoroff, M. Synthesis of bayerite (β-Al (OH)3) microrods by neutralization of aluminate ions at constant pH. Mater. Lett. 2002, 56, 978–983. [Google Scholar] [CrossRef]
  16. Nguyen, H.T. Study on the synthesis of aluminum hydroxide and Al2O3. Colloid Polym. Sci. 2002, 40, 91–97. [Google Scholar]
  17. Chen, J.F.; Shao, L.; Guo, F.; Wang, X.M. Synthesis of nano-fibers of aluminum hydroxide in novel rotating packed bed reactor. Chem. Eng. Sci. 2003, 58, 569–575. [Google Scholar] [CrossRef]
  18. Wang, D.G.; Guo, F.; Chen, J.F.; Liu, H.; Zhang, Z.T. Preparation of nano aluminium trihydroxide by high gravity reactive precipitation. Chem. Eng. J. 2006, 121, 109–114. [Google Scholar] [CrossRef]
  19. Wang, D.G.; Guo, F.; Chen, J.F.; Zhao, R.H.; Zhang, Z.T. Synthesis of nano-platelets of modified aluminium hydroxide by high-gravity reactive precipitation and hydrothermal method. Mater. Chem. Phys. 2008, 107, 426–430. [Google Scholar] [CrossRef]
  20. Li, Y.; Zhang, Y.; Yang, C.; Zhang, Y. Precipitating sandy aluminium hydroxide from sodium aluminate solution by the neutralization of sodium bicarbonate. Hydrometallurgy 2009, 98, 52–57. [Google Scholar] [CrossRef]
  21. Li, H.; Addai-Mensah, J.; Thomas, J.C.; Gerson, A.R. The crystallization mechanism of Al (OH)3 from sodium aluminate solutions. J. Crysl. Growth 2005, 279, 508–520. [Google Scholar] [CrossRef]
  22. Chen, P.C.; Zhuo, S.H. CO2 Capture in A Bubble-Column Scrubber Using MEA/CaCl2/H2O Solution—Absorption and Precipitation. Crystals 2020, 10, 694. [Google Scholar] [CrossRef]
  23. Chen, P.C.; Lai, Y.L. Optimization in the Stripping Process of CO2 Gas Using Mixed Amines. Energies 2019, 12, 2202. [Google Scholar] [CrossRef] [Green Version]
  24. Chen, P.C.; Lin, S.Z. Optimization in the Absorption and Desorption of CO2 Using Sodium Glycinate Solution. Appl. Sci. 2018, 8, 2041. [Google Scholar] [CrossRef] [Green Version]
  25. Chen, P.C. Greenhouse Gases: Capturing, Utilization and Reduction; Ch. 5; InTech: Rijeka, Croatia, 2012; pp. 95–116. [Google Scholar]
  26. Gourdon, M.; Vamling, L.; Andersson, U.; Olausson, L. Crystallization in a pilot evaporator: Aqueous solutions of Na2CO3 and Na2SO4. Ind. Eng. Chem. Res. 2010, 49, 2401–2409. [Google Scholar] [CrossRef]
  27. Oosterhof, H.; Witkamp, G.J.; Van Rosmalen, G.M. Evaporative crystallization of anhydrous sodium carbonate at atmospheric conditions. AIChE J. 2001, 47, 2220–2225. [Google Scholar] [CrossRef]
  28. Schmelz, W.J.; Hochman, G.; Miller, K.G. Total cost of carbon capture and storage implemented at a regional scale: Northeastern and midwestern United States. Interface Focus 2020, 10, 20190065. [Google Scholar] [CrossRef]
  29. Chen, P.C.; Huang, C.H.; Su, T.; Chen, H.W.; Yang, M.W.; Tsao, J.M. Optimum conditions for the capture of carbon dioxide with a bubble-column scrubber. Intern. J. Greenh. Gas. Control 2015, 35, 47–55. [Google Scholar] [CrossRef]
  30. Chen, P.-C.; Cho, H.-H.; Jhuang, J.-H.; Ku, C.-H. Selection of Mixed Amines in the CO2 Capture Process. C 2021, 7, 25. [Google Scholar] [CrossRef]
  31. Chen, P.C.; Luo, Y.X.; Cai, P.W. CO2 capture using monoethanolamine in a bubble-column scrubber. Chem. Eng. Technol. 2015, 38, 274–282. [Google Scholar] [CrossRef]
  32. Gean Koplis, C. Transport Processes and Unit Operations, 2nd ed.; Allyn and Bacon, Inc.: Boston, MA, USA, 1983. [Google Scholar]
  33. Joshi, S.; Kalyanasundaram, S.; Balasubramanian, V. Quantitative analysis of sodium carbonate and sodium bicarbonate in solid mixtures using Fourier transform infrared spectroscopy (FT-IR). Appl. Spectros. 2013, 67, 841–845. [Google Scholar] [CrossRef] [PubMed]
  34. Kwak, N.S.; Lee, J.H.; Lee, I.Y.; Jang, K.R.; Shim, J.G. A study of new absorbent for post-combustion CO2 capture test bed. J. Taiwan Inst. Chem. Eng. 2014, 45, 2549–2556. [Google Scholar] [CrossRef]
  35. Badea, A.A.; Dinca, C.F. CO2 capture from post-combustion gas by employing MEA absorption process-experimental investigations for pilot studies. UPB Sci. Bull. D Mech. Eng. 2012, 74, 21–32. Available online: https://www.scientificbulletin.upb.ro/rev_docs_arhiva/fulla19_363293.pdf (accessed on 9 November 2021).
  36. Khan, A.A.; Halder, G.N.; Saha, A.K. Carbon dioxide capture characteristics from flue gas using aqueous 2-amino-2-methyl-1-propanol (AMP) and monoethanolamine (MEA) solutions in packed bed absorption and regeneration columns. Inter. J. Greenh. Gas. Control 2015, 32, 15–23. [Google Scholar] [CrossRef]
  37. Yeh, J.T.; Resnik, K.P.; Rygle, K.; Pennline, H.W. Semi-batch absorption and regeneration studies for CO2 capture by aqueous ammonia. Fuel Process. Technol. 2005, 86, 1533–1546. [Google Scholar] [CrossRef]
  38. Zhang, X.; Fu, K.; Liang, Z.; Yang, Z.; Rongwong, W.; Na, Y. Experimental Studies of Regen-eration Heat 399 Duty for CO2 Desorption from Aqueous DETA Solution in a Randomly Packed Column. Energy Procedia. 2014, 63, 1497–1503. [Google Scholar] [CrossRef] [Green Version]
  39. Dash, S.K.; Sammanta, N.; Bandyopadhyay, S.S. Simulation and Parametric Study of Post Combustion 385 CO2 Capture Process Using (AMP+PZ) Blended Solvent. Int. J. Greenh. Gas. Control 2014, 21, 130–139. [Google Scholar] [CrossRef]
Figure 1. Absorption of CO2 using NaAlO2 alkaline solution to produce ATH and sodium carbonate and applications.
Energies 15 01031 g001
Figure 2. A framework explored in this work. Developed from [30].
Energies 15 01031 g002
Figure 3. Removal of carbon dioxide and precipitation of Al(OH)3 using aqueous NaAlO2 solution as an absorbent in a bubble-column scrubber. Developed from [22,30].
Energies 15 01031 g003
Figure 4. A steady-state operation for No. 1.
Energies 15 01031 g004
Figure 5. A radar chart showing the parameters significance in this work.
Energies 15 01031 g005
Figure 6. A plot of RP versus RA showing reaction mechanism in Equations (6) and (7).
Energies 15 01031 g006
Figure 7. XRD patterns obtained in this work determining the composition and crystal size. (a) No. 1–No. 5; (b) No. 6–No. 10; (c) No. 11–No. 13; (d) No. 14–No. 16.
Energies 15 01031 g007aEnergies 15 01031 g007b
Figure 8. FTIR absorption spectra for No. 5 and No. 21.
Energies 15 01031 g008
Figure 9. SEM photographs for No. 1–4 showing the effects of conditions on the morphology. (a) No. 1; (b) No. 2; (c) No. 3; (d) No. 4.
Energies 15 01031 g009
Figure 10. SEM photographs for No. 5–8 showing the effects of conditions on the morphology. (a) No. 5; (b) No. 6; (c) No. 7; (d) No. 8.
Energies 15 01031 g010
Figure 11. SEM photographs for No. 5 and No. 21 showing the particles in amorphous structures. (a) No. 21; (b) crystalline and amorphous; (c) No. 5.
Energies 15 01031 g011
Figure 12. Elapsed times of the solution temperatures during evaporation.
Energies 15 01031 g012
Figure 13. FTIR spectra under different conditions.
Energies 15 01031 g013
Table 1. Factors and levels designed in this work.
FactorsLevel 1Level 2Level 3Level 4
Solution flow rate (L/min) (A)0.10.20.30.4
Concentration of solution (M) (B)11.52.02.5
Gas flow rate (L/min) (C)36912
CO2-gas concentration (%) (D)5101520
Liquid temperature (°C) (E)25303540
Table 2. Orthogonal array, L16 (45). From [30].
No.ABCDE
111111
212222
313333
414444
521234
622143
723412
824321
931342
1032431
1133124
1234213
1341423
1442314
1543241
1644132
Table 4. Outcome data evaluated in this work.
No.EFRA × 104KGaγφRp × 104
(%)(mol/(s·L))(1/s)(-)(mol/(mol·L))(mol/(s·L))
160.000.840.0615.810.21271.35
229.412.410.0578.120.29753.37
318.424.470.07710.090.34516.49
410.005.770.0608.610.210311.54
527.634.270.0788.030.41175.98
646.083.350.0492.640.30284.89
736.003.470.1927.820.17181.98
832.003.900.0954.460.17418.59
916.835.420.0448.540.354610.68
1013.164.670.0358.730.213211.06
1178.432.320.1121.400.13724.09
1260.001.950.1472.260.08283.77
1323.534.660.1118.510.24935.19
1448.002.660.1804.300.12593.15
1541.587.530.1002.520.258716.22
1664.002.870.0720.940.11033.45
Table 5. A comparison of data with different absorption systems. Developed from [30].
SystemEF (%)RA × 104 (mol/(s·L))KGa (1/s)References
MEA-H2O-CO217.50–97.503.68–56.80.0342–0.8881[31]
NaOH-H2O-CO221.30–90.601.03–11.480.015–0.26[26]
NH3-H2O-CO210.09–100.003.21–10.990.0136–0.3302[13]
NaGly-H2O-CO225.64–87.012.30–9.890.051–0.305[24]
MEA-CaCl2-H2O-CO2-0.063–3.800.0183–0.0520[22]
NaAlO2-H2O-CO210.00–84.000.84–7.850.035–0.196This work
Table 6. Taguchi analysis for EF using Equation (13).
LevelABCDE
129.6027.62(35.39)(33.56)27.21
230.5427.0830.8131.0628.46
326.13(29.53)27.0525.90(28.62)
4(31.16)25.4123.3824.3825.26
Delta5.034.1212.019.183.36
Rank34125
Table 7. Optimum conditions and significance of parameters.
Optimum Conditions Significance of Parameters
EF (max) A4 B3 C1 D1 E3C > D > A > B > E
RP (max)A3 B4 C3 D4 E3D > C > A > B > E
RA (max)A2 B3 C4 D4 E2D > C > A > B > E
KGa (max)A4 B3 C2 D1 E4B > A > D > E > C
φ (max) A1 B1 C4 D4 E1B > D > A > E > C
Table 8. The quantized values of the importance of the output data.
FactorsABCDE
EF32541
RP32451
RA32451
KGa45132
φ 35142
Average 3.23.234.21.4
Table 9. A comparison of confirmation data with Taguchi experiments.
No.EFRP × 104RA × 104KGaφ
(%)(mol/(s·L))(mol/(s·L))(1/s)(mol/(mol·L))
1–1610.00–78.431.35–16.220.84–7.530.035–0.1920.0828–0.4117
17 (EF)(84.00)2.031.160.1270.0599
18 (RP)28.43(17.48)8.440.0980.2557
19 (RA)10.8910.41(7.77)0.0600.2259
20 (KGa)68.004.142.32(0.196)0.1156
21 (φ)11.888.116.120.039(0.6396)
Table 10. Crystal sizes and particle sizes measured by using XRD and BET instruments, respectively.
XRD BET
No.λ (nm)βθdXRD (nm)SW (m2/g)dBET (nm)
10.154060.2889.390527.979.89239.79
20.154060.7086.889011.309.65245.76
30.154060.9767.23558.1425.2493.96
40.154060.3379.390023.898.66273.85
50.15406---134.5017.63
60.154060.2899.360027.8711.80200.98
70.154060.4629.390017.438.36283.68
80.154060.4989.340016.1713.12180.76
90.154060.3289.389524.5522.50105.40
100.154060.4679.511517.2525.6092.64
110.154060.4759.379516.9514.48163.78
120.154060.4939.300016.3314.18167.25
130.154060.4059.370519.8818.19130.38
140.154060.4089.446519.749.72243.99
150.154060.3349.396524.1111.22211.37
160.154060.4879.376516.5313.55175.02
17 (E)0.154060.4809.370516.7710.71221.43
18 (RP)0.154060.4969.373516.238.80269.49
19 (RA)0.154060.2909.102527.749.59247.29
20 (KGa)0.154060.3549.320522.7414.49163.67
21 (φ)0.15406---76.7230.91
Table 11. Data obtained in the evaporative crystallization.
ItemsNo. 17 (E)No. 18 (RP)No. 19 (RA)No. 20 (KGa)No. 21 (ϕ)
Initial volume (mL)300300300300300
Final volume (mL)55100657014
Yield (g)4.281.534.541.984.46
Time (min)220130200160230
Loading (GJ/t)2.161.701.972.052.46
Table 12. A comparison of heat of regeneration with different systems. Developed from [23].
SolventConditionsHeat of Regeneration
(GJ/t-Solvent)
References
KoSol-4Loading = 0.8
L/G = 1.4–3.1 kg/(s·m3)
ρ = 0.35–0.8 kg/cm2
3.33–4.55[34]
MEALoading = 0.25–0.49
30 wt.% MEA
1.15–4.35[35]
AMPLoading = 0.55
30 wt.% AMP
2.34[36]
AmmoniaLoading = 0.0525–0.01236
7–14% Ammonia
0.054–0.23[37]
DETALoading = 1.2–1.4
Solvent flow
rate = 3–12 m3/m2-h
2–3 M DETA
7.34–16.28[38]
PZ + AMPLoading = 0.4
T = 120–150 °C
3.40–4.40[39]
NaGlyLoading = 0.11–0.54
T = 100–120 °C
3–6 M NaGly
3.68–10.75[24]
MEA + AMPLoading = 0.3–0.5
T = 100–120 °C
4–6 M MEA + AMP
5.52–18.94[23]
NaAlO2 solutionLoading = 0.18–1.21
T = 90–100 °C
1–2.5 M NaAlO2
1.70–2.46this work
Publisher’s Note: MDPI stays neutral with regard to jurisdictional claims in published maps and institutional affiliations.

