Article

Performance Analysis of a Dynamic Line Rating System Based on Project Experiences

1
Department of Electric Power Engineering, Faculty of Electrical Engineering and Informatics, Budapest University of Technology and Economics, 18 Egry J. Street, 1111 Budapest, Hungary
2
National Dispatch Center, Electricity System Operator (ESO), 201, Tsar Boris III Blvd., 1618 Sofia, Bulgaria
3
Department Fundamentals of Electrical Engineering, Technical University of Sofia, 8 Kliment Ohridski Blvd., Block 12, 1000 Sofia, Bulgaria
*
Author to whom correspondence should be addressed.
Energies 2022, 15(3), 1003; https://doi.org/10.3390/en15031003
Submission received: 4 January 2022 / Revised: 20 January 2022 / Accepted: 26 January 2022 / Published: 29 January 2022

Abstract

:
This paper aims to demonstrate the performance and reliability analysis of a dynamic line rating (DLR) system at the Bulgarian demonstration site of the FLEXITRANSTORE project. As part of the project, various manufacturers’ different line monitoring DLR sensors and weather stations were installed on a 110 kV double-circuit overhead line (OHL). These devices provided input parameters to the DLR system based on objective measurements. This paper used statistical tools to examine the reliability and accuracy of installed devices, thus making products from different manufacturers comparable. In addition, two independent line monitoring and DLR models have been developed: the black-box and extended white-box models. The performances of the two models were analyzed for the same input parameters and compared to the field measurements. Based on the presented results, the reliability and accuracy of the applied weather stations of different companies were almost the same. This conclusion cannot be said for DLR line monitoring sensors, where the devices could be differentiated based on reliability and measurement accuracy results. In terms of models, the usability of the extended white-box model seemed to be limited in certain weather conditions, implicating a more significant role for soft-computing-based DLR models in the future. In addition to the results, root causes for the errors and future directions that may provide a framework for further research are also presented.

1. Introduction

Changes in the electricity system pose constant challenges for system operators to improve their grid and utilization levels [1,2]. One key issue is to increase the transmission capacity of overhead lines, especially in heavy-loaded, cross-border cases [3,4]. Increasing transmission capacity makes it possible to interconnect various electricity markets, reducing prices and integrating new renewable energy production units into existing infrastructure [4]. Dynamic line rating (DLR) is a novel method that offers a cost-effective solution to adjust the transmission capacity of power lines to the prevailing environmental conditions in real time [5,6,7]. Therefore, it can be efficiently applied for congestion management and avoid network curtailment [8]. The most significant advantage of a well-designed DLR system is the transfer capacity gain on the power line, which can reach 10–30% over 95% of the year [5,6,7]. Furthermore, another significant advantage of applying the DLR method is that a complex system can be built around itself that can monitor various sections’ thermal parameters and sag-clearance issues in real-time and also cope with the challenges of power line icing [9,10]. In this way, a more resilient and fully-utilized system becomes available, improving the energy system’s technical and economic level.

2. Motivation of the Paper

In recent years, several initial DLR systems were implemented worldwide with positive experiences regarding the power lines’ transfer capacity or ampacity gain [11,12,13,14,15,16,17]. However, it is essential to note that a small number of sensors have been in operation for a specified period in most demonstration projects [12,13,14]. Full, system-wide implementations are available in minimal numbers. This is important because several issues and directions for further development remain open for the full deployment of DLR systems, such as the selection of transmission lines, the location and the number of sensors, or their type and reliability level [4,5,6]. In recent years, there have been aspirations to build novel DLR models based on neural networks and other intelligent techniques [18,19,20,21,22]. These models can predict the line rating and forecast the ampacity hours ahead. It is also important to test existing algorithms’ accuracy or validate them, not just with test data but also under field conditions to compare their applicability [4,5,6].
This paper aims to narrow the gap due to the lack of actual field experience of comparing different monitoring devices and to present their performance. It is also aimed at testing a novel line monitoring and DLR calculation method called the extended white-box model [12,23]. Within the framework of the FLEXITRANSTORE (An Integrated Platform for Increased FLEXIbility in smart TRANSmission grids with STORage Entities and large penetration of Renewable Energy Sources) project, a neural network-based DLR model, called the black-box model, was also investigated [12,22,24]. This paper presents its applicability with supervised training on a large dataset measured by sensors and weather stations.

3. Presentation of the Project Background

FLEXITRANSTORE is an EU-funded international project [25]. In Work Package 7 (WP7), operational experience is gained at two demonstration countries, Slovenia and Bulgaria, to cope with extreme weather challenges, compare sensor devices from different manufacturers, and find new directions in DLR application fields. The Bulgarian subproject’s core was to install various sensors and weather stations on a high voltage power line for two years and analyze their performance and reliability. Moreover, two independent line monitoring and DLR models were also investigated at the Budapest University of Technology and Economics (BME) to increase the reliability of DLR calculations [22,23,24].

3.1. Details of the Demonstration Power Line

The Bulgarian transmission system operator—ESO (Electricity System Operator)—was the first who introduced DLR systems in the Balkans. In 2012, they installed a line monitoring sensor onto a 110 kV, double-circuit power line. That line supplies some parts of Sofia, so choosing it as a demonstration line was justified from the supply and strategical perspective. Moreover, it was retrofitted before the beginning of the project; therefore, the two uprating effects (reconductoring and application of DLR technology) were investigated jointly. The line was equipped with an ACO-400 conductor during the project, whose technical parameters are summarized in Table 1.

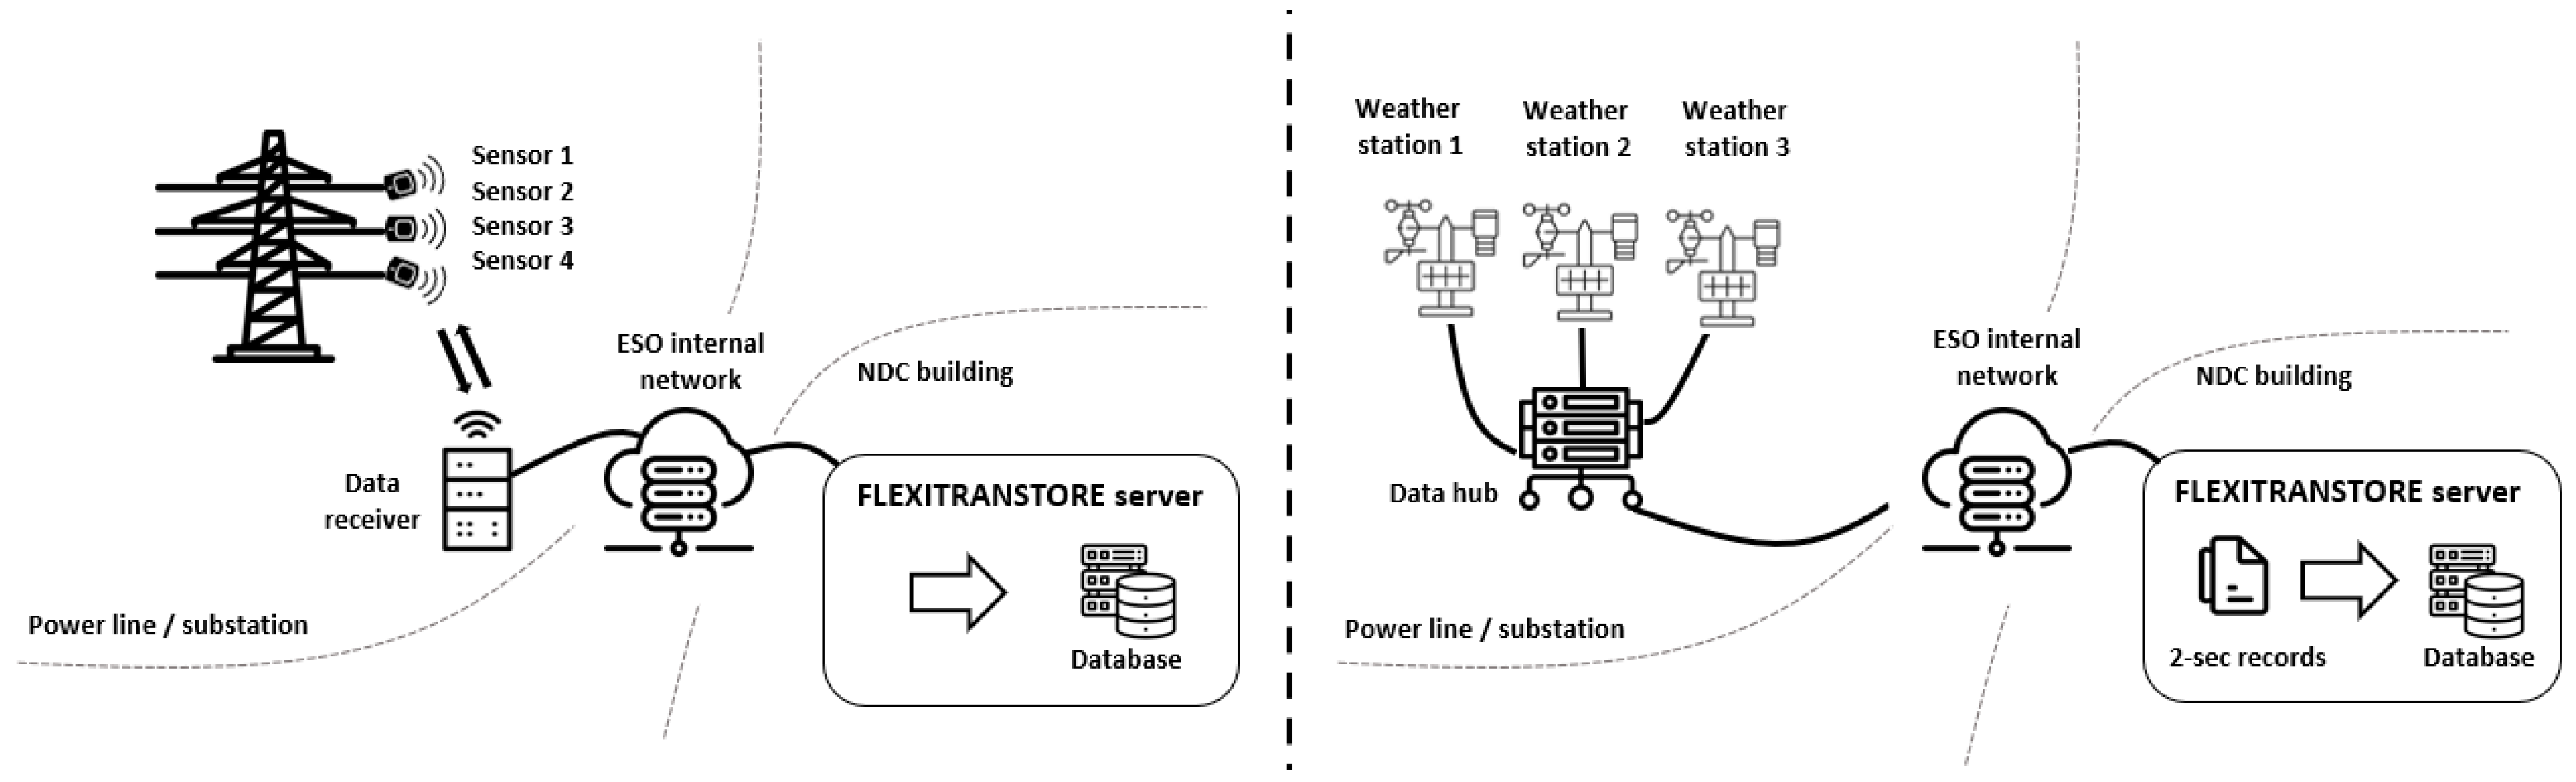
3.2. Hardware Infrastructure of the Implemented System

To realize a complete DLR system that monitors the environmental, mechanical, and thermal conditions along the power line, the appropriate field equipment is indispensable [3,4,5,6,7]. During the FLEXITRANSTORE project Bulgarian demonstration subpart, three weather stations from different manufacturers were installed next to the substation. Four different line monitoring sensors were seated close to the weather stations to provide information regarding the power line’s phase conductors. One of the line monitoring sensors began operating before the project, and its results were also analyzed in the observed period. The sensors and weather stations provided data at a predefined time frequency, 5 min for one line monitoring sensor and 3 s for the other sensors and the weather station. These data were continuously recorded and sent to a central database via the system operator’s internal network. The physical server was in the system operator’s headquarters, presented in Figure 1.
The devices were located as close to each other as possible to make it possible to compare the measurements. According to the manufacturer specification, the weather station’s measurement accuracy was the same for the different equipment. However, the functionality in the measured weather parameters differed from each other. Two weather stations could measure the wind speed and direction, ambient temperature, relative humidity, air pressure, and solar radiation. The third station had more extensive functionality, gathering data from the rain intensity along with the preceding parameters.
The three newer devices could measure the line load, the conductor and ambient temperature, and the span angle from which the sag becomes available regarding the line monitoring sensors. This was consistent with the features installed before the project. The details of the measured parameters and their features are summarized in Table 2.

3.3. Development of Line Monitoring and DLR Algorithms

The measurement of the field equipment provides input data for the DLR algorithms [3,4,5,6,7]. Two top recommendations can be found regarding the international literature: the IEEE and the CIGRE model [26,27,28]. These models are similar regarding the calculation method in that both are based on the conductors’ thermal equilibrium. However, influencing parameters—such as precipitation or magnetic heating—are not considered in the international models [4,5,12]. Another critical issue is that for dedicated inputs, their results are disharmonious [4,5,12]. Therefore, two independent line rating models were developed and tested in the project: the extended white-box model and the black-box model.

3.3.1. Extended White-Box Model of BME

The basis of the extended white-box model is the CIGRE model that contains more inputs than the IEEE model [26]. Compared to the basic CIGRE model, three new features can be identified. The first one is that it includes the evaporative cooling effect of the precipitation. By considering medium precipitation intensity characteristics in central Europe, the surplus ampacity gained by considering its impact is 5–8% [12,29,30]. The second novelty is the sectioning of the power line. Experiences gained from sensitivity analysis showed that the wind has the most significant influence on the line rating, so the power line is separated into sections at angle towers to consider the wind direction more precisely along the whole line. During the determination of the transmission capacity of the OHL, all the section’s ampacity is determined, from which the minimum is applied for the line [23]. The third development handles the weather forecast’s temporal resolution insufficiency, which is usually in the hourly range. Because the weather stations provide measurement records every 10 min, the time base of the forecast interpolation is chosen as 5 min. In this way, the predetermined line rating is calculated with the exact temporal resolution as the real-time ampacity. The extended white-box model is also appropriate for conductor temperature tracking, line rating calculation, and forecast [23].

3.3.2. Black-Box Model of BME

In developing the black-box model, the general aim was to provide an alternative method independent of both the CIGRE and IEEE models that makes it possible to compare them and provide an alternative [22,31]. A four-layer, cascade-froward neural network was applied with 68 neurons in a four-layer structure in the black-box model. Contrarily to other models, this one can determine the ampacity in two steps. The conductor temperature is selected via the neural network in the first step. The weather station and SCADA current data are the inputs, and the sensor-measured temperature is the output. This temperature is the input for the second step, in which the maximum load can be determined at a dedicated time if the conductor data and the upper limit temperature are both provided [22]. The dataset was divided into three major groups; 60% were applied for training and 10–20% for validation and testing. The Levenberg–Marquardt method was chosen for training one; the performance was analyzed by mean-square error. Data involved in the training was not used for validation or testing. The test performance of the model was above 97%.

4. Evaluation of the Algorithms’ Performance and Sensors’ Measurement Uncertainty

In the implemented DLR system in the framework of the FLEXITRANSTORE project, the proper data collection and reliable operation of the sensors are as important as the precise calculation of the models because these devices provide the input data. Due to this, complex analyses were performed monthly for the sensors and the developed algorithms between June 2019 and December 2020. According to the results, it can be stated that the deviation of the model and measurement accuracies varied in a small range. Therefore, in most cases, one month is presented as a case study regarding every analyzed variable, which adequately represents the consequences drawn throughout the whole demonstration period.

4.1. Reliability of Field Devices

First, the reliability of the field equipment was investigated by comparing the amount of collected data to the expected amount of measurement records during the demo period. As all the weather stations and line monitoring sensors (except DLR sensor 4) provided data every 3 s, the transferred data was averaged for 5 min intervals. If there was no data gathered in a five-minute time interval, it reduced the equipment’s reliability. In the case of DLR sensor 4, the data transmission time frame is 10 min.
The results of the reliability analysis are summarized in Table 3.
In Table 3, it is shown that, at the beginning of the demo period, there was a communication problem with the line monitoring sensors. Because of this, these four months were not investigated in the reliability analysis. It is also presented that the reliability of the weather stations was almost the same, and their reliability level was approximately 95% during the demonstration period. In the case of line monitoring sensors, DLR sensor 4 had the highest reliability with 98%. The parameter for two of the newly installed DLR sensors was more than 70%, while for DLR sensor 1, it did not reach 60%.

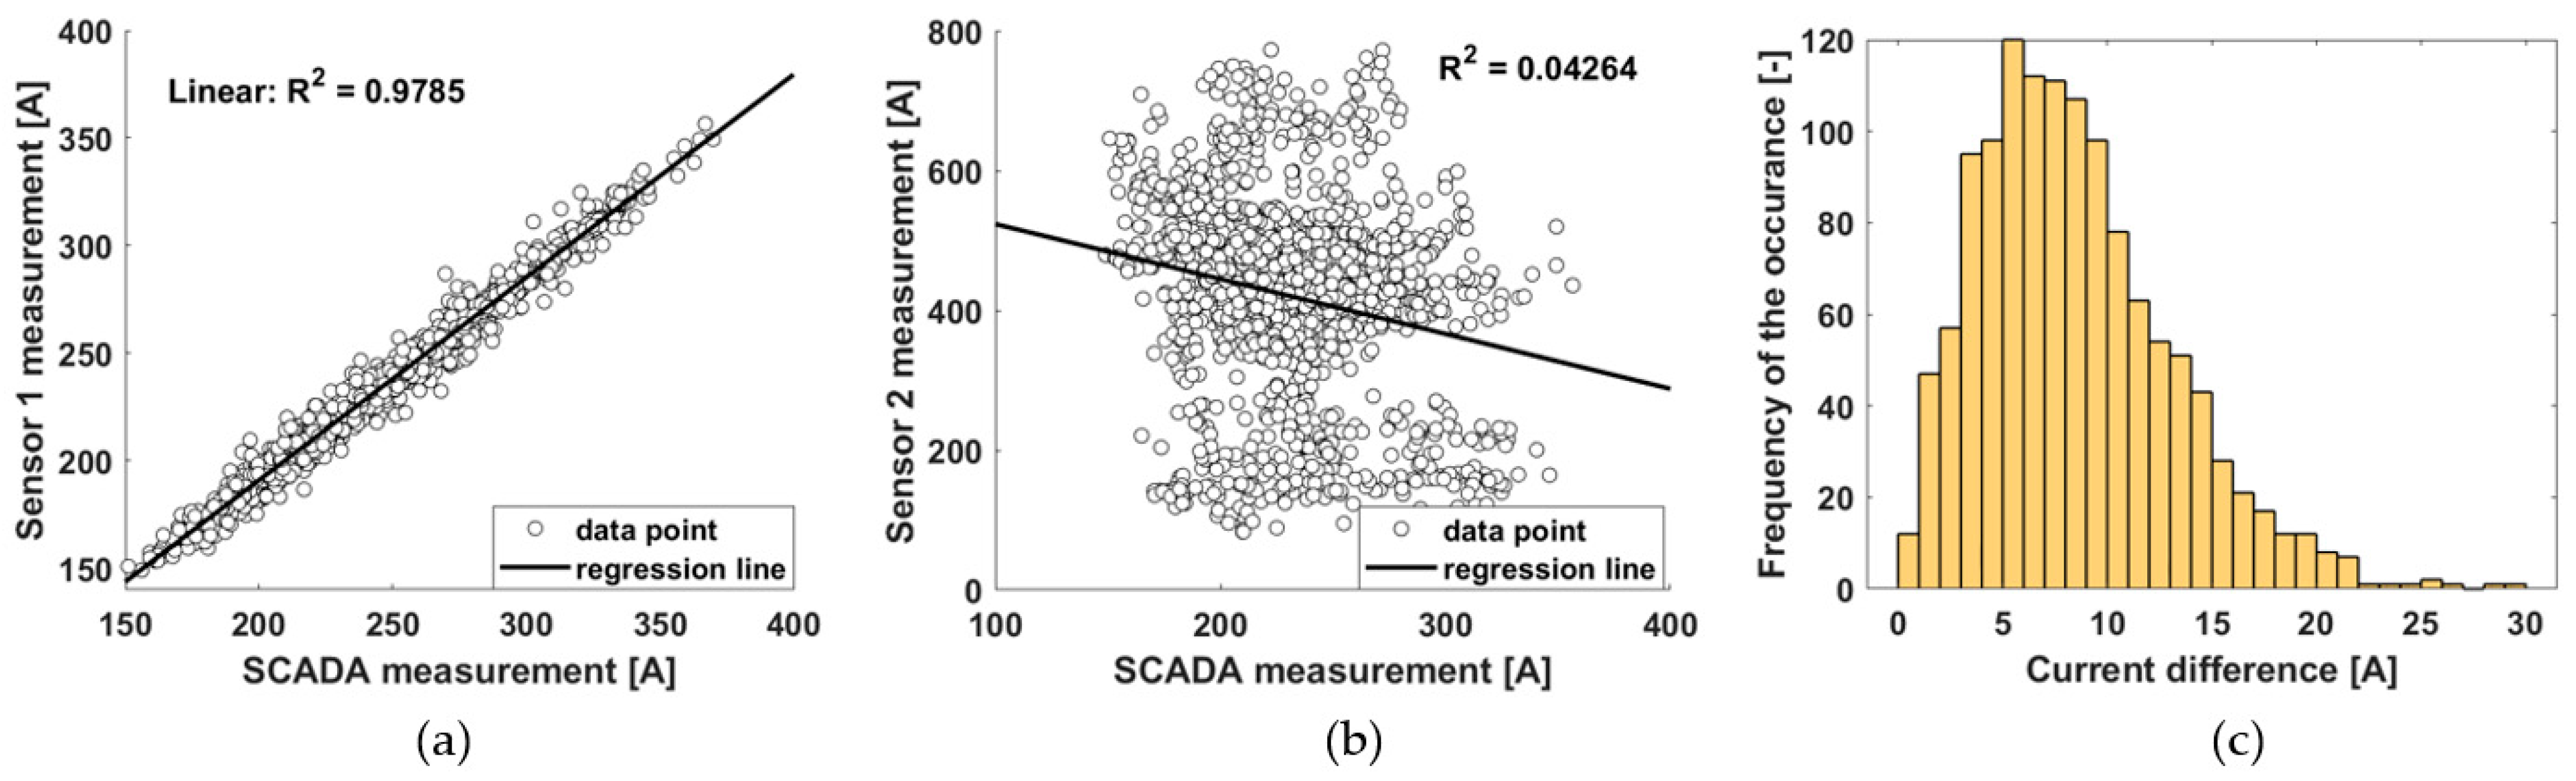
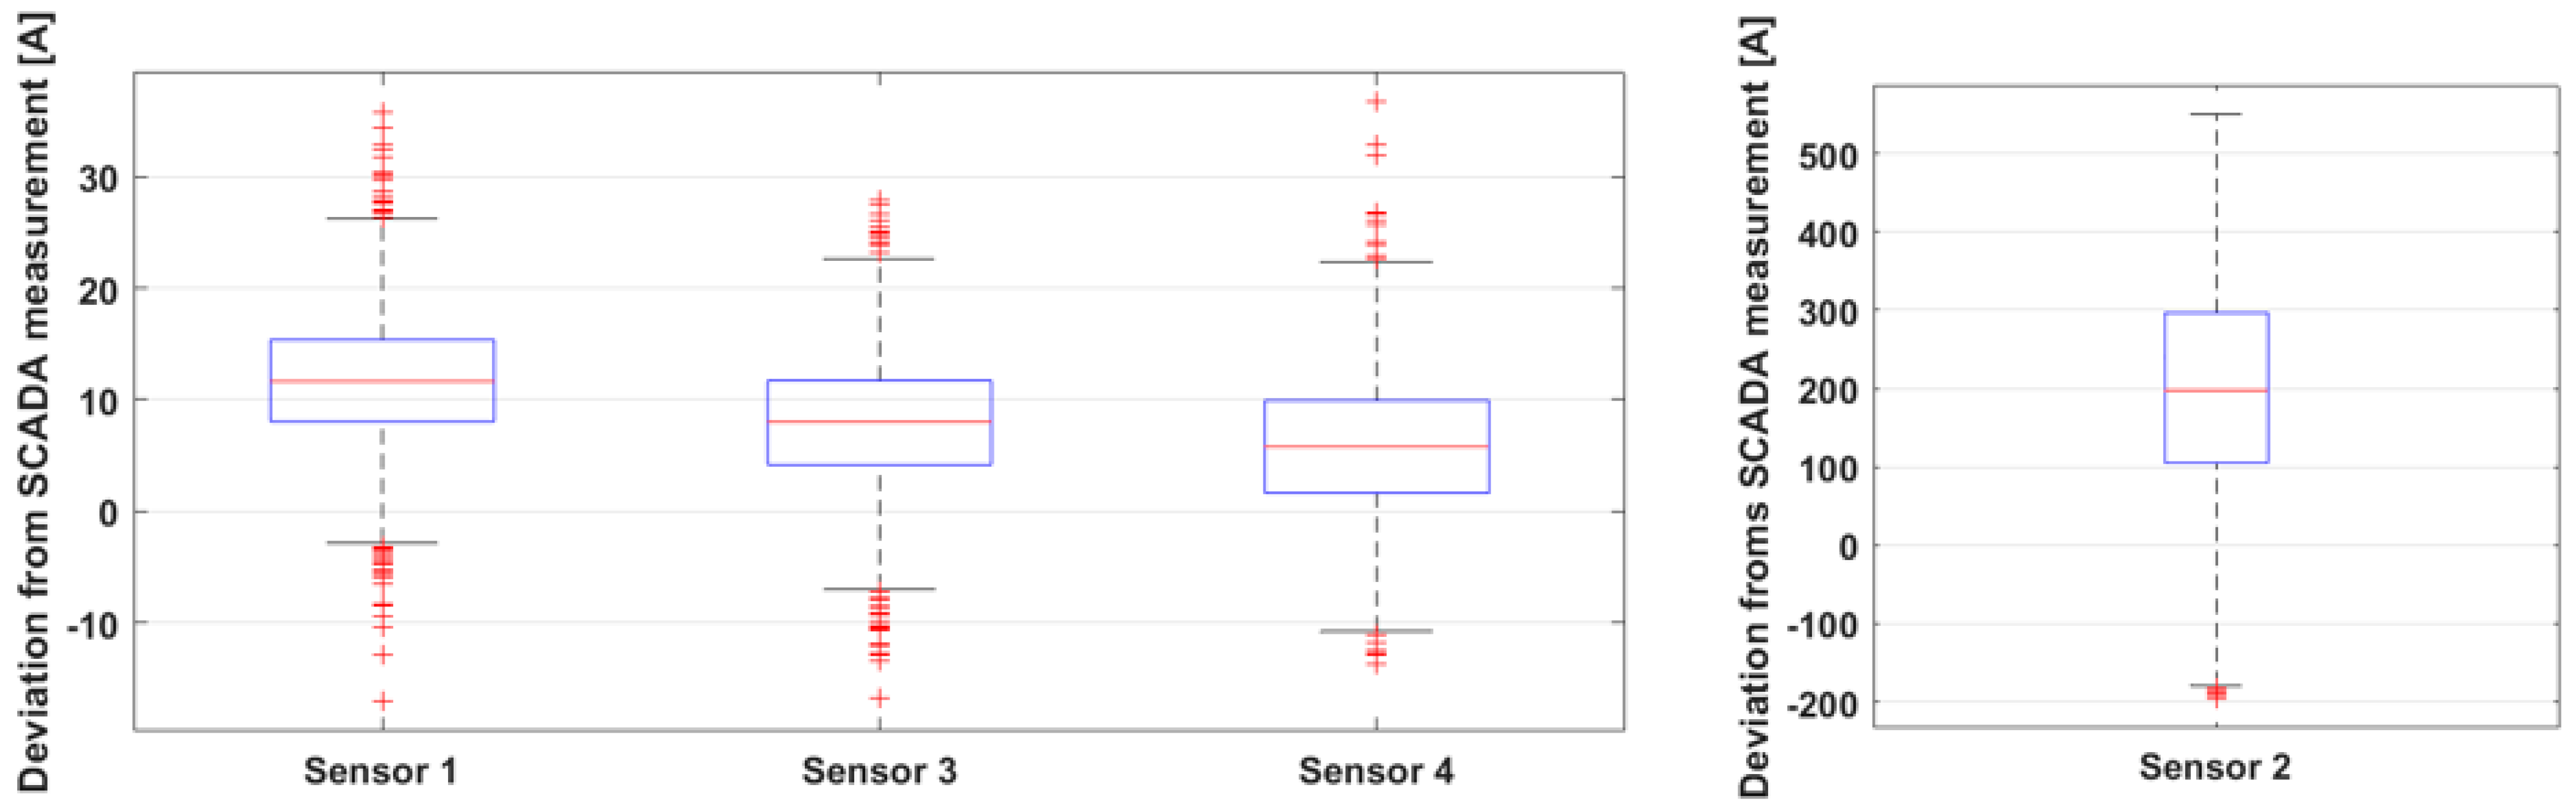
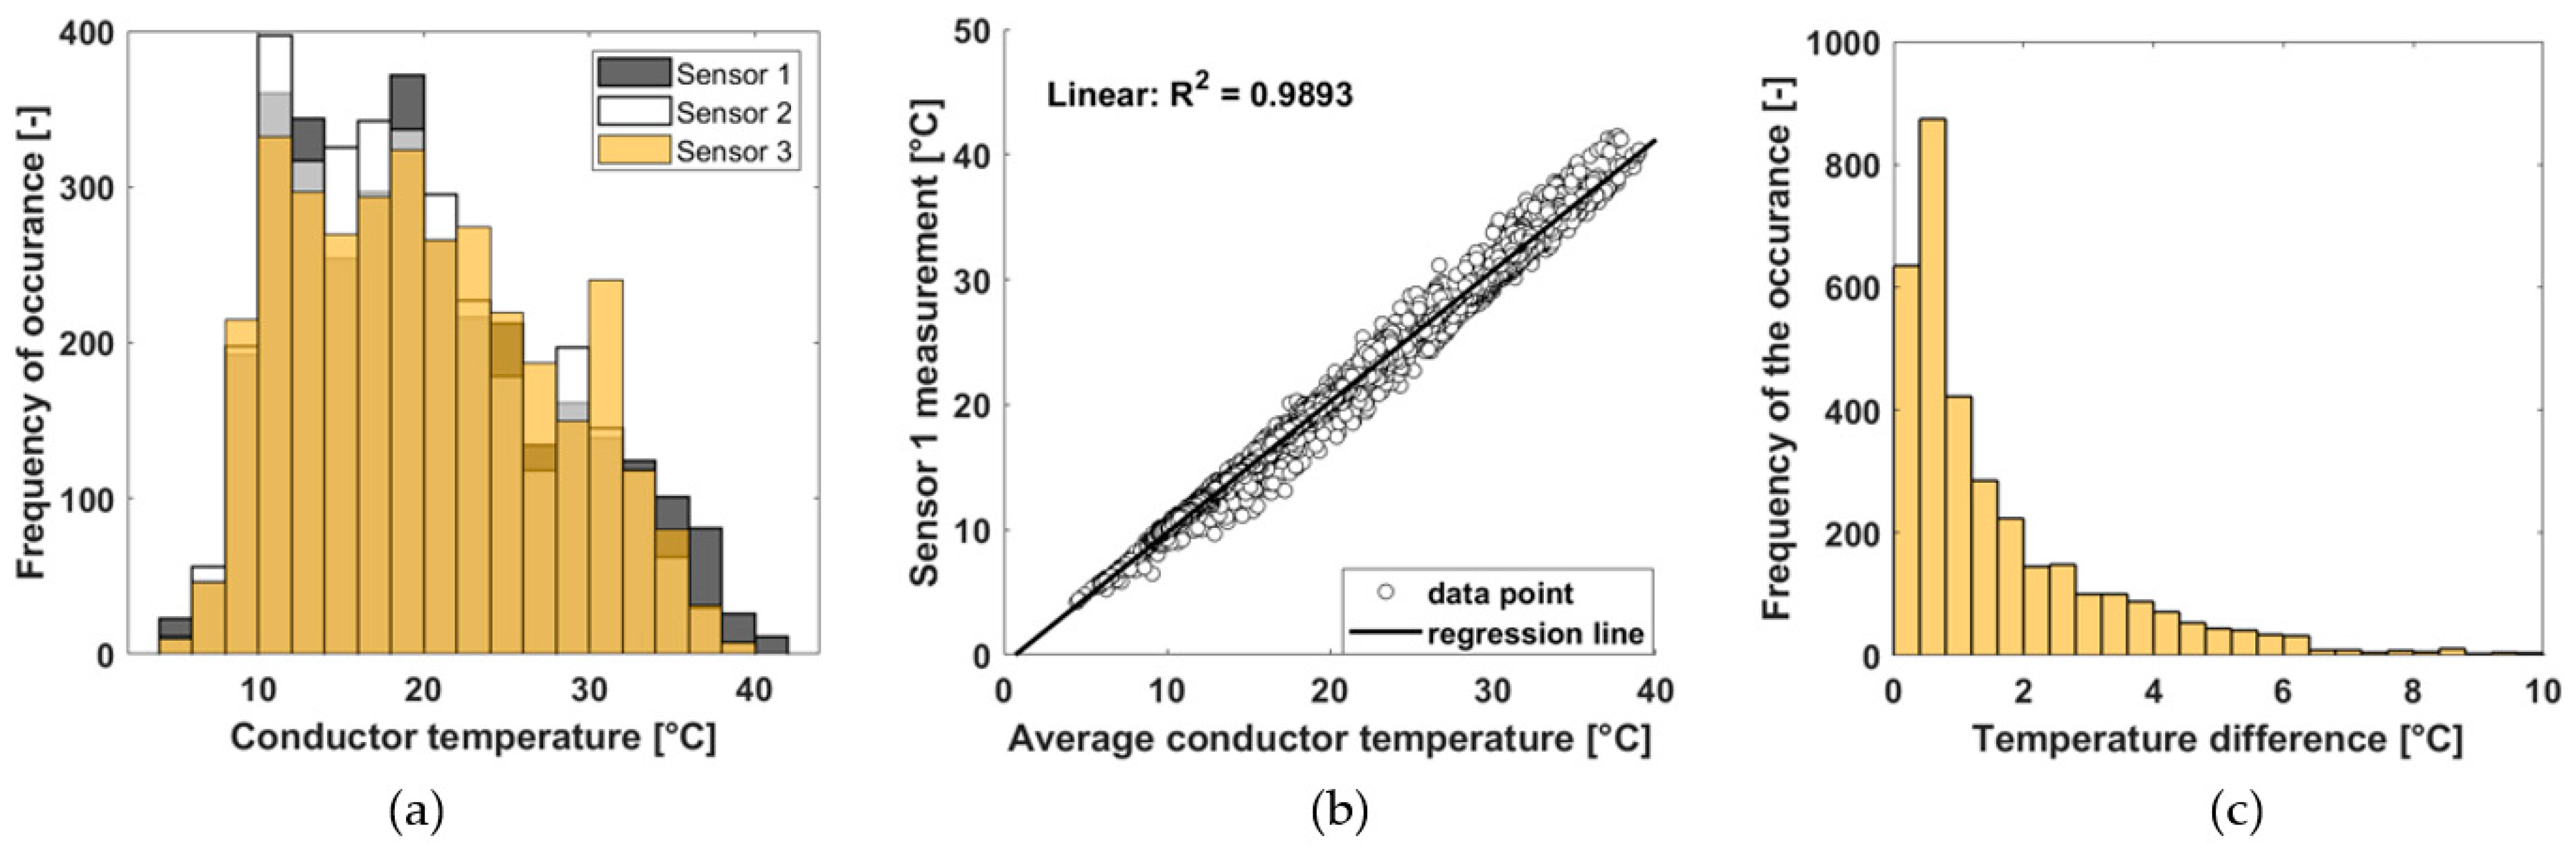
4.2. Accuracy of Field Measurements

Regarding DLR systems, the primary functions of the line monitoring sensors are the load and conductor temperature measurement accuracy, so this was investigated next.
Figure 2a,b presents the accuracy of load measurements from DLR sensors 1 and 2. The SCADA values were applied in these measurements as reference values due to SCADA’s accuracy, and reliability is proved. It can be seen that, in the case of DLR sensor 1, the data points fit a line with an R2-value of 0.978, while for DLR sensor 2, the accuracy level is not acceptable. Figure 2c presents the difference between the maximum and minimum measured load values, excluding DLR sensor 2 results.
In Figure 3, the boxplot diagrams are presented for the four line monitoring sensors. The 25th and 75th percentile intervals and the median deviations, respectively, are as follows:
  • DLR sensor 1: (−15.4; −8.0) A and −11.7 A;
  • DLR sensor 2: (−296.7; −105.4) A and 197.9 A;
  • DLR sensor 3: (−11.7; −4.1) A and −8.0 A;
  • DLR sensor 4: (−9.9; −1.6) A and −5.8 A.
Comparing the deviation of the sensor’s load measurement with the average load of the line, it can be stated that the sensor’s accuracy exceeds 95%. The only exception is DLR sensor 2, whose accuracy is only 21.4%.
The following analysis was carried out for the conductor temperature measurement of the sensors. Figure 4a shows that the conductor temperature measured by the three newly installed DLR sensors varies in the same range. In the case of this analysis, there is no fixed reference point, as SCADA data was in load measurement. Thus, the sensor measurements were compared to the average of the four sensor measurements. Figure 4b presents one graph for this case, where DLR sensor 1 measurements are presented. The R2 value of the data point fitting to the regression line is 0.98.
Comparing the measured conductor temperatures of the different devices simultaneously, the maximum and minimum of the measured records are also reached, shown in Figure 4c. Apart from some outliers, the deviance of the conductor temperature measured simultaneously by the four DLR sensors does not exceed 2.23 °C 75% of the time, while the median difference is 0.94 °C.

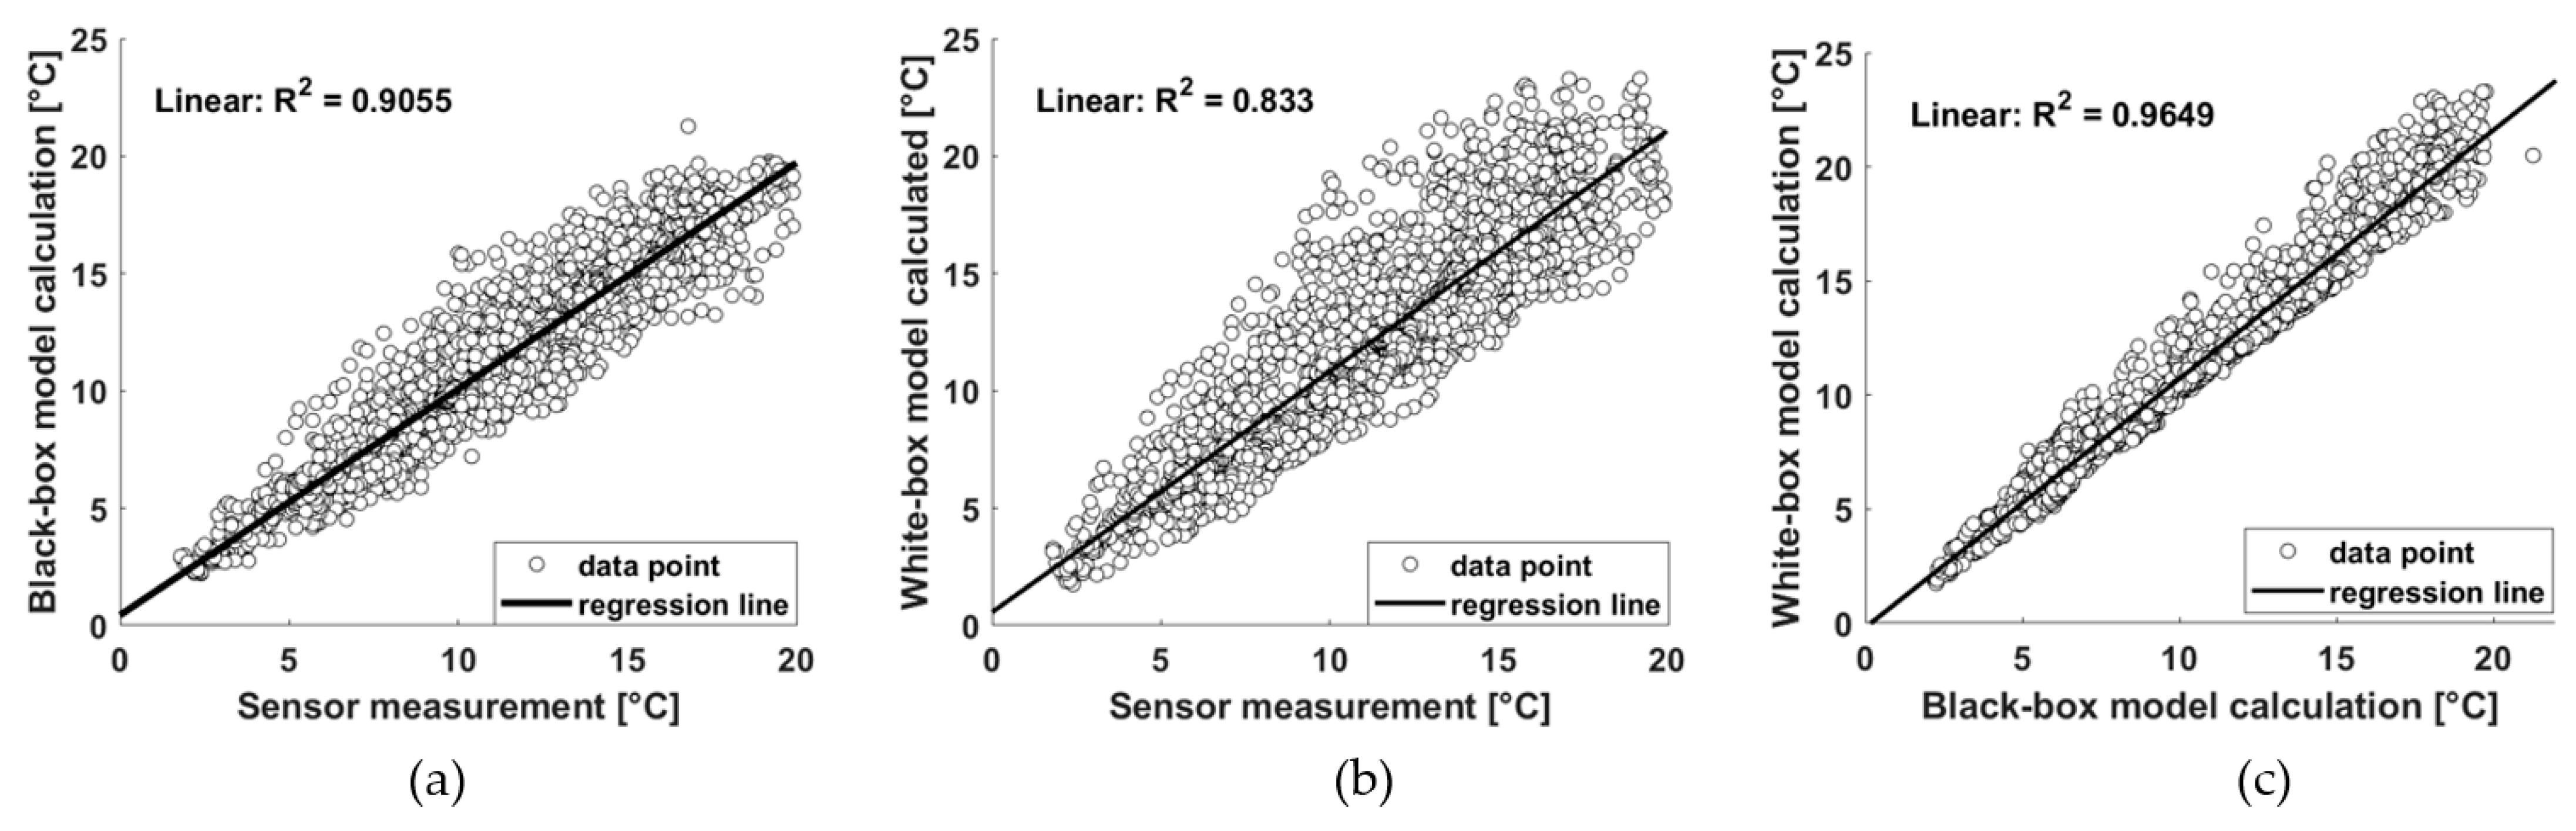
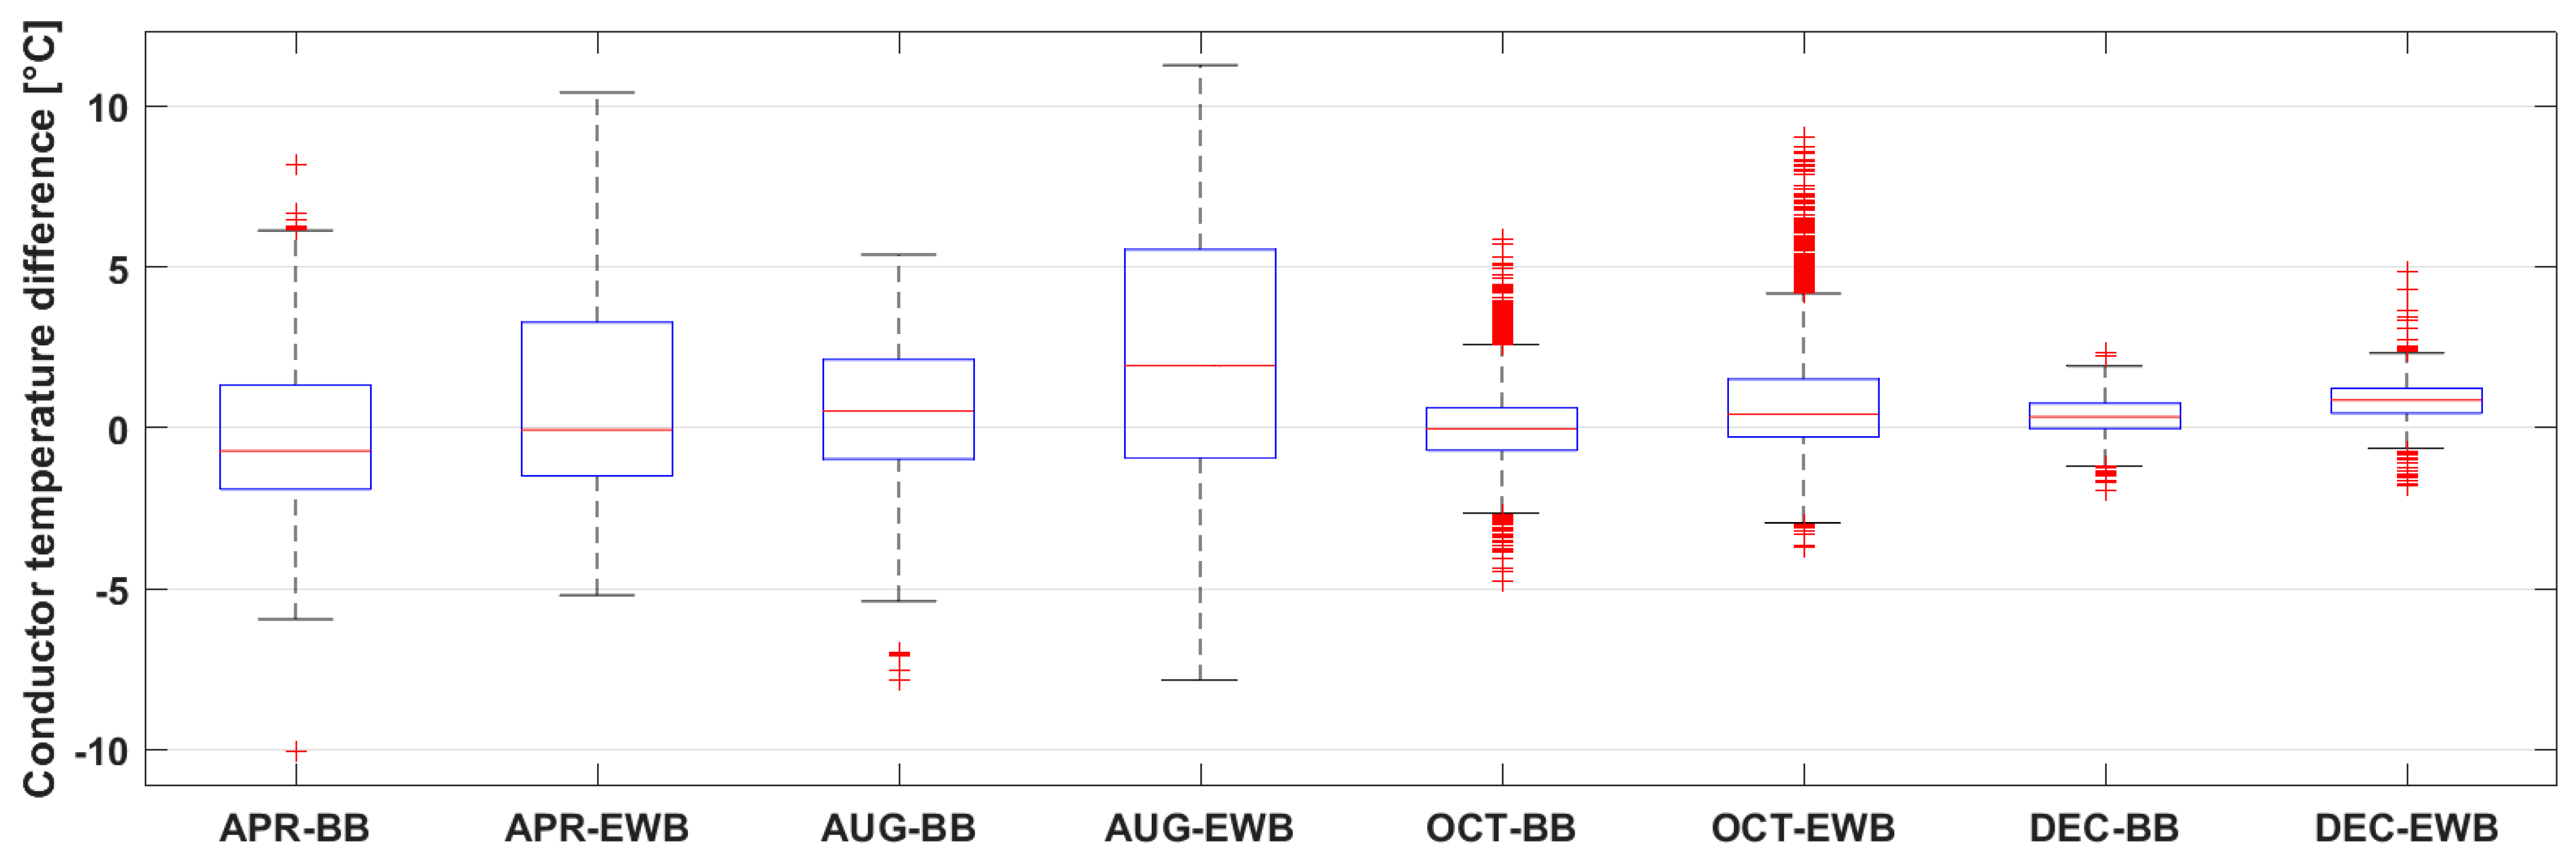
4.3. Accuracy and Performance of the Developed Models

The accuracy of line rating models can be determined via an indirect method by investigating conductor temperature tracking, which uses the same thermal equation applied for ampacity calculation. For this purpose, Figure 5 shows the performance of both the extended white-box model and the black-box model of BME in conductor temperature tracking.
For the model analysis, the reference conductor temperature was from the actual measurement of DLR sensor 4, whose accuracy was the highest. Figure 5a presents the temperature values calculated from the neural network-based black-box model compared to the sensor measurements. Figure 5b represents the same graph for the extended white-box model. While, in both cases, the R2 value is higher than 0.83, the performance of the black-box model can reach 0.90. Moreover, the higher the temperature, the more significant is the deviation in the fitting. Because there could be erroneous sensor measurements, in Figure 5c the results of the two models are presented for the same input parameters. For the given case, the result is an R2 value higher than 0.96, which is the same for the rest of the year.
Boxplot diagrams of the model calculations and the sensor measured values are presented to get a complete view of the models’ performance. In Figure 6, the statistical analysis is presented regarding the developed model for four months to eliminate the seasonal trends. The boxplots demonstrate that, for colder periods such as December and October, the performance of the black-box and extended white-box are close to each other. However, it is essential to note that, in these periods, the outliers are more significant in the case of the extended white-box model. Moving to the warmer periods, the performance of the models reduces. For August, the 25th and 75th percentile intervals and the median deviations, respectively, are as follows:
  • Black-box model: (−0.19; 2.11) A and 0.51 A,
  • Extended white-box model: (−0.93; 5.5) A and 1.92 A.
Real-time line rating offers the uprating of power lines. It can be applied to avoid local thermal overloads when the prevailing weather conditions are less favorable than those involved for static line rating calculation. To investigate line rating duration curves for the demonstration line, Figure 7 shows the real-time ampacity calculation results of the extended white-box model based on the three weather stations’ data between June 2019 and December 2020.
In the case of the investigated power line, the calculated real-time ampacity is less than the static line rating in 4.14% of the examined time interval, following the international literature statements. The average ampacity gain regarding the static line rating is 26.6% in the investigated period.

5. Discussion of the Results

Based on the presented results, the test period of the FLEXITRANSTORE project can be considered successful. Regarding the reliability of the devices, all three weather stations performed with a reliability level of approximately 95%, as was expected [4,5]. On the other hand, the reliability of the DLR sensors was insufficient; only one device, DLR sensor 4 (which was previously installed), can be considered as reliable equipment. This means that it does not matter to the end-user what device is chosen for the DLR system to be deployed because it is not a real option to operate a system without the provision of robust data. Increasing the level of the sensors’ reliability requires the introduction of a comprehensive, complex sensor test system that must be considered by all sensor manufacturers when developing their products.
From the accuracy of the field measurement, the different manufacturers’ products gave consistent results in both temperature and current measurements. It is presented that the conductor temperature measurement meets the manufacturers’ specification, which is ±1 °C, as shown in Table 2.
Based on the load measurement results, the desired accuracy can be ensured with the devices used, except for DLR sensor 2.
In addition to the hardware background, the operation and accuracy of the black-box and extended white-box were also tested. The results provided by the models can trace the reference points offered by the sensory measurements. However, the extended white-box model worked with a more significant standard deviation, and this difference increased at higher temperatures. It is also essential to note that while the data trend looks correct, the divergence between the single data points can exceed 2 °C, exceeding the measurement range.
The results of the models were also compared for the same input results, thus eliminating any inaccuracies in the sensory measurements. The presented models were consistent and could produce an output with a necessary level of accuracy. Based on the presented data, the application of the extended white-box model seems limited under exceptional circumstances. In contrast, the performance of the black-box model reached the required level even during the warmer summer period.
There may be several reasons for the presented results. One is the fact that the extended white-box model is a physical model. Hence, it is much more sensitive to wind speed and direction changes than the conductor with its thermal time constant. Furthermore, the location of the weather stations and the site of the sensors were shifted. This may result in the physical model providing less accurate results, as some environmental parameters are time-dependent and space-dependent [4,5,6]. Based on these findings, the role of soft-computing-based DLR models can be more critical in the future in those cases where it is impossible to install the weather station and the sensor at the same span. Based on these models, it is also possible to introduce novel DLR system approaches, such as placing many sensors on the line, collecting data for the black-box DLR model, and moving the devices to other lines after the neural network training period.
It is also worth noting that outlier data for both models need to be taken seriously with a real, implemented DLR system. A real alternative is to measure environmental and load parameters, not locally at one point but distributed along the transmission line [32,33]. Thus, the measurement uncertainty and the frequency of outliers can be reduced significantly, resulting in a reliable and robust line monitoring and DLR system.
Finally, the dynamic line rating calculated from the weather station data was analyzed. It resulted in a 26.6% ampacity gain on average for the investigated period. This correlates with the international literature and former experiences [3,4,5,6,8]. On the other hand, it is significant that, approximately 4% of the time, the static line rating exceeds the DLR, indicating that the application of this method provides a safer and more secure power line operation [5,12].
All in all, the results were consistent with the initial expectations. The project provides a solid basis for further research on DLR fields, such as soft-computing model development, distributed sensor monitoring concepts, and unified sensor testing concepts.

Author Contributions

Conceptualization, L.R. and B.N.; methodology, L.R.; software, L.R. and G.G.; formal analysis, L.R. and B.N.; investigation, L.R. and B.N.; resources, L.R., B.N., G.G., D.Z., V.M.; data curation, L.R., B.N., G.G., D.Z., V.M.; writing—original draft preparation, L.R.; writing—review and editing, B.N., G.G., D.Z., V.M.; visualization, L.R. and G.G.; supervision, B.N., D.Z., V.M.; project administration, B.N. and V.M. All authors have read and agreed to the published version of the manuscript.

Funding

This research was funded by the FLEXITRANSTORE project of the European Union’s Horizon 2020 research and innovation programme under grant agreement No 774407.

Institutional Review Board Statement

Not applicable.

Informed Consent Statement

Not applicable.

Data Availability Statement

The data that support the findings of this study are available from the corresponding author [LR], upon reasonable request.

Acknowledgments

This work was developed in both The Laboratory of Neurocomputing of the Technical University of Sofia and the High Voltage Laboratory of Budapest University of Technology and Economics within the boundaries of the FLEXITRANSTORE project, which is an international project. FLEXITRANSTORE (An Integrated Platform for Increased FLEXIbility in smart TRANSmission grids with STORage Entities and large penetration of Renewable Energy Sources) aims to contribute to the evolution towards a pan-European transmission network with high flexibility and high inter-connection levels.
Energies 15 01003 i001

Conflicts of Interest

The authors declare no conflict of interest.

References

  1. Schäfer, A.; Schuster, H.; Kasper, U.; Moser, A. Challenges of Power Systems. In Electrochemical Energy Storage for Renewable Sources and Grid Balancing; Elsevier: Amsterdam, The Netherlands, 2015; pp. 23–32. [Google Scholar]
  2. Aguero, J.R.; Takayesu, E.; Novosel, D.; Masiello, R. Modernizing the grid: Challenges and opportunities for a sustainable future. IEEE Power Energy Mag. 2017, 15, 74–83. [Google Scholar] [CrossRef]
  3. McCall, J.C.; Servatius, B. Enhanced Economic and Operational Advantages of Next Generation Dynamic Line Rating Systems; CIGRE Paris Session: Paris, France, 2016; Available online: https://lindsey-usa.com/wp-content/uploads/2017/01/11T-007-CIGRE-NEXT-GEN-DLR-October-2016.pdf (accessed on 15 January 2022).
  4. Hou, Y.; Wang, W.; Wei, Z.; Deng, X.; Ji, Q.; Wang, T.; Ru, X. Research and application of dynamic line rating technology. Energy Rep. 2020, 6, 716–730. [Google Scholar] [CrossRef]
  5. Karimi, S.; Musilek, P.; Knight, A.M. Dynamic thermal rating of transmission lines: A review. Renew. Sustain. Energy Rev. 2018, 91, 600–612. [Google Scholar] [CrossRef]
  6. Erdinç, F.G.; Erdinç, O.; Yumurtacı, R.; Catalão, J.P. A comprehensive overview of dynamic line rating combined with other flexibility options from an operational point of view. Energies 2020, 13, 6563. [Google Scholar] [CrossRef]
  7. Heckenbergerova, J.; Musilek, P.; Filimonenkov, K. Assessment of seasonal static thermal ratings of overhead transmission conductors. In Proceedings of the 2011 IEEE Power and Energy Society General Meeting, Detroit, MI, USA, 24–28 July 2011; IEEE: Piscataway, NJ, USA, 2011; pp. 1–8. [Google Scholar]
  8. IRENA. Innovation Landscape Brief: Dynamic Line Rating; International Renewable Energy Agency: Abu Dhabi, United Arab Emirates, 2020. [Google Scholar]
  9. Németh, B.; Göcsei, G.; Rácz, L.; Szabó, D. Development and Realization of a Complex Transmission line Management System; CIGRE Paris Session: Paris, France, 2020. [Google Scholar]
  10. Gubeljak, N.; Banic, B.; Lovrencic, V.; Kovac, M.; Nikolovski, S. Preventing transmission line damage caused by ice with smart on-line conductor monitoring. In Proceedings of the 2016 International Conference on Smart Systems and Technologies (SST), Osijek, Croatia, 12–14 October 2016; IEEE: Piscataway, NJ, USA, 2016; pp. 155–163. [Google Scholar]
  11. Reich, K.; Mika, G.; Puffer, R. Potential analyses for dynamic rating optimization on basis of four years of operational experience in Austria. Elektrotechnik Und Inf. 2018, 135, 548–555. [Google Scholar] [CrossRef]
  12. Rácz, L.; Szabo, D.; Gocsei, G.; Nemeth, B. Grid management technology for the integration of renewable energy sources into the transmission system. In Proceedings of the 2018 7th International Conference on Renewable Energy Research and Applications (ICRERA), Paris, France, 14–17 October 2018; IEEE: Piscataway, NJ, USA, 2018; pp. 612–617. [Google Scholar]
  13. Nguyen, H.M.; Lilien, J.L.; Schell, P. Dynamic line rating and ampacity forecasting as the keys to optimise power line assets with the integration of res. The European project Twenties Demonstration inside Central Western Europe. In Proceedings of the 22nd International Conference and Exhibition on Electricity Distribution (CIRED 2013), Stockholm, Sweden, 10–13 June 2013. [Google Scholar]
  14. Viola, T.; Németh, B.; Göcsei, G. Applicability of DLR sensors in high voltage systems. In Proceedings of the 2017 6th International Youth Conference on Energy (IYCE), Budapest, Hungary, 21–24 June 2017; IEEE: Piscataway, NJ, USA, 2017; pp. 1–6. [Google Scholar]
  15. Abdelkader, S.; Abbott, S.; Fu, J.; Fox, B.; Flynn, D.; McClean, L.; Bryans, L. Dynamic monitoring of overhead line ratings in wind intensive areas. In Proceedings of the European Wind Energy Conference & Exhibition 2009 (EWEC 2009), Marseille, France, 16–19 March 2009; Volume 2. [Google Scholar]
  16. Cloet, E.; Lilien, J.L. Uprating Transmission Lines through the use of an innovative real-time monitoring system. In Proceedings of the 2011 IEEE PES 12th International Conference on Transmission and Distribution Construction, Operation and Live-Line Maintenance (ESMO), Providence, RI, USA, 16–19 May 2011; IEEE: Piscataway, NJ, USA, 2011; pp. 1–6. [Google Scholar]
  17. Kim, S.D.; Morcos, M.M. An application of dynamic thermal line rating control system to up-rate the ampacity of overhead transmission lines. IEEE Trans. Power Deliv. 2013, 28, 1231–1232. [Google Scholar] [CrossRef] [Green Version]
  18. Li, Q.; Musavi, M.; Chamberlain, D. Overhead conductor thermal rating using neural networks. In Proceedings of the 2011 IEEE International Conference on Smart Measurements of Future Grids (SMFG) Proceedings, Bologna, Italy, 14–16 November 2011; IEEE: Piscataway, NJ, USA, 2011; pp. 139–142. [Google Scholar]
  19. Safari, N.; Mazhari, S.M.; Chung, C.Y.; Ko, S.B. A Secure Deep Probabilistic Dynamic Thermal Line Rating Prediction. arXiv 2020, arXiv:2011.12713. [Google Scholar]
  20. Dupin, R.; Michiorri, A.; Kariniotakis, G. Optimal dynamic line rating forecasts selection based on ampacity probabilistic forecasting and network operators’ risk aversion. IEEE Trans. Power Syst. 2019, 34, 2836–2845. [Google Scholar] [CrossRef] [Green Version]
  21. Saatloo, A.M.; Moradzadeh, A.; Moayyed, H.; Mohammadpourfard, M.; Mohammadi-Ivatloo, B. Hierarchical Extreme Learning Machine Enabled Dynamic Line Rating Forecasting. IEEE Syst. J. 2021, 1–11. [Google Scholar] [CrossRef]
  22. Rácz, L.; Németh, B. Investigation of dynamic electricity line rating based on neural networks. Energetika 2018, 64. [Google Scholar] [CrossRef]
  23. Szabó, D.; Göcsei, G.; Németh, B. Development of physical DLR calculation method. In Proceedings of the 2019 7th International Youth Conference on Energy (IYCE), Bled, Slovenia, 3–6 July 2019; IEEE: Piscataway, NJ, USA, 2019; pp. 1–6. [Google Scholar]
  24. Rácz, L.; Göcsei, G.; Németh, B. Different Approaches of Dynamic Line Rating Calculations. In Proceedings of the 2019 7th International Youth Conference on Energy (IYCE), Bled, Slovenia, 3–6 July 2019; IEEE: Piscataway, NJ, USA, 2019; pp. 1–6. [Google Scholar]
  25. The FLEXITRANSTORE Project, Official Website. Available online: http://www.flexitranstore.eu/The-project (accessed on 15 January 2022).
  26. IEEE Std. 738TM-2012; IEEE Power and Energy Society—IEEE Standard for Calculating the Current-Temperature Relationship of Bare Overhead Conductors. IEEE: Piscataway, NJ, USA, 2012.
  27. Iglesias, J.; Watt, G.; Douglass, D.; Morgan, V.; Stephen, R.; Bertinat, M.; Muftic, D.; Puffer, R.; Guery, D.; Ueda, S.; et al. Guide for Thermal Rating Calculations of Overhead Lines; CIGRE Paris Session: Paris, France, 2014; Available online: https://orbi.uliege.be/handle/2268/178855 (accessed on 15 January 2022).
  28. International Council for Large Electric Systems (CIGRE) Standard 207. Thermal Behaviour of Overhead Conductors. Available online: https://e-cigre.org/publication/207-thermal-behaviour-of-overhead-conductors (accessed on 15 January 2022).
  29. Pytlak, P.; Musilek, P.; Lozowski, E.; Toth, J. Modelling precipitation cooling of overhead conductors. Electr. Power Syst. Res. 2011, 81, 2147–2154. [Google Scholar] [CrossRef]
  30. Pytlak, P.; Musilek, P.; Lozowski, E. Precipitation-based conductor cooling model for dynamic thermal rating systems. In Proceedings of the 2009 IEEE Electrical Power Energy Conference (EPEC), Montreal, QC, Canada, 22–23 October 2009; IEEE: Piscataway, NJ, USA, 2009; pp. 1–7. [Google Scholar]
  31. Bozhkov, S.; Mladenov, V. Models for forecasting the transmission capability of high voltage power lines. In Proceedings of the Bulef Conference 18, Sozopol, Bulgaria, 11–14 September 2018. [Google Scholar]
  32. Seppa, T.O.; Salehian, A. Guide for selection of weather parameters for bare overhead conductor ratings. CIGRE WG B 2. 2006. Available online: https://e-cigre.org/publication/299-guide-for-the-selection-of-weather-parameters-for-bare-overhead-conductor-ratings (accessed on 15 January 2022).
  33. Johnson, J.; Smith, C.; Young, M.; Donohoo, K.; Owen, R.; Clark, E.; Espejo, R.; Aivaliotis, S.; Stelmak, R.; Mohr, R.; et al. Dynamic line rating oncor electric delivery smart grid program; Oncor Electric Delivery Company LLC: Dallas, TX, USA, 2013. [Google Scholar] [CrossRef] [Green Version]
Figure 1. Schematic drawing of the hardware infrastructure applied in the project.
Energies 15 01003 g001
Figure 2. Line load measurement result, April 2020: (a) Measurement results of line monitoring sensor 1 compared to data from the SCADA system; (b) Measurement results of line monitoring sensor 2 compared to data from the SCADA system; (c) Difference between the maximum and minimum of the measured load values.
Energies 15 01003 g002
Figure 3. Boxplot diagrams of the four line monitoring sensors’ load measurements, April 2020.
Energies 15 01003 g003
Figure 4. Conductor temperature measurement results: (a) Distribution of the different sensor measurements; (b) Sensor 1 measurement compared to the average conductor temperature values; (c) Difference between the maximum and minimum of the measured temperature values.
Energies 15 01003 g004
Figure 5. Performance analysis of the investigated models, April 2020: (a) Performance of the black-box model; (b) Performance of the extended white-box model; (c) Comparison of the black-box and extended white-box model results.
Energies 15 01003 g005
Figure 6. Boxplot diagrams of the black-box and extended white-box models for four different months.
Energies 15 01003 g006
Figure 7. Ampacity results of the extended white-box models from the weather station measurements.
Energies 15 01003 g007
Table 1. Technical parameters of the ACO-400 conductor installed on the demo line.
Conductor ParameterValueUnitConductor ParameterValueUnit
External diameter27.2mmThermal expansion coeff.1.985 × 10−51/°C
Core diameter9mmMod. Elasticity76,845kg/mm2
Specific weight1.472kg/mCross-section area441.5mm2
Coefficient RT0.0041/°CTMax70°C
RDC at 20 °C0.074ohm/kmMax. allowed Sigma11,251.1daN
Table 2. Technical parameters of weather stations and line monitoring sensors.
Measuring EquipmentMeasured ParameterRangeAccuracyResolution
Weather stationWind speed0.01 to 50 m/s±0.2 m/s0.01 m/s
Weather stationWind direction0 to 360°±3%
Weather stationAmbient temperature−30 to +60 °C±0.5% or 0.1 °C0.1 °C
Weather stationRelative humidity0 to 100%±0.8%1%
Weather stationSolar radiation-Max. 1750 W/m2-
Line monitoring sensorConductor temperature−40 to +200 °C±1 °C0.5 °C
Line monitoring sensorLine loadfrom 75 A±10%1 A
Table 3. Reliability of field measuring equipment.
Type of Measuring EquipmentMeasuring Equipment IDAmount of Data at Full AvailabilityAmount of Provided DataReliability
Weather stationWeather station 1167,040157,80294.47%
Weather station 2167,040157,80194.47%
Weather station 3167,040157,80394.47%
Line monitoring sensorDLR sensor 1131,61675,46957.34%
DLR sensor 2131,616104,72879.57%
DLR sensor 3131,61694,43871.75%
DLR sensor 465,80864,61698.19%
Publisher’s Note: MDPI stays neutral with regard to jurisdictional claims in published maps and institutional affiliations.

