Article

Relationship among Economic Growth, Energy Consumption, CO2 Emission, and Urbanization: An Econometric Perspective Analysis

by
Janusz Myszczyszyn
* and
Błażej Suproń
Department of Economics and Accounting, Faculty of Economics, West Pomeranian University of Technology, 70-310 Szczecin, Poland
*
Author to whom correspondence should be addressed.
Energies 2022, 15(24), 9647; https://doi.org/10.3390/en15249647
Submission received: 10 November 2022 / Revised: 7 December 2022 / Accepted: 15 December 2022 / Published: 19 December 2022
(This article belongs to the Topic Energy Economics and Sustainable Development)

Abstract

:
The key goal of this research was to figure out the short and long run relationship between environmental degradation caused by carbon dioxide (CO2) emissions and energy consumption, the level of GDP economic growth, and urbanization in the Visegrad Region countries (V4). The study used data from the years 1996–2020. In the methodological area, ARDL bound test, and ARDL and ECM models were used to determine the directions and strength of interdependence. The results show that in the case of some V4 countries (Poland, Slovakia, and Hungary), changes in the urbanization rate affect CO2 emissions. Moreover, it was confirmed that the phenomenon of urbanization influences the enhanced energy consumption in the studied countries. In the case of individual countries, these relationships were varied, both unidirectional and bidirectional. Their nature was also varied—there were both long and short-term relationships. These findings suggest that the V4 countries should increase renewable and ecological energy sources. It is also recommended to enhancement energy savings in the areas of both individual and industrial consumption by promoting low-emission solutions. This should be done while considering changes in urbanization.

1. Introduction

The study of the correlation between economic growth, energy consumption, and CO2 emissions has so far been widely analyzed for different countries and areas due to significant implications for economic policy, including the need for sustainable development. Sustainable economic growth should be based on relatively cheap energy resources, which in the face of the current challenges of the European economy may be a challenge for the next decades.
The countries of the Visegrad Group (V4) are the only one of the most dynamically developing countries in the region of Central and Eastern Europe (CEE). Thanks to the reforms in the early 1990s and the accession to the European Union (2004), the economies of these countries found themselves on a growth path.
Over the last three decades of rapid economic growth and changes in the manufacturing structure, the V4 countries have witnessed changes of a social nature and in the area of urbanization. These changes were in some countries positive (increase in population living in cities), while in others negative (deurbanization). The very process of urbanization is a huge challenge for individual countries through its impact on the natural environment. The process of changing the population of cities, due to the close relationship with economic, social, and environmental factors, may affect environmental degradation, and disrupt sustainable development [1].
Apart from changes in the degree of urbanization, the countries of the Visegrad Group are still burdened after the previous economic system with an outdated structure of energy production based mainly on fossil fuels, thus CO2 production is greater than in other Western European countries [2,3]. The recent challenges related to the implementation of the carbon dioxide reduction plan in the European Union by 80–90% in 2050 and achieving climate neutrality will require significant financial outlays and the mobilization of social and economic resources [4,5,6,7].
Considering the indicated arguments, it became justified to examine the relationships between urbanization, energy usage, CO2 emissions, and economic growth for the countries of the V4. Taking up the indicated research topic also results from the fact that there is no comprehensive research in this field covering the countries of the Visegrad Group. In view of the above, it became justified to investigate the discussed relationships.
The research purpose of the article was to examine the long run between CO2 emissions, energy consumption, economic growth (GDP per capita), and urbanization in the V4 countries in the period of 1996–2020, and to identify suggested challenges in economic policy for the future.
In order to analyzed the trends of changes in the examined variables, time series analysis tools were used and based on testing stationarity of series and long-term relations with the use of co-integration analysis, inter alia. For the aim of this study, the ensuing research hypotheses were accepted:
Hypothesis 1 (H1).
In individual V4 countries, in the long term, there were unidirectional or bidirectional relationships between the level of GDP per capita, CO2 emissions per capita, energy consumption per capita, and the level of urbanization.
This study is aware that the analyzed variables may not be cointegrated, which means the lack of long-term relationships. The authors also used the ARDL model to study short-term relationships. For this purpose, the following hypothesis was established:
Hypothesis 2 (H2).
In the short term, there were unidirectional or bidirectional relationships between the levels of GDP per capita, energy per capita, CO2 emissions per capita, and the level of urbanization.
To assess the relationships between these four variables and determine the nature of these relationships, the ARDL bounds testing method was used (the Autoregressive Distributed Lag). The method used required the estimation of models the ARDL (short run) and Error Correction Model (long run). Additionally, based on models, the direction of the variables’ impact was indicated. It should be added that this article is a continuation of the authors’ previous research Therefore, an additional variable in the form of urbanization has been considered and the time series have been updated [8].

2. Literature Review

The interest in the factors influencing CO2 emissions has been a very important research area in recent years. These considerations are part of the research on the ecological Kuznets curve (EKC) [9]. Initially, research focused on finding relationships between CO2 emissions and economic growth and energy consumption [10,11].
Coondoo D. and Dinda S. [12] investigated the causal relationships between CO2 emissions and per capita income for 88 countries in the years 1960–1990. The authors conclude that the research proved the existence of several dependencies: for the developed countries of North America, Western Europe (and Eastern Europe) a unidirectional causal relationship from CO2 emissions to per capita income was confirmed, for the group of countries of Central and South America, Japan, and Oceania, a unidirectional relationship from per capita income towards CO2 emissions was also confirmed, while for groups of Asian and African countries the relationship between per capita income and CO2 emissions was bidirectional. Other studies on the correlation between economic growth, CO2 emissions, and carbon consumption for China and India showed that the variables were co-integrated in the case of China—there was a unidirectional correlation (from economic growth to CO2 emissions) and a bidirectional relationship (between economic growth and carbon consumption, and carbon consumption and CO2 emissions). For India, however, there was only unidirectional Granger causation (from economic growth to coal consumption [13].
On the other hand, other studies for 18 European Union countries showed that in the long run there is a negative relationship between the GDP level and CO2 emissions. The authors justified it with the influence of modern technologies being more effective in reducing CO2 emissions. These studies also confirmed a positive relationship between the studied variables in the short term. [14,15]. Subsequent research work contributed to a better understanding of the relationship between CO2 emissions and economic growth and energy consumption [10,16,17].
The studies appearing in the last two decades allowed for the development of a research apparatus and a series of studies confirming the existence of relationships between GDP, CO2, and energy consumption in various regions and countries of the world [18,19,20,21,22,23]. Research has shown that there is a long-term and short-term causal link between energy consumption, CO2 emissions and economic growth. Additionally, on the basis of research material from various regions of the world, the hypothesis that economic development remains the main factor contributing to the increase in CO2 emissions has been confirmed.
In recent years, the scientific community has started to pay increased attention to the impact of urbanization on the greater use of CO2 and energy. The result was a number of Carbon Intensity studies confirming such a relationship for various countries and regions of the world, both developed and developing [24,25,26]. The studies cited above confirmed that the influence of urbanization on economic growth in higher- and middle-income countries is significant and positive, while in low- and middle-income countries, it is small. These studies have also shown that the impact of urbanization is gradual, meaning that each stage of urbanization has a different impact on economic growth.
The results obtained by individual researchers using various econometric methods often showed different results. Some of the studies indicated a positive relationship between the increase in urbanization and CO2 emissions [27,28]. Others, in contrast, described the existence of a negative tendency between the indicated variables [25,29,30,31,32]. There were also results indicating that urbanization did not affect energy consumption and CO2 emissions [33,34].
Summarizing the conducted considerations, it should be noted that the existing literature shows various results. Moreover, many of the studies cited focused on large developed and developing countries. In the case of the V4 countries, the relationship between CO2 emissions, energy consumption, and economic growth in different periods has been studied so far [8,20,35,36]. The indicated studies confirmed occurrence of both long-term and short-term relationships between the level of GDP, CO2 emissions, and energy usage.
Thus, as the conducted review of the available scientific sources indicates, despite a fairly large number of scientific papers on the subject matter under study, research on the Visegrad group is still scarce. As the results of empirical studies remain inconclusive, it seems that examining the influence of urbanization on energy consumption, CO2 emissions and economic growth (GDP per capita) for the V4 group, interesting examples of Central European economies, deserves further consideration. The conducted research tries to fill the theoretical and methodological gap in the indicated area.

3. Materials and Methods

3.1. Data

Data from 1996–2020 was used, which was dictated by the availability of comparable data (N = 25 for each country). In the case of the former countries of real socialism, there is a big problem related to the previous economic system and methods of calculating indicators, e.g., GNP. The former Czechoslovakia also split into two countries: the Czech Republic and Slovakia (1993). Many studies in these countries use data after 1995 [37,38].
The data processed in this study were obtained from the UNFCCC and OECD databases. The data under study were published annually, resulting from the frequency of information about the examined variables. The adopted research period resulted from the availability of data for the analyzed countries. The first full data for all variables were available for 1996 and the last for 2020.
All the examined variables have been assigned the following abbreviations: GDP per capita (G), energy consumption (E), CO2 emissions per capita (C), and level of urbanization (U). According to the practical literature on the subject, variables were transformed into the form of the natural logarithm (prefix l_ before the variable), without CO2 emissions per capita. That variable remained at the base value.
Table 1 summarizes the basic descriptive statistics for the data. They are: the smallest and the largest observed value, mean, median, and standard deviation. It is easy to notice that that received results are diversified, which proves different circumstances in the analyzed countries. These differences were confirmed by large deviations in the value of the standard deviation for the analyzed variables.
In the analyzed period, the highest energy consumption in 2020 (kg of oil equivalent per capita) was in the Czech Republic (39,882.98 kg per capita), while the lowest in Hungary (27,833.52 kg per capita). The largest decrease in energy consumption among the surveyed countries in the years 1996–2022 occurred in the Czech Republic (17.7%). The littlest decrease was in Hungary (2.1%). At the same time, a downward trend has been visible in the V4 group for a long time (Figure 1).
The highest economic growth was expressed in GDP per capita in 1996–2020 in Poland (increased by 245.23%) and Slovakia (increased by 216.35%). GDP per capita in Hungary increased by 187.15%, while in the Czech Republic increased by 162.1%. In the analyzed period, there was a balanced development of GDP for the studied countries. In Poland, the average annual GDP growth rate was 3.81%, which was the highest result. The Czech Republic developed the slowest, where the annual average GDP growth rate was 2.10% (Figure 2).
Another examined variable was CO2 emission. The graph for the variable under study is presented in Figure 3. In the class of research countries, the most CO2 (2020) per capita produced the Czech Republic (8.60 mt) and Poland (7.73 mt). Hungary was characterized by the lowest CO2 emissions among the V4 countries, and it amounted to (5.11 mt). Simultaneously, there is an observable decrease in CO2 emissions through the analyzed time in all studied countries. The greatest decrease in CO2 emissions was in the Czech Republic (a decrease by 34.1%), and the smallest in Poland (a decrease by 16.5%). Generally speaking, the smallest decrease in CO2 emissions in the accident of Poland and high emissions per capita are related to the data that Poland’s energy mix is largely based on the combustion of fossil fuels, mainly coal.
In terms of urbanization among the surveyed countries, the largest population (2020) lived in cities in the Czech Republic (71.77%), while the lowest in Slovakia, where the urbanization rate was 55.59%. Compared to 1996, the population living in cities increased the most in Hungary (an increase by 4.52%) and in the Czech Republic (an increase by 4.52%). However, in the Poland and the Czech Republic, the deurbanization process was visible, where the number of people living in cities decreased in the analyzed period, by 4.26% and 3.29%, respectively (Figure 4).

3.2. Methodology

According to the stated objective, the research examining, the relationship between economic growth (GDP per capita), CO2 emissions, energy consumption, and the level of urbanization in the V4 countries was investigated. The applied methodology results from the previously conducted analyzes of similar variables.
Tiba et. Al. [39] analyzed the link between economic growth, energy use, and environmental degradation. Dogan and Turkekul [40] conducted research on real output, urbanization energy use, and CO2 emissions for the USA economy from 1960 to 2010 by using the ARDL approach. Additionally, Anser [41] sed ARDL to check energy consumption and its effects on CO2 emission in Pakistan.
Jones [42,43] worked on the nexus among urbanization, energy use, and CO2 emission by using cross-sectional data. They found that there existed a correlation between energy per capita and urbanization. Moreover, urbanization increased energy usage and transport energy. In the context of ARDL, Zhang et al. [44], Mishra et al. [45], and Azam et al. [46] analyzed time series and the relationship between economic growth and urbanization on CO2. The results of the study showed that a long and short-term connection existed between variables for China, BRICS, and SAARC region.
To examine the relationship between carbon dioxide emissions, urbanization, energy consumption, and economic growth, we employ a similar methodology proposed by Apergis and Payne [47,48], Lean and Smyth [49], and Arouri et al. [50].
In connection to the above-mentioned research, we used ARDL to the significance of long- and short-run relationships. The missing link in the literature is that has not been an estimated relationship for urbanization CO2 emission, energy consumption, and urbanization in V4 by the ARDL method. As it was confirmed, the method was used to analyze the variables in many countries.
Based on the methodology proposed and developed by [51,52], the Autoregressive Distributed Lag (ARDL) test approach was used to investigate long-term relationships between the studied variables. The choice of the indicated method resulted from the following premises based on the literature on the subject [51,53,54].
Based on the indicated ARDL testing methodology, the unit root test of Dickey and Fuller was estimated, and the KPSS stationarity test was performed [55,56]. An ARDL boundary test was then performed to determine the nature of the relationships that existed. The optimal delay length for variables can be selected using Schwartz criteria (SC) and Akaike information criteria (AIC) using the ARDL method. The optimal level of lags was determined using the Akaike information criterion (AIC). The Schwartz (SC) criterion was used to select the minimum level of delays.
For each of the analyzed countries, finding the cointegration relationship between the variables l_E, l_G, l_U, and C required estimation of the ARDL model. In the next step, it was conducted with ARDL Bound Testing. This required examining the F statistic.
After estimating the F statistic in boundary testing (ARDL bound test), consideration was made about the occurrence of cointegration between the studied variables. If, for a given model, the estimated F-statistic was greater than the upper limit (I(1)), the hypothesis was rejected. In this case, for the given variables, the estimated correction model (ECM) was used.
The estimated models were also checked by the Breusch-Godfrey serial correlation LM, residual normality test (Jarque–Ber test) and homoscedasticity (Breusch–Pagan–Godfrey test). All tests were performed at the 5% significance level. Moreover, stability tests (Ramsey RESET Test) and stability assessment on the basis of CUSUM and CUSUM2 graphs at the significance level of 5% were performed for ready-made models [51,53]—Appendix A.

4. Results

4.1. Results for Unit Root Test and ARDL Bound Testing for Cointegration

In defiance of the potent relationship among the analyzed variables, the authors investigated their stationarity. Performing the variable stationarity test is necessary to use the ARDL Bound Testing approach. The studied variables should be integrated at the I(0) or I(1) level. The ADF test results are condensed in Table 2.
According to the ADF test, it was confirmed that the analyzed variables (except for the l_U variable for Slovakia) are integrated at level I(1). Similar test results were also obtained using the KPSS test.
Knowing the results of the stationarity examination, the ARDL model analysis (bound testing) was used in order to study the cointegration of variables. To check the hypothesis, were designated cointegration tests the Pesaran, Shin, and Smith. The following hypotheses for that tests were adopted:
Hypothesis 3 (H3).
Between the dependent variable, there is no cointegration.
Hypothesis 4 (H4).
Between the dependent variable and the independent variables is a cointegration.
To estimate the critical values of the regressors I(0) and I(1), a significance level of 5% was adopted in accordance with the procedure of Kripfganz and D. Schneider and P. Narayan [52,57]. The obtained values of the F statistics and the critical values are presented in the Table 3. If the value of the F statistics was greater than I(1), hypothesis 3 was rejected. In this case, a long-term relationship between the variables was assumed.

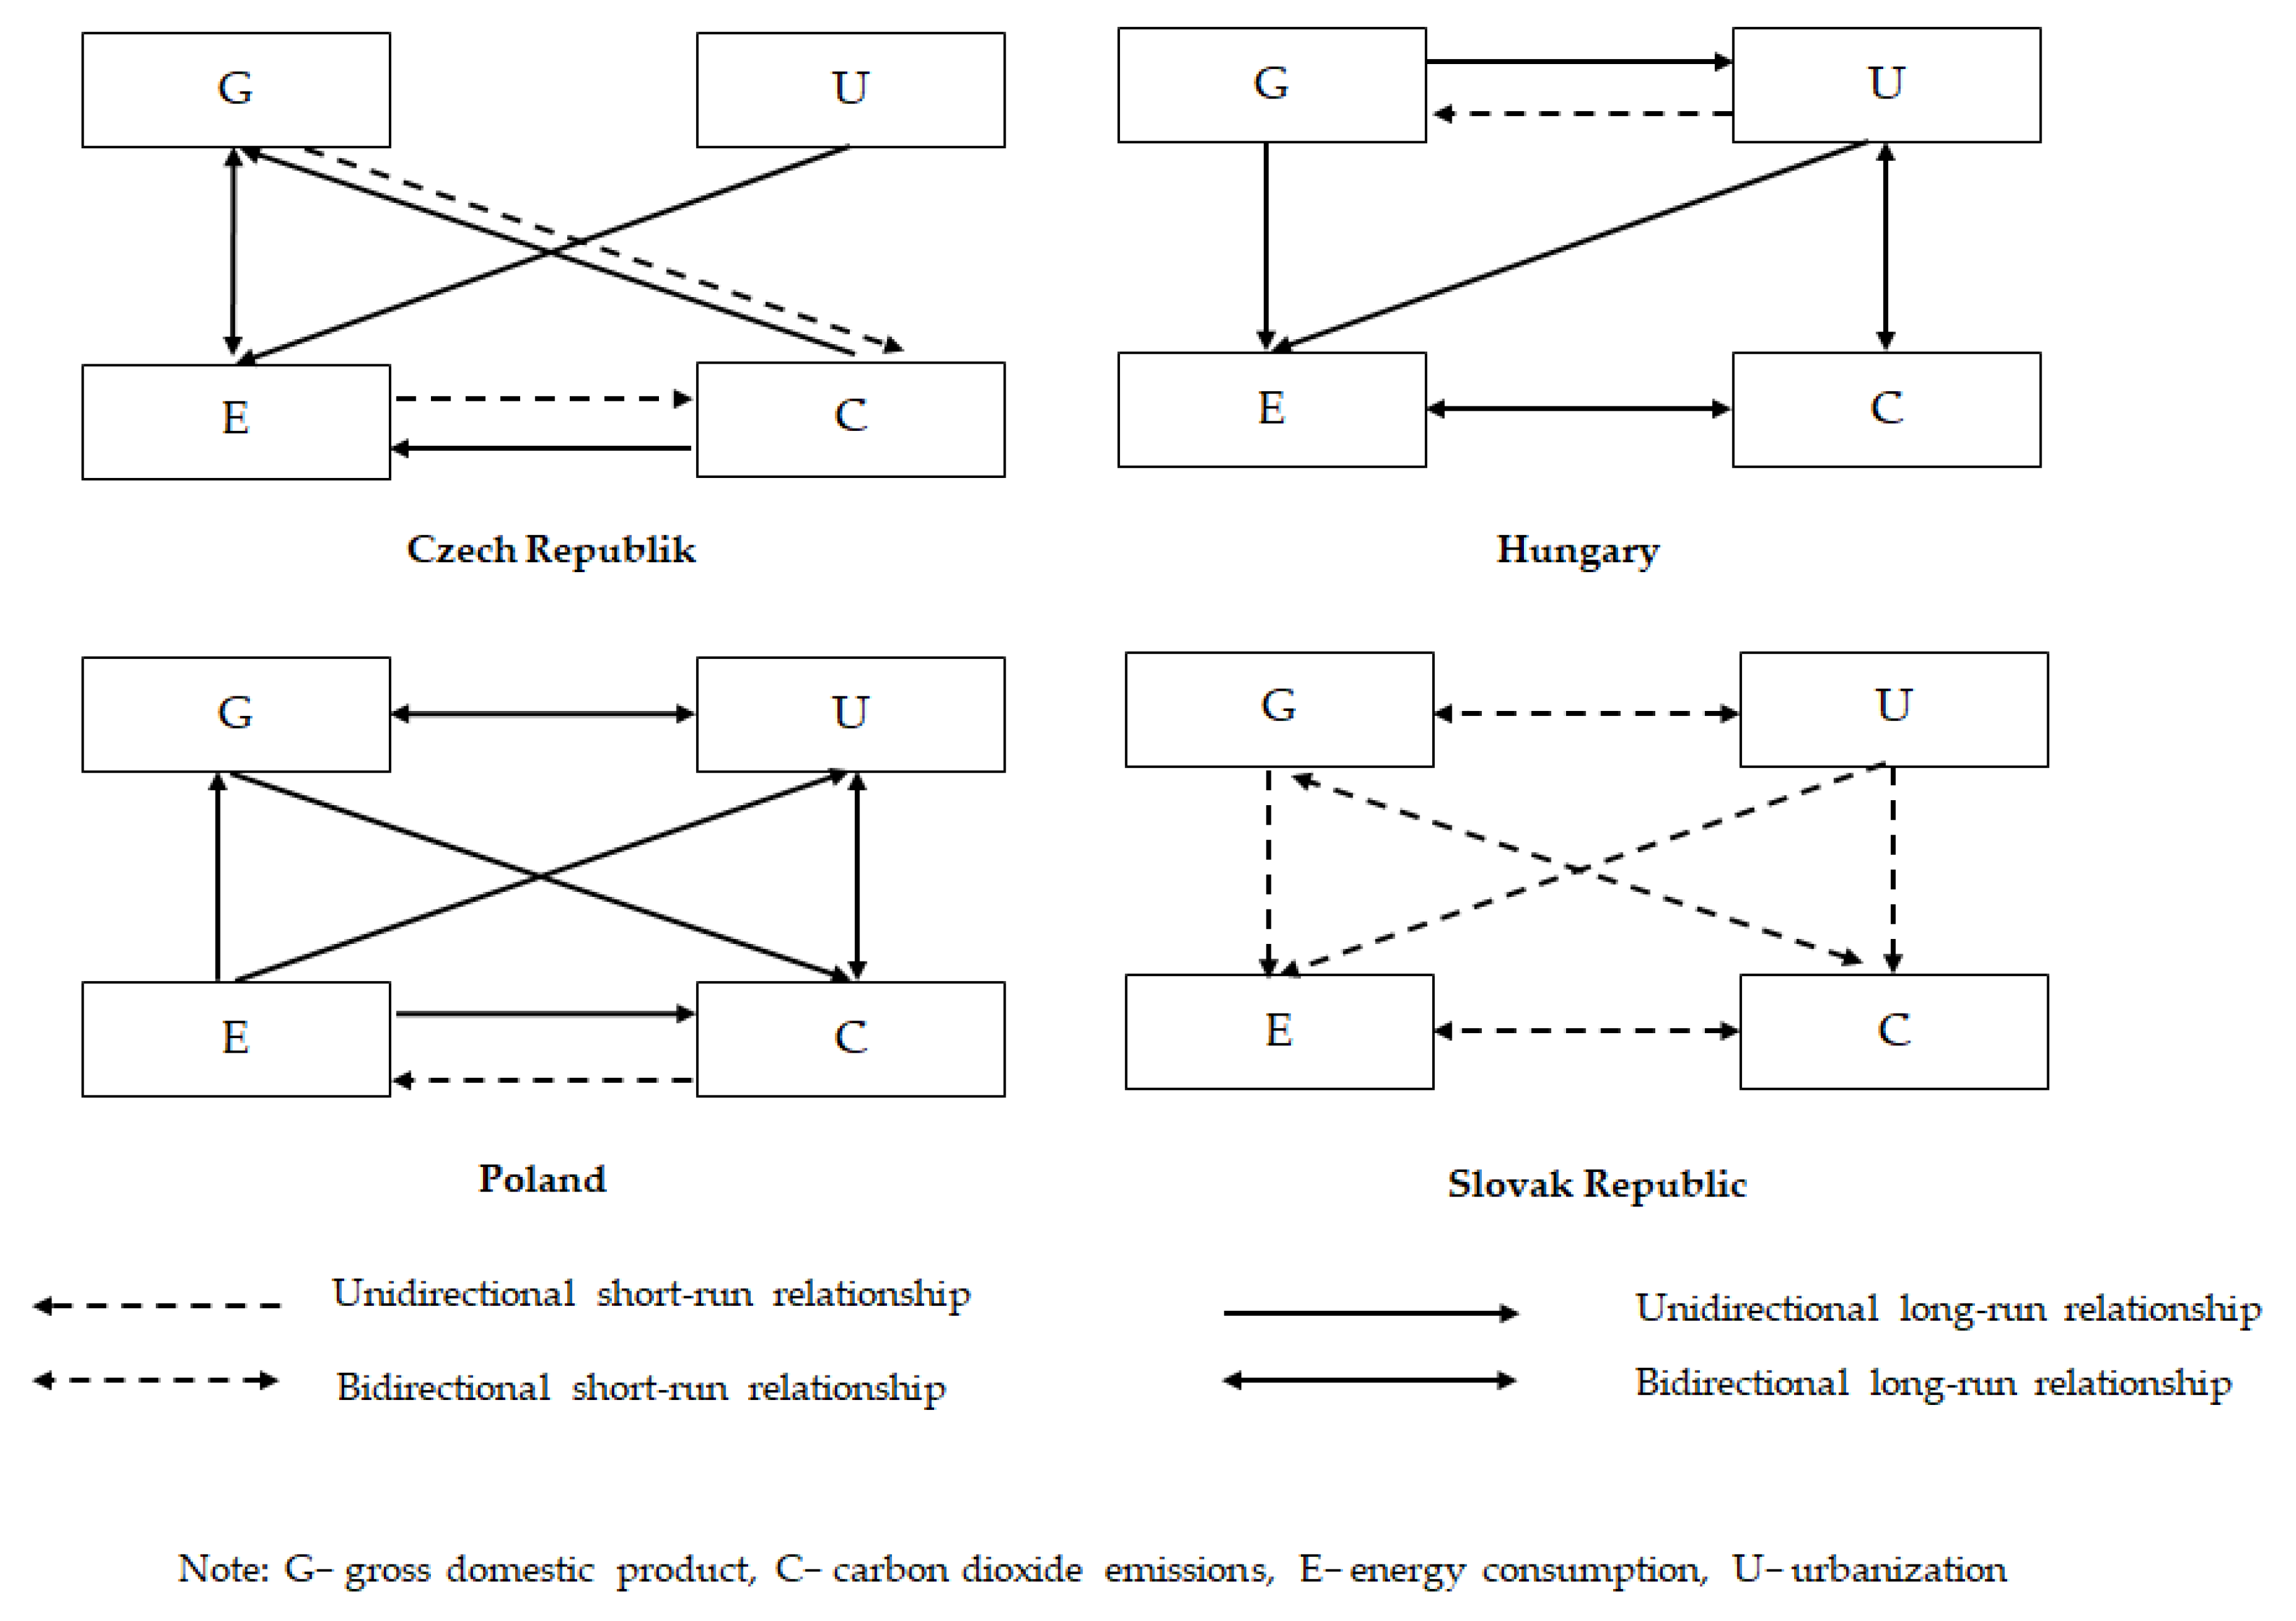
4.2. Results for Estimated Causal Relationship

As a result of the study, cointegration was demonstrated for some variables in data for Poland, the Czech Republic, and Hungary. The tests showed the existence of a long-term relationship for dependent variables, such as: l_E, l_G, l_U, Polish: C, l_G, L_U, and Hungary: C, l_E, l_U. The conducted test did not confirm co-integration in Slovakia, which gives the possibility to conclude that there are only short-term relations. Short-term models presented in the Table 4 were also estimated.
In the short-term, we confirmed the dependency for the Slovakia for GDP level per capita and energy consumption (bidirectional) and unidirectional for GDP per capita (Czech Republic), urbanization (Slovakia), energy consumption (Czech Republic), and CO2 emissions (Poland).
The next part of the study required the estimation of long-term relationships between individual variables for every country. The presence and direction of the causal relationship between: GDP per capita, energy consumption per capita, CO2 emissions, and the level of urbanization were checked. The long-term relationship was investigated within the ECM error correction model (Table 5).
The long-term urbanization level was influenced by variables for Hungary (CO2 emissions and GDP per capita) and Poland (energy consumption, CO2 emissions, and GDP per capita). Additionally, a bidirectional relationship was confirmed for the variables GDP per capita (Poland, Czech Republic), and in Hungary for the urbanization. Unidirectional relationships in long-term were confirmed for GDP per capita and the level of CO2 emissions (Poland), urbanization and energy consumed per capita (Czech Republic, Hungary), and the energy consumption per capita and level of CO2 emissions (Czech Republic, Poland). It was not long-term causality could be determined for the GDP per capita for Slovakia and Hungary. No long-term relationships were found for the other variables for Slovakia.
The ECT coefficient (Error Correction Term—coefficient of stable long-run relationship) for Poland was −0.34, which suggested the model’s convergence in the long-term equilibrium. ECT is 34%, which shows the speed of the normalization. This sets up that the GDP per capita converge to the long-term equilibrium by 34% in one period with the speed adjustment via the l_E and l_U.
The ECT coefficient for the Czech Republic was assessed at −0.98. This means that economic growth converges to the long-term equilibrium by 98% in one period with the speed adjustment via the l_E and C. The results obtained for the l_CZ_U variable indicate that despite the significant ECT parameter, there was no relationship among the indicated dependent variable and the independent variables in the long term. At the same time, GDP per capita influenced the variable l_E (Czech Republic and Hungary), C (Poland), and l_U (Poland, Hungary) in the long term. The long-term C variable was influenced by: Hungary: level of energy consumption (l_E) and level of urbanization (l_U).
The necessary diagnostic tests were conducted for all estimated models. The obtained results were positive, and the developed models were stable. Detailed data on the tests are presented in Table 6.

5. Discussion

All relationships in short and long term were presented in the Figure 5. The results of research show opposite interaction of variables in the Visegrad countries. A long-term (bidirectional) cointegration relationship for Poland was confirmed between the level of urbanization and GDP per capita. The unidirectional relationship for those variables was also confirmed for the Czech Republic. In addition, the research also detected long-run a bidirectional relationship between urbanization and CO2 emissions in Poland and Hungary.
Additionally, long-term relationships were also found between energy consumption and the level of CO2 emissions; in the case of Hungary, it was a bidirectional relationship. For the indicated variables, a one-way relationship was also confirmed for Poland and the Czech Republic. The research also confirmed long-term relationships between the level of energy consumption and economic growth expressed as GDP per capita. A bidirectional relationship was confirmed for the Czech Republic, and a unidirectional relationship for Hungary and Poland. This finding corresponds with those of Raggad et al. [58] who conducted a study for Saudi Arabia and Abbasi et al. [59] for research from Pakistan.
Going back to the hypotheses formulated in the introduction, hypothesis 1 was confirmed in the case of the Czech Republic, Hungary and Poland. The conducted study confirmed in these countries a long-run relationship between the level of GDP per capita, CO2 emissions per capita, energy consumption per capita and the level of urbanization has been demonstrated. No causal relationship from a long-run perspective was found between some of the variables.
In a short period in Poland, the level of CO2 emissions affects the level of energy consumed. The relationship in the opposite direction occurred in the Czech Republic. For Slovakia, there was a two-way relationship between the indicated variables. For the Czech Republic, a short-term relationship was also shown between economic growth and CO2 emission. For Hungary, there was a short-term relationship between urbanization and economic growth. Obtained observations confirm hypothesis 2.
Additionally, no short-term relationship was confirmed in the case of Slovak Republic. In the case of this country, due to the lack of long-term dependence with, we rejected hypothesis 1 and 2e only confirmed hypothesis 2. The results obtained are consistent with Bosah et al. [60], Pata [61] and Eva Litavcová et al. [38].
Due to the research objective of the article was to investigate the long-term between CO2 emissions, energy consumption, economic growth (GDP per capita) and urbanization in the V4 countries, we think that the obtained results allowed for its realization. The results of the conducted study indicate varied relationships between the analyzed variables in individual V4 countries. These countries, despite some similarities, such as dynamic economic growth and high CO2 emissions, compared to the European Union, have different social and economic structures. Therefore, we assumed that this results in different results for individual countries.
Similar to other studies, this study has its limitations. First, the study was conducted only for the V4 countries. In future studies, it is worth considering expanding the research group to the countries of the so-called Three Seas Initiative for a more in-depth analysis of the conditions in Central Europe. Second, in subsequent studies, it would be recommended to include additional variables in the model, such as foreign trade and direct investment. It is also worth continuing to expand the methodological apparatus and look for new research methods in future research.

6. Conclusions

To conclude, the governments of the V4 countries, in connection with the implementation of the EU climate policy, are trying to reduce energy consumption, primarily from fossil fuels. It manifests itself mainly through the development of the infrastructure of ecological collective transport in cities and suburban areas. This type of innovative financial projects from the European Union structural funds may result in lower energy consumption by individual recipients in cities and decrease CO2 emissions in the long time. It is also worth noting that one of the countries of the Visegrad Group, Poland, is at the forefront in terms of the most polluted air in urban areas in the world. Here, too, you can see changes in the state policy, which focuses on the use of the elimination of coal-fired individual heating sources and the promotion of public transport in urban areas.
The results suggest that in the Czech Republic, in the long term, the pace of economic growth was influenced by variable energy consumption, but also that economic growth had an impact on the level of energy consumption; there was a bidirectional relationship. The increase in the level of energy consumption was determined by the increase in the level of CO2 emissions in the long term, but, at the same time, in the short term, both economic growth and the level of energy used were the cause of CO2 emissions. Therefore, a policy of limiting CO2 emissions would be advisable through modern technologies that reduce the degradation of the natural environment (decarbonization of the economy), and at the same time contribute to more efficient energy production.
Further analysis shows that for Hungary there was a long-term bidirectional causal relationship between energy consumption and CO2 emissions and energy consumption. Economic growth, in turn, was the cause of energy consumption and the level of urbanization. At the same time, the level of urbanization determined energy consumption, and the level of urbanization contributed to economic growth in the short term. In this regard, in the long term, it would be important to pursue an appropriate urban development policy, considering the pace of urbanization and decarbonization and a policy of sustainable energy consumption.
In Poland, in the short term, CO2 emissions led to an increase in energy consumption. Considering that the polish economy is dependent on the energy from coal, decarbonization will be expensive and complicated. Due to natural conditions, the development of renewable energy sources is complicated. Annually, natural gas and oil deposits are small, and geopolitical factors, including the ongoing war in Ukraine and the embargo on Russian coal, are big challenges. Compared to other V4 countries, there is no nuclear power in Poland. Changes in energy technologies in the long time, it can be positive impact on both decarbonization and economic growth.
In the case of Slovakia, we were not able find any relationship between the studied variables in long period, as in previous studies [8]. This is since more than half of the energy in this country comes from nuclear power plants and more than 24% from renewable sources.
It is recommended that the V4 countries increase renewable and ecological energy sources, and increase savings in the area of both individual and industrial consumption. They should also develop new models of urban development because the structure of the urban tissue inherited from the communist era does not always favor the achievement of environmental goals. Perhaps most large urban centers will have to expand upwards by increasing the height of buildings, thus limiting the amount of space between strategic city points. Already today, the policy of “concreting” squares and walking areas is often criticized by residents and various organizations.
It should be noted that the objectives of energy policy are part of the overall objectives of the European Union and should not be considered in isolation, but in conjunction with their economic impact. The effect of urbanization on the natural environment is continuous and has an impact both in the short and long time. Therefore, both strategic and operational planning should be used when selecting and implementing climate policy.
Urbanization is the result of economic development, but it also affects this economic growth thanks to increasing real disposable income. In the case of V4 countries, considering global trends, urbanization processes can increase. Therefore, it is already important to plan urban development areas in which it will be possible to apply solutions that reduce CO2 emissions. The research conducted at the same time shows that the process of urbanization should progress because it is strategic from the viewpoint of economic growth, and thus, the well-being of the population. However, it must not be forgotten that it should be performed in a controlled and planned way. In this case, it will be possible to reduce energy consumption and reduce air pollution without hindering economic development.

Supplementary Materials

The following supporting information can be downloaded at: https://www.mdpi.com/article/10.3390/en15249647/s1.

Author Contributions

Conceptualization, data curation, writing—original draft preparation, supervision, J.M. and B.S.; methodology, J.M.; software, validation, formal analysis, J.M and B.S.; investigation, resources, writing—review and editing, J.M. and B.S.; visualization, B.S. All authors have read and agreed to the published version of the manuscript.

Funding

This research received no external funding.

Institutional Review Board Statement

Not applicable.

Informed Consent Statement

Not applicable.

Data Availability Statement

The data presented in this study are openly available at databases: OECD (GDP per capita, energy consumption, urbanization) https://data.oecd.org/ (accessed on 10 November 2022) and UNFCC (CO2 emission) https://di.unfccc.int (accessed on 10 November 2022). Data is contained within the Supplementary Materials.

Conflicts of Interest

The authors declare no conflict of interest.

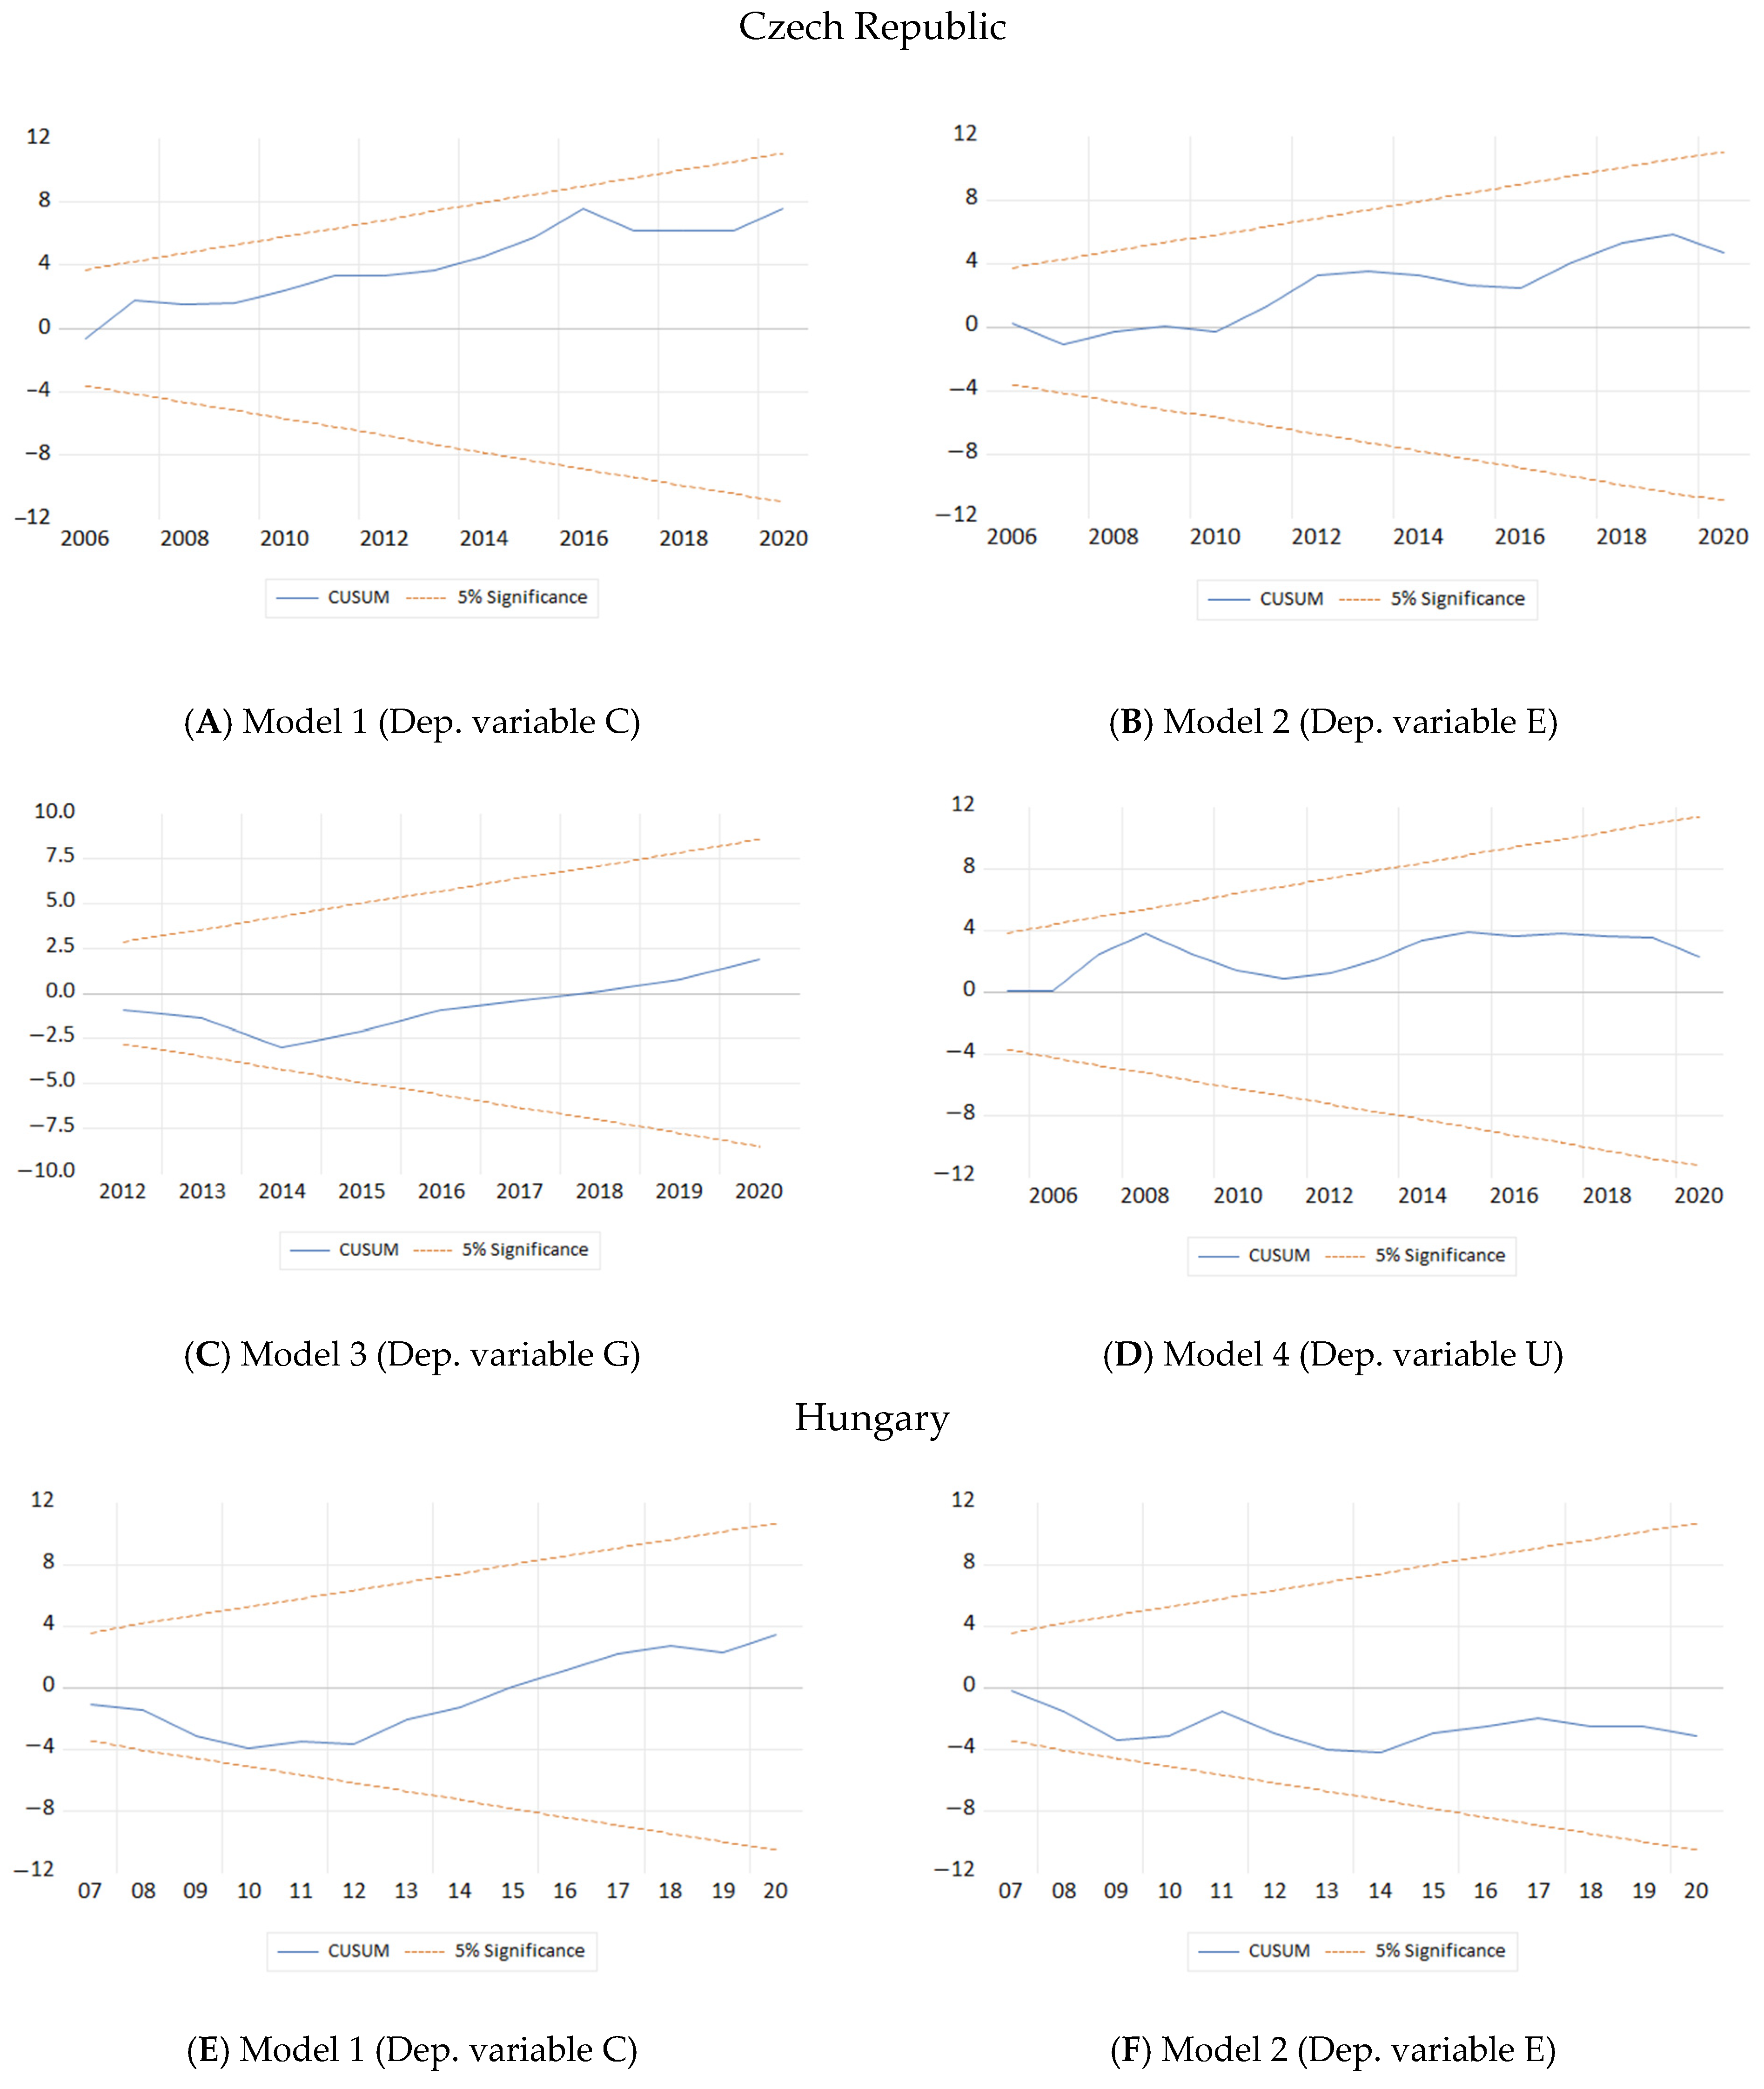
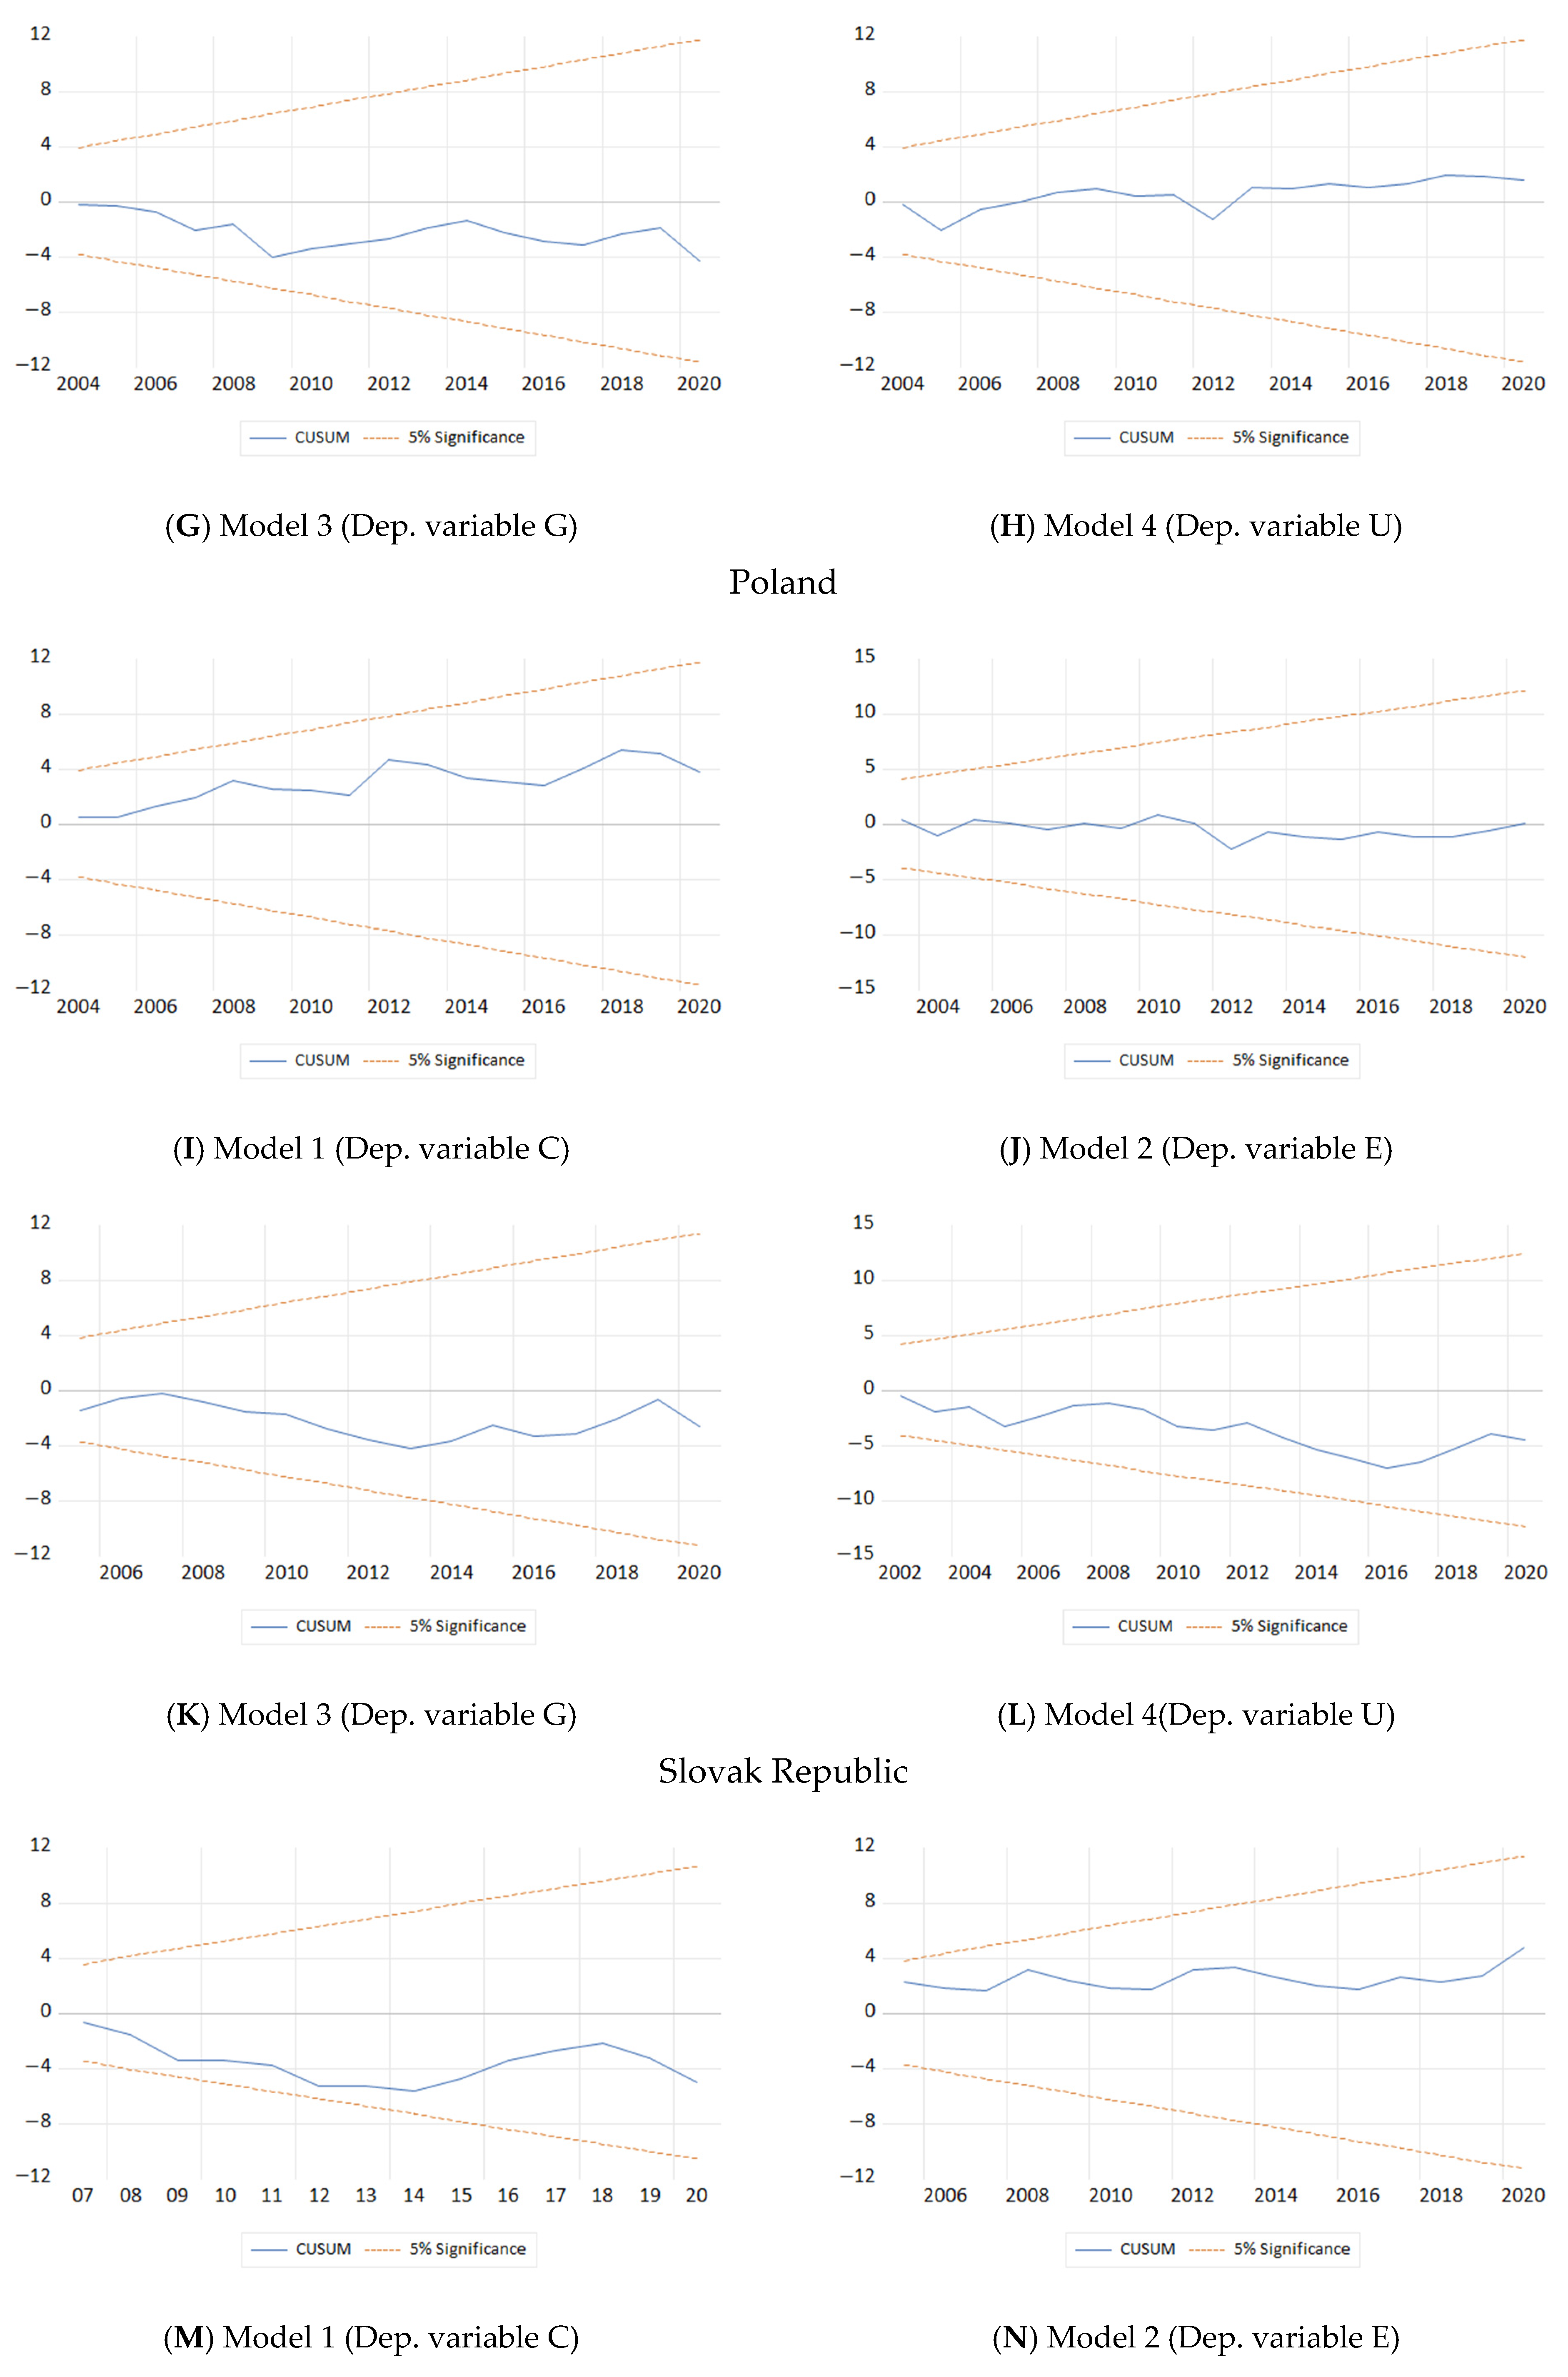
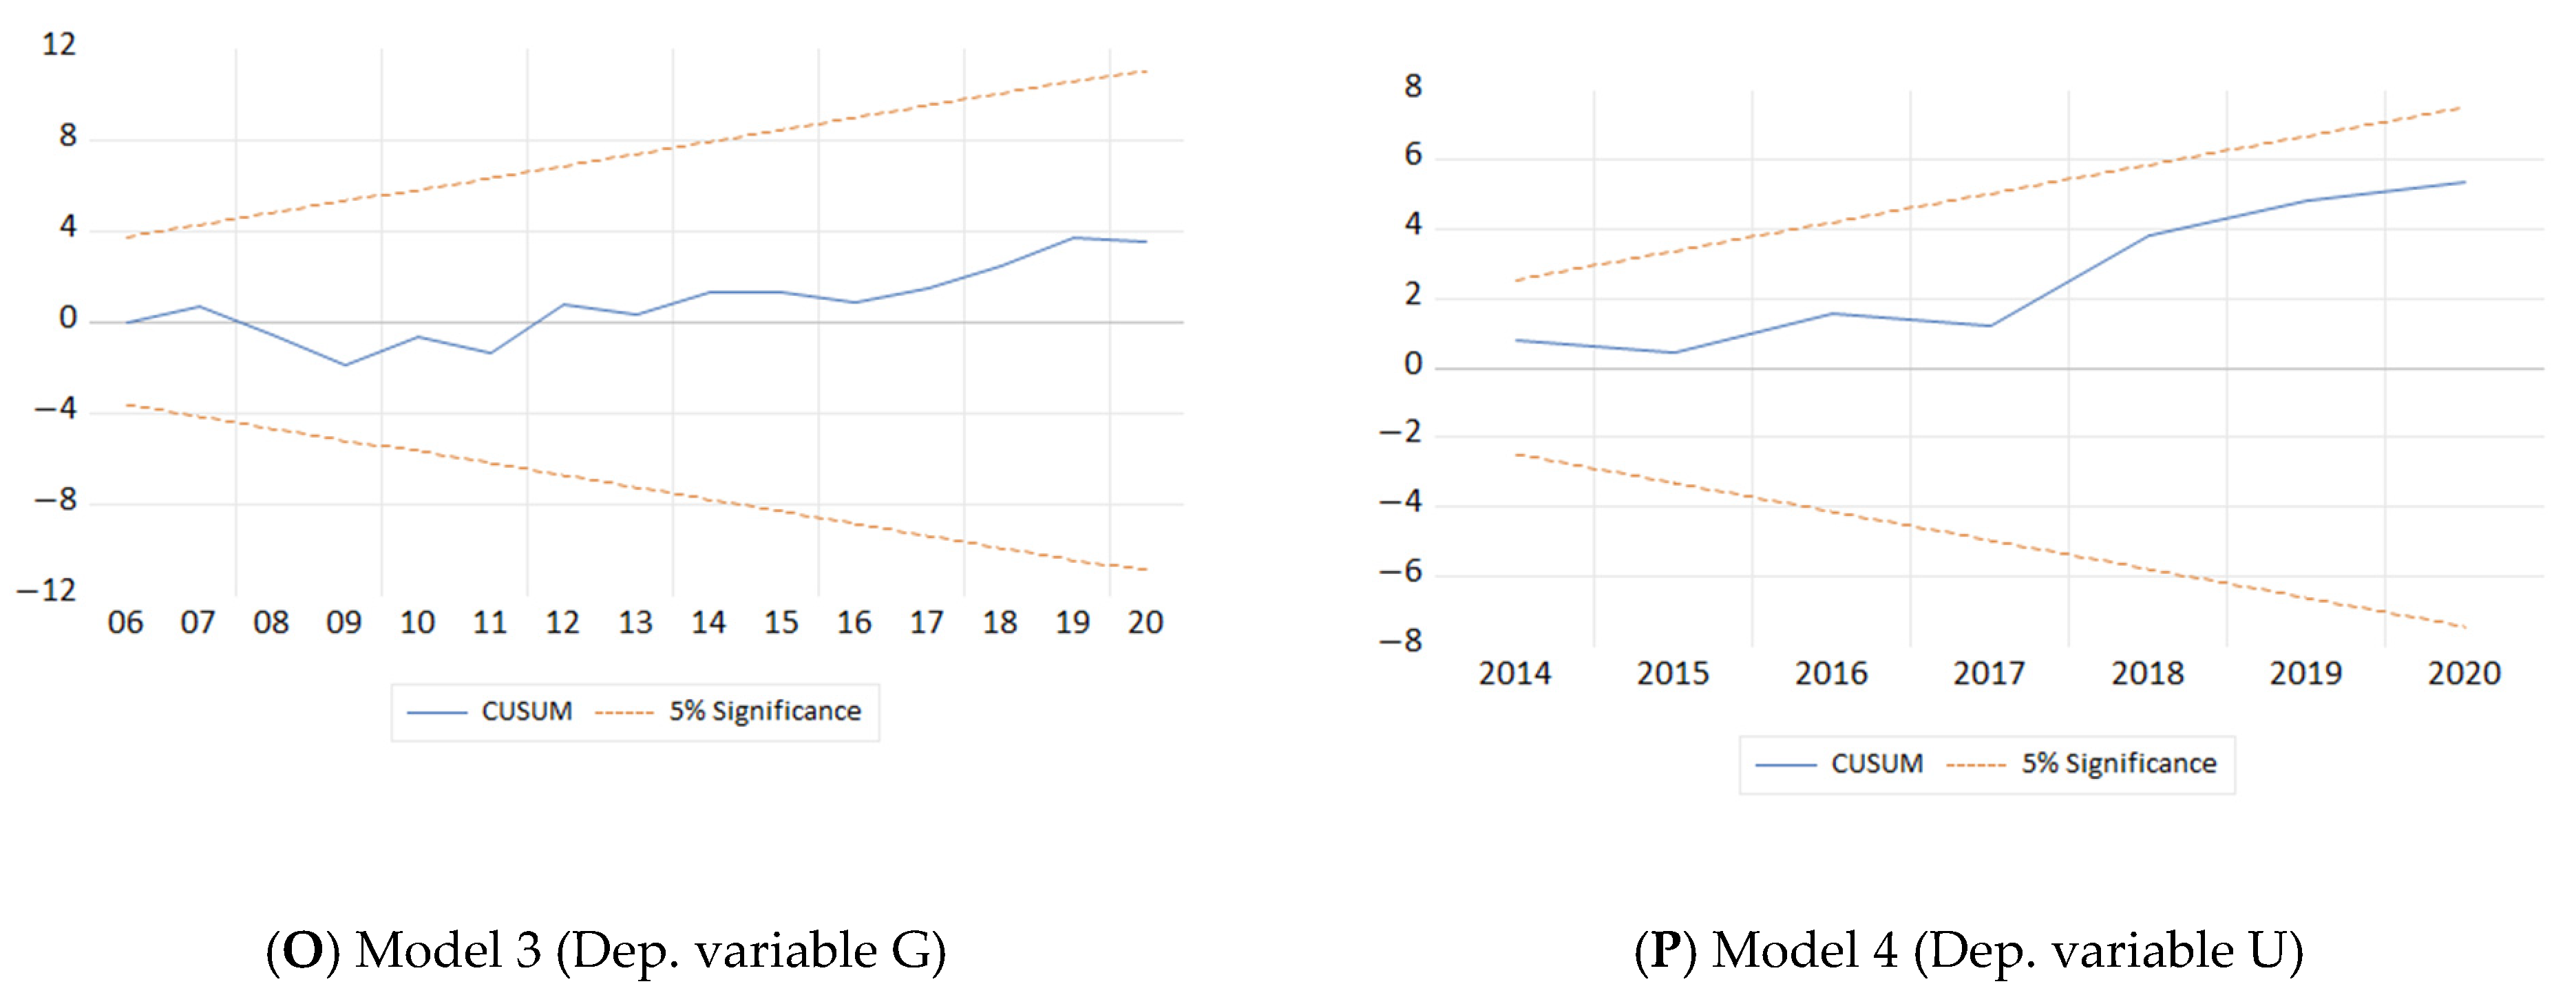
Appendix A. CUSUM Result for the Estimated Models

Energies 15 09647 g0a1aEnergies 15 09647 g0a1bEnergies 15 09647 g0a1c

References

  1. Motta, P. Urbanization and Sustainability after the COVID-19 Pandemic. Int. J. Soc. Qual. 2020, 10, 100102. [Google Scholar] [CrossRef]
  2. Księżopolski, K.; Maśloch, G. Time Delay Approach to Renewable Energy in the Visegrad Group. Energies 2021, 14, 1928. [Google Scholar] [CrossRef]
  3. Kochanek, E. The Energy Transition in the Visegrad Group Countries. Energies 2021, 14, 2212. [Google Scholar] [CrossRef]
  4. Wawrzyniak, D. CO2 Emissions in the Visegrad Group Countries and the European Union Climate Policy. Comp. Econ. Res. Central East. Eur. 2020, 23, 73–91. [Google Scholar] [CrossRef]
  5. Brodny, J.; Tutak, M. The comparative assessment of sustainable energy security in the Visegrad countries. A 10-year perspective. J. Clean. Prod. 2021, 317, 128427. [Google Scholar] [CrossRef]
  6. Zapletalová, V.; Komínková, M. Who is fighting against the EU’s energy and climate policy in the European Parliament? The contribution of the Visegrad Group. Energy Policy 2020, 139, 111326. [Google Scholar] [CrossRef]
  7. Bajan, B.; Łukasiewicz, J.; Mrówczyńska-Kamińska, A. Energy Consumption and Its Structures in Food Production Systems of the Visegrad Group Countries Compared with EU-15 Countries. Energies 2021, 14, 3945. [Google Scholar] [CrossRef]
  8. Myszczyszyn, J.; Suproń, B. Relationship among Economic Growth (GDP), Energy Consumption and Carbon Dioxide Emission: Evidence from V4 Countries. Energies 2021, 14, 7734. [Google Scholar] [CrossRef]
  9. Balado-Naves, R.; Baños-Pino, J.F.; Mayor, M. Do countries influence neighbouring pollution? A spatial analysis of the EKC for CO2 emissions. Energy Policy 2018, 123, 266–279. [Google Scholar] [CrossRef]
  10. Zaman, K.; Moemen, M.A.-E. Energy consumption, carbon dioxide emissions and economic development: Evaluating alternative and plausible environmental hypothesis for sustainable growth. Renew. Sustain. Energy Rev. 2017, 74, 1119–1130. [Google Scholar] [CrossRef]
  11. Wang, Z.; Jia, X. Analysis of energy consumption structure on CO2 emission and economic sustainable growth. Energy Rep. 2022, 8, 1667–1679. [Google Scholar] [CrossRef]
  12. Coondoo, D.; Dinda, S. Causality between income and emission: A country group-specific econometric analysis. Ecol. Econ. 2002, 40, 351–367. [Google Scholar] [CrossRef]
  13. Govindaraju, V.C.; Tang, C.F. The dynamic links between CO2 emissions, economic growth and coal consumption in China and India. Appl. Energy 2013, 104, 310–318. [Google Scholar] [CrossRef]
  14. Ghosh, S. Examining carbon emissions economic growth nexus for India: A multivariate cointegration approach. Energy Policy 2010, 38, 3008–3014. [Google Scholar] [CrossRef]
  15. Kasperowicz, R. Economic growth and CO2 emissions: The ECM analysis. J. Int. Stud. 2015, 8, 91–98. [Google Scholar] [CrossRef]
  16. Al-Mulali, U. Investigating the impact of nuclear energy consumption on GDP growth and CO2 emission: A panel data analysis. Prog. Nucl. Energy 2014, 73, 172–178. [Google Scholar] [CrossRef]
  17. Ajmi, A.N.; Hammoudeh, S.; Nguyen, D.K.; Sato, J.R. On the relationships between CO2 emissions, energy consumption and income: The importance of time variation. Energy Econ. 2015, 49, 629–638. [Google Scholar] [CrossRef]
  18. Pao, H.-T.; Tsai, C.-M. Multivariate Granger causality between CO2 emissions, energy consumption, FDI (foreign direct investment) and GDP (gross domestic product): Evidence from a panel of BRIC (Brazil, Russian Federation, India, and China) countries. Energy 2011, 36, 685–693. [Google Scholar] [CrossRef]
  19. Li, H.; Mu, H.; Zhang, M. Analysis of China’s energy consumption impact factors. Procedia Environ. Sci. 2011, 11, 824–830. [Google Scholar] [CrossRef] [Green Version]
  20. Krkošková, R. Causality between Energy Consumption and Economic Growth in the V4 Countries. Technol. Econ. Dev. Econ. 2021, 27, 900–920. [Google Scholar] [CrossRef]
  21. Wang, Q.; Zhao, C. Regional difference and driving factors of industrial carbon emissions performance in China. Alex. Eng. J. 2020, 60, 301–309. [Google Scholar] [CrossRef]
  22. Khan, M.K.; Rehan, M. The relationship between energy consumption, economic growth and carbon dioxide emissions in Pakistan. Financial Innov. 2020, 6, 1. [Google Scholar] [CrossRef] [Green Version]
  23. Behera, S.R.; Dash, D.P. The effect of urbanization, energy consumption, and foreign direct investment on the carbon dioxide emission in the SSEA (South and Southeast Asian) region. Renew. Sustain. Energy Rev. 2017, 70, 96–106. [Google Scholar] [CrossRef]
  24. Abbasi, M.A.; Parveen, S.; Khan, S.; Kamal, M.A. Urbanization and energy consumption effects on carbon dioxide emissions: Evidence from Asian-8 countries using panel data analysis. Environ. Sci. Pollut. Res. 2020, 27, 18029–18043. [Google Scholar] [CrossRef] [PubMed]
  25. Ali, H.S.; Abdul-Rahim, A.; Ribadu, M.B. Urbanization and carbon dioxide emissions in Singapore: Evidence from the ARDL approach. Environ. Sci. Pollut. Res. 2017, 24, 1967–1974. [Google Scholar] [CrossRef]
  26. Wang, W.-Z.; Liu, L.-C.; Liao, H.; Wei, Y.-M. Impacts of urbanization on carbon emissions: An empirical analysis from OECD countries. Energy Policy 2021, 151, 112171. [Google Scholar] [CrossRef]
  27. Shahbaz, M.; Lean, H.H. Does financial development increase energy consumption? The role of industrialization and urbanization in Tunisia. Energy Policy 2012, 40, 473–479. [Google Scholar] [CrossRef] [Green Version]
  28. Wang, Y.; Chen, L.; Kubota, J. The relationship between urbanization, energy use and carbon emissions: Evidence from a panel of Association of Southeast Asian Nations (ASEAN) countries. J. Clean. Prod. 2016, 112, 1368–1374. [Google Scholar] [CrossRef]
  29. Martínez-Zarzoso, I.; Maruotti, A. The impact of urbanization on CO2 emissions: Evidence from developing countries. Ecol. Econ. 2011, 70, 1344–1353. [Google Scholar] [CrossRef] [Green Version]
  30. Al-Mulali, U.; Fereidouni, H.G.; Lee, J.Y.; Sab, C.N.B.C. Exploring the relationship between urbanization, energy consumption, and CO2 emission in MENA countries. Renew. Sustain. Energy Rev. 2013, 23, 107–112. [Google Scholar] [CrossRef]
  31. Zhu, H.-M.; You, W.-H.; Zeng, Z.-F. Urbanization and CO2 emissions: A semi-parametric panel data analysis. Econ. Lett. 2012, 117, 848–850. [Google Scholar] [CrossRef]
  32. Sharma, S.S. Determinants of carbon dioxide emissions: Empirical evidence from 69 countries. Appl. Energy 2011, 88, 376–382. [Google Scholar] [CrossRef]
  33. Agung, P.; Hartono, D.; Awirya, A.A. Pengaruh Urbanisasi Terhadap Konsumsi Energi Dan Emisi CO2: Analisis Provinsi Di Indonesia. J. Ekon. Kuantitatif Terap. 2017, 10, 9–17. [Google Scholar]
  34. Zhou, Y.; Liu, Y. Does population have a larger impact on carbon dioxide emissions than income? Evidence from a cross-regional panel analysis in China. Appl. Energy 2016, 180, 800–809. [Google Scholar] [CrossRef]
  35. Lacka, I.; Myszczyszyn, J.; Golab, S.; Bedzik, B.; Suproń, B. Correlation between the Level of Economic Growth and Foreign Trade: The Case of the V4 Countries. Eur. Res. Stud. J. 2020, 23, 657–678. [Google Scholar] [CrossRef] [PubMed]
  36. Simionescu, M.; Wojciechowski, A.; Tomczyk, A.; Rabe, M. Revised Environmental Kuznets Curve for V4 Countries and Baltic States. Energies 2021, 14, 3302. [Google Scholar] [CrossRef]
  37. Odugbesan, J.A.; Rjoub, H. Relationship Among Economic Growth, Energy Consumption, CO2 Emission, and Urbanization: Evidence From MINT Countries. SAGE Open 2020, 10, 2158244020914648. [Google Scholar] [CrossRef] [Green Version]
  38. Litavcová, E.; Chovancová, J. Economic Development, CO2 Emissions and Energy Use Nexus-Evidence from the Danube Region Countries. Energies 2021, 14, 3165. [Google Scholar] [CrossRef]
  39. Tiba, S.; Omri, A. Literature survey on the relationships between energy, environment and economic growth. Renew. Sustain. Energy Rev. 2017, 69, 1129–1146. [Google Scholar] [CrossRef]
  40. Dogan, E.; Turkekul, B. CO2 emissions, real output, energy consumption, trade, urbanization and financial development: Testing the EKC hypothesis for the USA. Environ. Sci. Pollut. Res. 2015, 23, 1203–1213. [Google Scholar] [CrossRef]
  41. Anser, M.K. Impact of energy consumption and human activities on carbon emissions in Pakistan: Application of STIRPAT model. Environ. Sci. Pollut. Res. 2019, 26, 13453–13463. [Google Scholar] [CrossRef] [PubMed]
  42. Jones, D.W. How urbanization affects energy-use in developing countries. Energy Policy 1991, 19, 621–630. [Google Scholar] [CrossRef]
  43. Jones, G.W. Urbanization Issues in the Asian-Pacific Region. Asian-Pac. Econ. Lit. 1991, 5, 5–33. [Google Scholar] [CrossRef]
  44. Zhang, Y.-J.; Liu, Z.; Zhang, H.; Tan, T.-D. The impact of economic growth, industrial structure and urbanization on carbon emission intensity in China. Nat. Hazards 2014, 73, 579–595. [Google Scholar] [CrossRef]
  45. Balsalobre-Lorente, D.; Driha, O.M.; Halkos, G.; Mishra, S. Influence of growth and urbanization on CO 2 emissions: The moderating effect of foreign direct investment on energy use in BRICS. Sustain. Dev. 2021, 30, 227–240. [Google Scholar] [CrossRef]
  46. Azam, M.; Uddin, I.; Khan, S.; Tariq, M. Are globalization, urbanization, and energy consumption cause carbon emissions in SAARC region? New evidence from CS-ARDL approach. Environ. Sci. Pollut. Res. 2022, 29, 87746–87763. [Google Scholar] [CrossRef]
  47. Apergis, N.; Payne, J.E. Energy consumption and economic growth in Central America: Evidence from a panel cointegration and error correction model. Energy Econ. 2009, 31, 211–216. [Google Scholar] [CrossRef]
  48. Payne, J.E. Survey of the international evidence on the causal relationship between energy consumption and growth. J. Econ. Stud. 2010, 37, 53–95. [Google Scholar] [CrossRef]
  49. Lean, H.H.; Smyth, R. CO2 emissions, electricity consumption and output in ASEAN. Appl. Energy 2010, 87, 1858–1864. [Google Scholar] [CrossRef]
  50. Arouri, M.E.H.; Youssef, A.B.; M’Henni, H.; Rault, C. Energy consumption, economic growth and CO2 emissions in Middle East and North African countries. Energy Policy 2012, 45, 342–349. [Google Scholar] [CrossRef] [Green Version]
  51. Pesaran, M.H.; Shin, Y.; Smith, R.J. Bounds testing approaches to the analysis of level relationships. J. Appl. Econom. 2001, 16, 289–326. [Google Scholar] [CrossRef]
  52. Kripfganz, S.; Schneider, D.C. Response Surface Regressions for Critical Value Bounds and Approximate p-values in Equilibrium Correction Models1. Oxf. Bull. Econ. Stat. 2020, 82, 1456–1481. [Google Scholar] [CrossRef]
  53. Pesaran, M.H. Working With Microfit 4.0; Oxford University Press: Oxford, UK, 1997; p. 70. [Google Scholar]
  54. EViews: AutoRegressive Distributed Lag (ARDL) Estimation. Part 1—Theory. Available online: https://blog.eviews.com/2017/04/autoregressive-distributed-lag-ardl.html (accessed on 11 September 2022).
  55. Kwiatkowski, D.; Phillips, P.C.B.; Schmidt, P.; Shin, Y. Testing the null hypothesis of stationarity against the alternative of a unit root: How sure are we that economic time series have a unit root? J. Econom. 1992, 54, 159–178. [Google Scholar] [CrossRef]
  56. Dickey, D.A.; Fuller, W.A. Distribution of the Estimators for Autoregressive Time Series with a Unit Root. J. Am. Stat. Assoc. 1979, 74, 427–431. [Google Scholar] [CrossRef]
  57. Narayan, P.K. The saving and investment nexus for China: Evidence from cointegration tests. Appl. Econ. 2005, 37, 1979–1990. [Google Scholar] [CrossRef]
  58. Raggad, B. Carbon dioxide emissions, economic growth, energy use, and urbanization in Saudi Arabia: Evidence from the ARDL approach and impulse saturation break tests. Environ. Sci. Pollut. Res. 2018, 25, 14882–14898. [Google Scholar] [CrossRef]
  59. Abbasi, K.R.; Shahbaz, M.; Jiao, Z.; Tufail, M. How energy consumption, industrial growth, urbanization, and CO2 emissions affect economic growth in Pakistan? A novel dynamic ARDL simulations approach. Energy 2021, 221, 119793. [Google Scholar] [CrossRef]
  60. Bosah, C.P.; Li, S.; Ampofo, G.K.M.; Liu, K. Dynamic Nexus between Energy Consumption, Economic Growth, and Urbani-zation with Carbon Emission: Evidence from Panel PMG-ARDL Estimation. Environ. Sci. Pollut. Res. 2021, 28, 61201–61212. [Google Scholar] [CrossRef]
  61. Pata, U.K. Renewable energy consumption, urbanization, financial development, income and CO2 emissions in Turkey: Testing EKC hypothesis with structural breaks. J. Clean. Prod. 2018, 187, 770–779. [Google Scholar] [CrossRef]
Figure 1. Energy consumption per capita in the V4 countries in 1996–2020 (in the thousands kg of oil equivalent).
Energies 15 09647 g001
Figure 2. GDP per capita in the V4 countries in 1996–2020 (in the thousands USD).
Energies 15 09647 g002
Figure 3. CO2 emissions per capita in the V4 countries in 1996–2020 (metric tons per capita).
Energies 15 09647 g003
Figure 4. Urbanization in the V4 countries in 1996–2020 (normalized data).
Energies 15 09647 g004
Figure 5. Summary of the obtained relations between the examined variables.
Energies 15 09647 g005
Table 1. Descriptive statistics.
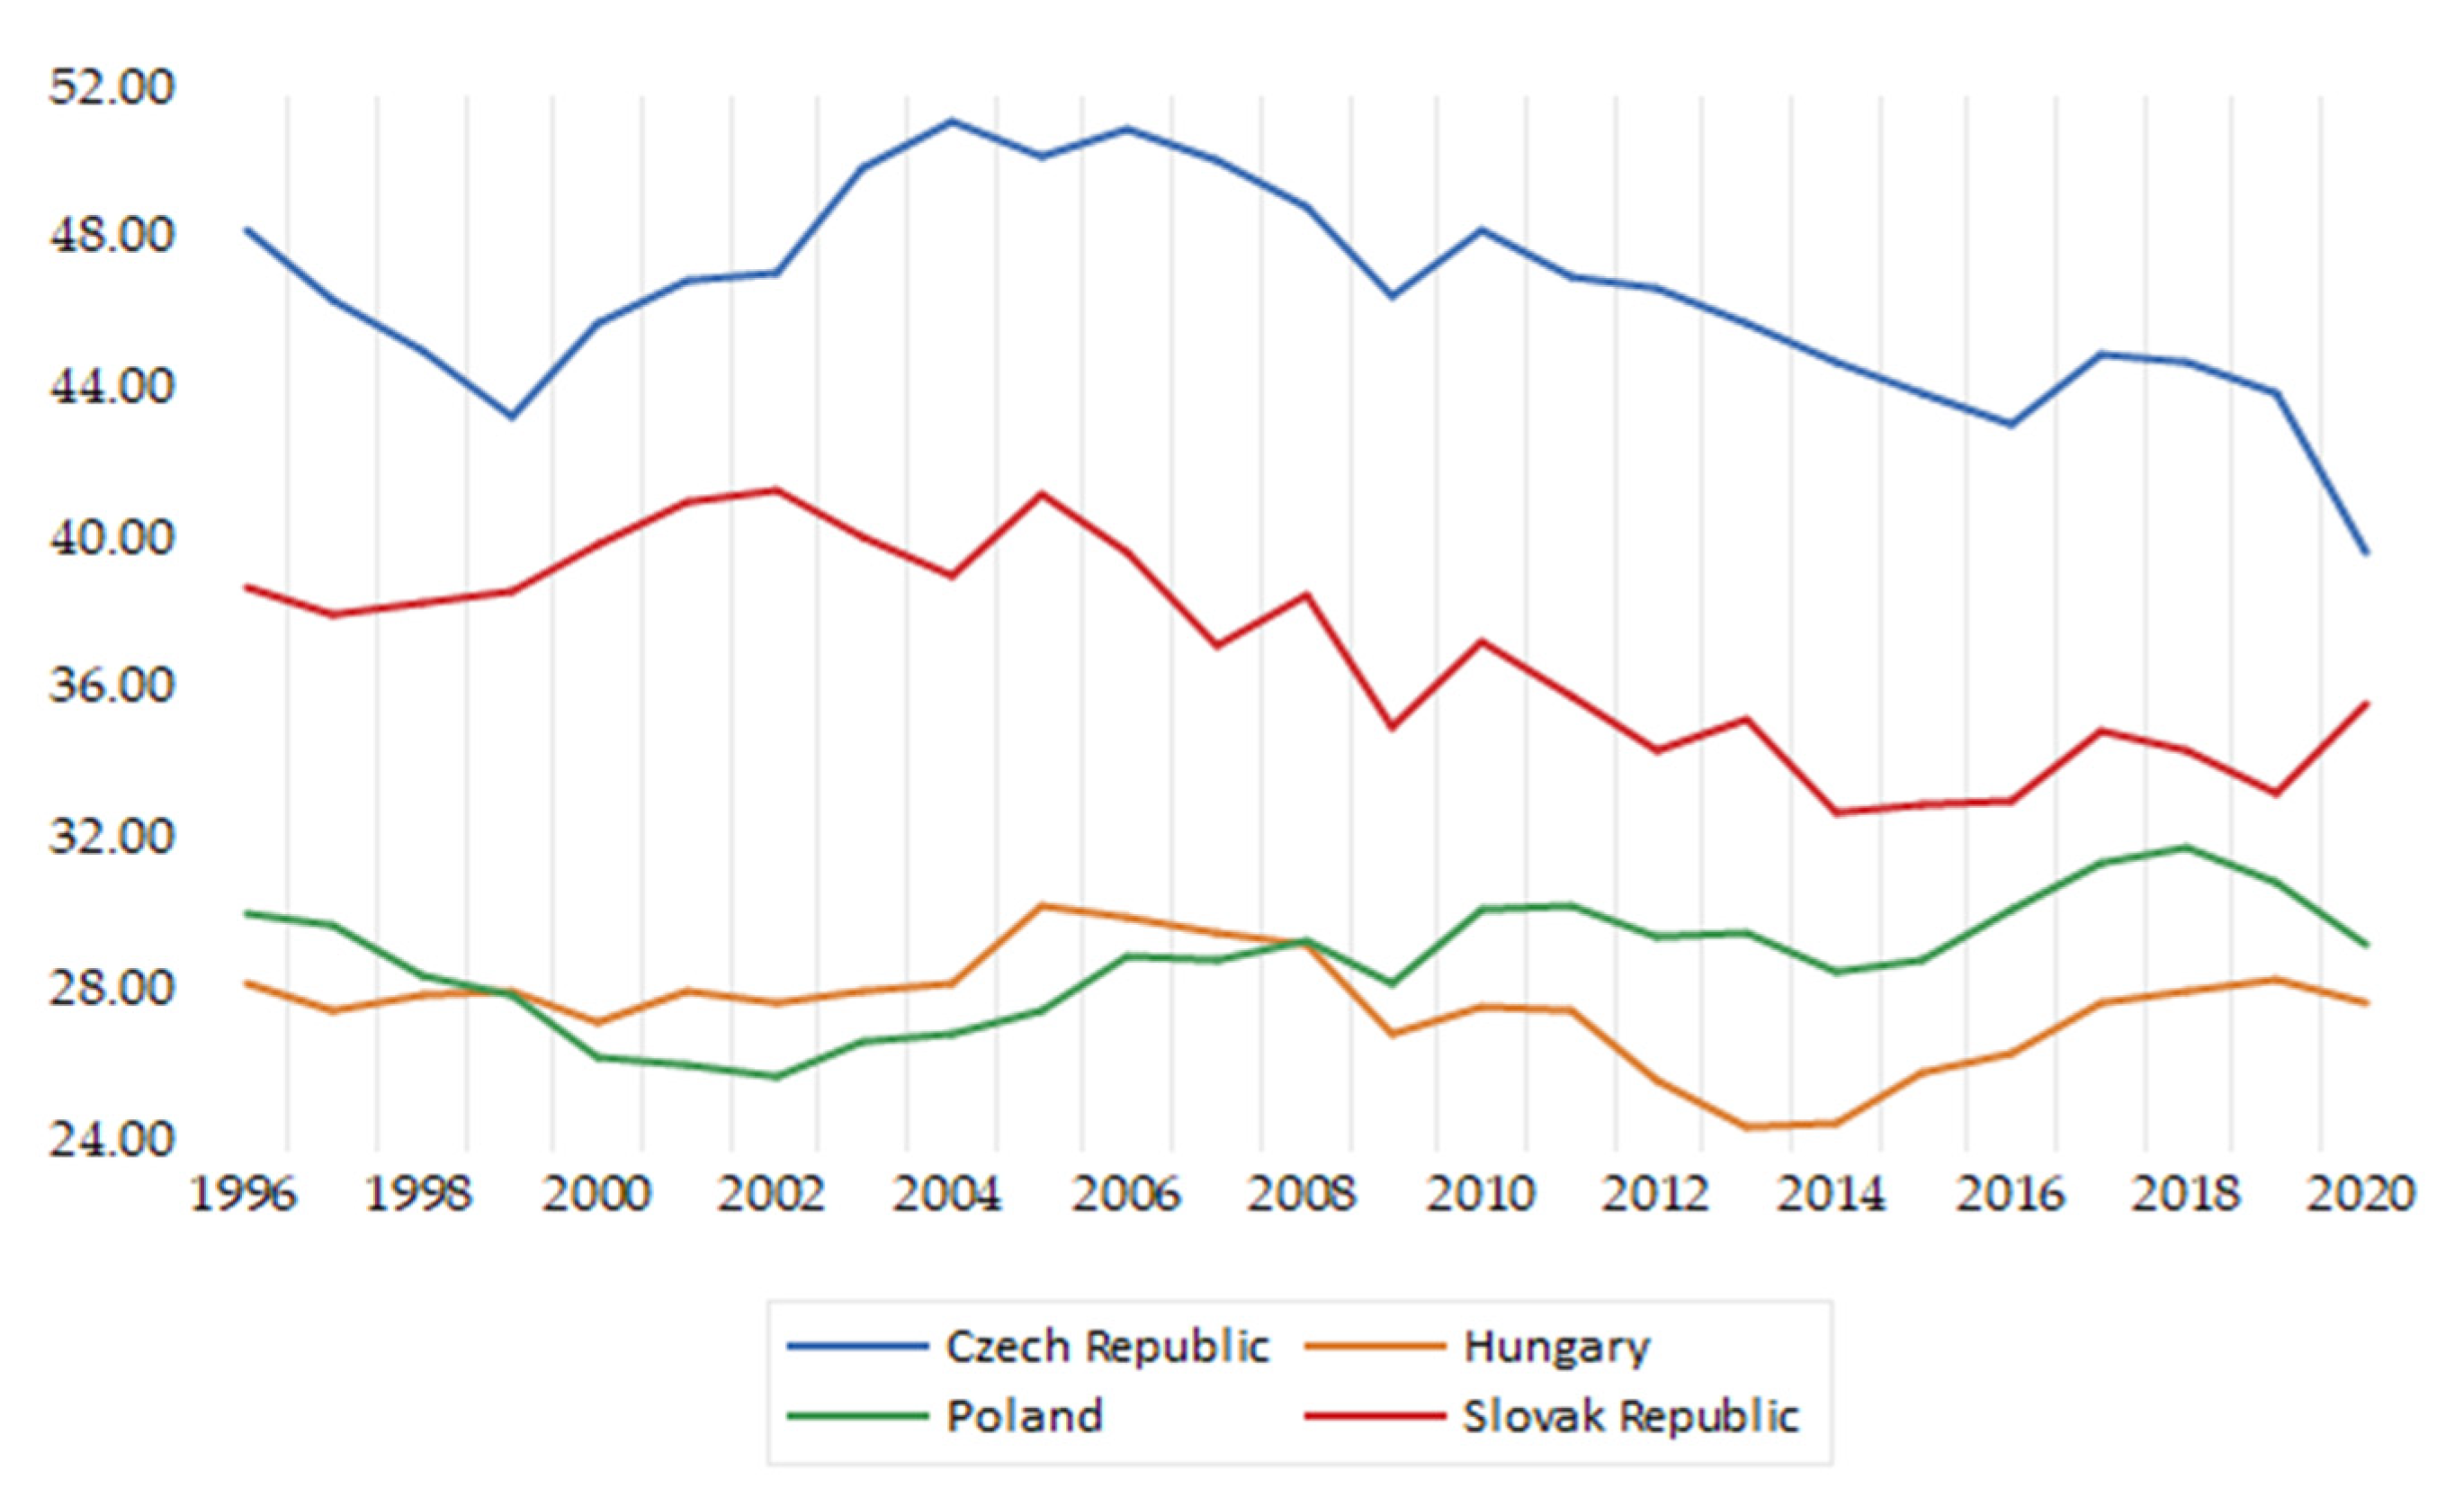
Energy Consumption (kg of oil equivalent per capita)
CountryNMeanMedianMaximumMinimumStd. Dev.
Czech Republic2546,714.9946,703.2451,297.2839,882.982781.04
Hungary2527,783.2527,900.6030,463.1424,560.781453.56
Poland2529,011.1829,085.2931,976.2525,955.011636.17
Slovak Republic2537,259.4937,506.6441,549.6332,904.992780.75
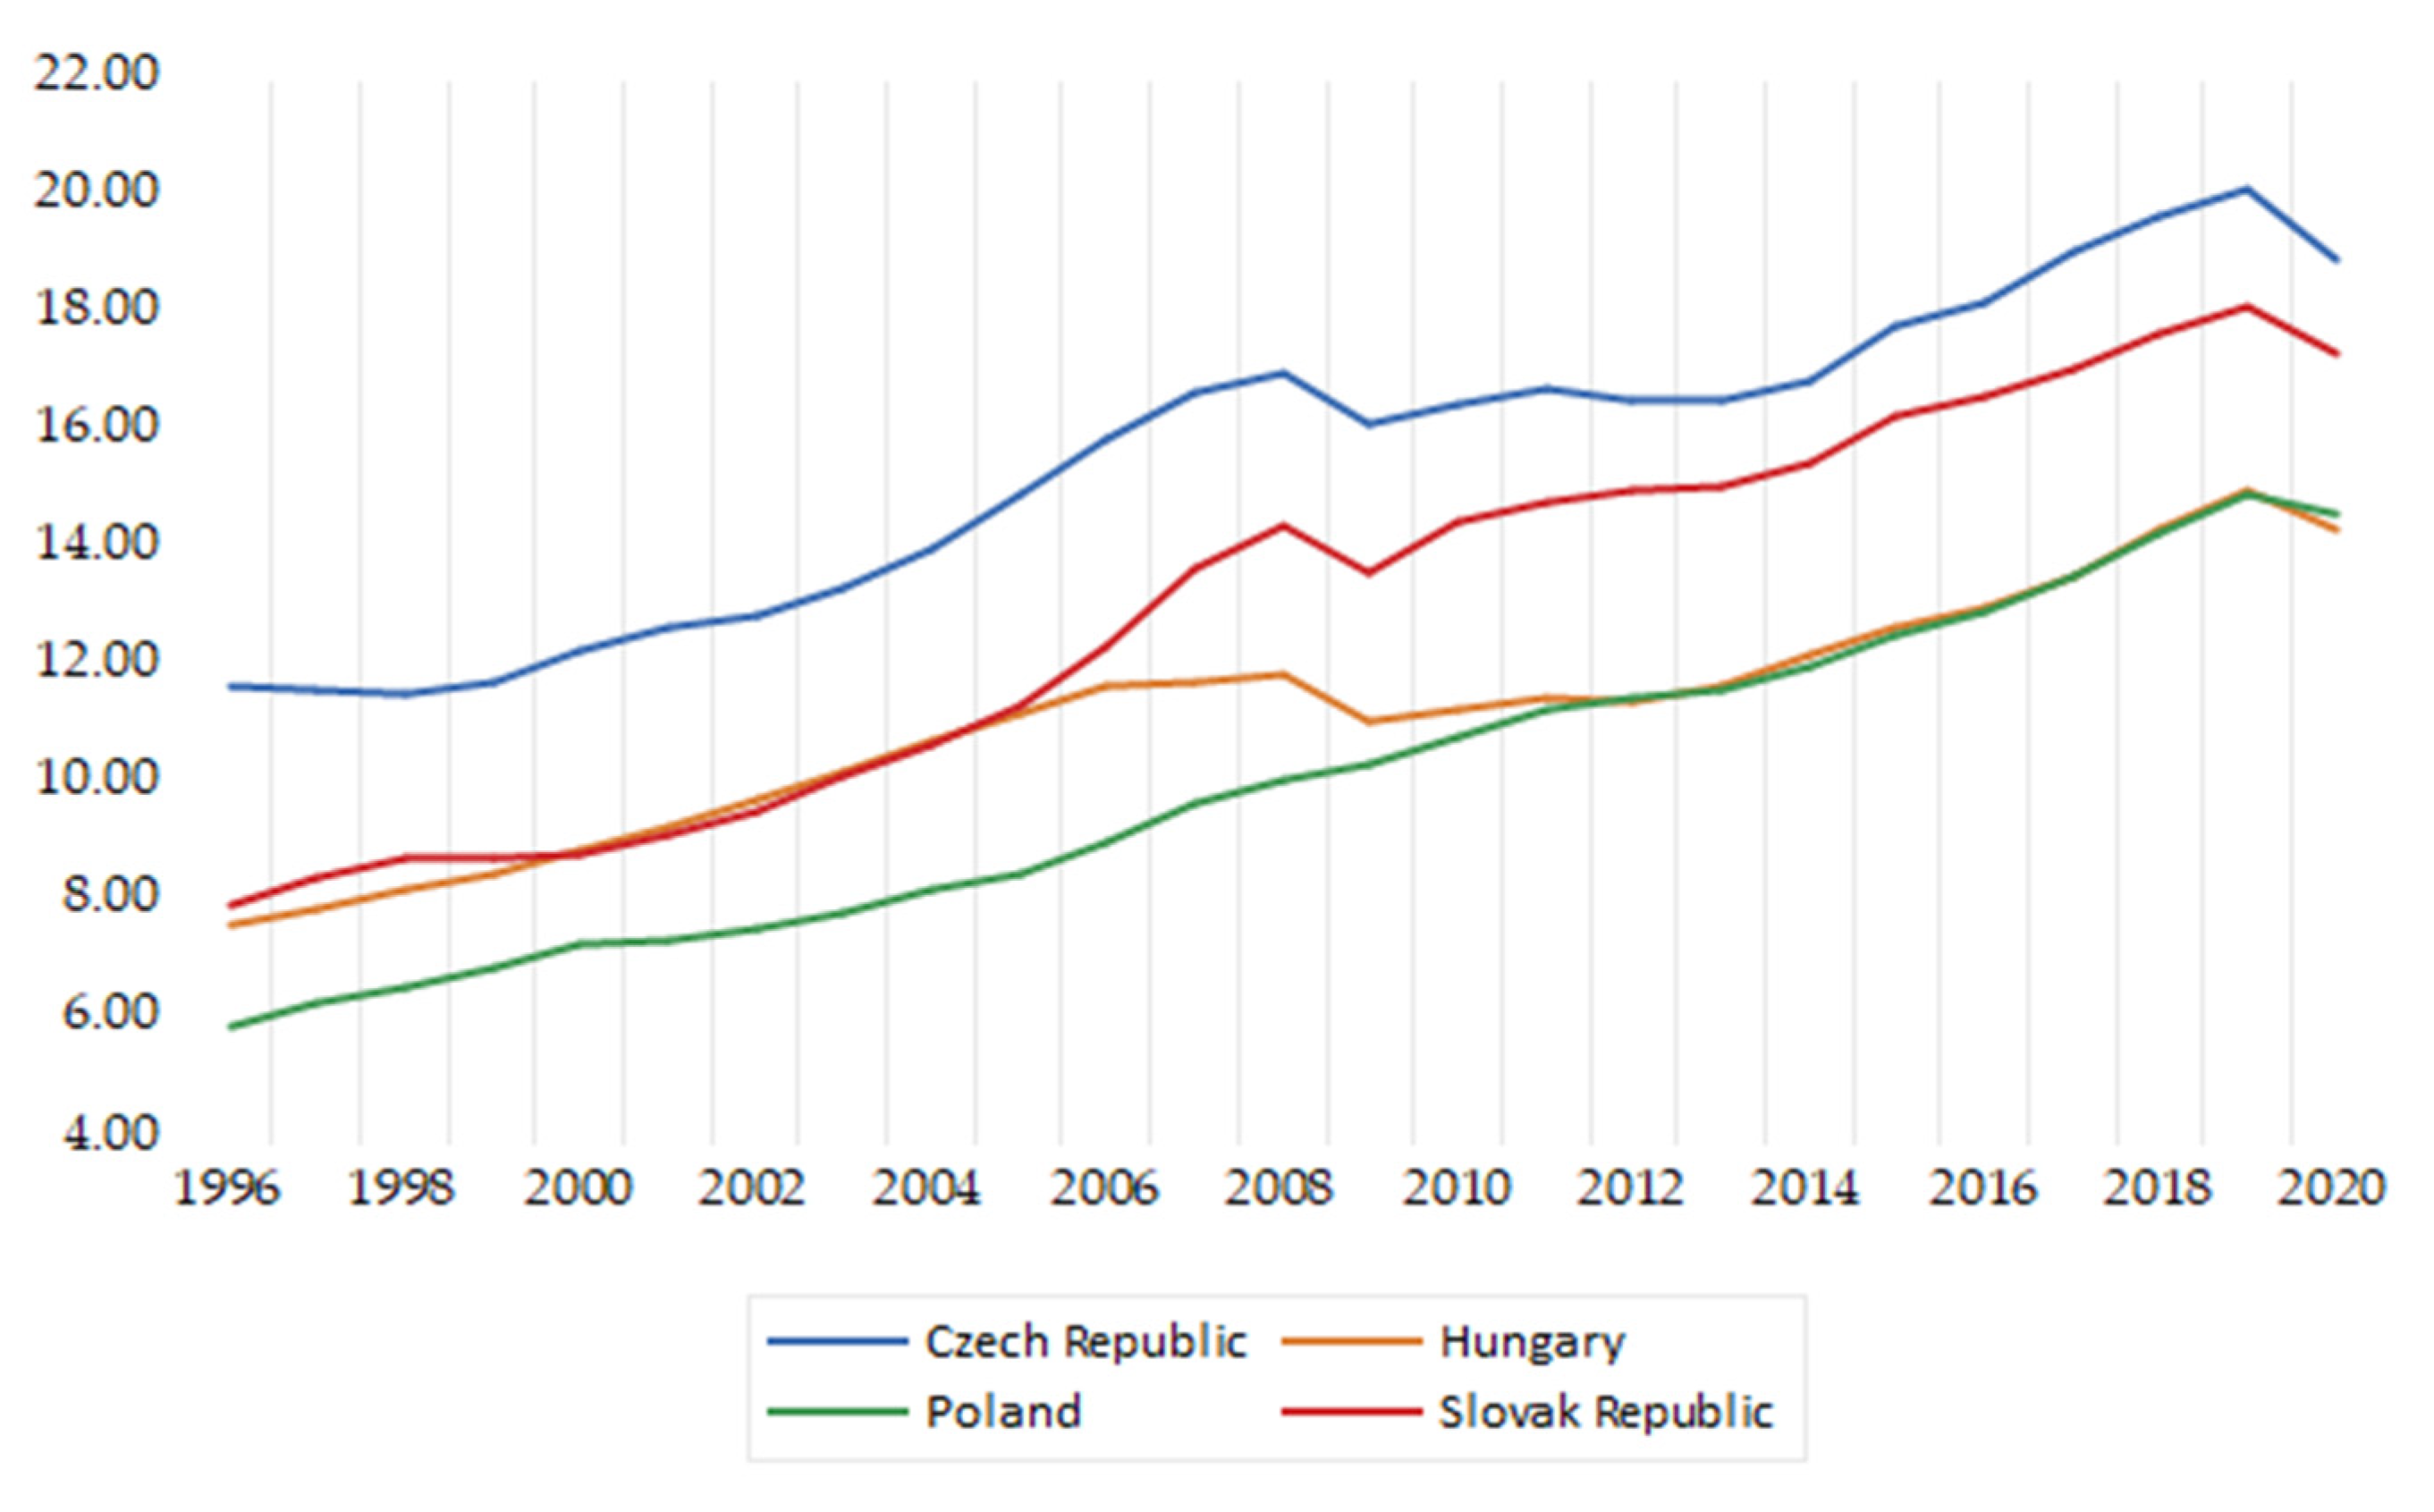
GDP (in the thousands USD)
CountryNMeanMedianMaximumMinimumStd. Dev.
Czech Republic2515,628.0216,505.9520,202.1511,632.602722.02
Hungary2511,245.7911,470.4015,041.107697.532030.43
Poland2510,126.7910,156.5815,016.675978.392779.09
Slovak Republic2513,081.7513,734.4518,167.488024.393367.86
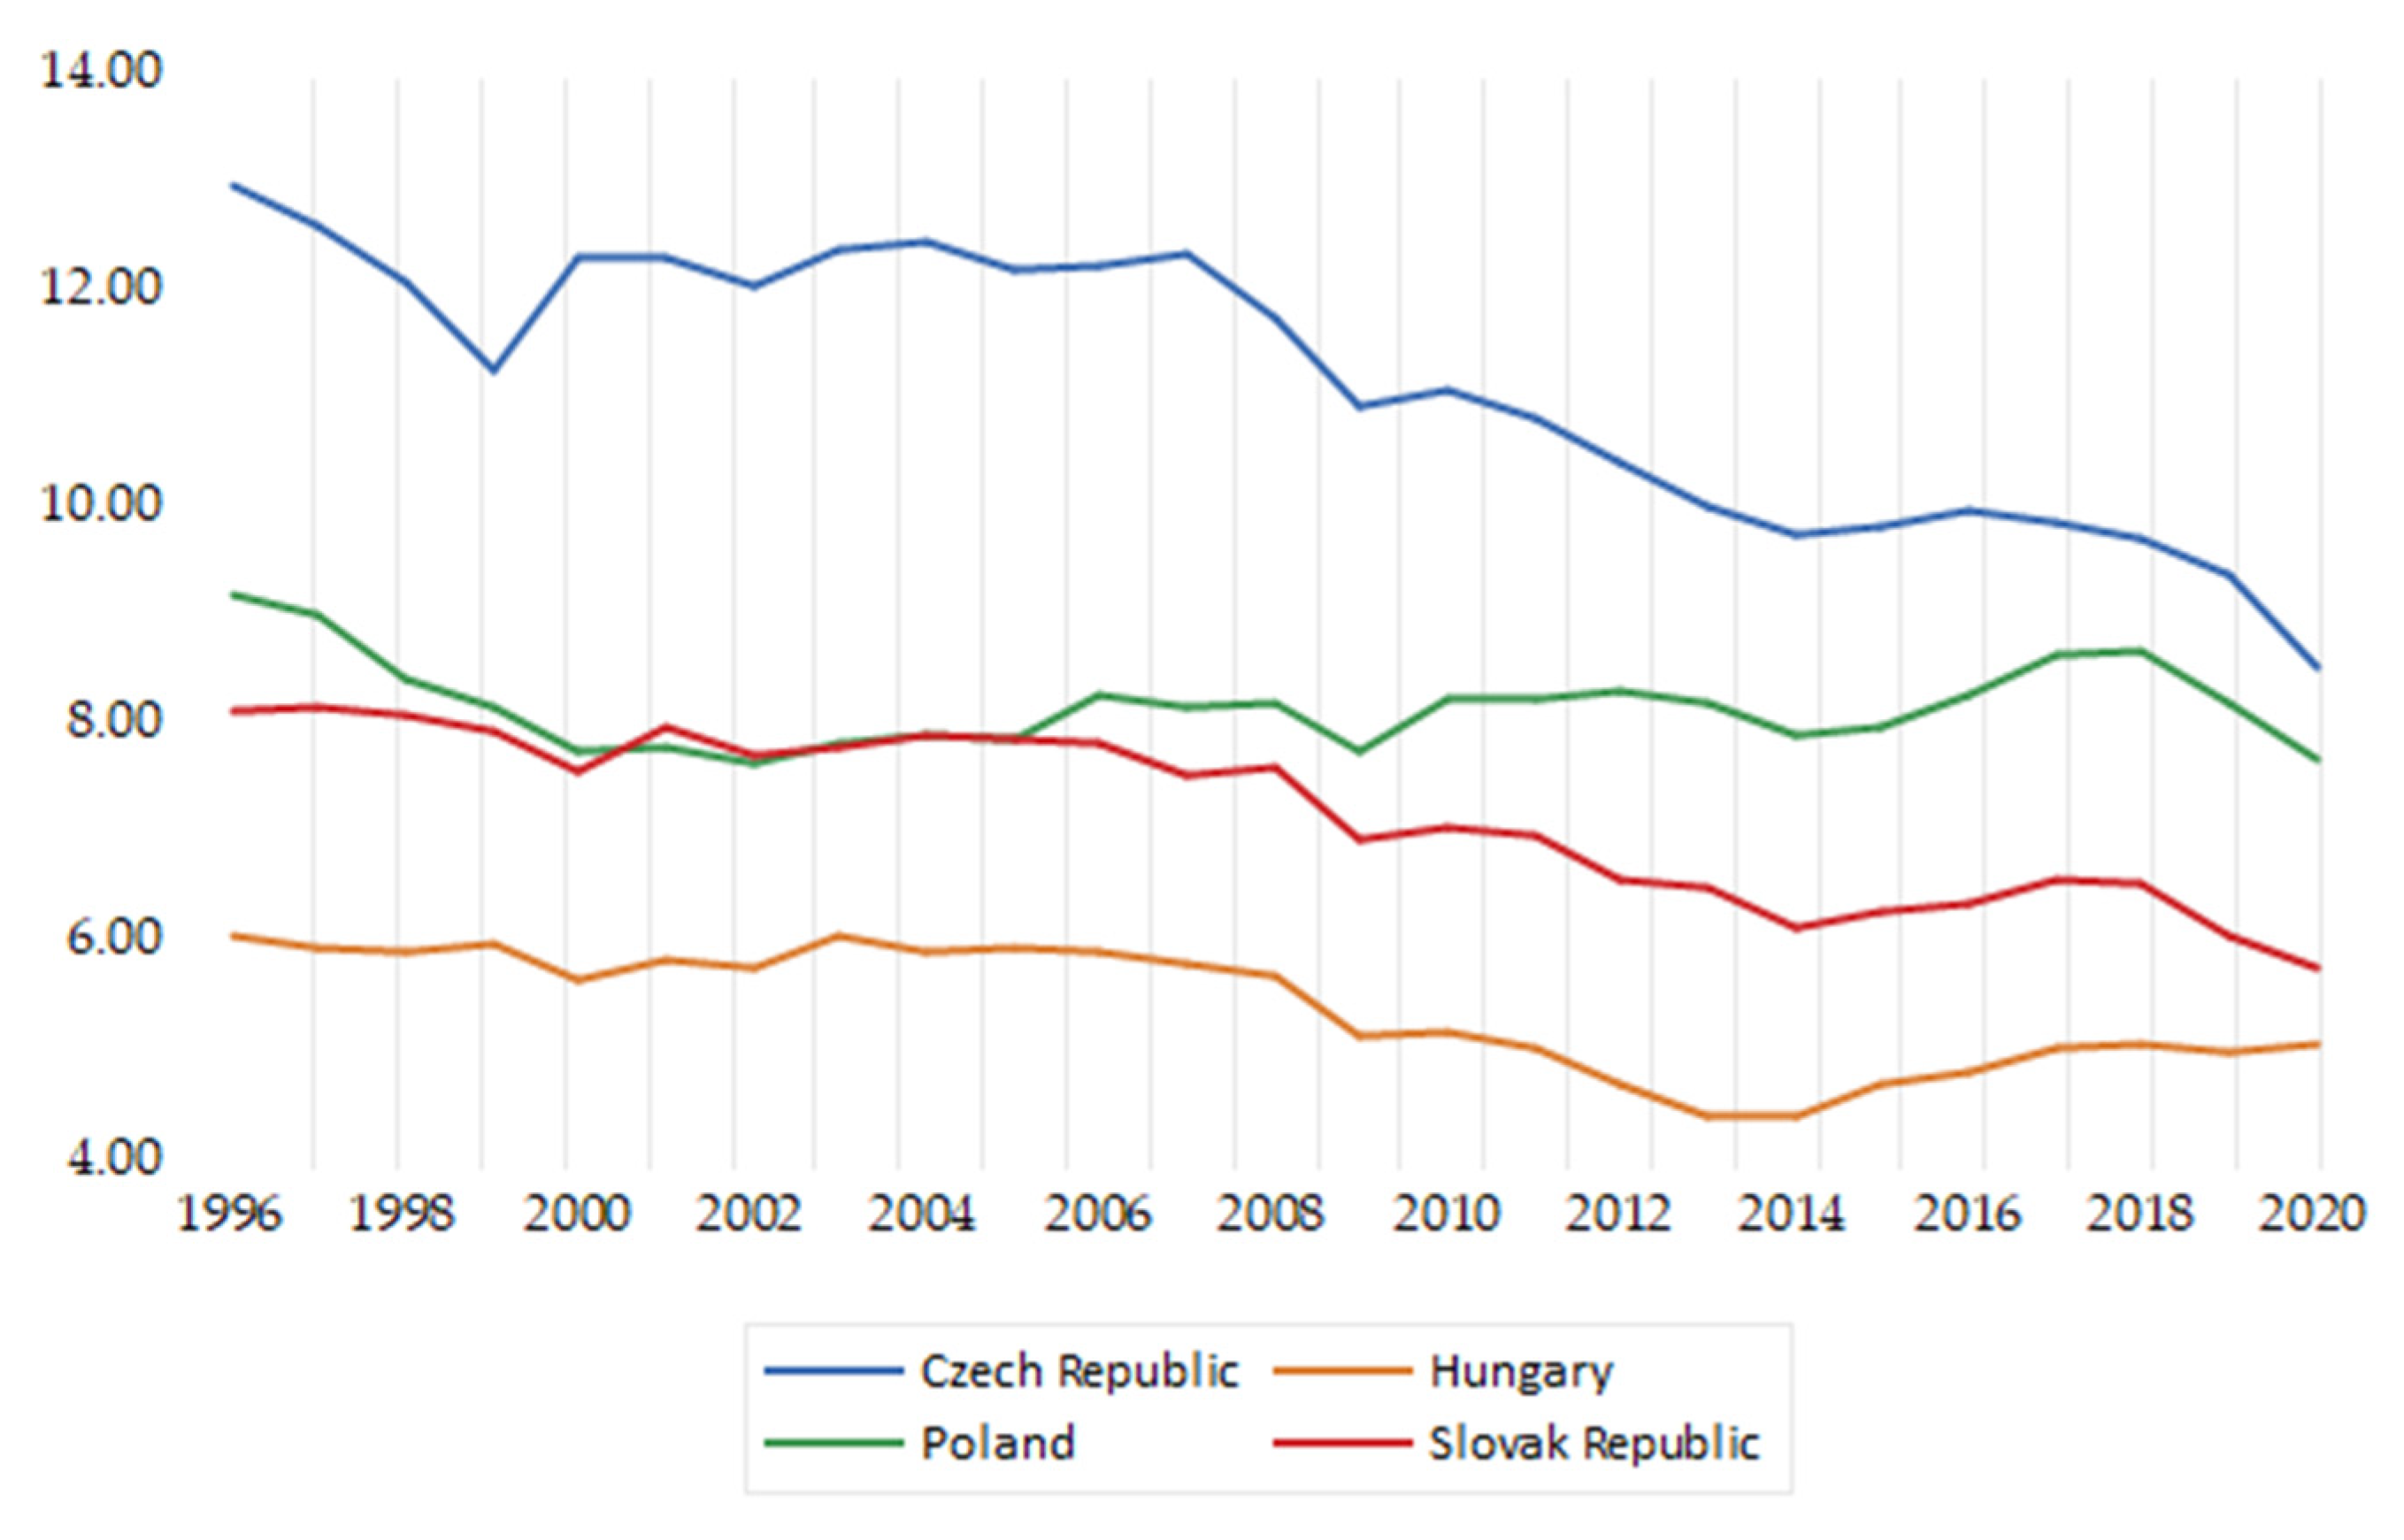
CO2 emissions (metric tons per capita)
CountryNMeanMedianMaximumMinimumStd. Dev.
Czech Republic2511.2311.3213.048.601.25
Hungary255.465.736.124.440.55
Poland258.238.269.247.700.40
Slovak Republic257.267.618.225.840.77
Urbanization (urban population)
CountryNMeanMedianMaximumMinimumStd. Dev.
Czech Republic257,666,373.007,664,419.007,922,941.007,512,306.00117,789.50
Hungary256,802,203.006,820,246.007,014,452.006,588,305.00145,808.30
Poland2523,289,222.0023,300,939.0023,842,562.0022,755,739.00362,895.00
Slovak Republic2529,72,029.0029,64,549.003,037,825.002,922,095.0043,412.75
Table 2. Results of Unit Root Test (the augmented Dickey–Fuller test (ADF).
Variable Original VariablesFirst Differences
ADF Test
(Variable with an Intercept)
ADF Test
(Variable with
Intercept and Trend)
ADF Test
(Increments with the Intercept)
ADF Test
(Increments with
Intercept and Trend)
Czech Republic
C−0.054−1.704−2.929 *−4.034 **
l_E−0.33−0.845−3.326 **−3.564 *
l_G−1.023−1.784−2.489−2.455 **
l_U−0.153−2.436−1.366 *−2.816
Hungary
C−1.182−3.043−4.379 ***−4.311 **
l_E−1.673−2.07−4.119 ***−3.992 **
l_G−1.709−2.094−2.723 *−2.832
l_U−1.705−3.871 **−3.264 **−1.400
Poland
C−2.39−3.41 *−3.306 **−2.782
l_E−1.512−3.374 *−3.557 **−3.434 *
l_G−2.784 *−1.927−2.894 *−4.07 **
l_U−0.636−4.272 **−5.176 ***−4.987 ***
Slovak Republic
C−0.144−2.476−5.839 ***−5.808 ***
l_E−0.764−2.531−6.882 ***−6.717 ***
l_G−1.576−0.63−3.239 **−3.401 *
l_U−4.061 ***1.324−1.353−3.192
The significance of the coefficients is indicated in the tables where *, ** and *** denotes 5%, 1%, and 0.1% significance level, respectively.
Table 3. The ARDL bound testing for cointegration with critical values.
CountryDep.
Variable
F-StatisticsI(0)I(1)CointegrationModel
Czech RepublicC1.103.715.02NOshort-run model
l_E13.303.715.02YESECM
l_G10.543.715.02YESECM
l_U13.733.715.02YESECM
HungaryC18.133.715.02YESECM
l_E6.643.715.02YESECM
l_G3.973.715.02NOshort-run model
l_U7.653.715.02YESECM
PolandC18.473.715.02YESECM
l_E3.973.715.02NOshort-run model
l_G5.413.715.02YESECM
l_U5.933.715.02YESECM
Slovak RepublicC2.083.715.02NOshort-run model
l_E3.983.715.02NOshort-run model
l_G1.893.715.02NOshort-run model
l_U2.543.715.02NOshort-run model
Table 4. Short-run statistics with critical values.
Dep.
Variable
ΔEΔGΔCΔU
tt-1t-2t-3tt-1t-2t-3tt-1t-2t-3tt-1t-2t-3
Czech Republic
Δ_C8.96 *** 1.117.93 *** −0.45 **−0.39 *** −12.29
l_ΔE
l_ΔG
l_ΔU
Hungary
Δ_C
l_ΔE
l_ΔG0.53 * 0.58 −0.02 3.48−6.00
l_ΔU
Poland
Δ_C
l_ΔE −0.01 0.2 0.1 *** 2.24
l_ΔG
l_ΔU
Slovak Republic
Δ_C4.23 ***3.24 ** 4.51 *** −0.56 **−0.2 89.58−104.02
l_ΔE −0.54 ** −0.46 0.12 ***0.05 −13.5219.7 **
l_ΔG−0.35−0.51 ** 0.19 0.09 ***0.07 −16.53 **11.87
l_ΔU0.010.010.01−0.01 **−0.02 **0.03 ***−0.01−0.01 *0.010.01 1.08 ***0.02−0.38
The significance of the coefficients indicated in the tables was *, **, and *** denoting 5%, 1%, and 0.1% significance levels, respectively.
Table 5. Long-run statistics with critical values.
CountryDep. VariableECGUECT
Czech RepublicC
l_E 0.05 ***0.36 ***−2.49 **−0.82 ***
l_G1.11 ***−0.11 *** 1.15−0.98 ***
l_U−0.840.080.81 −0.06 ***
HungaryC5.31 *** 0.14−16.47 **−0.91 ***
l_E 0.15 ***0.10 *1.68 **−1.22 **
l_G
l_U0.14−0.03 **0.06 * −0.18 ***
PolandC7.22 *** −3.24 ***−40.73 **−1.01 ***
l_E
l_G1.34 **−0.08 −12.47 ***−0.34 ***
l_U0.09 **−0.01 *−0.07 *** −0.69 ***
Slovak RepublicC
l_E
l_G
l_U
The significance of the coefficients is indicated in the tables where *, **, *** denotes 5%, 1%, and 0.1% significance level, respectively.
Table 6. Diagnostic tests of estimated models (p-values).
CountryDep. VariableNormality *Ser. Corr **Homoskedasticity ***Stable ****
Czech RepublicC0.510.210.29Stable
l_E0.630.840.92Stable
l_G0.530.080.79Stable
l_U0.870.240.17Stable
HungaryH_C0.760.240.06Stable
l_E0.830.510.25Stable
l_G0.170.300.17Stable
l_U0.070.310.28Stable
PolandC0.140.890.61Stable
l_E0.130.370.35Stable
l_G0.800.530.16Stable
l_U0.630.420.08Stable
Slovak RepublicC0.440.340.95Stable
l_E0.630.470.39Stable
l_G0.720.210.13Stable
l_U0.940.250.74Stable
* Jarque-Bera Normality TEST, ** Breusch-Godfrey Serial Correlation LM Test, *** Heteroskedasticity Test: Breusch-Pagan-Godfrey, **** Ramsey RESET Test.
Publisher’s Note: MDPI stays neutral with regard to jurisdictional claims in published maps and institutional affiliations.

