Article

Response Surface Methodology Analysis of Pyrolysis Reaction Rate Constants for Predicting Efficient Conversion of Bulk Plastic Waste into Oil and Gaseous Fuels

by
Muhammad Irfan
1,
Rao Adeel Un Nabi
2,
Hammad Hussain
3,
Muhammad Yasin Naz
2,*,
Shazia Shukrullah
2,*,
Hassan Abbas Khawaja
4,
Saifur Rahman
1,
Abdulnoor A. J. Ghanim
5,
Izabela Kruszelnicka
6,
Dobrochna Ginter-Kramarczyk
6 and
Stanisław Legutko
7
1
Electrical Engineering Department, College of Engineering, Najran University, Najran 61441, Saudi Arabia
2
Department of Physics, University of Agriculture Faisalabad, Faisalabad 38040, Pakistan
3
Department of Agricultural Engineering, Faculty of Agricultural Engineering & Technology, University of Agriculture Faisalabad, Faisalabad 38040, Pakistan
4
Department of Automation and Process Engineering, UiT The Arctic University of Norway, 9037 Tromsø, Norway
5
Civil Engineering Department, College of Engineering, Najran University, Najran 61441, Saudi Arabia
6
Department of Water Supply and Bioeconomy, Faculty of Environmental Engineering and Energy, Poznan University of Technology, 60-965 Poznan, Poland
7
Faculty of Mechanical Engineering, Poznan University of Technology, 60-965 Poznan, Poland
*
Authors to whom correspondence should be addressed.
Energies 2022, 15(24), 9594; https://doi.org/10.3390/en15249594
Submission received: 26 November 2022 / Revised: 11 December 2022 / Accepted: 13 December 2022 / Published: 17 December 2022
(This article belongs to the Special Issue Environmental Applications of Bioenergy and Biomass)

Abstract

:
The growing production of plastic waste and improper dumping after use has become a worldwide challenge. This waste is a substantial source of petroleum and can be effectively converted into pyrolytic oil and other useful products. A statistical prediction of the rate constants is essential for optimizing pyrolysis process parameters, such as activation energy (Ea), frequency factor (Ao), temperature (T), and kinetic rate constants (k). In this research, we utilized Box–Behnken using RSM with Design Expert software to predict statistical rate constants at 500 °C and 550 °C. The efficiency of the predicted rate constants was investigated and compared to the findings of experimental rate constants extracted from the literature. At 500 °C, the estimated rate constants did not reveal a significant rise in the oil output since these constants promoted high gas yield. Compared to the experimental rate constants, statistically predicted rate constants at 550 °C demonstrated substantially high-oil output with only 1% byproducts. The experimental rate constants yielded 32% oil at 550 °C, whereas the predicted rate constants yielded 85% oil. The statistically predicted rate constants at 550 °C could be used to estimate commercial-scale extraction of liquid fuels from the pyrolysis of high-density plastics. It was also concluded that Ea, Ao, and T must be analyzed and optimized according to the reactor type to increase the efficiency of the expected rate constants.

1. Introduction

The emphasis on plastic is expanding each year due to growing customer preferences for everyday items. Plastic waste is discarded into landfills after it is manufactured and consumed by households and industries, which causes dangerous diseases. Figure 1 depicts the entire cycle from manufacturing to utilization, consumption, dumping, and recycling of plastics. Polymers have been known for their long-lasting properties, chemical stability, and versatility. Because of these characteristics, they are suitable for automotive parts, domestic appliances, agriculture, medical instruments, polymeric constructions, and other applications [1,2,3]. Plastics are extensively utilized materials, with 355 million tons produced annually worldwide [2]. Plastic waste management has become increasingly challenging and detrimental to our environment [4]. Only 9% of this massive waste is recycled or reused, 60% is fixed in landfills, and the remainder is burnt [5,6]. The hazardous effects of plastic waste on the ecosystem and human health are intensifying every year [7]. Therefore, it is critical to develop novel and ecologically beneficial strategies for recycling this waste into valuable products to protect our ecosystem and planet [8].
During pyrolysis, waste plastics are cracked at higher temperatures to produce combustible liquid and gas fuels [9,10]. Longer molecular chains of plastic are broken down into smaller molecules before being heated in an endothermic process [11,12]. Pyrolysis can be catalytic or non-catalytic, depending on the temperature ranges [6]. Comprehensive experimental and computational investigations are needed to understand the physiochemical nature of the thermal pyrolysis of plastics. Most experimentally determined rate constants are used to predict HDPE conversion into fuels and other products. However, according to the literature, the amount of oil and gas acquired via experimental rate constants at a commercial scale is not economical. Using experimental rate constants, the industrial process and the oil production cost are substantially high. The high-cost factor prevents the application of empirical rate constants on a large scale. In this study, we proposed that to ensure large-scale production of liquid fuels, we should predict the rate constants statistically by choosing a suitable set of Ea and Ao. Statistical prediction can help estimate the number of liquid fuels and gases that could be obtained at the economic level with less effort, complexity, and cost. There is also a lack of numerical analysis of the reaction rate constants for successfully decomposing plastic waste into intended products at relatively low processing temperatures.
For optimal production and product selectivity, the control parameters should be statistically optimized using proper statistical analyses. Developing statistical models to depict the pyrolysis of high-density plastic is essential to ascertain the role of operational factors in pyrolysis efficiency. Previously, we forecasted the statistical rate constants utilizing different numerical approaches, such as SPSS and R software. It is imperative to validate the results using multiple statistical approaches. This trend can help in understanding the pyrolysis reaction mechanism and assessing the optimal combination of Ea, Ao, and k, which can substantially impact the commercial-scale production of liquid fuels and gases. It is also feasible to use Design Expert software to predict the nature and quantity of fundamental products. Wirawan et al. [13] performed optimization analysis on plastic waste pyrolysis by using factorial design to produce combustible liquids. They evaluated a 2k factorial design for maximizing liquid product yield by optimizing material type, temperature, and residence time. The results showed that an improved pyrolysis process could produce liquids with diesel-like characteristics at low or moderate temperatures. They chose 175 °C as an optimal temperature for a 3 h processing time. Scant literature is reported on slow pyrolysis at low temperatures [14]. Joppert et al. [14] optimized the experimental settings to decompose mixed wastes using a factorial design and a response surface approach. The reaction time, temperature, and pressure were optimized statistically. It was found that the researched models were helpful in providing information on experimental settings that would optimize the production of specified liquids and gases [15]. Inayat et al. [16] employed RSM and artificial neural network methodologies to optimize the process for hydrogen production with reduced tar formation. They used a downdraft gasifier to co-gasify wood and oil-palm fronds in the presence of limestone, dolomite, and Portland cement. The hydrogen gas formed at 900 °C with 30% loading of a mixture of Portland cement, dolomite, and limestone. RSM and artificial neural network data confirmed 94.85% accuracy in the reported results. Similarly, Ali et al. [17] used the RSM tool in Design Expert to evaluate how process factors, such as temperature, air flow rate, and particle size, affect the gas composition. Krishna et al. [18] used analytical Pyroprobe® software to collect information about the isothermal thermal degradation of polyethylene and polystyrene. They set the reaction time to within the range of 2–150 s. The activation energies and frequency factors were calculated using integral reaction models. This study estimated high-activation energies for the rapid pyrolysis of plastics, revealing that the rapid pyrolysis mechanism is limited to the diffusion process. At 500 °C, it took 12–45 s for the maximum development of vapors. At 600 °C, the vapor formation time was reduced to 22 s. Harmon et al. [19] used a mechanistic model to explore the pyrolysis conditions of plastic waste. By enhancing the gas proportion, the model anticipated that the olefin percentage would break down quickly as the temperatures rose. The formation of aromatics increased with increasing temperature and residence time. Tucciullo [20] used a lumped kinetics approach with a CDF model to study the chemical kinetics essential for elaborating hybrid propulsion since gaseous products of pyrolysis influence the efficiency of the combustion process.
Most of the residue from the pyrolysis of plastics is made up of soot and aliphatic chemicals that can gradually aromatize into polycyclic aromatic hydrocarbons. With 198 species, we suggested a reaction mechanism that condensed 6307 reactions into a straightforward five-reaction mechanism. This study aimed to optimize the process parameters to gain insight into the HDPE reaction mechanism and the influence of the reactor on the production of commercial-scale pyrolytic oil. Design Expert software was employed to anticipate statistical rate constants. On a commercial scale, a combination of Ea and Ao, which are possible factors for determining kinetic rate constants, can be predicted to increase product yield. This trend can provide a better look into the reaction mechanism of plastics and the optimal combination of Ea, Ao, and k, which can substantially impact the commercial effectiveness of liquid fuels and gases.

2. Statistical Prediction of Rate Constants

We have evaluated multiple numerical approaches for estimating statistical rate constants. We used RSM in Design Expert software to forecast the rate constants. We thoroughly analyzed the influencing factors by modeling the reaction mechanism in which oil, gas, and byproducts were developed using thermobalance reactors [21]. We attempted to confirm the impact of Ea, Ao, and k on the final yield at 500 °C and 550 °C. We also tried to optimize the factors to reduce the negative effects of Ea, Ao, and k in thermobalance reactors and to enhance the primary products.

2.1. Execution of Design Expert

The statistical rate constants were predicted with response surface methodology (RSM) using a statistical combination of Ea, Ao, and T. The Box–Behnken strategy was used to forecast the rate constants for the independent factors (Ea, Ao, and T) by considering the minimum and maximum supposed values at all temperatures. These predicted rate constants were utilized in MATLAB to assess their influence on the yield during the processing time by using a first-order differential equation solver. Table 1 summarizes the model construction information for 500 °C and 550 °C.
The variables A, B, and C in Table 2 reflect the supposed independent factors Ea, Ao, and T, respectively, whereas the response variables R1 represent the response factors kA and kB. By default, RSM displays 15 runs at different Ea, Ao, and T values to estimate the statistical rate constants at two different temperatures, as illustrated in Figure 2a,b. These plots show a relationship between the dependent and independent variables and how the dependent factor varies when the maximum and minimum levels of the predictive factors vary. The RSM predicts linear and quadratic models for 500 °C and 550 °C in line with polynomial analysis without transformation since the maximum-to-minimum ratio is smaller than 10 for all predicted models, except cubic.

2.2. Validation of Model Significance

Table 3 demonstrates that an anF-value of 3.87 for 500 °C and 6.13 for 550 °C indicates that the models are valid. There is a 4.11% possibility for 500 °C and 3% for 550 °C since the F-value is primarily attributable to the contaminated data. The model term is assumed significant when the p-value < 0.0500 and the R2 >1. The F-value for the lack of fit is 3.31 for 500 °C and 12.27 for 550 °C, which is smaller than the pure error. As seen in Table 3, a non-significant lack of fit values was accepted.
Table 4 presents 95% confidence level (Cl) for all the predicted models at 500 °C and 550 °C. The estimated coefficient indicates the anticipated variance in response with a change in factor value, whereas the rest of the factors are held constant. Because of the singular value of the variance inflation component (VIF), these models demonstrate orthogonal design. The overall response of all runs constitutes the intercept in an orthogonal design. The coefficient modifications are determined by the factor settings established around that average. VIFs higher than 1 indicate multi-collinearity (MC). VIFs of less than 10 are normally considered acceptable. As the VIFs values are 1, our VIF model shows a strong correlation between the parameters. Using R2, F-value, and VIF values, we confirmed that our predicted models are significant and could be utilized for further analysis.

2.3. Selection of Predicted Rate Constants

Figure 3a bled to alterations in the dependent factor caused by the maximum and minimum values of the independent variables at 500 °C. In contrast, Figure 3c,d shows the variations at 550 °C. Our statistical models predicted 15 runs, while the reaction mechanism from the literature needed only seven rate constants. Above the green surface, there are four rate constant values for 500 °C. However, at 550 °C, as shown in Figure 3c,d, six rate constants are visible above the shaded surface, with one visible below it. Figure 3 confirms the total of seven rate constants. We analyzed how the estimated Ea and Ao affected the rate constants and how changing the rate constants impacted our outputs. In total, seven rate constants were used in MATLAB by considering the first-order differential equation. The straight and concave surfaces in Figure 3a,b depict the shift from maximum to minimum assumed values of parameters for different temperatures. We made two models by varying the maximum and minimum values of the assumed parameters and chose the predicted rate constants that positively correlated with each other when the p-value is <0.05 and the value is <1. Table 4 further shows that the confidence interval for both models was 95% and the variance inflation values were 1. This model might be used to determine the optimum rate constant by adjusting the maximum and minimum and Ao. The expected rate constant values for each combination of Ea and Ao at 500 °C and 550 °C and the experimental rate constants are shown in Table 5.

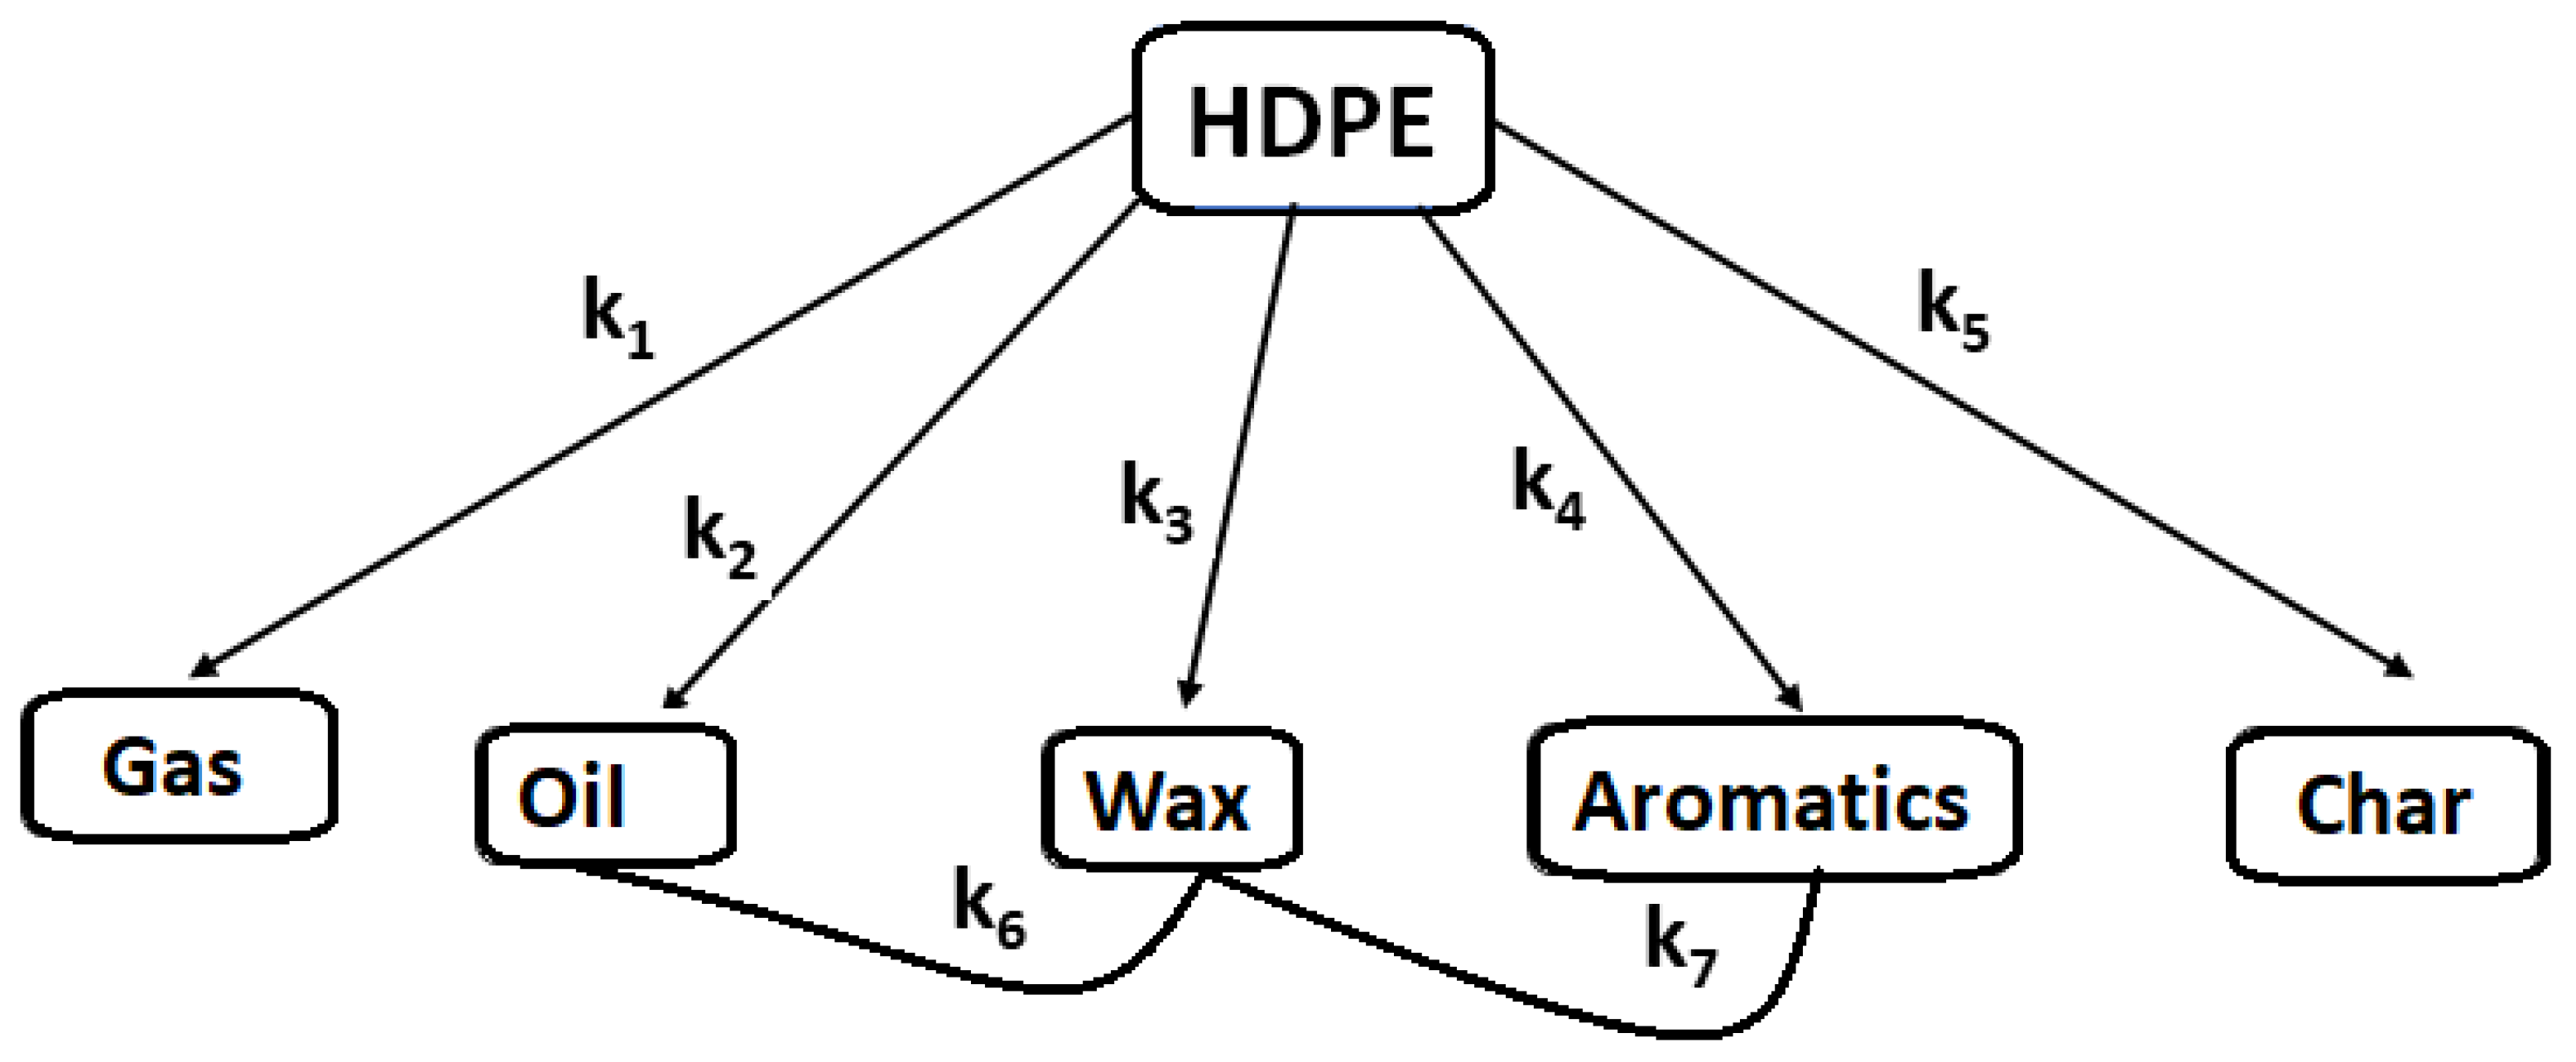
3. Reaction Mechanism of HDPE

The polymeric structure is highly complicated; numerous reactions occur throughout the pyrolysis process. It is an ethylene polymer with numerous C2H4 molecules in a chain [22]. Figure 4a shows the formation of free radicals, (b) shows the space-fill model, and (c) shows the highly branched structure of HDPE. The number of C2H4 groups in a single HDPE chain might range from several hundred to a few million [23]. The branching in HDPE is smaller than in polyethylene. It is a polymer mainly composed of hydrocarbons. This could be made using ethylene and catalysts. Zeigler–Natta, metallocene, and Phillips are some of the catalysts utilized for this purpose. During the polymerization of HDPE, free radicals form polymeric chains at the end of each expanding polyethylene molecule, as seen in Figure 4a. The high number of free radicals collide with other molecules, making the reaction faster [24]. Then, the new polyethylene molecule links to a free radical, forming long linear chains. Although the linear chains in this polymer are not substantially branched, they are closely packed together to improve density, as shown in Figure 4b. Because of the intense intermolecular interactions in the polymer, it is very crystalline and dense. We selected polymerization, H-abstraction, β-scission, and chain fission reactions because we were interested in forming pyrolytic oil [17].

4. Implementation of MATLAB

4.1. Description of the Mathematical Model

The model pathway of the first order (n = 1), as illustrated in Figure 5, and the description of the reaction mechanism (3) to (8) are based on the literature [21]. We conducted a statistical operation to forecast the rate constants to meet the reaction mechanism requirements at 500 °C and 550 °C. The findings, based on statistical predictions, were compared with the literature. Figure 5 depicts the conversion of HDPE to waxes, gases, liquids, aromatics, and char, followed by the tertiary transformation of waxes to liquid and aromatic compounds. In the beginning, polymeric and product fractions are assumed as:
@t = 0; Xp = 1 and Xg = Xl = Xw = Xa = Xc = 0
where, t is the time, Xp is the polymeric mass percentage, and Xg, Xl, Xw, Xa, and Xc are gases, liquids, waxes, aromatics, and char fractions, respectively. At time = t (s), the second physical state would be:
@t = t; Xp< 1 and Xg, Xl, Xw, Xa, Xc = f (t, Xp)
where, t is the timescale (s), Xp is the polymeric mass fraction, and Xg, Xl, Xw, Xa, and Xc are gases, liquids, waxes, aromatics, and char fractions, respectively. Equations (3)–(8) illustrate balances computed for a proposed mechanism for polymerization, gases, liquids, aromatics, waxes, and char. Here, k(1), k(2), k(3), k(4), k(5), k(6), and k(7) indicate the rate constants of thermal cracking of a polymer into the final products. All reactions were considered irreversible, which resulted in a 99.5% conversion of HDPE.
dXp dt = Xp   [ k 1 + k 2 + k 3 + k 4 + k 5 ]
dXg dt = Xp   [ k 1 ]
dXl dt = Xp   [ k 2 ] + Xw   [ k 6 ]
dXw dt = Xp   [ k 3 ] Xw   [ k 6 + k 7 ]
dXa dt = Xp   [ k 4 ] + Xw   [ k 7 ]
dXc dt = Xp   [ k 5 ]

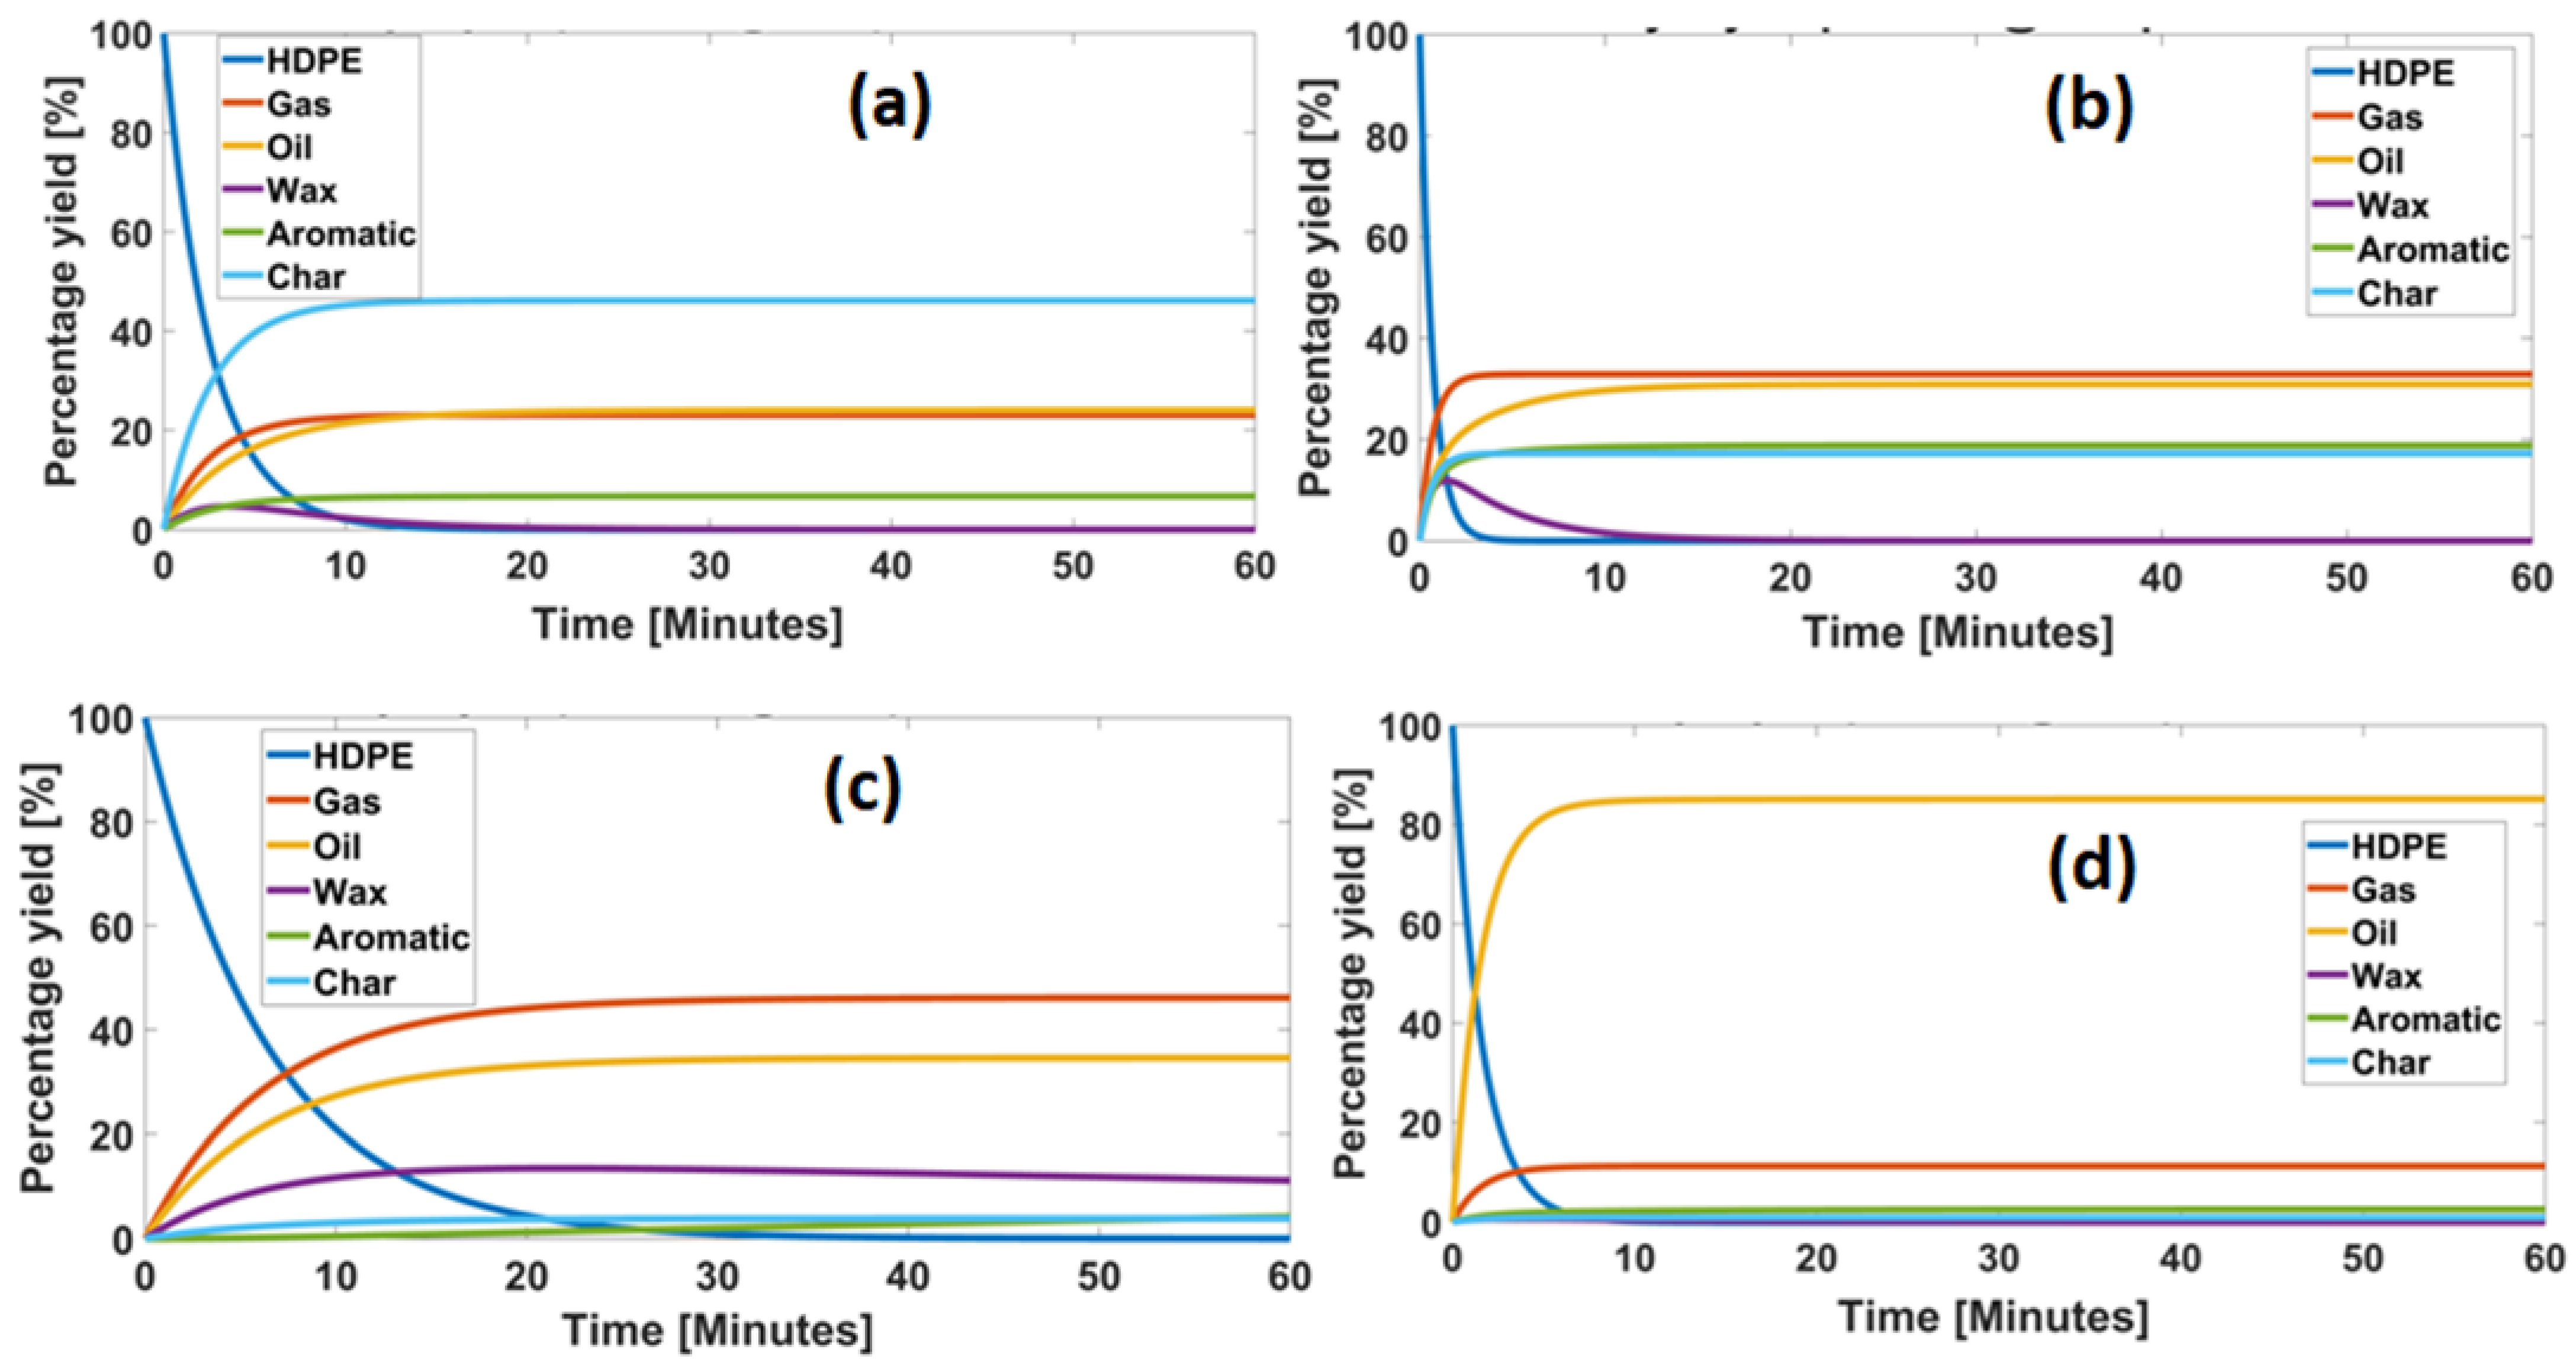
4.2. Effect of the Rate Constants and Conversion of HDPE into Species

The standard method for addressing thermal degradation is the autoxidation process with successive stages of initiation, de-propagation, branching, and termination. In the first stage, heating removes a hydrogen atom from the polymeric chain. This produces an unstable and reactive polymeric free radical and an unpaired electron in a hydrogen atom [25]. The process can be accelerated depending on how straightforward it can be to extract the Hatomfrom the polymeric chains. The thermal breakdown is reduced by mopping up free radicals and forming an inert product. Free radicals can naturally combine to produce an inert product, or plastic stabilizers can be used to assist the process. Polymer chain branching is also possible in some polymers, this occurs when two polymer chains are joined together, resulting in the cross-joining and thermal decomposition of the polymers. According to this study, when the operation temperature rose, the amount of time needed for full pyrolysis decreased. Under optimal pyrolysis conditions, the most abundant products were gas, oil, wax, aromatics, and char, with the kinetic reaction constants k(1), k(2), k(3), k(4) and k(5), respectively. As demonstrated in Figure 6a–d, the oxidation processes turned wax towards oil at k(6) and wax towards aromatics at k(7). We looked into the effect of experimentally and statistically estimated rate constants on the output as a function of time at 500 °C and 550 °C. The thermal disintegration of high-density plastics can produce oil, gas, and carbon black during subsequent extraction. Before attaining a stable state, the feedstock turns into various intermediate organic compounds, such as waxes, aromatics, and char [26]. Paraffin, kerosene, and aromatic hydrocarbons are the three primary types of wax. A small part of these waxes may turn into even smaller molecules at higher temperatures to produce carbon black. Since carbon black is a stable material, it is difficult to induce chemical changes throughout the production process. Other assumed parameters, such as Ea, Ao, T, and the addition of catalysts, can further alter the value of the rate constants [27].
Figure 6a, reveals that at 500 °C, the plastic was fully consumed after 20 min of processing time with the experimental rate constants. Using a numerically predicted rate constant, the plastic took 30 min to break down with 1% remaining unconverted at the end of the process. Figure 6c,d shows that at 550 °C, the breakdown of HDPE occurred very quickly for both the statistical and experimental rate constants. At both temperatures, the influence of the empirical and predicted rate constants on the final yield indicates that HDPE breaks down into smaller particles before being transformed into waxes, char, and aromatics [28]. The time-dependent conversion of polyethylene into oil, gas, and waxes is depicted in Figure 6a,b. Aromatic, char, and waxes rose at the start of the pyrolysis process and then declined after 10 min of processing. However, the amount of wax, char, and aromatics increased immediately for the experimental rate constant, but the statistical rate constant did not demonstrate similar behavior at 500 °C, as shown in Figure 6a,b. For the statistical rate constants at 550 °C, the formation of oil and gas yield was more significant, while the aromatics and wax yield was smaller than for the experimental rate constants, as reported in Figure 6c,d.

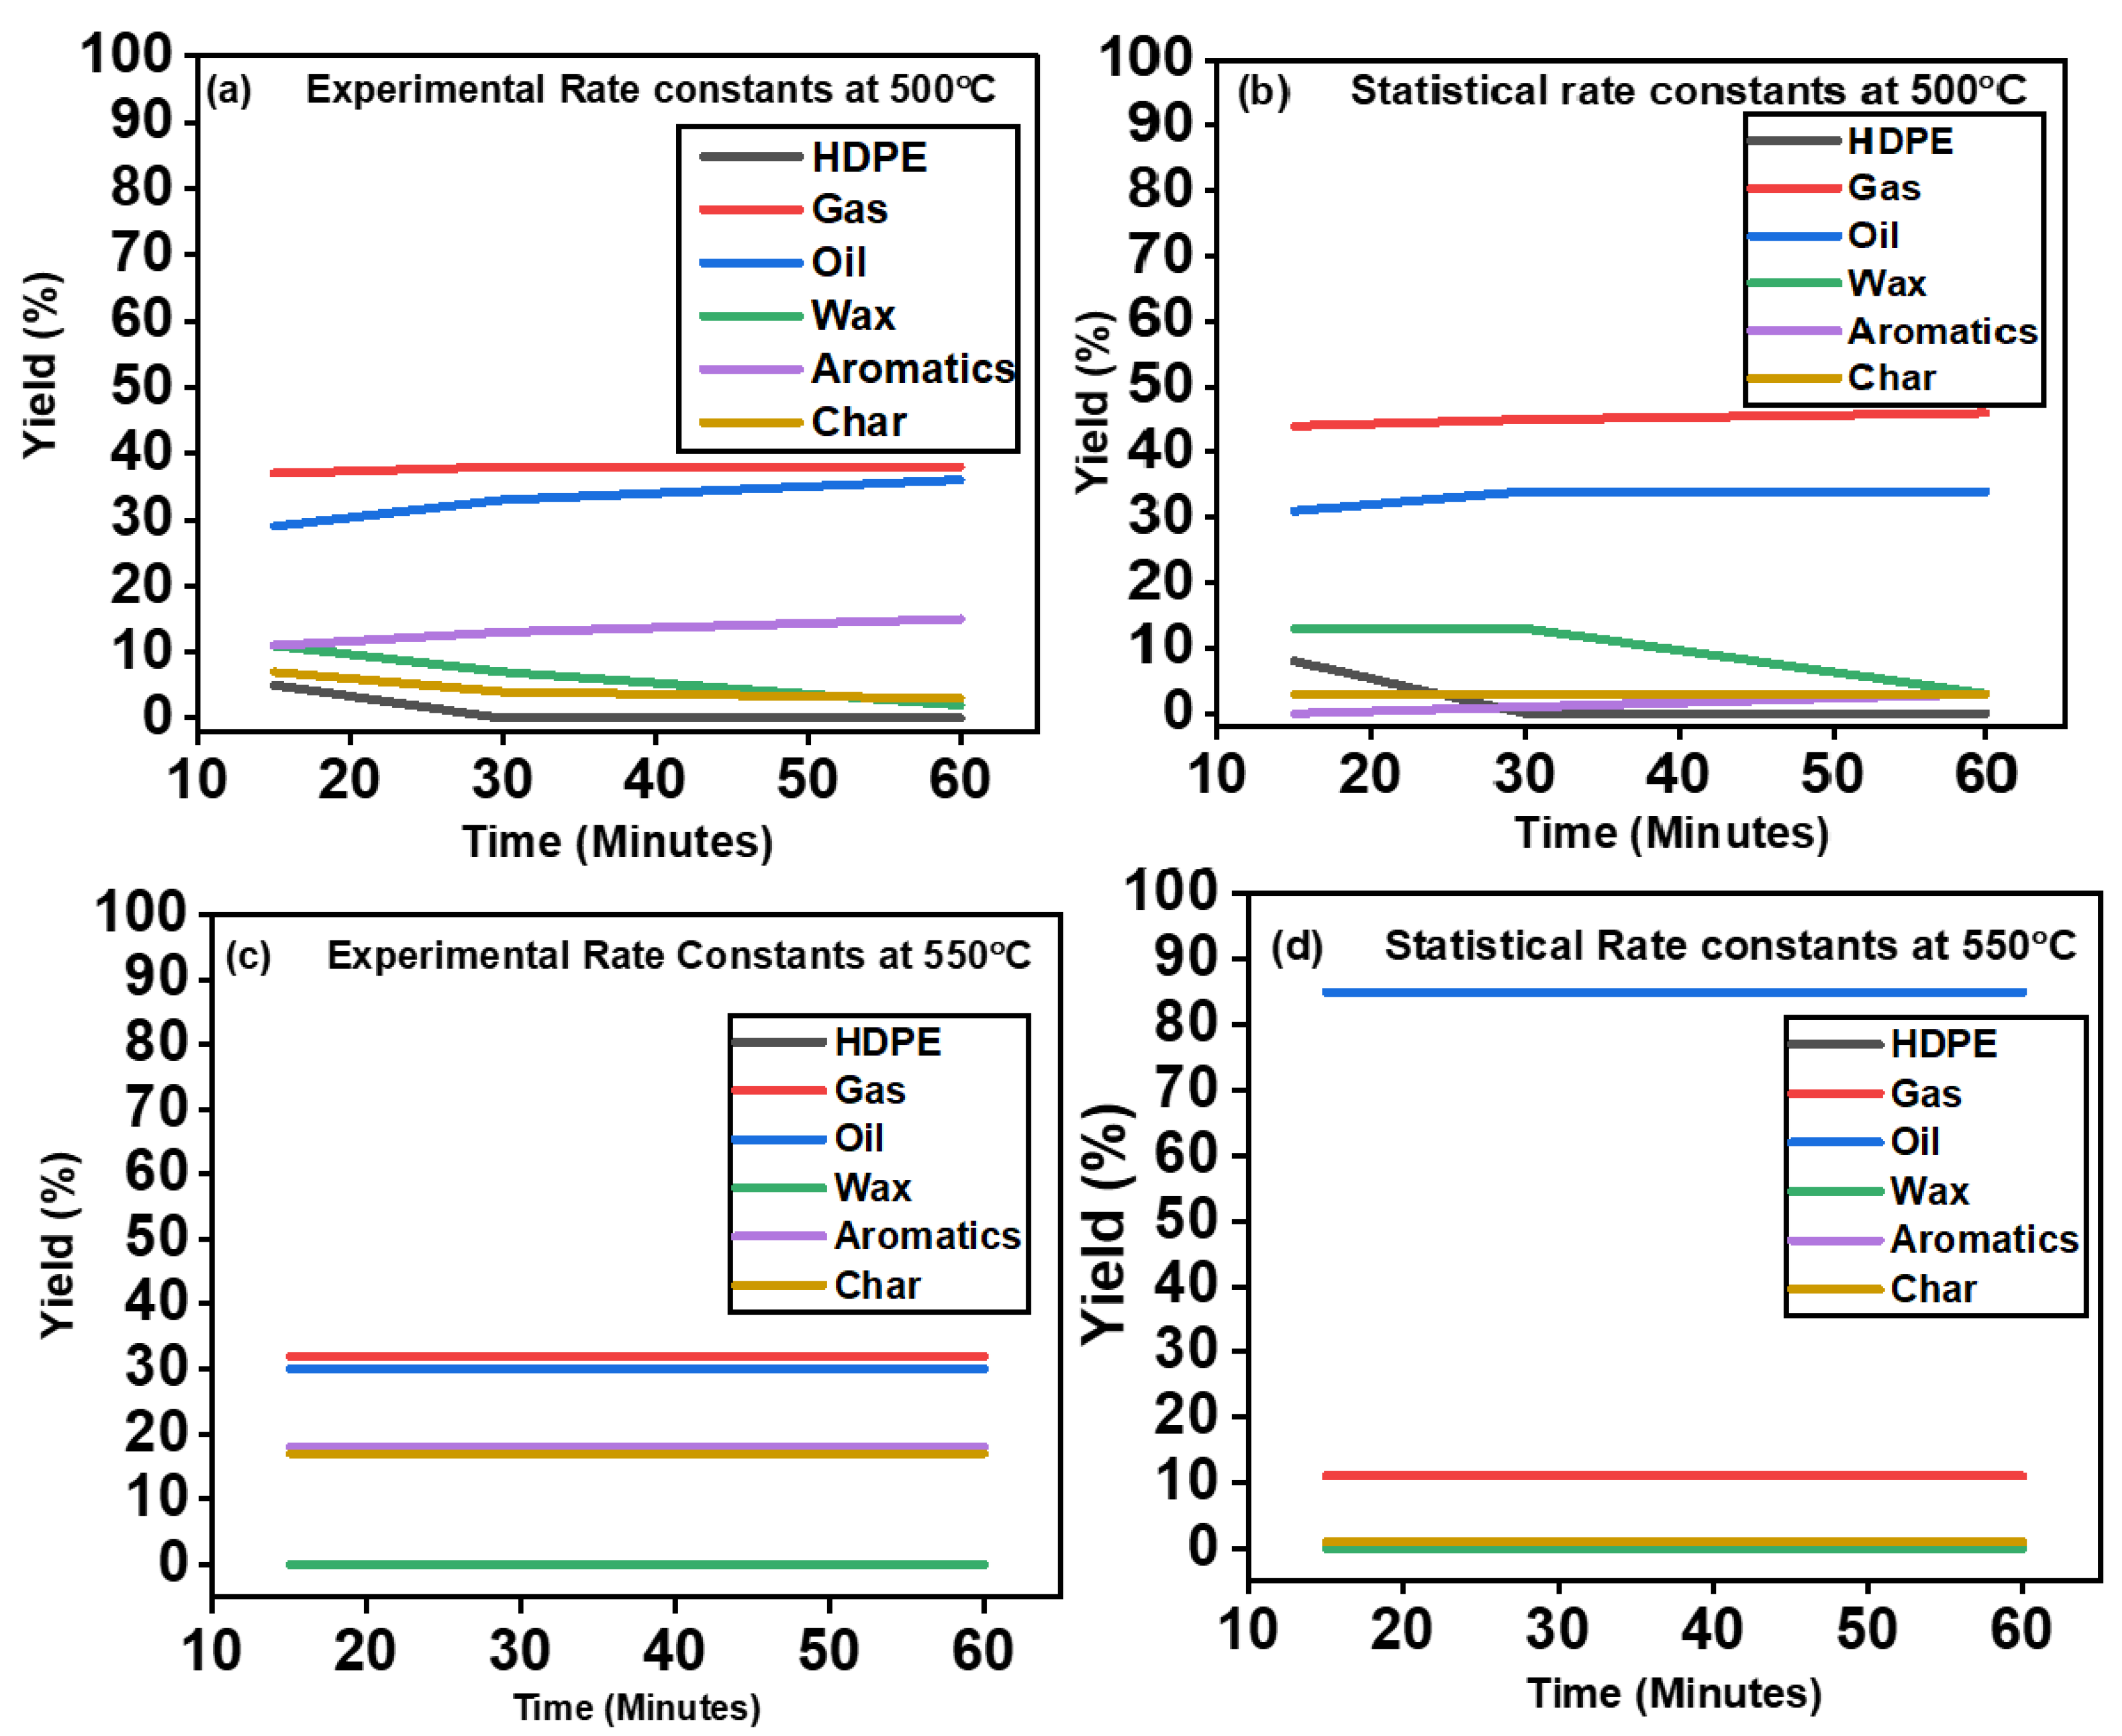
5. Effects of Temperature and Time

Temperature is also an important parameter in deriving the breakdown of polymeric materials and their transformation into the final products. It directly impacts the processing time and operating parameters. At high temperatures, the formation of gases increases while the creation of waxes reduces rapidly [29]. High-working temperatures lead to a buildup of small radicals, which accelerates the process and promotes the evaporation of long chains. Radicals undergo β-scission at a higher rate to form gas during the thermal degradation of the feedstock, where the cage effect might impact the value of Ao. Considering that volatile components and aromatics might be produced at various stages of the reaction, a complicated reaction pathway has previously been hypothesized. Intermolecular hydrogen transfer will have a higher impact on volatile production. The time required for converting 99.5% of HDPE was affected by temperature. Figure 7a–d reveals that temperature significantly impacted product distribution. Higher temperatures decreased wax production and increased gas output. It was also evident that the time needed to reach the maximum conversion efficiency decreased quickly with a rise in temperature [30].
As shown in Figure 7, the processing time was set as 60 min. The species’ behavior was observed every 15 min to investigate the time-based effect of factors on product production at each temperature. At the early stages of the pyrolysis process, all species, such as gas, oil, wax, aromatics, and char grew over time. The unused HDPE after 15 min of operation at 500 °C was 5 and 8% for the experimental and statistical rate constants, respectively, as shown in Figure 7a,b. The oil yield for the experimental rate constants was 29%, representing an increase of up to 36%, whereas the oil yield for the statistical rate constants was 31%, indicating an increase of up to 34% over the experimental rate constants. As demonstrated in Figure 7a–d, the statistical rate constants for wax, aromatics, and char decreased during the processing time compared to the experimental rate constants, as shown in Table 6.
Figure 7c,d shows that after 15 min of reaction time at 550 °C, no HDPE was left. The oil, gas, aromatics, and char yield increased progressively for the experimental rate constants at 550 °C. The highest determined oil output for the experimental rate constants was 32%. In the case of the statistically predicted rate constants, the oil yield increased dramatically up to 85%, with 11% of the gas output. The wax completely degraded into oil and gas products at this temperature. The char and aromatic production remained at almost 1%. The low char yield was attributed to the high temperature, reactor size, and low Ea values. The high average kinetic energy of the molecules boosted the collusion of molecules during the reaction. The collision hypothesis was attributed to the drop in primary products for the experimental rate constants at 550 °C. The collusion theory posits that if the Ea is significantly higher than the entire energy of the atoms, the reaction will proceed slowly. Only a small number of rapid molecules can react and generate oil or other products [31]. The number of molecules with the necessary kinetic energy will be higher if the activation energy is significantly less than the kinetic energy of the molecules. Excessive collisions between these molecules will accelerate the pyrolysis process [31]. It was determined that the value of Ea must be less than the molecules’ kinetic energy to overcome this barrier.

6. Comparison with Literature

Yang et al. [32] obtained 43% oil through the fast co-pyrolysis of cedar wood and sunflower stalks at 600 °C. Fast co-pyrolysis of materials is a key inducer of an increased oil yield. The highest oil yield was observed at a temperature of 600 °C, which was substantially higher than the optimized process temperature. The inorganic substance in biomass expedites the breakdown of LDPE. Using LDPE co-pyrolysis, Dewangan et al. [33] achieved 52% oil production at 500 °C. The temperature may have a considerable influence on the product yield. The liquid product of co-pyrolysis of LDPE revealed low water content and a high calorific value of 40 MJ/kg. The hydrogen released by LDPE causes this increase in calorific value, which maintains the free radicals formed during co-pyrolysis. Since co-pyrolysis preferably produces liquids, LDPE serves as a hydrogen donor medium. Fan et al. [34] discovered that at 500 °C, microwave-aided catalytic breakdown of lignin and LDPE produced 77% oil. HZSM-5 and MgO catalysts were used to speed up the process. LDPE is an efficient hydrogen donor to enhance the quality of the liquid product. Methoxyphenols turn to phenol and alkylated phenols at a lignin-to-LDPE ratio of 1:2. MgO boosts phenol alkylation while HZSM-5 promotes the formation of aromatics. The maximum oil production was possible at 500 °C for a lignin-to-LDPE ratio of 3:1. Bu et al. [35] produced an oil yield of 80% at 250–320 °C by using the lignin and LDPE co-pyrolysis process. Raw lignin was less persistent than lignin that had been microwave-torrefied. In microwave pyrolysis, the addition of LDPE increases hydrocarbons and aromatic hydrocarbons by 83 and 22%, respectively, and dramatically decreases phenols. According to Akubo et al. [36], 80% of the petroleum from HPDE decomposition was pyrolyzed in a two-stage fixed-bed fast pyrolysis at 600 °C. Non-catalytic decomposition of HDPE produced 70 wt.% oil with approximately 100% aliphatic hydrocarbon composition. The addition of the catalyst Y-zeolite decreased oil output, even though aromatic hydrocarbons were the major components of the oil. The Y-zeolite catalyst boosted hydrocarbon synthesis and increased hydrogen gas production by loading transition metals such as iron, nickel, gallium, molybdenum, cobalt, and ruthenium. Using metal-promoted Y-zeolite catalysts, the aromatic compounds in the resulting oil were analyzed, and it was discovered that the oil had 97–99% of 1–2 ring aromatic compounds. However, adding 1 wt.% metal boosters to the Y-zeolite resulted in considerable carbon deposition at an increased metal input of 5 wt.%. Uzun et al. [37] investigated the semi-batch co-pyrolysis of biological and PS waste at 500 °C by using a fixed-bed reactor. After treatment, the maximum oil production was predicted to be higher than 65%. Thermal breakdown of PS/HDPE at a 1:2 ratio resulted in a rapid reaction rate and a high liquid yield. The co-pyrolysis produced oil of superior quality to the oil from the single-bench pyrolysis method. C and H concentrations increased while oxygen concentrations dropped at the end of the process. Bio-oil produced through co-pyrolysis has a high calorific value and therefore is an eco-friendlier fuel source. The addition of HDPE in co-pyrolysis not only enhances the quality and quantity of the liquid products but also the dispersion of hydrocarbons. Salem et al. [38] employed a batch reactor to thermally decompose HDPE. They obtained 70% oil at 550 °C. The kinetic characteristics of the first stage of HDPE breakdown revealed high activation energy in a two-step process, but the second stage of decomposition resulted in gases, liquid, and other fractions due to an intramolecular shift of hydrogen and the terminating phase. Khan et al. [39] used pyrolysis to produce oil and gas from HDPE waste. Char generation was reduced due to the high temperature and long reaction times. Volatile chemicals were formed with the reduction in process temperature. After 2 h of polymerization at 330–490 °C, they obtained 77.03% oil. These findings suggest that we can tailor the physicochemical properties of liquid fuels by varying the time and temperature. Rodrguez-Luna et al. [40] pyrolyzed HDPE at 450–550 °C. The production of dienes, alkanes, and alkenes was observed in these investigations. These compounds might have formed as a result of intermolecular H-transformations and β-scissions. Oil has more compounds and short chains compared to wax. A series of studies identified the ideal circumstances for raising the volatile percentage. A volatile fraction equal to 97% of the mass of HDPE was created after 30 min of processing at 500 °C. Park et al. [41] produced 80% oil at 730 °C during a two-step decomposition of polyvinyl chloride waste. Sun et al. [42] tested a sludge char catalyst to decompose plastic waste into liquid fuels and aromatic oil. The feedstock composition, residence time, and catalyst temperature affected the product type and yield. The sensitivity of the catalyst towards monocyclic aromatics was reported as 75% when the catalytic temperature was 600 °C and the residence time was 1 s. The percentage of styrene and xylene in the oil was 29 and 12%, respectively. The catalyst’s selectivity to bicyclic aromatics increased to 64.4% when the temperature was raised to 800 °C and the residence time was kept at 1 s.
Table 7 summarizes the aforementioned discussion. Most studies indicated that reactor geometry affects the final products in the temperature ranges of 500–700 °C. Additionally, obtaining the rate constants through experimental work does not help in obtaining the maximum liquid and gas from the pyrolysis of plastics. To better understand the effectiveness of large-scale conversion of plastics, statistical rate constants are the best choice to estimate petroleum products and gases. Our recent publications [29,30] show various ways to forecast the statistical rate constants. In this work, we estimated rate constants at 500 °C and 550 °C by utilizing RSMin the Design Expert software. This numerical method demonstrated 99% conversion efficiency with the predicted rate constants. Estimating the rate constants statistically can make it possible to acquire commercial-scale petrodiesel from plastic waste. Researchers also mixed pyrolytic liquid oil with diesel and determined that engine performance was better when pyrolytic oil was kept at 20% [43,44,45]. Combining pyrolytic liquid oil with ordinary diesel alters the fuel properties and lengthens the combustion time [46].

7. Conclusions

In this study, we estimated the rate constants at 500 °C and 550 °C using RSM in Design Expert software, which offered a better understanding of the reaction mechanism involved in the pyrolysis of high-density plastics. These rate constants proved helpful in defining the mechanism of commercial-scale pyrolysis of plastic into oil and gas. The efficiency of the projected rate constants was investigated and compared to the findings of the experimental rate constants extracted from the literature. The estimated rate constants at 500 °C favored gas production. Conversely, the rate constants at 550 °C promoted oil yield. It suggests that the pyrolysis process should be carried out at 550 °C for maximum oil yield and suppressed gas production. The statistically predicted rate constants at 550 °C resulted in only 1% byproducts. The experimental rate constants yielded 32% oil, much lower than the oil yield (85%) obtained with the predicted rate constants. At 500 °C, the estimated rate constants did not reveal a significant rise in the oil output since these rate constants favored a high gas yield. The statistically predicted rate constants at 550 °C could be used to estimate the commercial-scale extraction of liquid fuels from the pyrolysis of high-density plastics. It is suggested that the statistical prediction of rate constants is essential for optimizing the process parameters such as activation energy, frequency factor, temperature, and kinetic rate constants.

Author Contributions

Conceptualization, M.I.; data curation, H.A.K.; formal analysis, R.A.U.N. and H.H.; funding acquisition, M.I.; investigation, S.S., S.R., I.K. and S.L.; methodology, H.H. and S.S.; project administration, D.G.-K.; resources, M.Y.N., A.A.J.G. and D.G.-K.; software, H.A.K.; validation, A.A.J.G.; writing—original draft, R.A.U.N. and M.Y.N.; writing—review and editing, S.R., I.K. and S.L. All authors have read and agreed to the published version of the manuscript.

Funding

The APC of the journal was paid by Poznan University of Technology Poland—Project no. 0713/SBAD/0958 financed by the Ministry of Education and Science in Poland.

Data Availability Statement

The reported data is available from the authors on a reasonable request.

Acknowledgments

The authors acknowledge the support from the Deanship of Scientific Research, Najran University, Kingdom of Saudi Arabia, for funding this work under the Research Groups funding program grant code number (NU/RG/SERC/11/7).

Conflicts of Interest

The authors declare no conflict of interest.

References

  1. Tammaro, D.; Walker, C.; Lombardi, L.; Trommsdorff, U. Effect of extrudate swell on extrusion foam of polyethylene terephthalate. J. Cell. Plast. 2020, 57, 911–925. [Google Scholar] [CrossRef]
  2. Qureshi, M.S.; Oasmaa, A.; Pihkola, H.; Deviatkin, I.; Tenhunen, A.; Mannila, J.; Minkkinen, H.; Pohjakallio, M.; Laine-Ylijoki, J. Pyrolysis of plastic waste: Opportunities and challenges. J. Anal. Appl. Pyrolysis 2020, 152, 104804. [Google Scholar] [CrossRef]
  3. Tammaro, D.; Gatta, R.D.; Villone, M.M.; Maffettone, P.L. Continuous 3D Printing of Hierarchically Structured Microfoamed Objects. Adv. Eng. Mater. 2022, 24, 2101226. [Google Scholar] [CrossRef]
  4. Hassan, S.; Haq, I.I.U. Plastics: A brief review of its disasters and degradation techniques. Science 2019, 5, 100–102. [Google Scholar] [CrossRef]
  5. Jie, X.; Li, W.; Slocombe, D.; Gao, Y.; Banerjee, I.; Gonzalez-Cortes, S.; Yao, B.; AlMegren, H.; Alshihri, S.; Dilworth, J.; et al. Microwave-initiated catalytic deconstruction of plastic waste into hydrogen and high-value carbons. Nat. Catal. 2020, 3, 902–912. [Google Scholar] [CrossRef]
  6. Heller, M.C.; Mazor, M.H.; Keoleian, G.A. Plastics in the US: Toward a material flow characterization of production, markets, and end of life. Environ. Res. Lett. 2020, 15, 094034. [Google Scholar] [CrossRef]
  7. Kunwar, B.; Cheng, H.N.; Chandrashekaran, S.R.; Sharma, B.K. A review: Plastics to fuel. Renew. Sustain. Energy Rev. 2016, 54, 421–428. [Google Scholar] [CrossRef]
  8. Harussani, M.M.; Sapuan, S.M.; Rashid, U.; Khalina, A.; Ilyas, R.A. Pyrolysis of polypropylene plastic waste into carbonaceous char: Priority of plastic waste management amidst COVID-19 pandemic. Sci. Total Environ. 2022, 803, 149911. [Google Scholar] [CrossRef]
  9. Saebea, D.; Ruengrit, P.; Arpornwichanop, A.; Patcharavorachot, Y. Gasification of plastic waste for synthesis gas production. Energy Rep. 2020, 6, 202–207. [Google Scholar] [CrossRef]
  10. Domingo, M.J.; Bingwa, N.; Meijboom, R. Review of supported metal nanoparticles: Synthesis methodologies, advantages, and application as catalysts. J. Mater. Sci. 2020, 55, 6195–6241. [Google Scholar]
  11. Maqsood, T.; Dai, J.; Zhang, Y.; Guang, M.; Li, B. Pyrolysis of plastic species: A review of resources and products. J. Anal. Appl. Pyrolysis 2021, 159, 105295. [Google Scholar] [CrossRef]
  12. Arshad, H.; A Sulaiman, S.; Hussain, Z.; Naz, Y.; Basrawi, F. Microwave-assisted pyrolysis of plastic waste for the production of fuels: A review. MATEC Web Conf. 2017, 131, 02005. [Google Scholar] [CrossRef] [Green Version]
  13. Wirawan, R.P. Farizal Plastic Waste Pyrolysis Optimization to Produce Fuel Grade Using Factorial Design. E3S Web Conf. 2019, 125, 13005. [Google Scholar] [CrossRef]
  14. Joppert, N., Jr.; da Silva, A.A.; Marques, M.R. Enhanced diesel fuel fraction from waste high-density polyethylene and heavy gas oil pyrolysis using factorial design methodology. Waste Manag. 2015, 36, 166–176. [Google Scholar] [CrossRef] [PubMed]
  15. Pinto, F.; Paradela, F.; Gulyurtlu, I.; Ramos, A.M. Prediction of liquid yields from the pyrolysis of waste mixtures using response surface methodology. Fuel Process. Technol. 2013, 116, 271–283. [Google Scholar] [CrossRef]
  16. Inayat, M.; Sulaiman, S.A.; Inayat, A.; Shaik, N.B.; Gilal, A.R.; Shahbaz, M. Modeling and parametric optimization of air catalytic co-gasification of wood-oil palm fronds blend for clean syngas (H2+CO) production. Int. J. Hydrog. Energy 2021, 46, 30559–30580. [Google Scholar] [CrossRef]
  17. Ali, A.M.; Inayat, M.; Zahrani, A.A.; Shahzad, K.; Shahbaz, M.; Sulaiman, S.A.; Sadig, H. Process optimization and economic evaluation of air gasification of Saudi Arabian date palm fronds for H2-rich syngas using response surface methodology. Fuel 2022, 316, 123359. [Google Scholar] [CrossRef]
  18. Krishna, J.J.; Korobeinichev, O.P.; Vinu, R. Isothermal fast pyrolysis kinetics of synthetic polymers using analytical Pyroprobe. J. Anal. Appl. Pyrolysis 2019, 139, 48–58. [Google Scholar] [CrossRef]
  19. Harmon, R.E.; SriBala, G.; Broadbelt, L.J.; Burnham, A.K. Insight into Polyethylene and Polypropylene Pyrolysis: Global and Mechanistic Models. Energy Fuels 2021, 35, 6765–6775. [Google Scholar] [CrossRef]
  20. Senneca, O.; Tucciullo, T. Lumped Kinetics for Homogeneous Reactions of n-Hexadecane and n-Decene as Model Compounds for PE Pyrolysis Primary Tars. Energies 2020, 13, 5466. [Google Scholar] [CrossRef]
  21. Al-Salem, S.M.; Lettieri, P. Kinetic study of high density polyethylene (HDPE) pyrolysis. Chem. Eng. Res. Des. 2010, 88, 1599–1606. [Google Scholar] [CrossRef]
  22. Saunders, K.J. Organic Polymer Chemistry: An Introduction to the Organic Chemistry of Adhesives, Fibres, Paints, plastics and Rubbers; Springer Science & Business Media: Berlin/Heidelberg, Germany, 2012. [Google Scholar]
  23. Diaz-Silvarrey, L.S.; McMahon, A.; Phan, A.N. Benzoic acid recovery via waste poly(ethylene terephthalate) (PET) catalytic pyrolysis using sulphated zirconia catalyst. J. Anal. Appl. Pyrolysis 2018, 134, 621–631. [Google Scholar] [CrossRef] [Green Version]
  24. Bracco, P.; Costa, L.; Luda, M.P.; Billingham, N. A review of experimental studies of the role of free-radicals in polyethylene oxidation. Polym. Degrad. Stab. 2018, 155, 67–83. [Google Scholar] [CrossRef]
  25. Eidesen, H.; Khawaja, H.; Jackson, S. Simulation of the HDPE Pyrolysis Process. Int. J. Multiphysics 2018, 12, 79–88. [Google Scholar]
  26. Balboa, P. BalbiaPesific. 2004. Available online: http://www.balboapacific.com/Papers/HistoryOfPyrolysis.pdf (accessed on 3 November 2016).
  27. Debecker, D.P.; Le Bras, S.; Boissière, C.; Chaumonnot, A.; Sanchez, C. Aerosol processing: A wind of innovation in the field of advanced heterogeneous catalysts. Chem. Soc. Rev. 2018, 47, 4112–4155. [Google Scholar] [CrossRef]
  28. Norsk, k. Polymerisasjonskjemi. 2007. Available online: http://www.naturfag.no/artikkel/vis.html?tid=689055 (accessed on 18 November 2016).
  29. Alqarni, A.O.; Nabi RA, U.; Althobiani, F.; Naz, M.Y.; Shukrullah, S.; Khawaja, H.A.; Bou-Rabee, M.A.; Gommosani, M.E.; Abdushkour, H.; Irfan, M.; et al. Statistical Optimization of Pyrolysis Process for Thermal Destruction of Plastic Waste Based on Temperature-Dependent Activation Energies and Pre-Exponential Factors. Processes 2022, 10, 1559. [Google Scholar] [CrossRef]
  30. Nabi, R.A.U.; Naz, M.Y.; Shukrullah, S.; Ghamkhar, M.; Rehman, N.U.; Irfan, M.; Alqarni, A.O.; Legutko, S.; Kruszelnicka, I.; Ginter-Kramarczyk, D.; et al. Analysis of Statistically Predicted Rate Constants for Pyrolysis of High-Density Plastic Using R Software. Materials 2022, 15, 5910. [Google Scholar] [CrossRef]
  31. Piskulich, Z.A.; Thompson, W.H. Examining the role of different molecular interactions on activation energies and activation volumes in liquid water. J. Chem. Theory Comput. 2021, 17, 2659–2671. [Google Scholar] [CrossRef]
  32. Yang, J.; Rizkiana, J.; Widayatno, W.B.; Karnjanakom, S.; Kaewpanha, M.; Hao, X.; Abudula, A.; Guanac, G. Fast co-pyrolysis of low density polyethylene and biomass residue for oil production. Energy Convers. Manag. 2016, 120, 422–429. [Google Scholar] [CrossRef]
  33. Dewangan, A.; Pradhan, D.; Singh, R.K. Co-pyrolysis of sugarcane bagasse and low-density polyethylene: Influence of plastic on pyrolysis product yield. Fuel 2016, 185, 508–516. [Google Scholar] [CrossRef]
  34. Fan, L.; Chen, P.; Zhang, Y.; Liu, S.; Liu, Y.; Wang, Y.; Dai, L.; Ruan, R. Fast microwave-assisted catalytic co-pyrolysis of lignin and low-density polyethylene with HZSM-5 and MgO for improved bio-oil yield and quality. Bioresour. Technol. 2017, 225, 199–205. [Google Scholar] [CrossRef] [PubMed]
  35. Bu, Q.; Chen, K.; Xie, W.; Liu, Y.; Cao, M.; Kong, X.; Chu, Q.; Mao, H. Hydrocarbon rich bio-oil production, thermal behavior analysis and kinetic study of microwave-assisted co-pyrolysis of microwave-torrefied lignin with low density polyethylene. Bioresour. Technol. 2019, 291, 121860. [Google Scholar] [CrossRef] [PubMed]
  36. Akubo, K.; Nahil, M.A.; Williams, P.T. Aromatic fuel oils produced from the pyrolysis-catalysis of polyethylene plastic with metal-impregnated zeolite catalysts. J. Energy Inst. 2019, 92, 195–202. [Google Scholar] [CrossRef]
  37. Önal, E.; Uzun, B.B.; Pütün, A.E. An experimental study on bio-oil production from co-pyrolysis with potato skin and high-density polyethylene (HDPE). Fuel Processing Technol. 2012, 104, 365–370. [Google Scholar] [CrossRef]
  38. Al-Salem, S.M. Thermal pyrolysis of high-density polyethylene (HDPE) in a novel fixed bed reactor system for the production of high-value gasoline range hydrocarbons (HC). Process Saf. Environ. Prot. 2019, 127, 171–179. [Google Scholar] [CrossRef]
  39. Khan, M.Z.H.; Sultana, M.; Al-Mamun, M.R.; Hasan, M.R. Pyrolytic Waste Plastic Oil and Its Diesel Blend: Fuel Characterization. J. Environ. Public Health 2016, 2016, 1–6. [Google Scholar] [CrossRef] [Green Version]
  40. Rodríguez-Luna, L.; Bustos-Martínez, D.; Valenzuela, E. Two-step pyrolysis for waste HDPE valorization. Process Saf. Environ. Prot. 2021, 149, 526–536. [Google Scholar] [CrossRef]
  41. Park, K.B.; Choi, M.J.; Chae, D.Y.; Jung, J.; Kim, J.S. Separate two-step and continuous two-stage pyrolysis of a waste plastic mixture to produce a chlorine-depleted oil. Energy 2022, 244, 122583. [Google Scholar] [CrossRef]
  42. Sun, K.; Themelis, N.J.; Bourtsalas, A.; Huang, Q. Selective production of aromatics from waste plastic pyrolysis by using sewage sludge derived char catalyst. J. Clean. Prod. 2020, 268, 122038. [Google Scholar] [CrossRef]
  43. Demirbas, A. Pyrolysis of municipal plastic wastes for recovery of gasoline range hydrocarbons. J. Anal. Appl. Pyrolysis 2004, 72, 97–102. [Google Scholar] [CrossRef]
  44. Gardy, J.; Hassanpour, A.; Lai, X.; Cunliffe, A.; Rehan, M. The influence of blending process on the quality of rapeseed oil-used cooking oil biodiesels. Int. Sci. J. Environ. Sci. 2014, 3, 233–240. [Google Scholar]
  45. Islam, M.R.; Parveen, M.; Haniu, H.; Sarker, M.I. Innovation in pyrolysis technology for the management of scrap tire: A solution of Energy and Environment. Int. J. Environ. Sci. Dev. 2010, 1, 89–96. [Google Scholar] [CrossRef]
  46. Lee, S.; Yoshida, K.; Yoshikawa, K. Application of waste plastic pyrolysis oil in a direct injection diesel engine: For a small scale non-grid electrification. Energy Environ. Res. 2015, 5, 18–32. [Google Scholar] [CrossRef]
Figure 1. The entire cycle of generation, usage, consumption, dumping, and recycling of plastics.
Energies 15 09594 g001
Figure 2. Verification of runs for maximum and minimum values of dependent and independent factors at (a) 500 °C and (b) 550 °C.
Energies 15 09594 g002
Figure 3. Predictedsevenrate constants for each model: (a) 3D verification of the predicted rate constants at 500 °C. (b) 2D confirmation of the predicted rate constants at 500 °C. (c) 3D verification of the predicted rate constants at 550 °C. (d) 2D verification of the predicted rate constants at 550 °C.
Energies 15 09594 g003
Figure 4. (a) Concept of free radicals, (b) space-filling, and (c) the chemical structure of high-density plastics.
Energies 15 09594 g004
Figure 5. Depiction of the analytical model process based on the reaction rate constants.
Energies 15 09594 g005
Figure 6. Comparison of the percentage yields of (a) the experimental rate constants at 500 °C, (b) the statistical rate constants at 500 °C, (c) the experimental rate constants at 550 °C, and (d) the statistical rate constants at 550 °C.
Energies 15 09594 g006
Figure 7. The time-dependent conversion of HDPE into species as a function of time and temperature: (a) the experimental rate constants at 500 °C, (b) the statistical rate constants at 500 °C, (c) the experimental rate constants at 550 °C, and (d) the statistical rate constants at 550 °C.
Energies 15 09594 g007
Table 1. The setting of RSM model for pyrolysis at 500 °C and 550 °C.
Settings500 °C550 °C
Study TypeResponse SurfaceResponse Surface
Design TypeBox–BehnkenBox–Behnken
Design ModelQuadraticQuadratic
Build Time (ms)1.00002.00
SubtypeRandomizedRandomized
Runs1515
BlocksNo BlocksNo Blocks
Table 2. The factors and responses for the predicted model.
At 500 °C
FactorUnitsTypeMinimumMaximumCoded LowCoded HighMeanStd. Dev.
AJ/molNumeric7000.001.200 × 105−1 ↔ 7000.00+1 ↔120,00063,500.0042,709.99
BL-mol/sNumeric15.0025.00−1 ↔ 15.00+1 ↔ 25.0020.003.78
CCNumeric500.00600.00−1 ↔ 500.00+1 ↔ 600.00550.0037.80
Resp.AnalysisMin.Max.MeanStd. Dev.RatioTrans.Model
R1 = kAPolynomial00.00130.00040.0004Not applicableNoneLinear
At 550 °C
A = EaJ/molNumeric7000.001.500 × 105−1 ↔ 7000.00+1 ↔150,00078,500.0054,048.92
B = AoL-mol/sNumeric19.0030.00−1 ↔ 19.00+1 ↔ 30.0024.504.16
C = T°CNumeric500.00600.00−1 ↔ 500.00+1 ↔ 600.00550.0037.80
Resp.AnalysisMin.Max.MeanStd. Dev.RatioTrans.Model
R2 = kBPolynomial0.00010.0090.00210.003390.00NoneQuadratic
Table 3. ANOVA for the suggested and analyzed model at different temperatures.
At 500 °C
SourceSum of SquaresMean SquareF-Valuep-Value
Model1.452 × 1064.842 × 1073.870.0411Significant
A-Ea7.200 × 1077.200 × 1075.750.0353
B-Ao2.812 × 1072.812 × 1072.250.1620
C-T4.512 × 1074.512 × 1073.610.0841
Residual1.377 × 1061.252 × 107
Lack of Fit1.290 × 1061.434 × 1073.310.2537Not significant
Pure Error8.667 × 10824.333 × 108
Cor Total2.829 × 10614
Adj. R2 = 0.5752Pred. R2 = 0.3651
At 550 °C
Model0.00010.00006.130.0300Significant
A-Ea5.611 × 1065.611 × 1062.240.1950
B-Ao0.00000.00006.590.0502
C-T5.000 × 1095.000 × 1090.00200.9661
AB0.00000.00009.770.0261
AC9.000 × 1089.000 × 1080.03590.8572
BC0.00000.000018.430.0078
A24.434 × 1064.434 × 1061.770.2411
B20.00000.000014.640.0123
C22.854 × 1062.854 × 1061.140.3349
Residual0.00002.509 × 106
Lack of Fit0.00003.966 × 10612.270.0763Not significant
Pure Error6.467 × 1073.233 × 107
Cor Total0.0002
Adj. R2= −0.0859Pred. R2= −0.7746
Table 4. Coefficients are calculated in the form of coded factors.
At 500 °C
FactorCoefficient EstimateStandard Error95% CI Low95% CI HighVIF
Intercept0.00040.00010.00020.0006
A-Ea−0.00030.0001−0.0006−0.00001.0000
B-Ao0.00020.0001−0.00010.00051.0000
C-T0.00020.0001−0.00000.00051.0000
At 550 °C
Intercept0.00060.0009−0.00180.0029
A-Ea−0.00080.0006−0.00230.00061.0000
B-Ao−0.00140.0006−0.00292.035 × 1061.0000
C-T−0.00000.0006−0.00150.00141.0000
AB0.00250.00080.00040.00451.0000
AC−0.00010.0008−0.00220.00191.0000
BC−0.00340.0008−0.0054−0.00141.0000
A2−0.00110.0008−0.00320.00101.0000
B20.00320.00080.00100.00531.0000
C20.00090.0008−0.00120.00301.0000
Table 5. The predicted rate constants with suggested Ea and Ao at different temperatures.
Experimentally Fixed Rate ConstantsStatistically Predicted with Suggested Combination of Ea and Ao
At 500 °CAt 550 °C
500550EaAokAEaAokB
k(1) = 0.0015k(1) = 0.008J/molL-mol/sN/AJ/molL-mol/sN/A
k(2) = 0.001k(2) = 0.004258,50030.5k(1) = 0.001263,50020k(1) = 0.0012
k(3) = 0.0006k(3) = 0.004217,00021k(2) = 0.0009700015k(2) = 0.009
k(4) = 0.0004k(4) = 0.003717,00040k(3) = 0.0004700025k(3) = 0.0001
k(5) = 0.003k(5) = 0.004258,50030.5k(4) = 0.00120,00015k(4) = 0.0002
k(6) = 0.003k(6) = 0.0034100,00021k(5) = 0.000163,50020k(5) = 0.0001
k(7) = 0.0002k(7) = 0.0009100,00040k(6) = 0.00063,50020k(6) = 0.0004
58,50030.5k(7) = 0.0001120,00025k(7) = 0.0012
Table 6. The time-dependent conversion of HDPE into the final products.
Time HDPEGas OilWaxAromaticsChar
Minutes(%)
Experimental at 500 °C
155372911117
30038337134
60038362153
Statistical at 500 °C
15844311303
30045341313
6004634333
Experimental at 550 °C
150323001817
300323001817
600323001817
Statistical at 550 °C
1501185011
3001185011
6001185011
Table 7. Comparison of the percentage yield of liquid fuel from different types of plastic at different temperatures.
Waste Type MethodTemperatureYield (%)Reference
HDPECo-pyrolysis600 °C43.36[32]
LDPECo-pyrolysis500 °C52.75[33]
LDPECo-pyrolysis500 °C77.01[34]
LDPECo-pyrolysis250–320 °C80[35]
LDPEPyrolysis600 °C70[36]
HDPEPyrolysis330–490 °C76[37]
HDPEPyrolysis450–550 °C77[38]
HDPETwo-step Pyrolysis730 °C80[39]
MixPyrolysis800 °C53[40]
HDPEPyrolysis535–675 °C57[41]
PP, PEPyrolysis420 °C80[42]
HDPEPyrolysis 500–550 °C85%Current study
Publisher’s Note: MDPI stays neutral with regard to jurisdictional claims in published maps and institutional affiliations.

