

Analysis of the Productivity Dynamics of Electricity Distribution Regions in Ghana

Abstract
:1. Introduction
2. Methods
2.1. The Basic Malmquist Model
2.2. The SBM-BMPI
2.3. DATA
3. Results
4. Discussion
Comparision of Results
5. Conclusions
Author Contributions
Funding
Data Availability Statement
Acknowledgments
Conflicts of Interest
References
- Energy Commission. 2019 Energy (Supply and Demand) Outlook for Ghana; Energy Commission: Accra, Ghana, 2019; p. 50. [Google Scholar]
- Acheampong, T.; Ankrah, F. Ghana Energy Situation Report Q1,2014 - Pricing and Deregulation of the Energy Sector IN Ghana: Challenges & Prospects; Imani Ghana: Accra, Ghana, 2015; pp. 1–12. [Google Scholar]
- Amoako-Tuffour, D.J.; Asamoah, D.J. “Thinking Big” and Reforming Ghana’s “Energy Sector”; Acet: Accra, Ghana, 2015. [Google Scholar]
- ECG. 2019 Annual Report & Financial Statement; ECG: Accra, Ghana, 2019; p. 5. [Google Scholar]
- ECG. 2017 Annual Report & Financial Statement; ECG: Accra, Ghana, 2017; p. 5. [Google Scholar]
- ECG. 2011_ECG AnnualReport.pdf; ECG: Accra, Ghana, 2011. [Google Scholar]
- ECG. 2020 Annual Report & Financial Statement; ECG: Accra, Ghana, 2020; p. 5. [Google Scholar]
- ECG. 2013 Annual Report & Financial Statement; EECG: Accra, Ghana, 2013. [Google Scholar]
- ECG. 2012 Annual Report & Financial Statements; ECG: Accra, Ghana, 2012. [Google Scholar]
- Energy Commission. 2020 ENERGY (SUPPLY AND DEMAND) OUTLOOK FOR GHANA; Energy Commission: Accra, Ghana, 2020. [Google Scholar]
- Chingwete, A.; Felton, J.; Logan, C. Prerequisite for Progress: Accessible, Reliable Power Still in Short Supply Across Africa; Afro Barometer: Accra, Ghana, 2019. [Google Scholar]
- Caves, D.W.; Christensen, L.R.; Diewert, W.E. The Economic Theory of Index Numbers and the Measurement of Input, Output, and Productivity. Econometrica 1982, 50, 1393–1414. [Google Scholar] [CrossRef]
- Malmquist, S. Index Numbers and Indifference Surfaces. Trab. Estad. 1953, 4, 209–242. [Google Scholar] [CrossRef]
- Färe, R.; Grosskopf, S.; Lindgren, B.; Roos, P. Productivity changes in Swedish pharamacies 1980–1989: A non-parametric Malmquist approach. In International Applications of Productivity and Efficiency Analysis; Springer: Berlin, Germany, 1992; pp. 81–97. [Google Scholar]
- Debreu, G. The Coefficient of Resource Utilization. Econometrica 1951, 19, 273–292. [Google Scholar] [CrossRef]
- Shephard, R.W. Cost and Production Functions; Princeton University Press: Princeton, NJ, USA, 1953. [Google Scholar]
- Färe, R.; Grosskopf, S.; Logan, J. The relative efficiency of Illinois electric utilities. Resour. Energy 1983, 5, 349–367. [Google Scholar] [CrossRef]
- Cambini, C.; Croce, A.; Fumagalli, E. Output-based incentive regulation in electricity distribution: Evidence from Italy. Energy Econ. 2014, 45, 205–216. [Google Scholar] [CrossRef] [Green Version]
- Çelen, A.; Yalçın, N. Performance assessment of Turkish electricity distribution utilities: An application of combined FAHP/TOPSIS/DEA methodology to incorporate quality of service. Util. Policy 2012, 23, 59–71. [Google Scholar] [CrossRef]
- Abbott, M. The productivity and efficiency of the Australian electricity supply industry. Energy Econ. 2006, 28, 444–454. [Google Scholar] [CrossRef]
- Pombo, C.; Taborda, R. Performance and efficiency in Colombia’s power distribution system: Effects of the 1994 reform. Energy Econ. 2006, 28, 339–369. [Google Scholar] [CrossRef]
- Estache, A.; Tovar, B.; Trujillo, L. How efficient are African electricity companies? Evidence from the Southern African countries. Energy Policy 2008, 36, 1969–1979. [Google Scholar] [CrossRef]
- Chen, L.C.; Lu, W.M.; Yang, C. Does knowledge management matter? Assessing the performance of electricity distribution districts based on slacks-based data envelopment analysis. J. Oper. Res. Soc. 2009, 60, 1583–1593. [Google Scholar] [CrossRef]
- Ramos-Real, F.J.; Tovar, B.; Iootty, M.; de Almeida, E.F.; Pinto Jr., H.Q. The evolution and main determinants of productivity in Brazilian electricity distribution 1998–2005: An empirical analysis. Energy Econ. 2009, 31, 298–305. [Google Scholar] [CrossRef] [Green Version]
- Tovar, B.; Javier Ramos-Real, F.; de Almeida, E.F. Firm size and productivity. Evidence from the electricity distribution industry in Brazil. Energy Policy 2011, 39, 826–833. [Google Scholar] [CrossRef]
- Pérez-Reyes, R.; Tovar, B. Measuring efficiency and productivity change (PTF) in the Peruvian electricity distribution companies after reforms. Energy Policy 2009, 37, 2249–2261. [Google Scholar] [CrossRef]
- Aghdam, R.F. Dynamics of productivity change in the Australian electricity industry: Assessing the impacts of electricity reform. Energy Policy 2011, 39, 3281–3295. [Google Scholar] [CrossRef]
- Çelen, A. Efficiency and productivity (TFP) of the Turkish electricity distribution companies: An application of two-stage (DEA&Tobit) analysis. Energy Policy 2013, 63, 300–310. [Google Scholar] [CrossRef]
- Fallahi, A.; Fallahi, F.; Sarhadi, H.; Ghaderi, S.F.; Ebrahimi, R. Application of a robust data envelopment analysis model for performance evaluation of electricity distribution companies. Int. J. Energy Sect. Manag. 2021, 15, 724–742. [Google Scholar] [CrossRef]
- Galán, J.E.; Pollitt, M.G. Inefficiency persistence and heterogeneity in Colombian electricity utilities. Energy Econ. 2014, 46, 31–44. [Google Scholar] [CrossRef] [Green Version]
- Gómez-Calvet, R.; Conesa, D.; Gómez-Calvet, A.R.; Tortosa-Ausina, E. Energy efficiency in the European Union: What can be learned from the joint application of directional distance functions and slacks-based measures? Appl. Energy 2014, 132, 137–154. [Google Scholar] [CrossRef]
- Tavassoli, M.; Faramarzi, G.R.; Farzipoor Saen, R. Ranking electricity distribution units using slacks-based measure, strong complementary slackness condition, and discriminant analysis. Int. J. Electr. Power Energy Syst. 2015, 64, 1214–1220. [Google Scholar] [CrossRef]
- Simar, L.; Wilson, P.W. Estimating and bootstrapping Malmquist indices. Eur. J. Oper. Res. 1999, 115, 459–471. [Google Scholar] [CrossRef]
- Simar, L.; Wilson, P.W. Sensitivity Analysis of Efficiency Scores: How to Bootstrap in Nonparametric Frontier Models. Manag. Sci. 1998, 44, 49–61. [Google Scholar] [CrossRef] [Green Version]
- Simar, L.; Wilson, P.W. A general methodology for bootstrapping in non-parametric frontier models. J. Appl. Stat. 2000, 27, 779–802. [Google Scholar] [CrossRef]
- Lee, B.L.; Wilson, C.; Simshauser, P.; Majiwa, E. Deregulation, efficiency and policy determination: An analysis of Australia’s electricity distribution sector. Energy Econ. 2021, 98, 105210. [Google Scholar] [CrossRef]
- Romer, P.M. Increasing Returns and Long-Run Growth. J. Political Econ. 1986, 94, 1002–1037. [Google Scholar] [CrossRef] [Green Version]
- Lucas, R.E. On the mechanics of economic development. J. Monet. Econ. 1988, 22, 3–42. [Google Scholar] [CrossRef]
- Romer, P.M. Endogenous Technological Change. J. Political Econ. 1990, 98, S71–S102. [Google Scholar] [CrossRef] [Green Version]
- Aghion, P.; Howitt, P. A Model of Growth Through Creative Destruction. Econometrica 1992, 60, 323–351. [Google Scholar] [CrossRef]
- Los, B.; Verspagen, B. R&D spillovers and productivity: Evidence from US manufacturing microdata. Empir. Econ. 2000, 25, 127–148. [Google Scholar]
- Sena, V. Total factor productivity and the spillover hypothesis: Some new evidence. Int. J. Prod. Econ. 2004, 92, 31–42. [Google Scholar] [CrossRef]
- Medda, G.; Piga, C.A. Technological spillovers and productivity in Italian manufacturing firms. J. Product. Anal. 2014, 41, 419–434. [Google Scholar] [CrossRef] [Green Version]
- Färe, R.; Grosskopf, S.; Lindgren, B.; Roos, P. Productivity Developments in Swedish Hospitals: A Malmquist Output Index Approach. In Data Envelopment Analysis: Theory, Methods and Applications; Charnes, A., Cooper, W.W., Lewin, A.Y., Seiford, L.M., Eds.; Springer: Dordrecht, The Netherlands, 1994; pp. 253–272. [Google Scholar]
- Pastor, J.T.; Asmild, M.; Lovell, C.A.K. The biennial Malmquist productivity change index. Socio-Econ. Plan. Sci. 2011, 45, 10–15. [Google Scholar] [CrossRef]
- Ray, S.C.; Desli, E. Productivity Growth, Technical Progress, and Efficiency Change in Industrialized Countries: Comment. Am. Econ. Rev. 1997, 87, 1033–1039. [Google Scholar]
- Shestalova, V. Sequential Malmquist Indices of Productivity Growth: An Application to OECD Industrial Activities. J. Product. Anal. 2003, 19, 211–226. [Google Scholar] [CrossRef]
- Pastor, J.T.; Lovell, C.A.K. A global Malmquist productivity index. Econ. Lett. 2005, 88, 266–271. [Google Scholar] [CrossRef]
- Tone, K. A slacks-based measure of efficiency in data envelopment analysis. Eur. J. Oper. Res. 2001, 130, 498–509. [Google Scholar] [CrossRef] [Green Version]
- Li, Q. Nonparametric testing of closeness between two unknown distribution functions. Econom. Rev. 1996, 15, 261–274. [Google Scholar] [CrossRef]
- US Army Corps of Engineers. Power Distribution Feasibility Studies, Phase II Report, Electricity Company of Ghana; Millennium Development Authority (MiDA): Accra, Ghana, 2014; pp. 1–349. [Google Scholar]
- Parteka, A.; Wolszczak-Derlacz, J. Dynamics of productivity in higher education: Cross-european evidence based on bootstrapped Malmquist indices. J. Product. Anal. 2013, 40, 67–82. [Google Scholar] [CrossRef] [Green Version]
- ECG. ECG: Proposal for Review in Distribution Service Charge, June 2013; ECG: Accra, Ghana, 2013; pp. 1–57. [Google Scholar]
- Grossman, G.M.; Helpman, E. Endogenous Innovation in the Theory of Growth. J. Econ. Perspect. 1994, 8, 23–44. [Google Scholar] [CrossRef]


| Region | Year | No. of Employees | Transformer Capacity | Network | No. of Customers | Revenue | Losses |
|---|---|---|---|---|---|---|---|
| ACCRA EAST | 2018 | 212 | 960,083.00 | 2,011,568.97 | 500,815 | 1,123,164,596.40 | 882.72 |
| ACCRA WEST | 2018 | 182 | 868,790.00 | 1,809,136.52 | 610,653 | 940,283,051.80 | 775.80 |
| TEMA | 2018 | 209 | 755,041.00 | 2,639,135.70 | 416,003 | 1,092,372,428.88 | 71.14 |
| ASHANTI WEST | 2018 | 363 | 847,973.00 | 4,858,127.61 | 868,004 | 754,363,237.78 | 314.60 |
| WESTERN | 2018 | 174 | 580,073.50 | 7,465,034.10 | 471,586 | 594,946,973.11 | 217.87 |
| CENTRAL | 2018 | 185 | 314,735.00 | 3,788,527.94 | 448,522 | 296,121,583.42 | 196.01 |
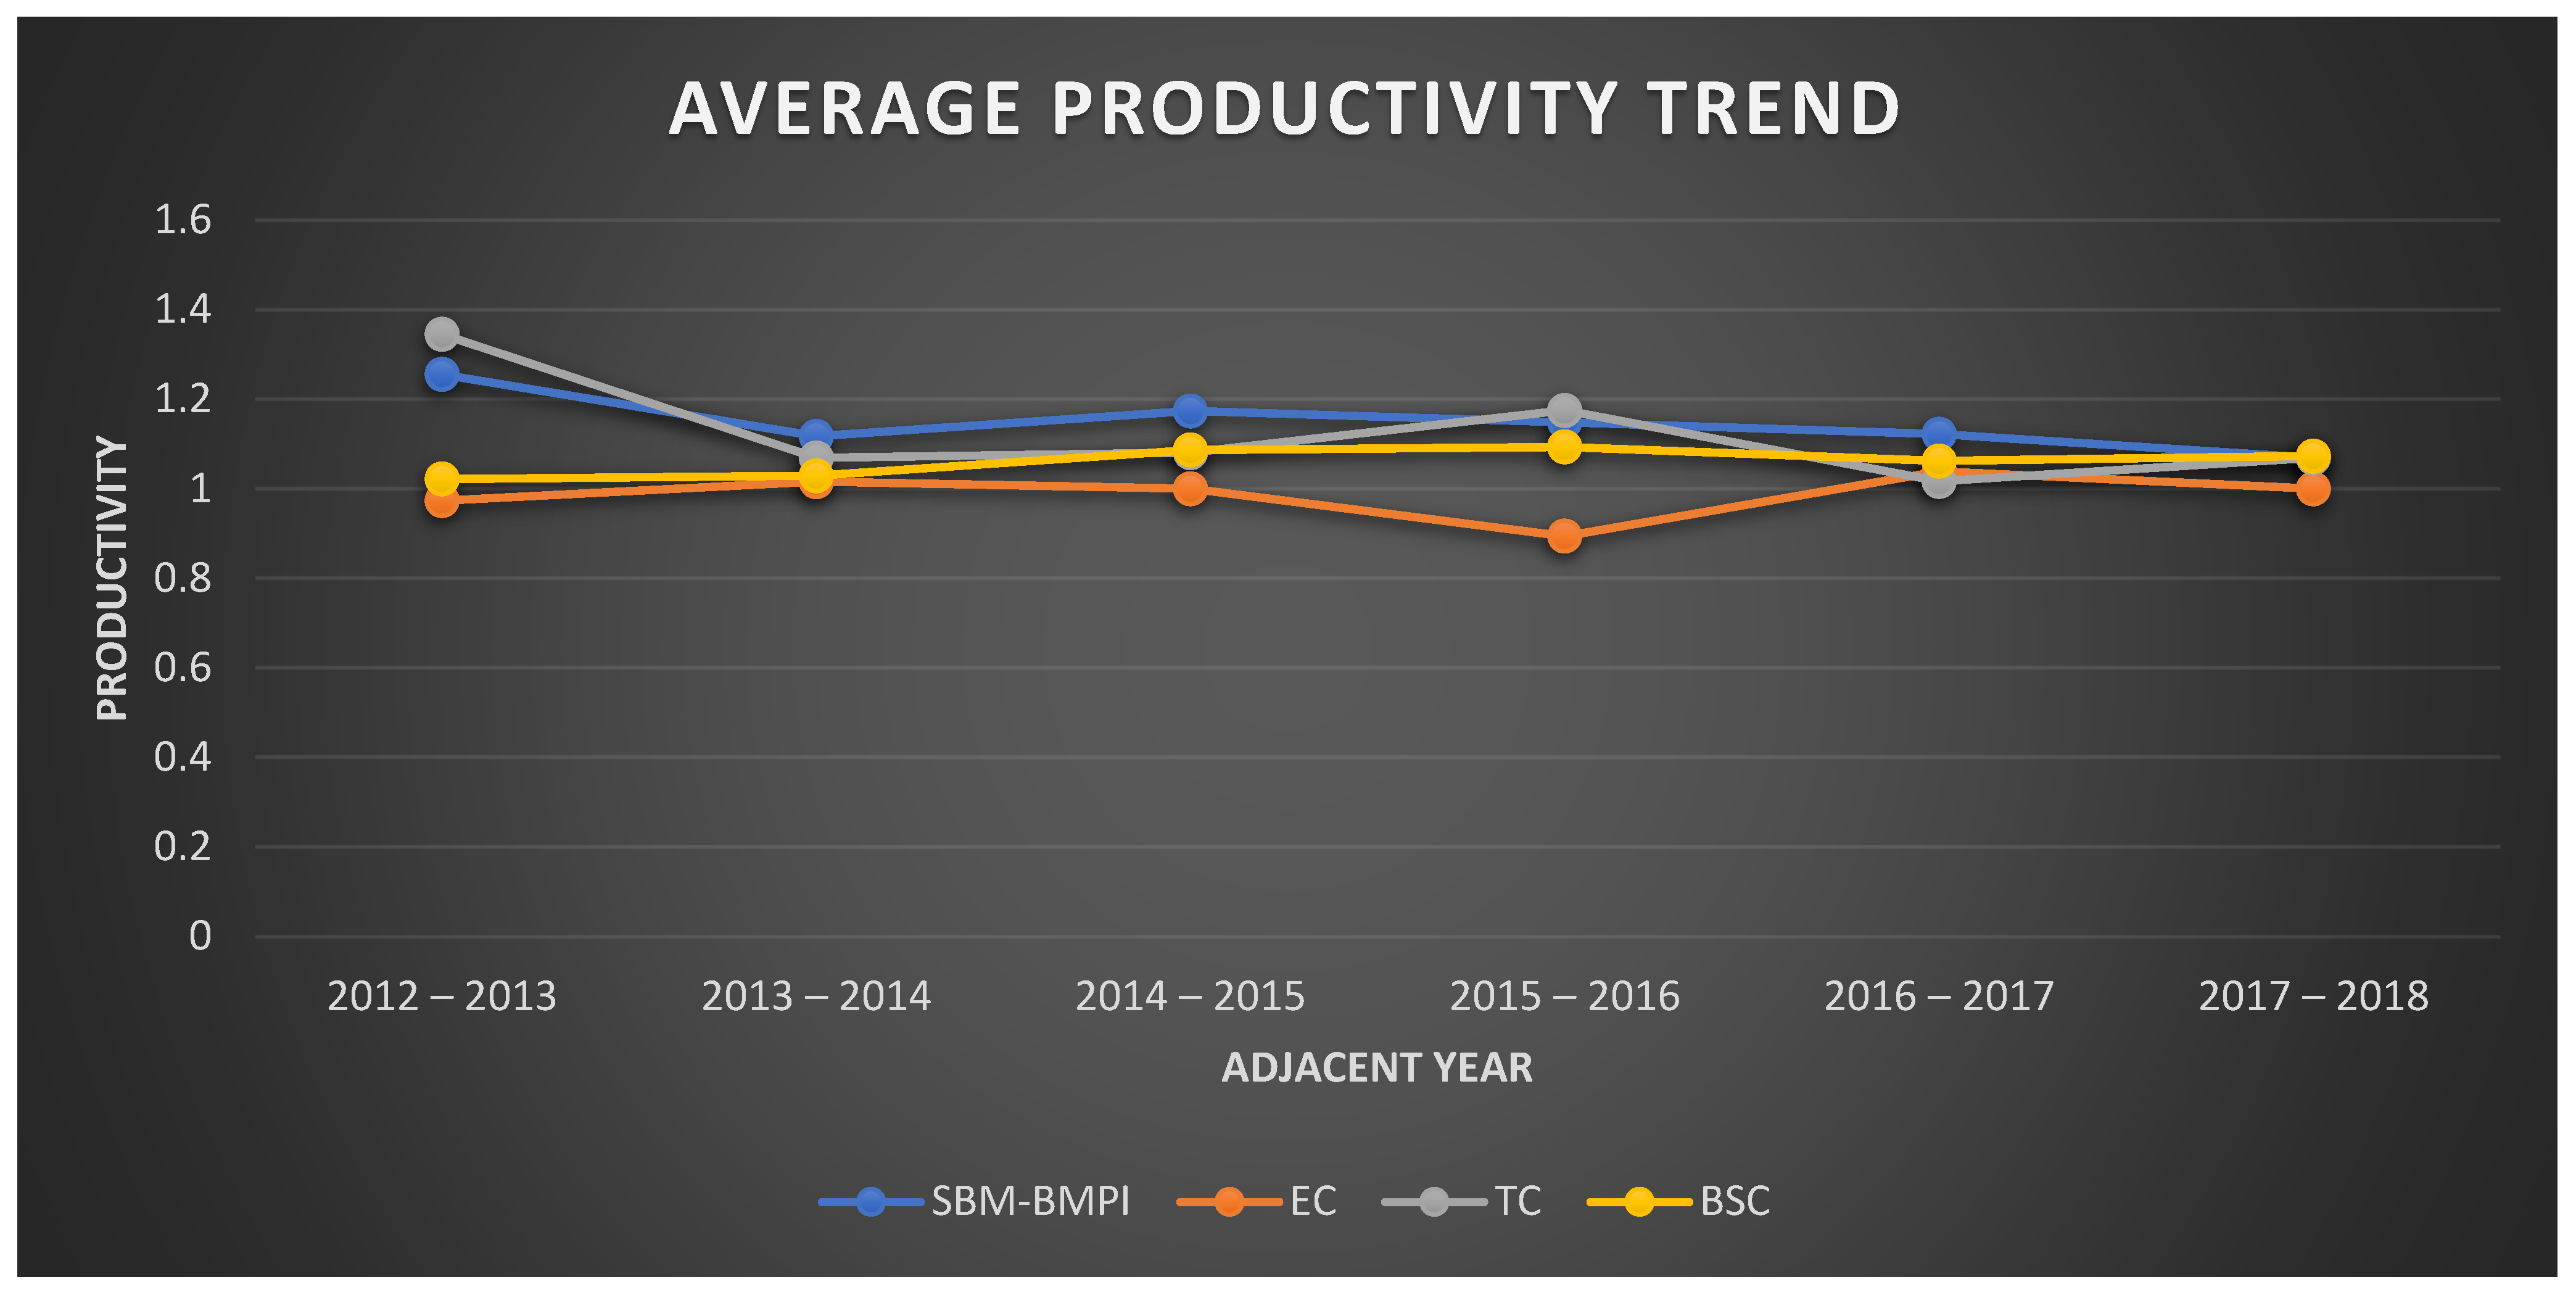
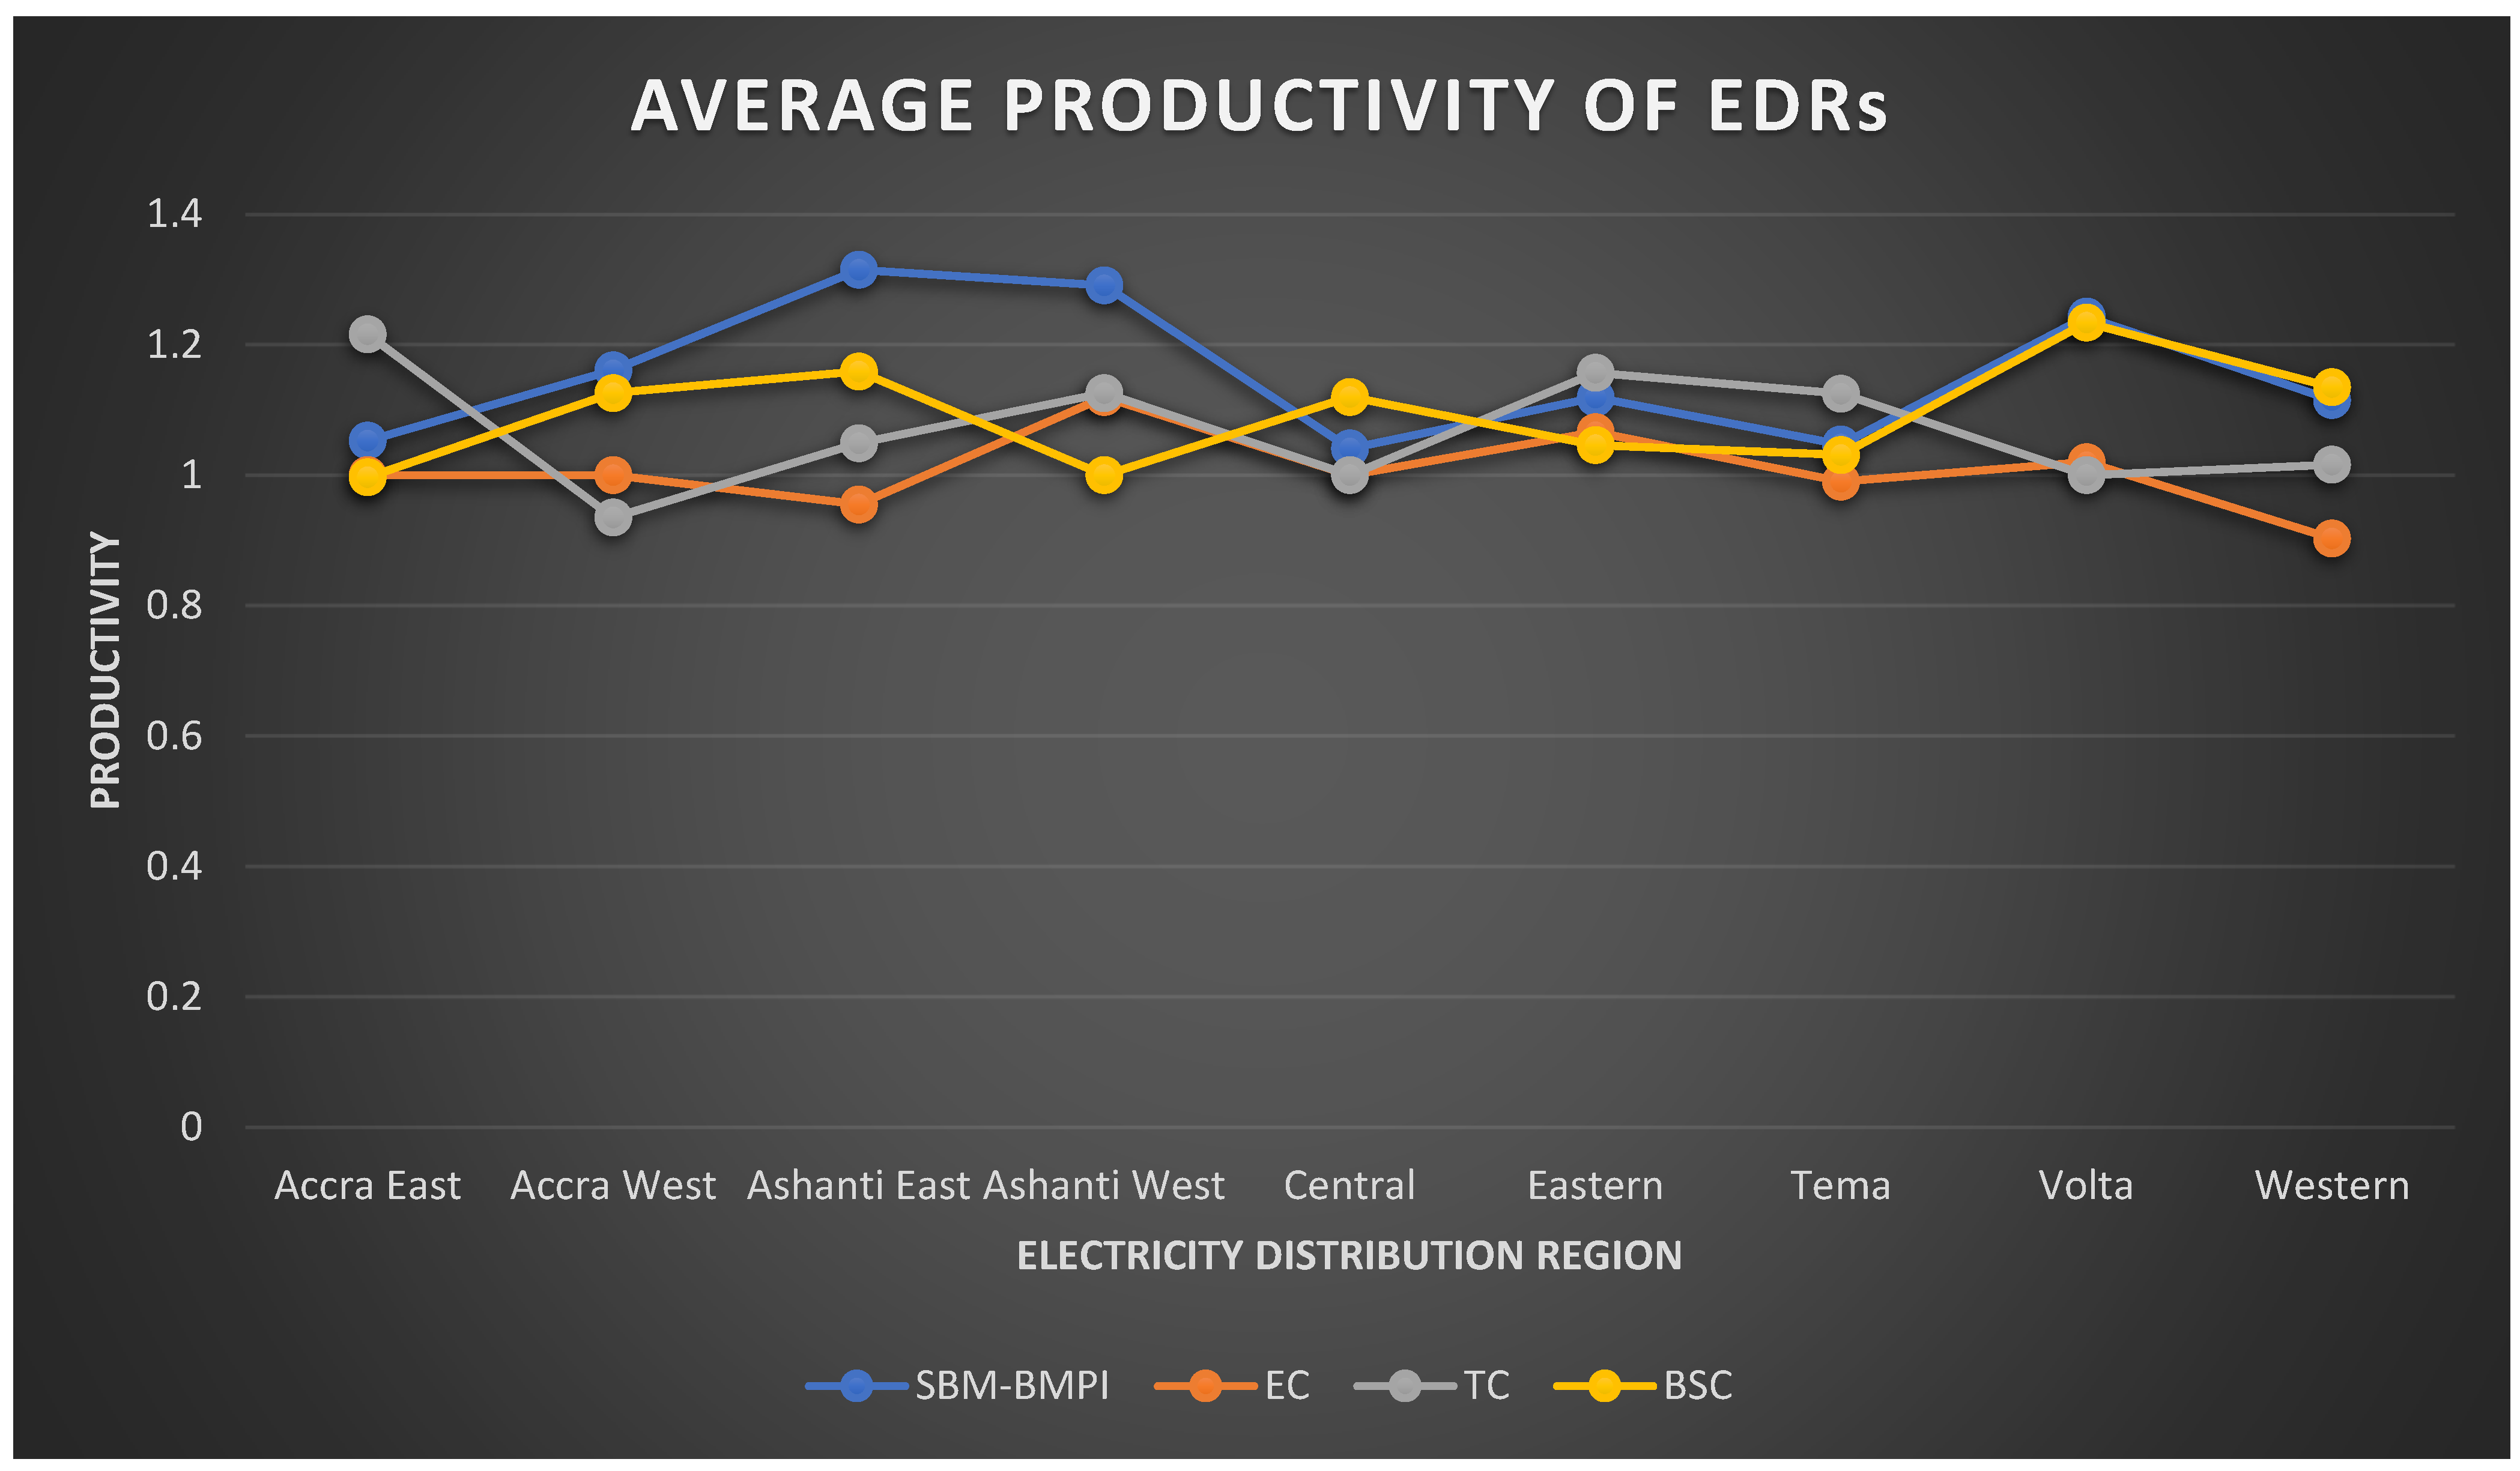
| DMU | 2012–2013 | 2013–2014 | 2014–2015 | 2015–2016 | 2016–2017 | 2017–2018 |
|---|---|---|---|---|---|---|
| Accra East | 1.0314 | 1.2927 | 1.0919 | 1.4101 | 1.0228 | 0.9842 |
| Accra West | 1.0000 | 1.0000 | 1.0000 | 1.1203 | 1.0162 | 1.0128 |
| Ashanti East | 1.0668 | 1.1233 | 1.0210 | 0.9006 | 1.2054 | 1.0001 |
| Ashanti West | 1.0144 | 1.3182 | 1.0866 | 1.4993 | 1.0144 | 1.2900 |
| Central | 1.0770 | 1.0882 | 1.1188 | 1.3204 | 0.9559 | 0.9570 |
| Eastern | 1.0705 | 1.1250 | 1.1099 | 1.1378 | 1.0066 | 1.0134 |
| Tema | 1.0073 | 1.2713 | 1.6853 | 0.8843 | 1.0707 | 1.4443 |
| Volta | 1.0862 | 1.0000 | 1.0624 | 1.0000 | 1.0229 | 1.0078 |
| Western | 1.1806 | 1.0722 | 1.2056 | 1.1778 | 1.0661 | 1.0050 |
Publisher’s Note: MDPI stays neutral with regard to jurisdictional claims in published maps and institutional affiliations. |
© 2022 by the authors. Licensee MDPI, Basel, Switzerland. This article is an open access article distributed under the terms and conditions of the Creative Commons Attribution (CC BY) license (https://creativecommons.org/licenses/by/4.0/).
Share and Cite
Tengey, C.; Nwulu, N.I.; Adepoju, O.; Longe, O.M. Analysis of the Productivity Dynamics of Electricity Distribution Regions in Ghana. Energies 2022, 15, 9414. https://doi.org/10.3390/en15249414
Tengey C, Nwulu NI, Adepoju O, Longe OM. Analysis of the Productivity Dynamics of Electricity Distribution Regions in Ghana. Energies. 2022; 15(24):9414. https://doi.org/10.3390/en15249414
Chicago/Turabian StyleTengey, Clement, Nnamdi Ikechi Nwulu, Omoseni Adepoju, and Omowunmi Mary Longe. 2022. "Analysis of the Productivity Dynamics of Electricity Distribution Regions in Ghana" Energies 15, no. 24: 9414. https://doi.org/10.3390/en15249414