

Solar Energy Production Planning in Antikythera: Adequacy Scenarios and the Effect of the Atmospheric Parameters


Abstract
:1. Introduction
- (1)
- The area and population of these islands present significant variance and are inaccessible in terms of coastal shipping lines;
- (2)
- The renewable energy potential in terms of solar wind power is timeless and high;
- (3)
- There is no interconnection with the electricity grid of the mainland, resulting in low energy adequacy, stability and overall security;
- (4)
- The lack of interconnection with the main land introduces voltage and frequency issues, especially under high distributed energy incorporation levels from renewables [5].
2. Materials and Methods
2.1. Data Sources
2.2. Solar Energy Simulation
2.3. Financial Analysis
3. Results
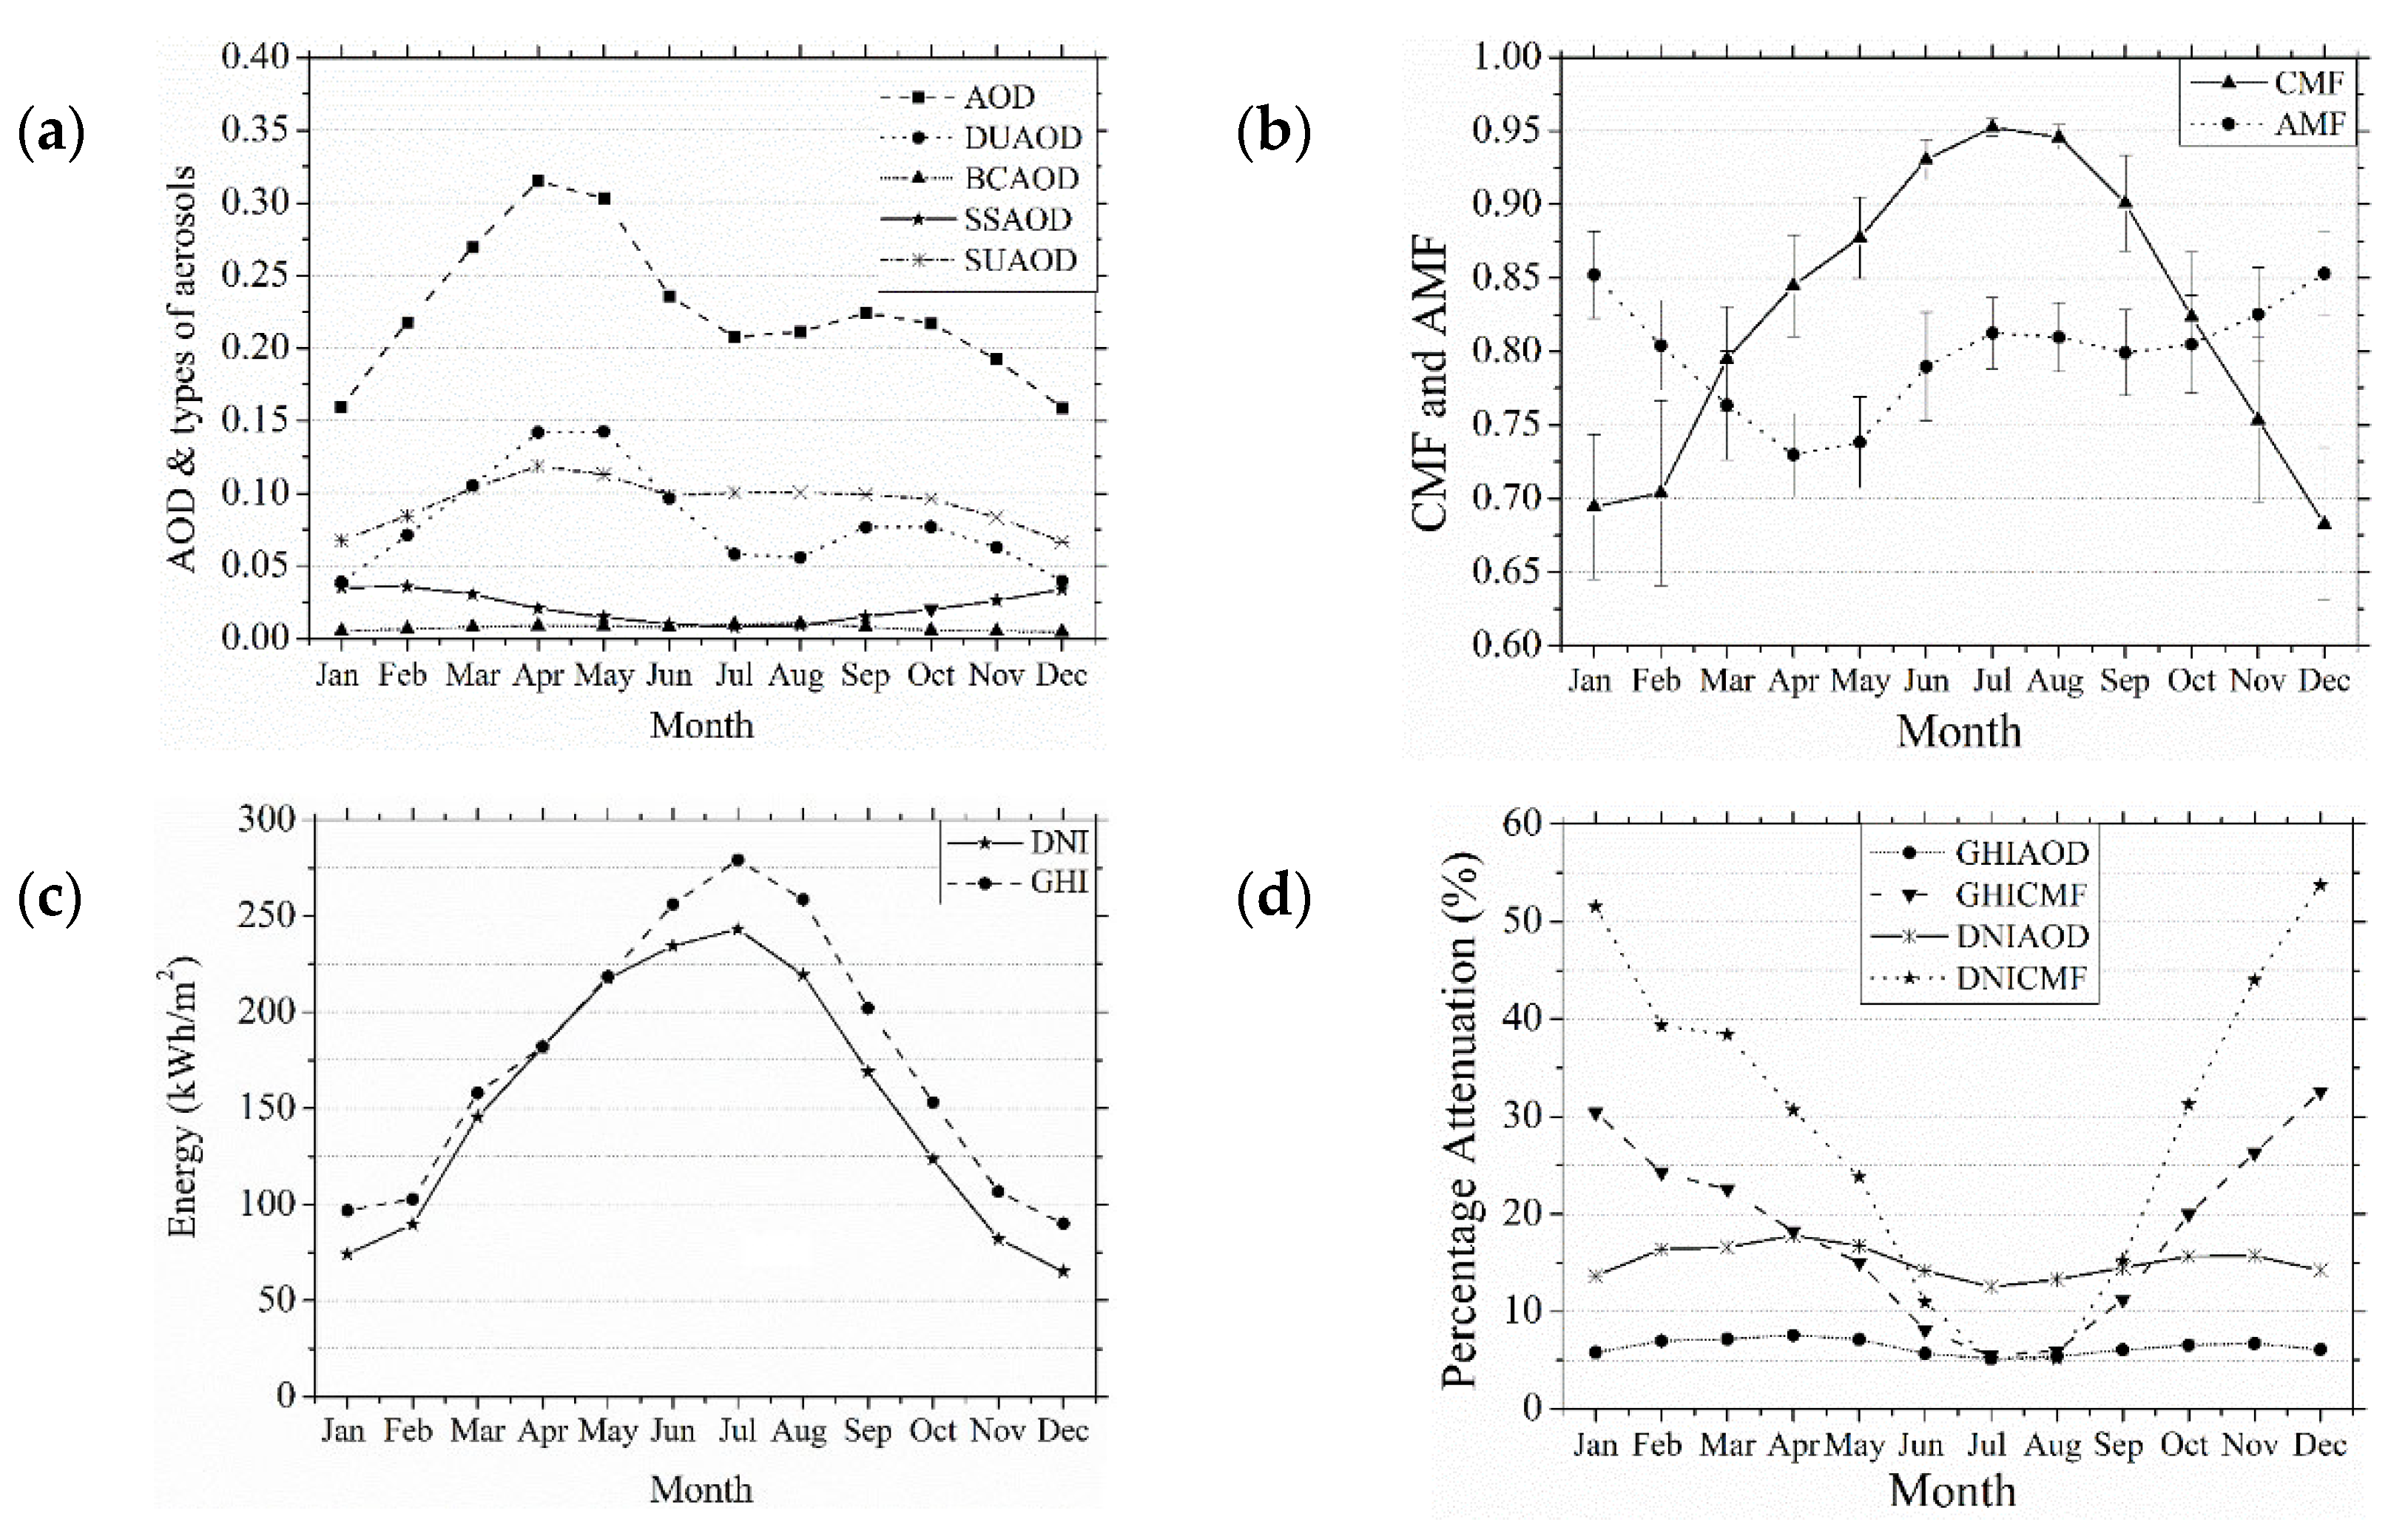
3.1. Aerosol and Cloud Effect on Solar Radiation
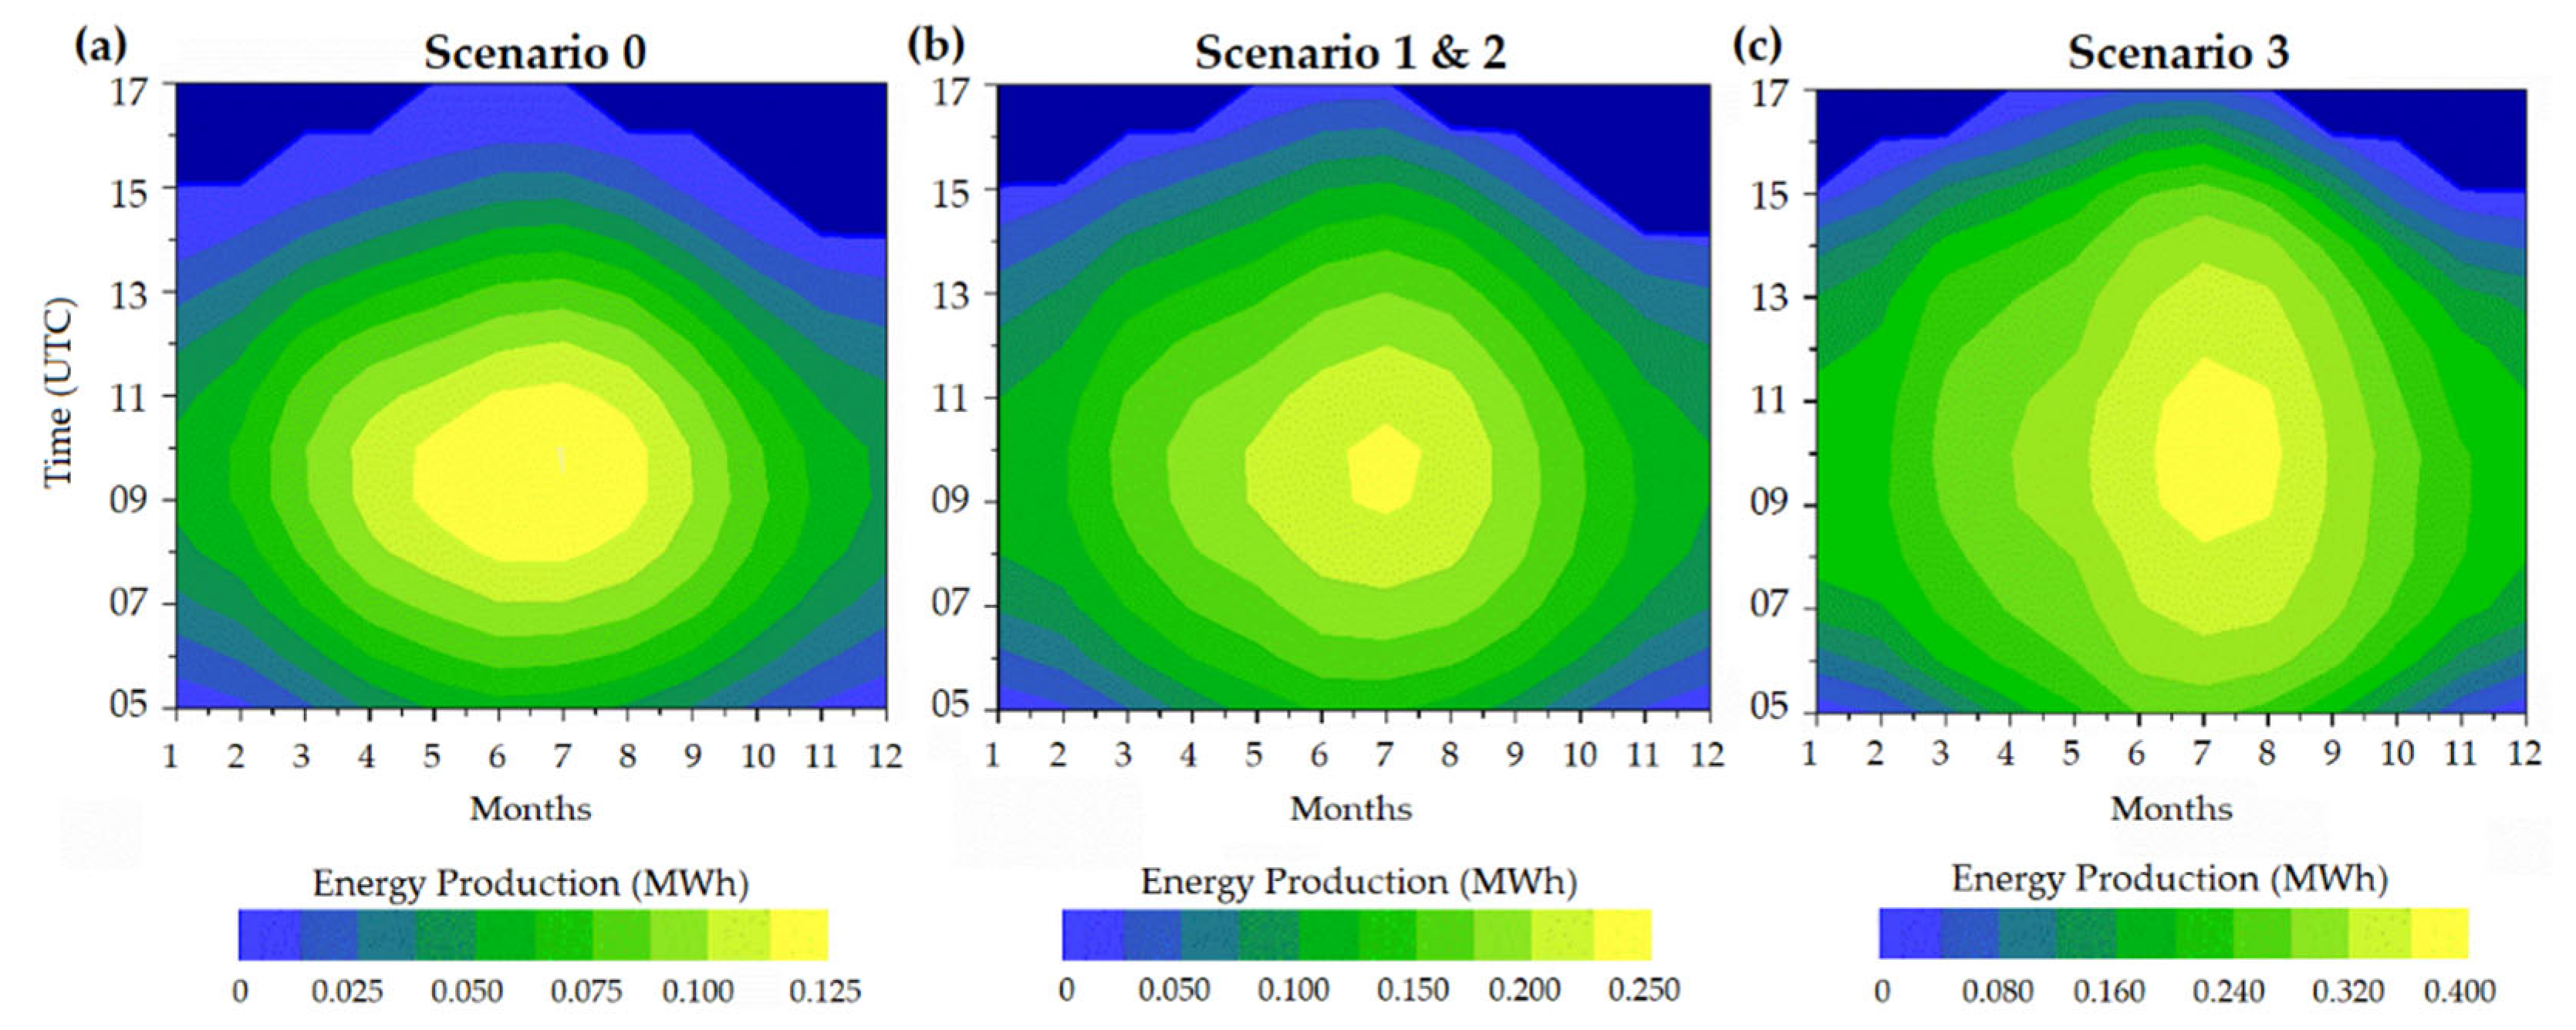
3.2. Energy Planning Scenarios
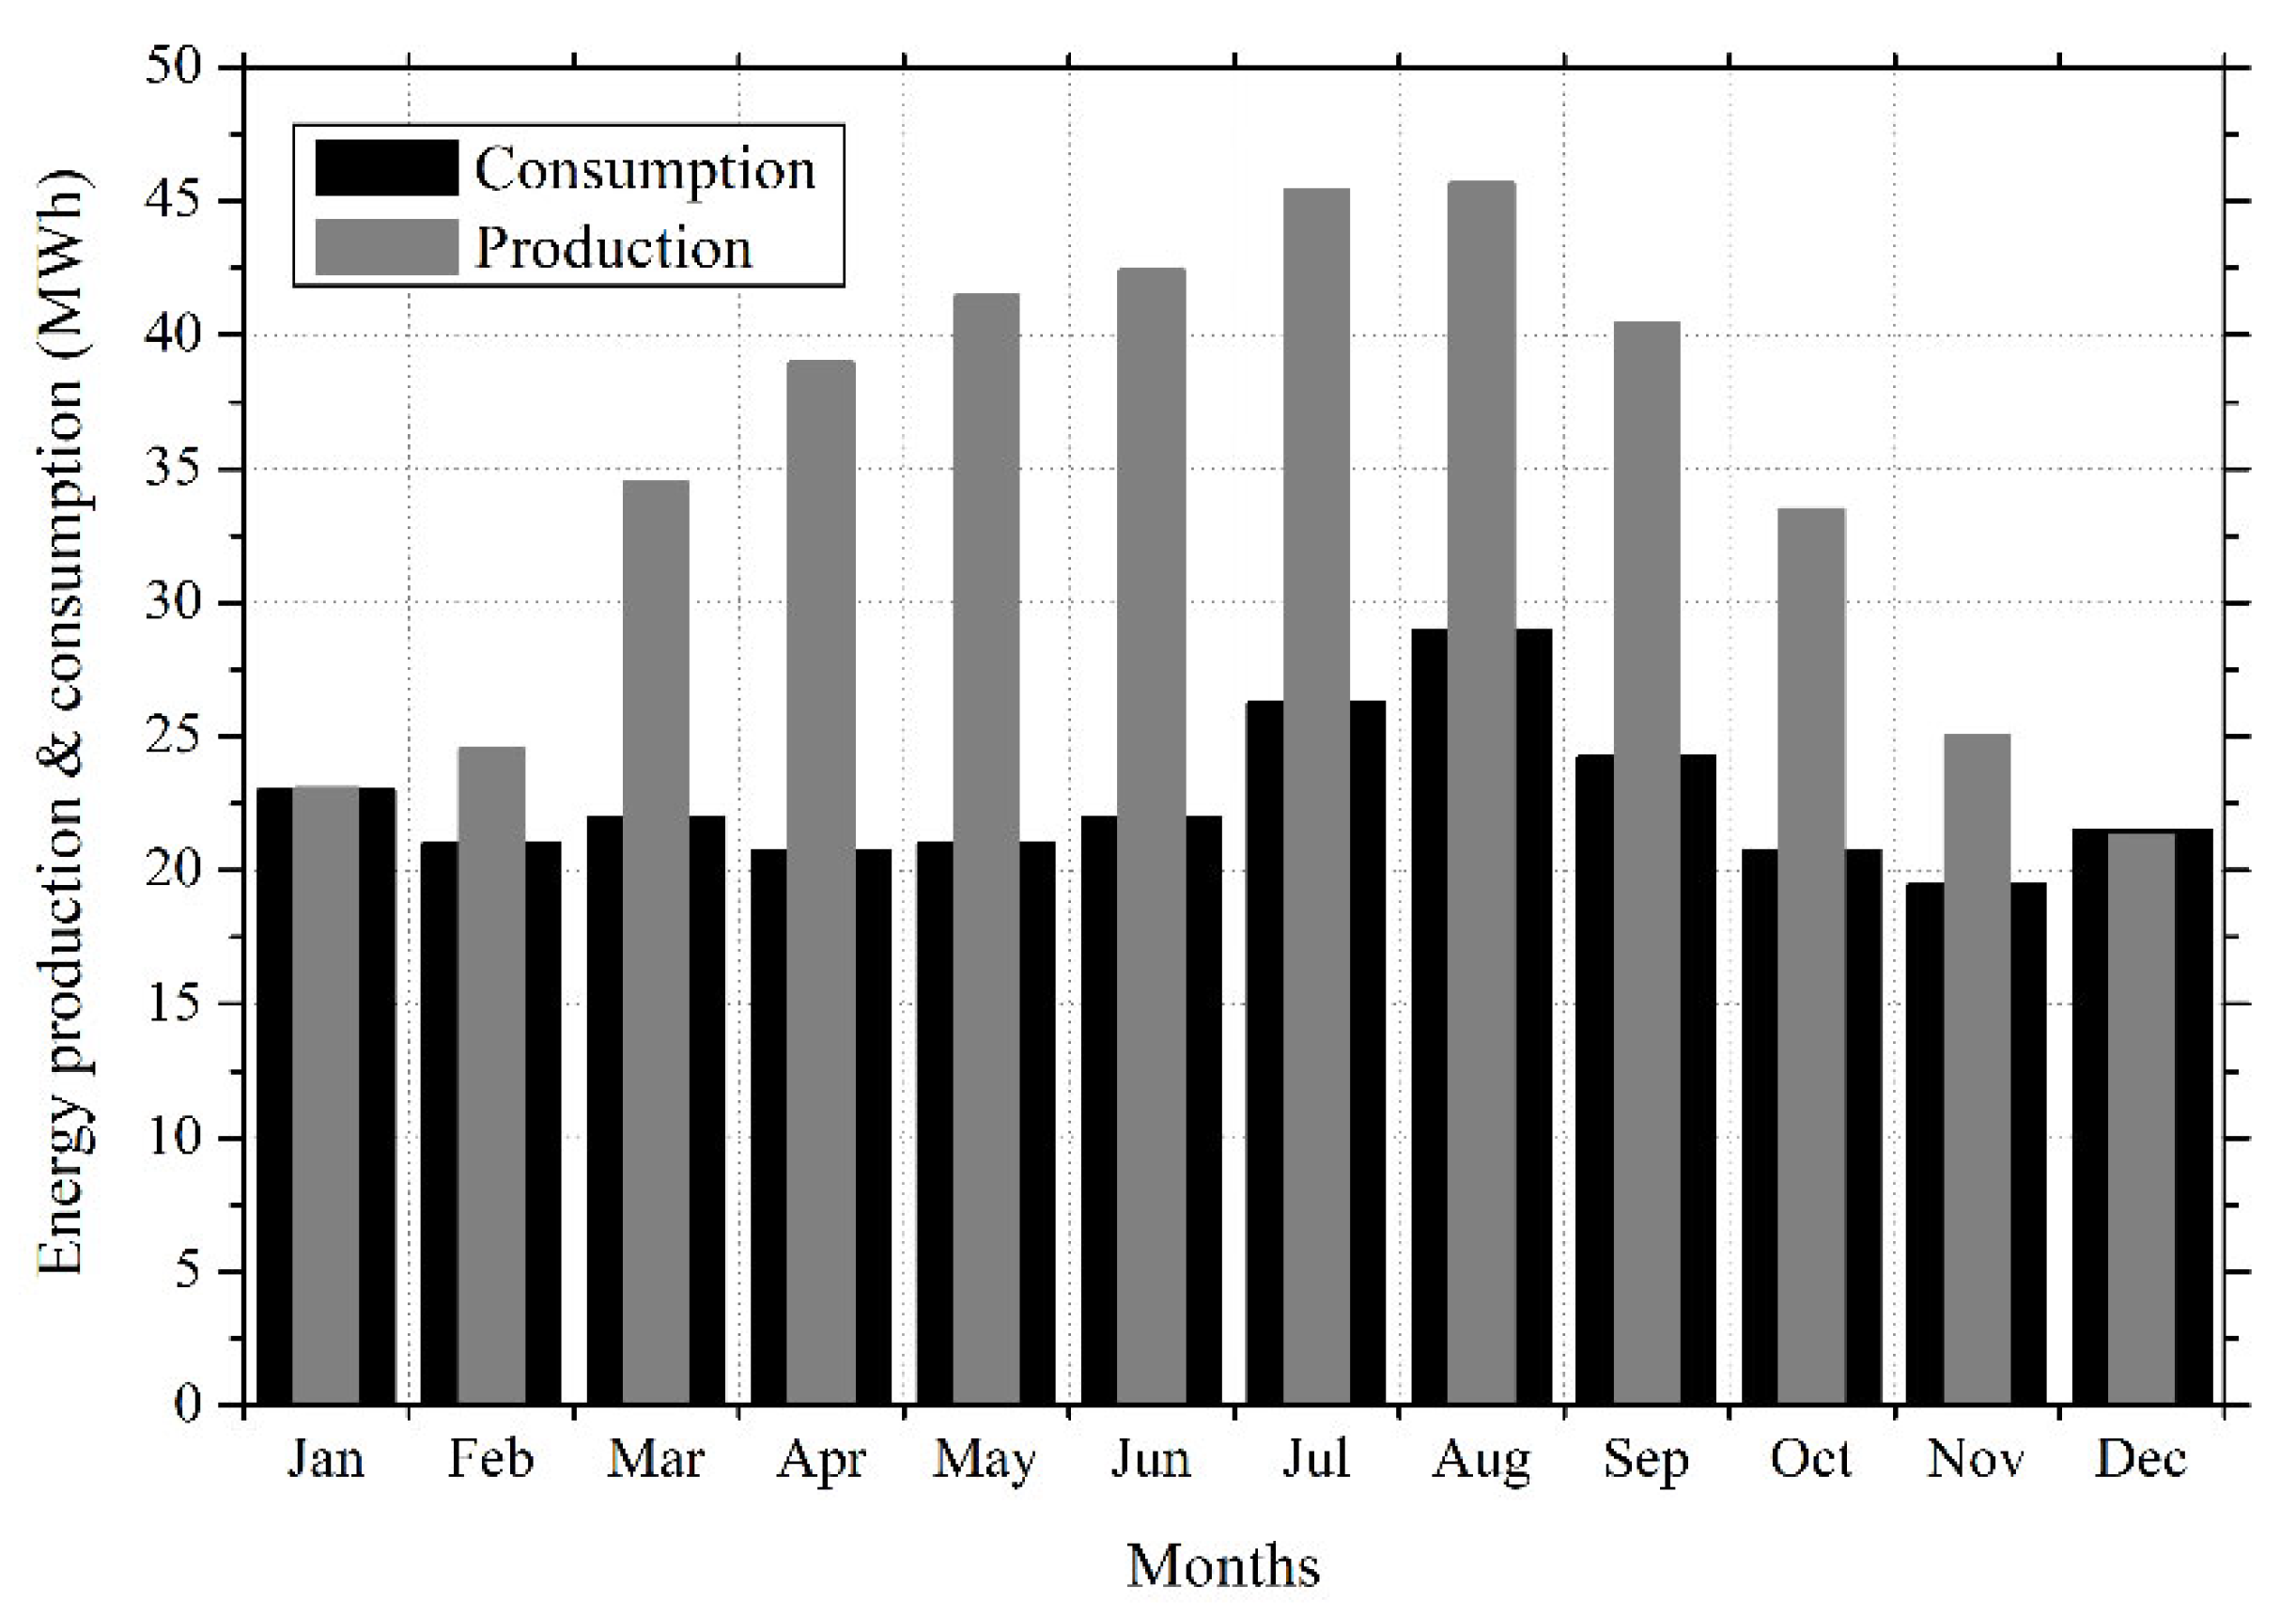
3.2.1. Current Energy Needs of the Island
3.2.2. Energy Need after the ECCO Establishment
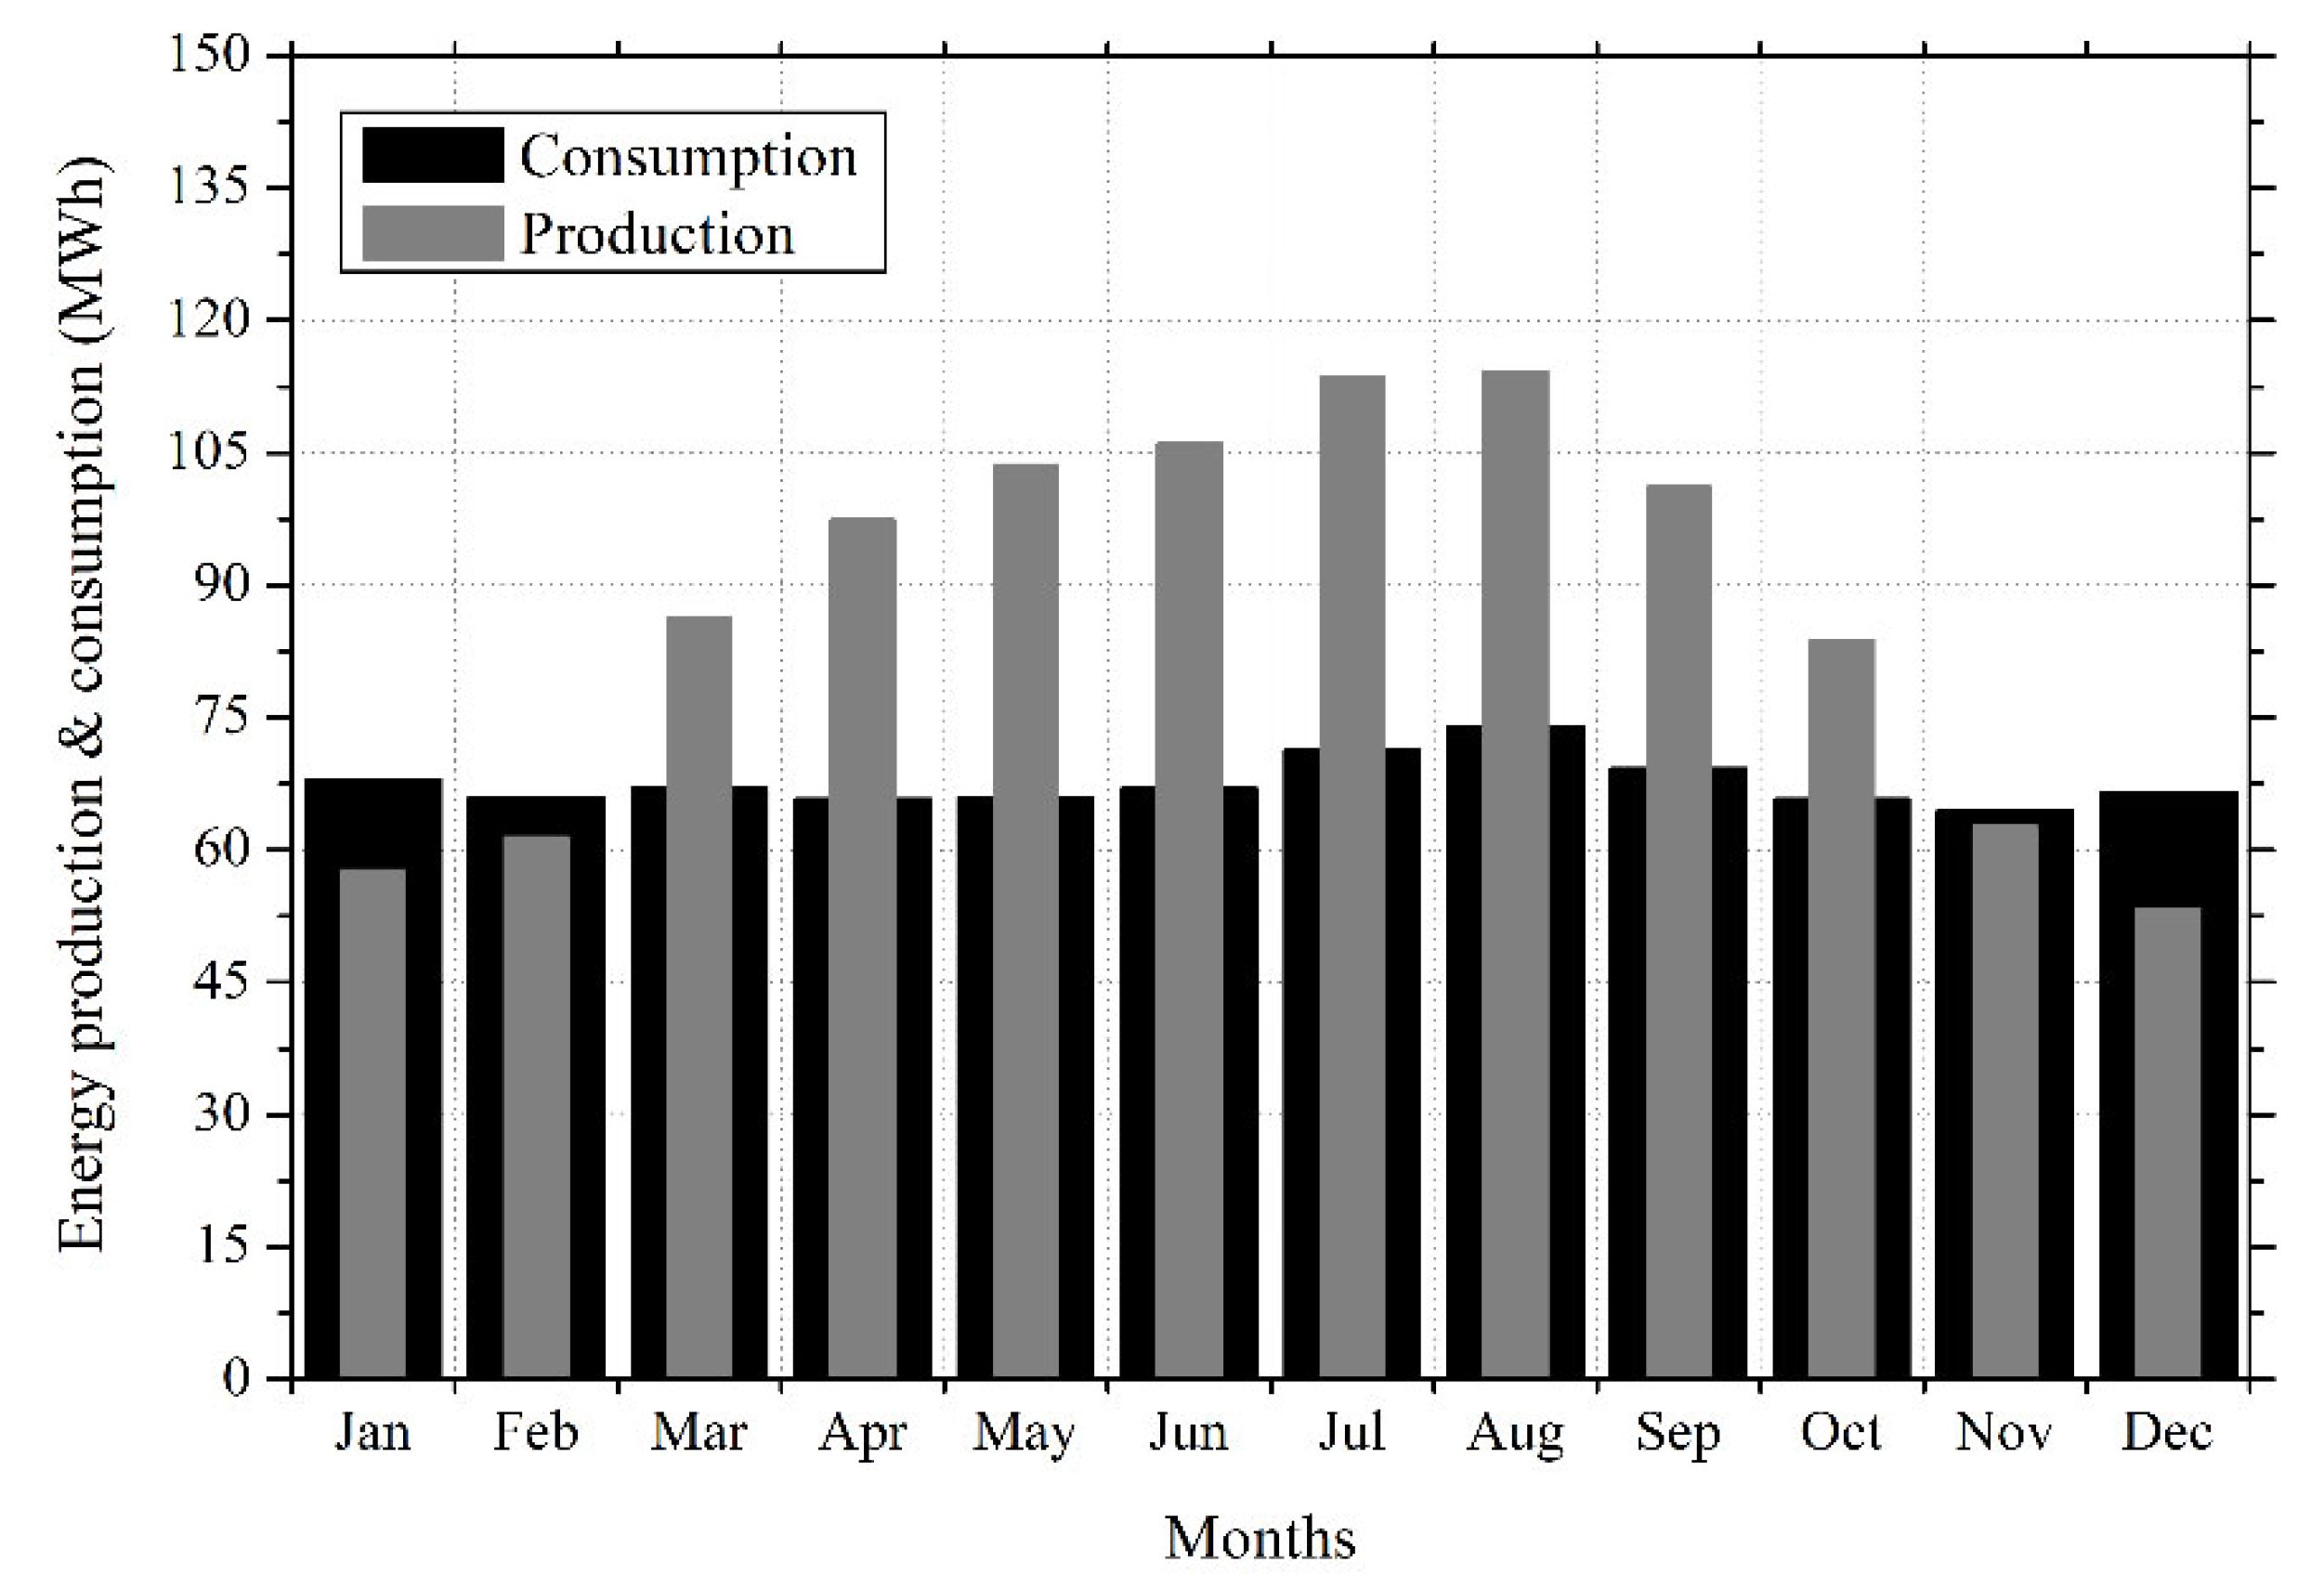
Scenario 1
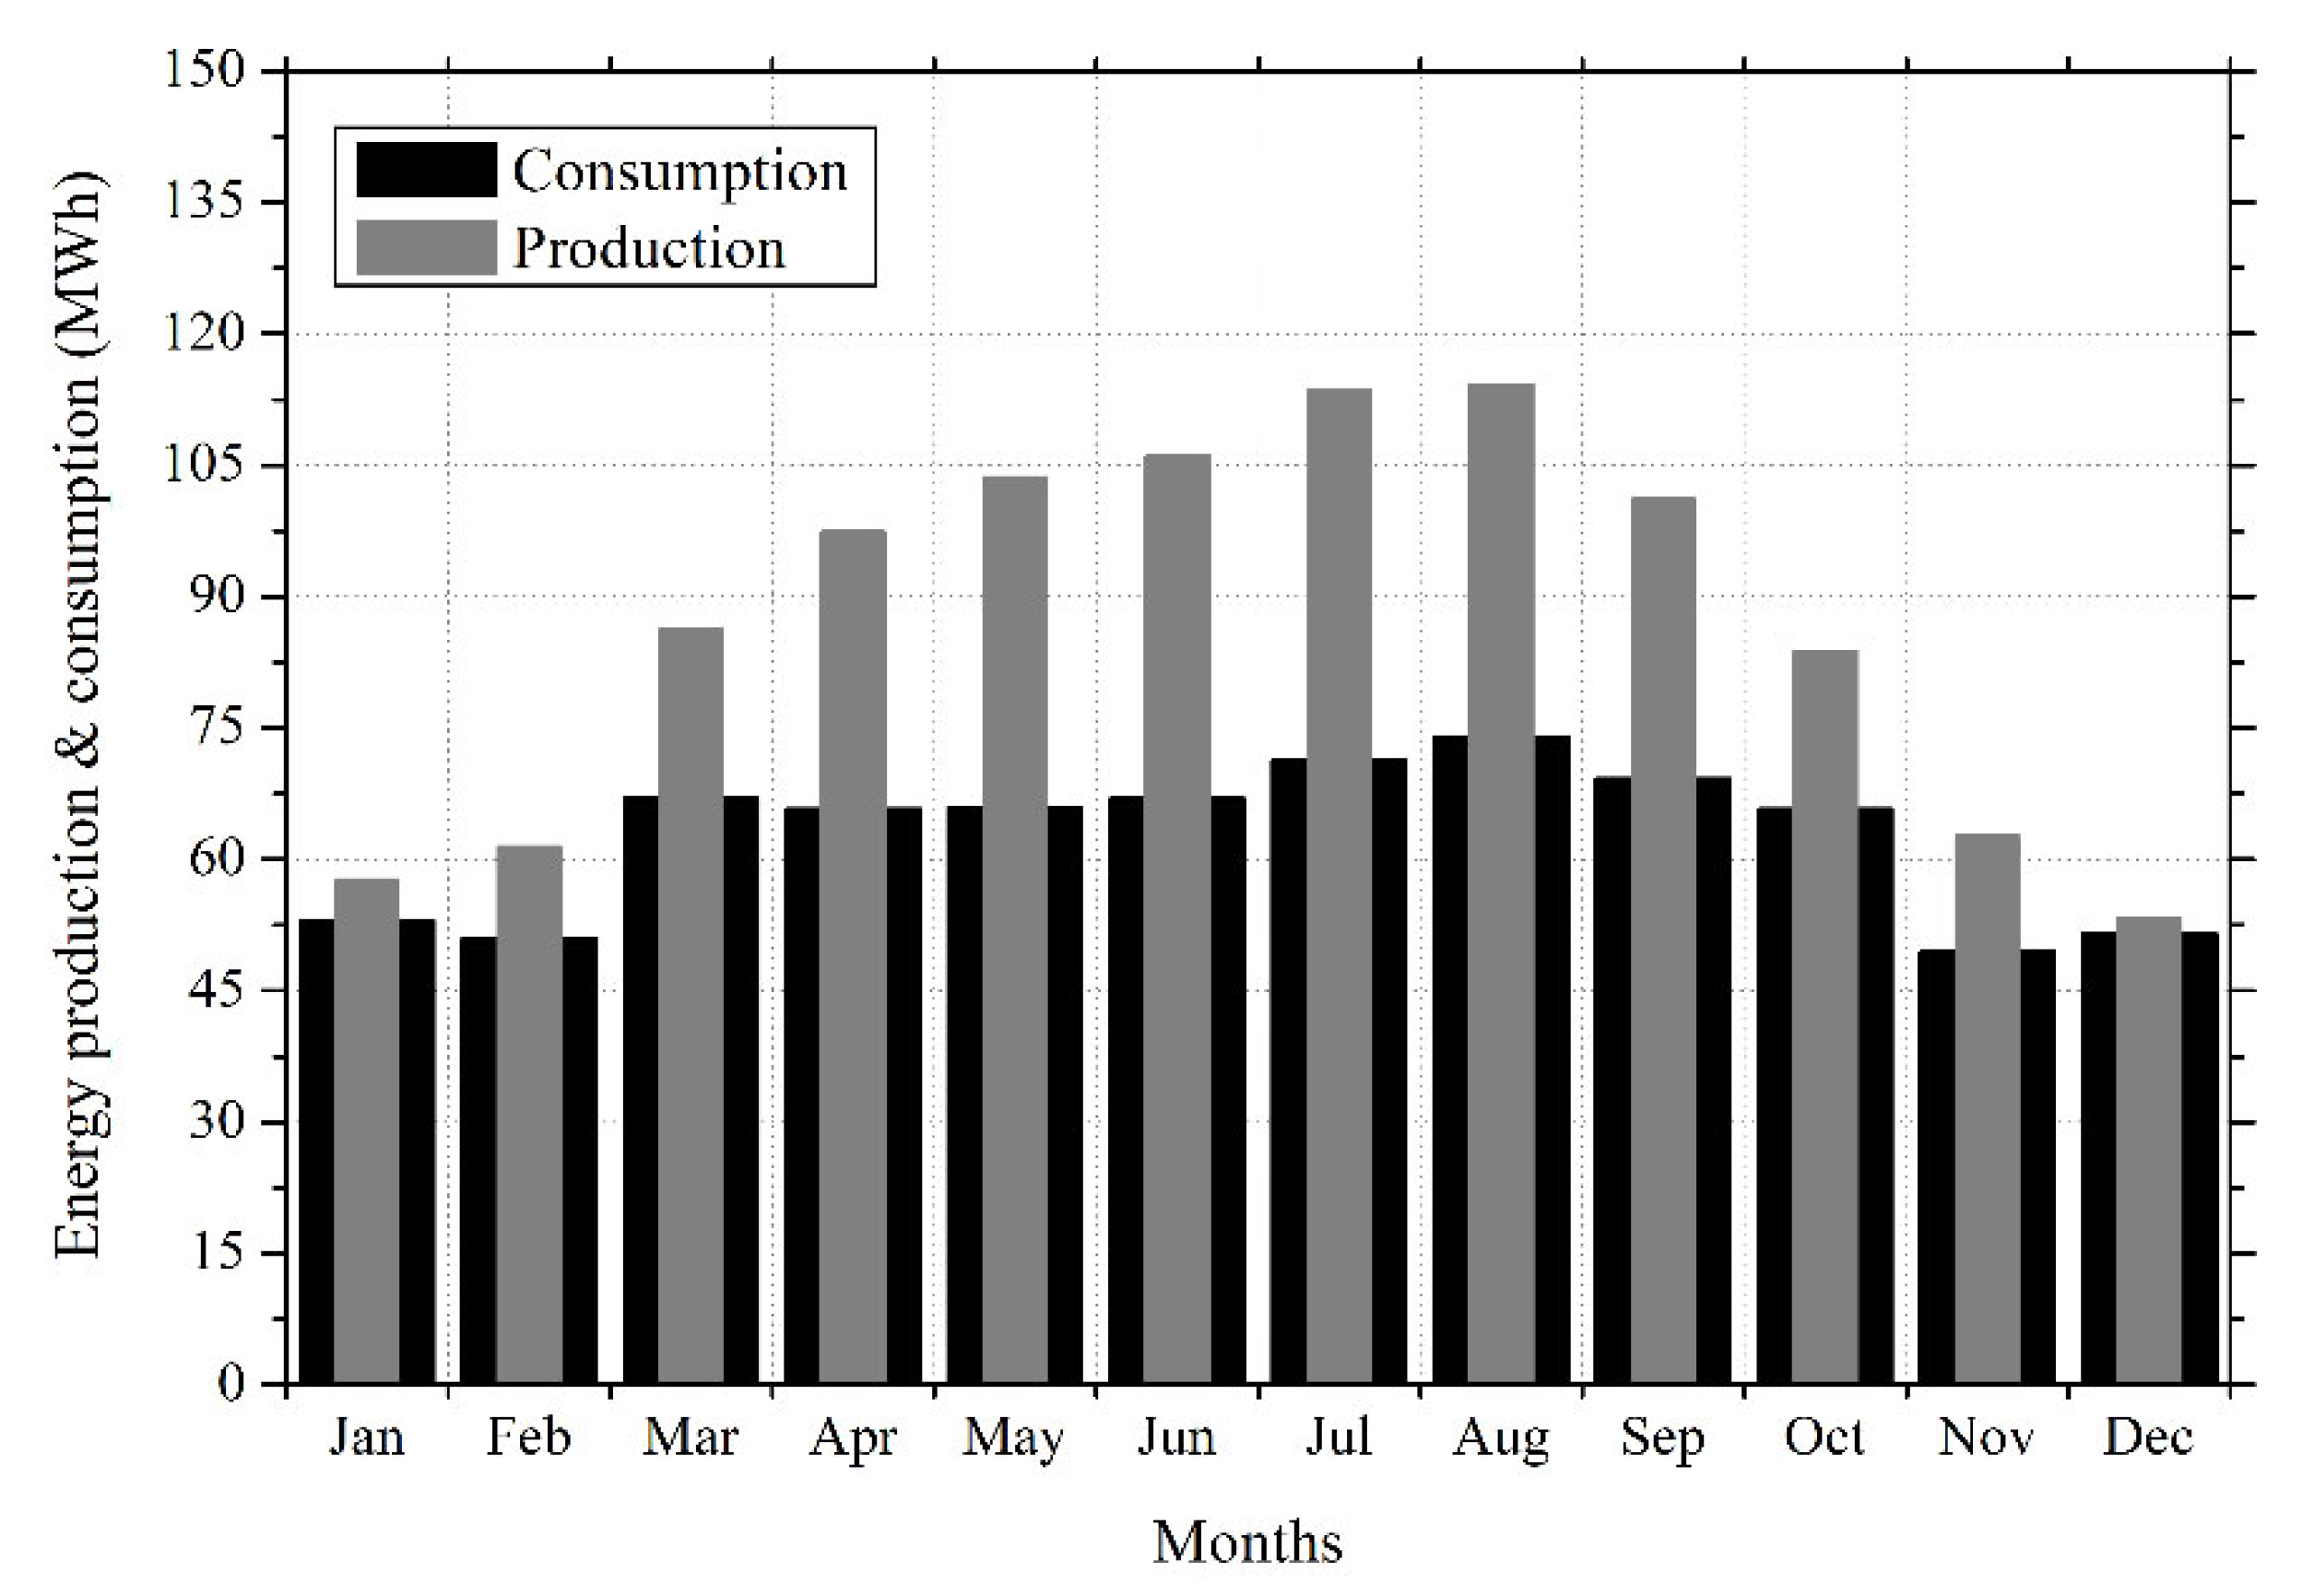
Scenario 2
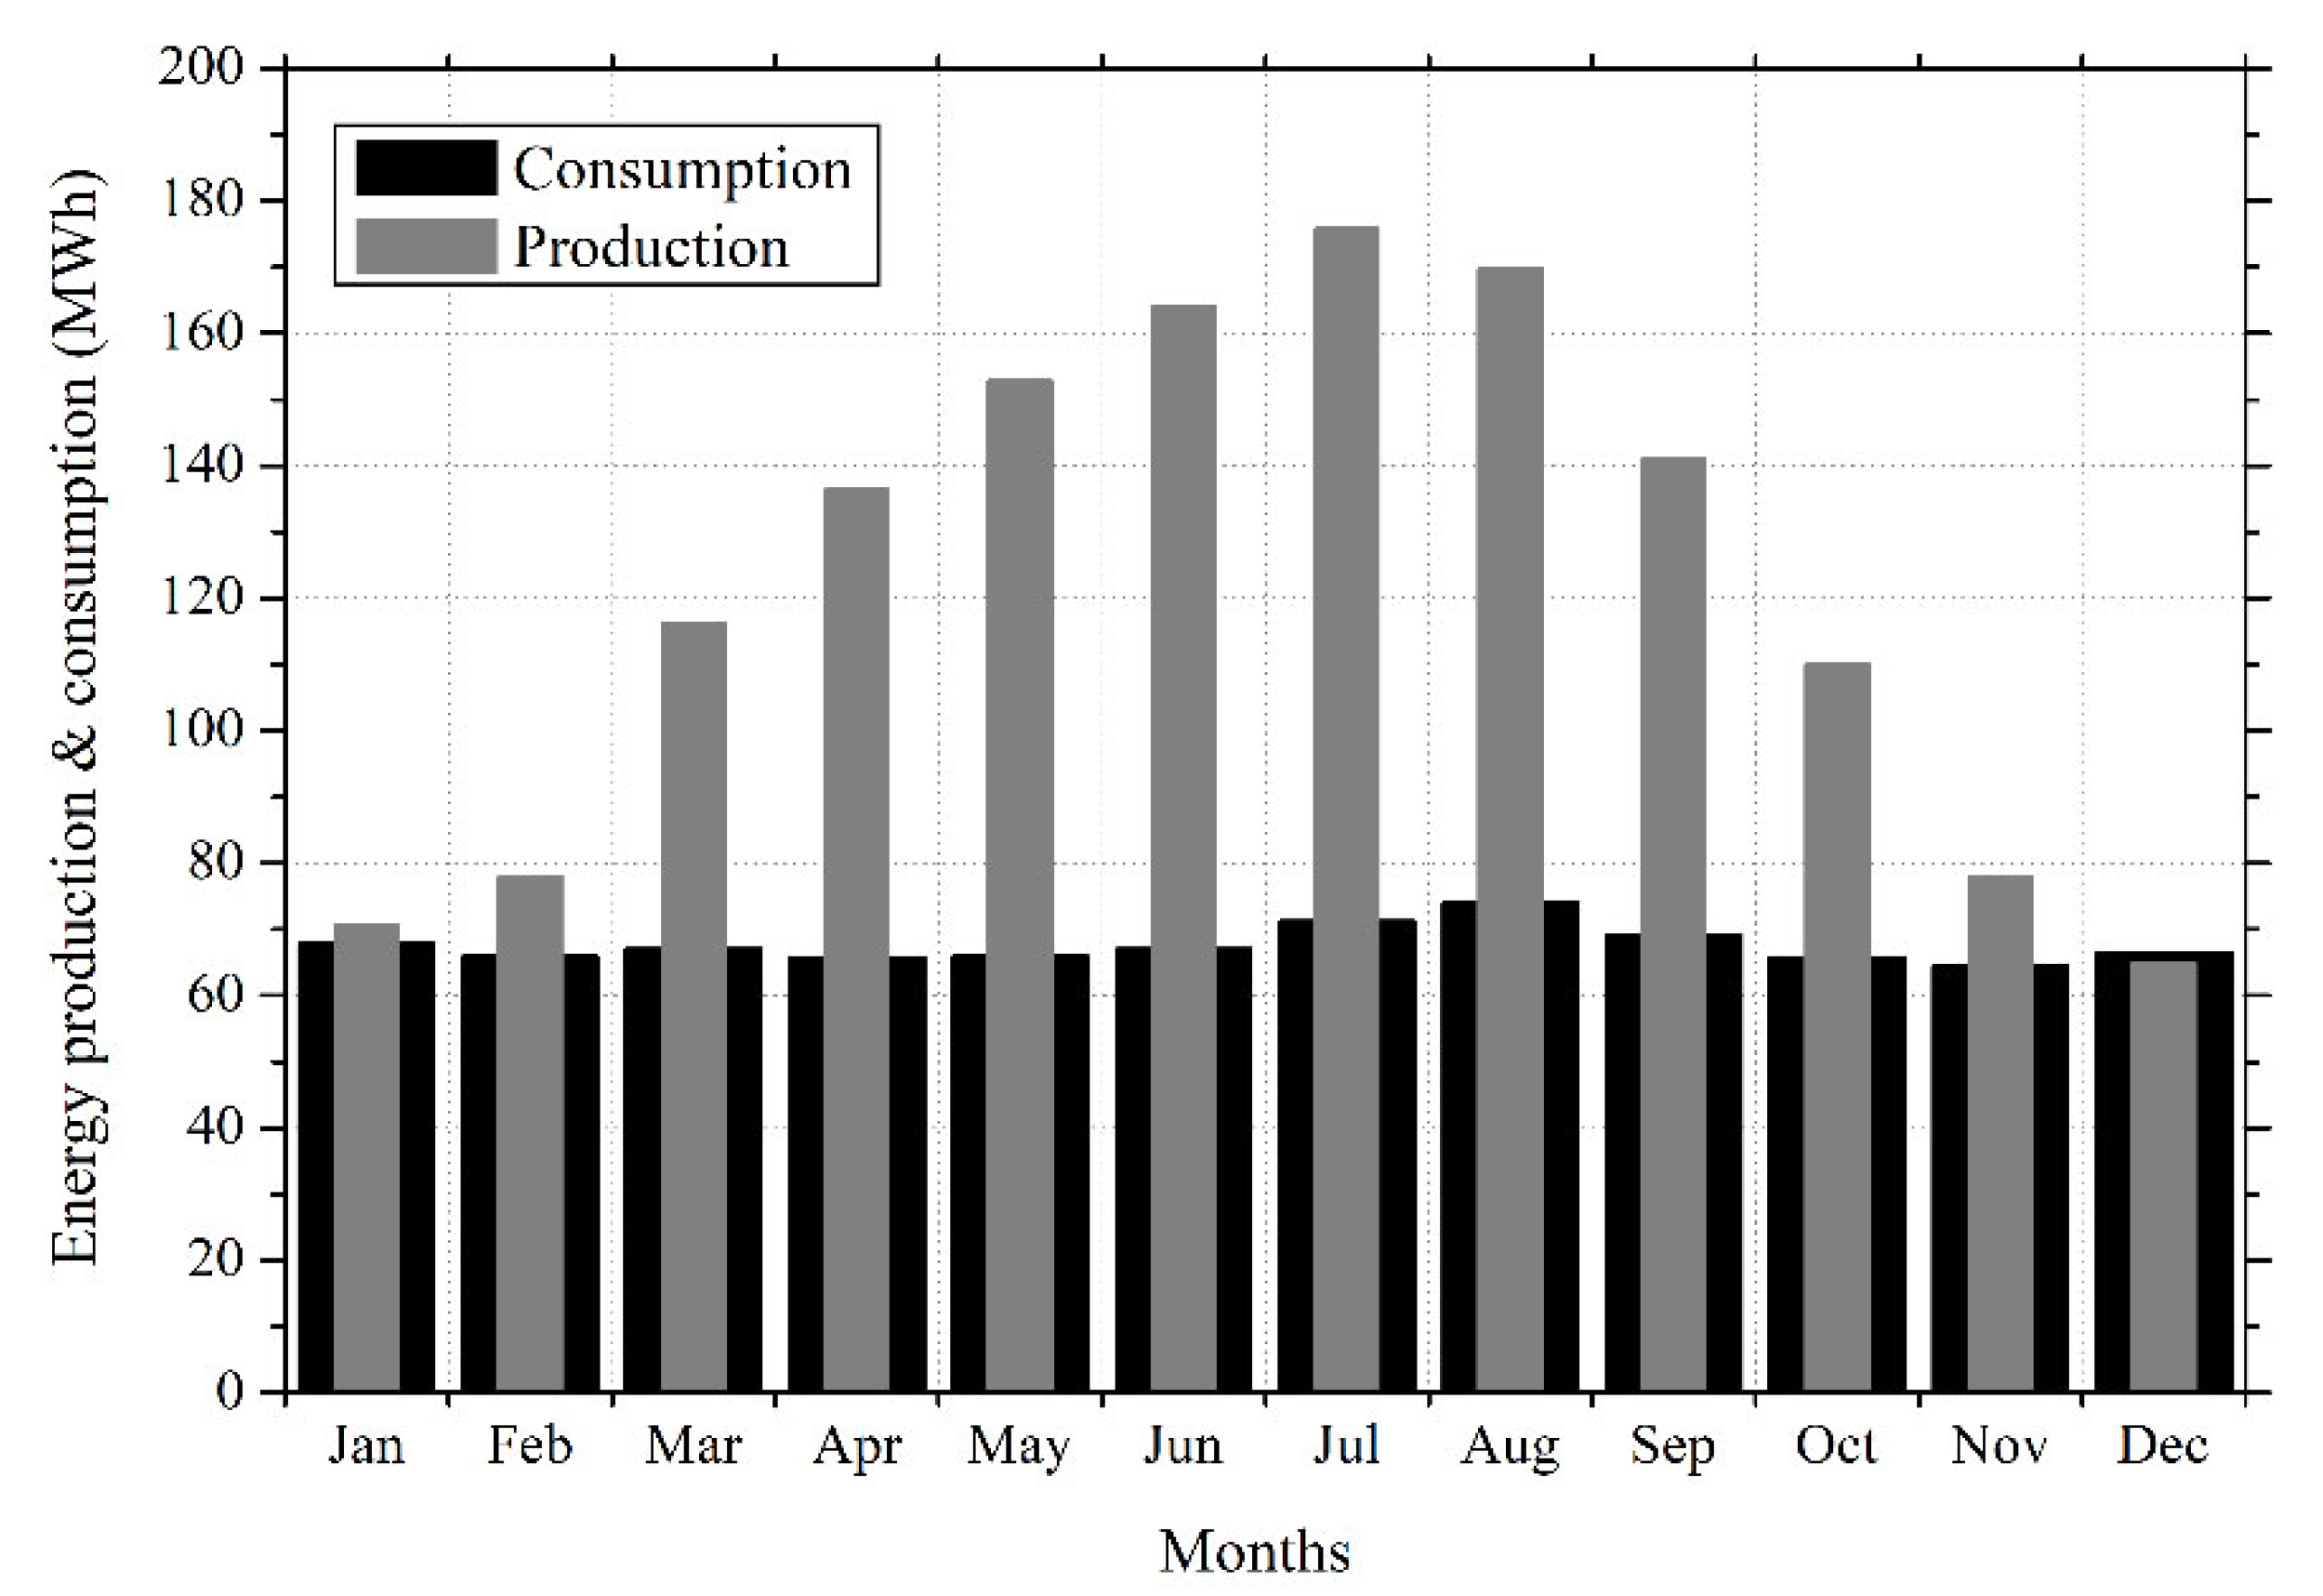
Scenario 3
4. Discussion
5. Conclusions
- -
- A 200 KW system more than covers the existing needs, while with the incorporation of the ECCO a system of 500–700 KW will be necessary in order to mostly cover the winter months where the solar energy potential is lower;
- -
- Such a system will require an area of 9019–10,111 m2 for the PV panels and can reach almost 17,856 m2 with the inclusions of CSP plants mainly for thermal storage capabilities;
- -
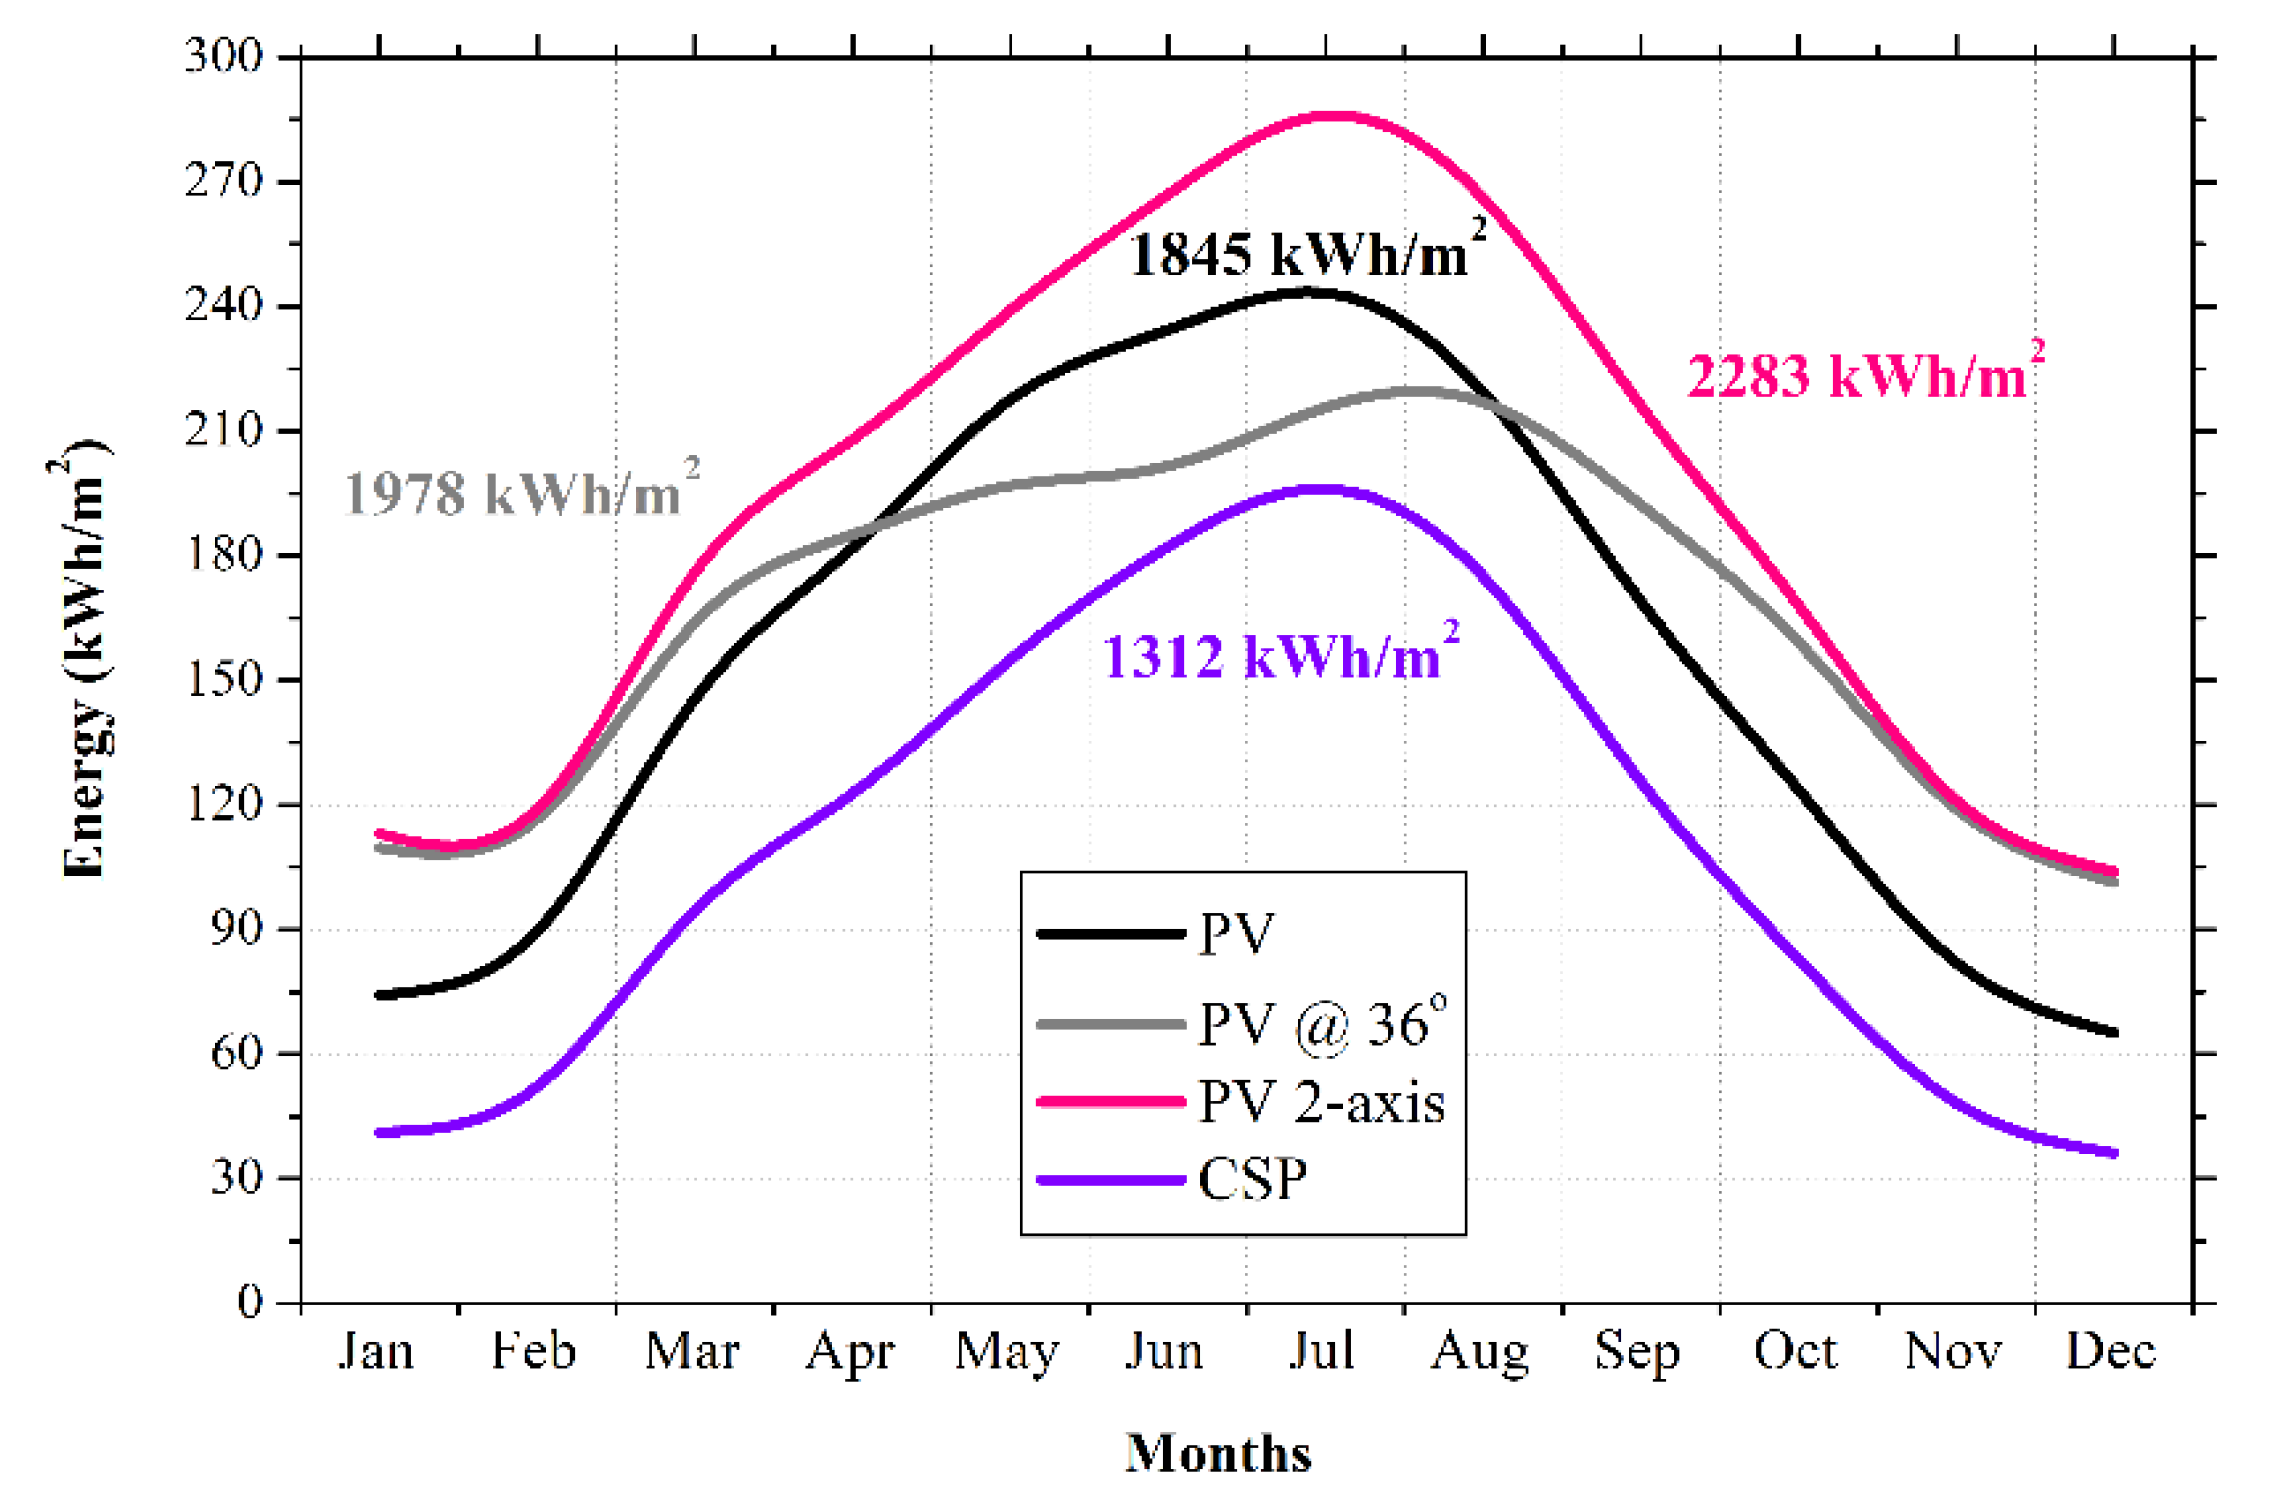
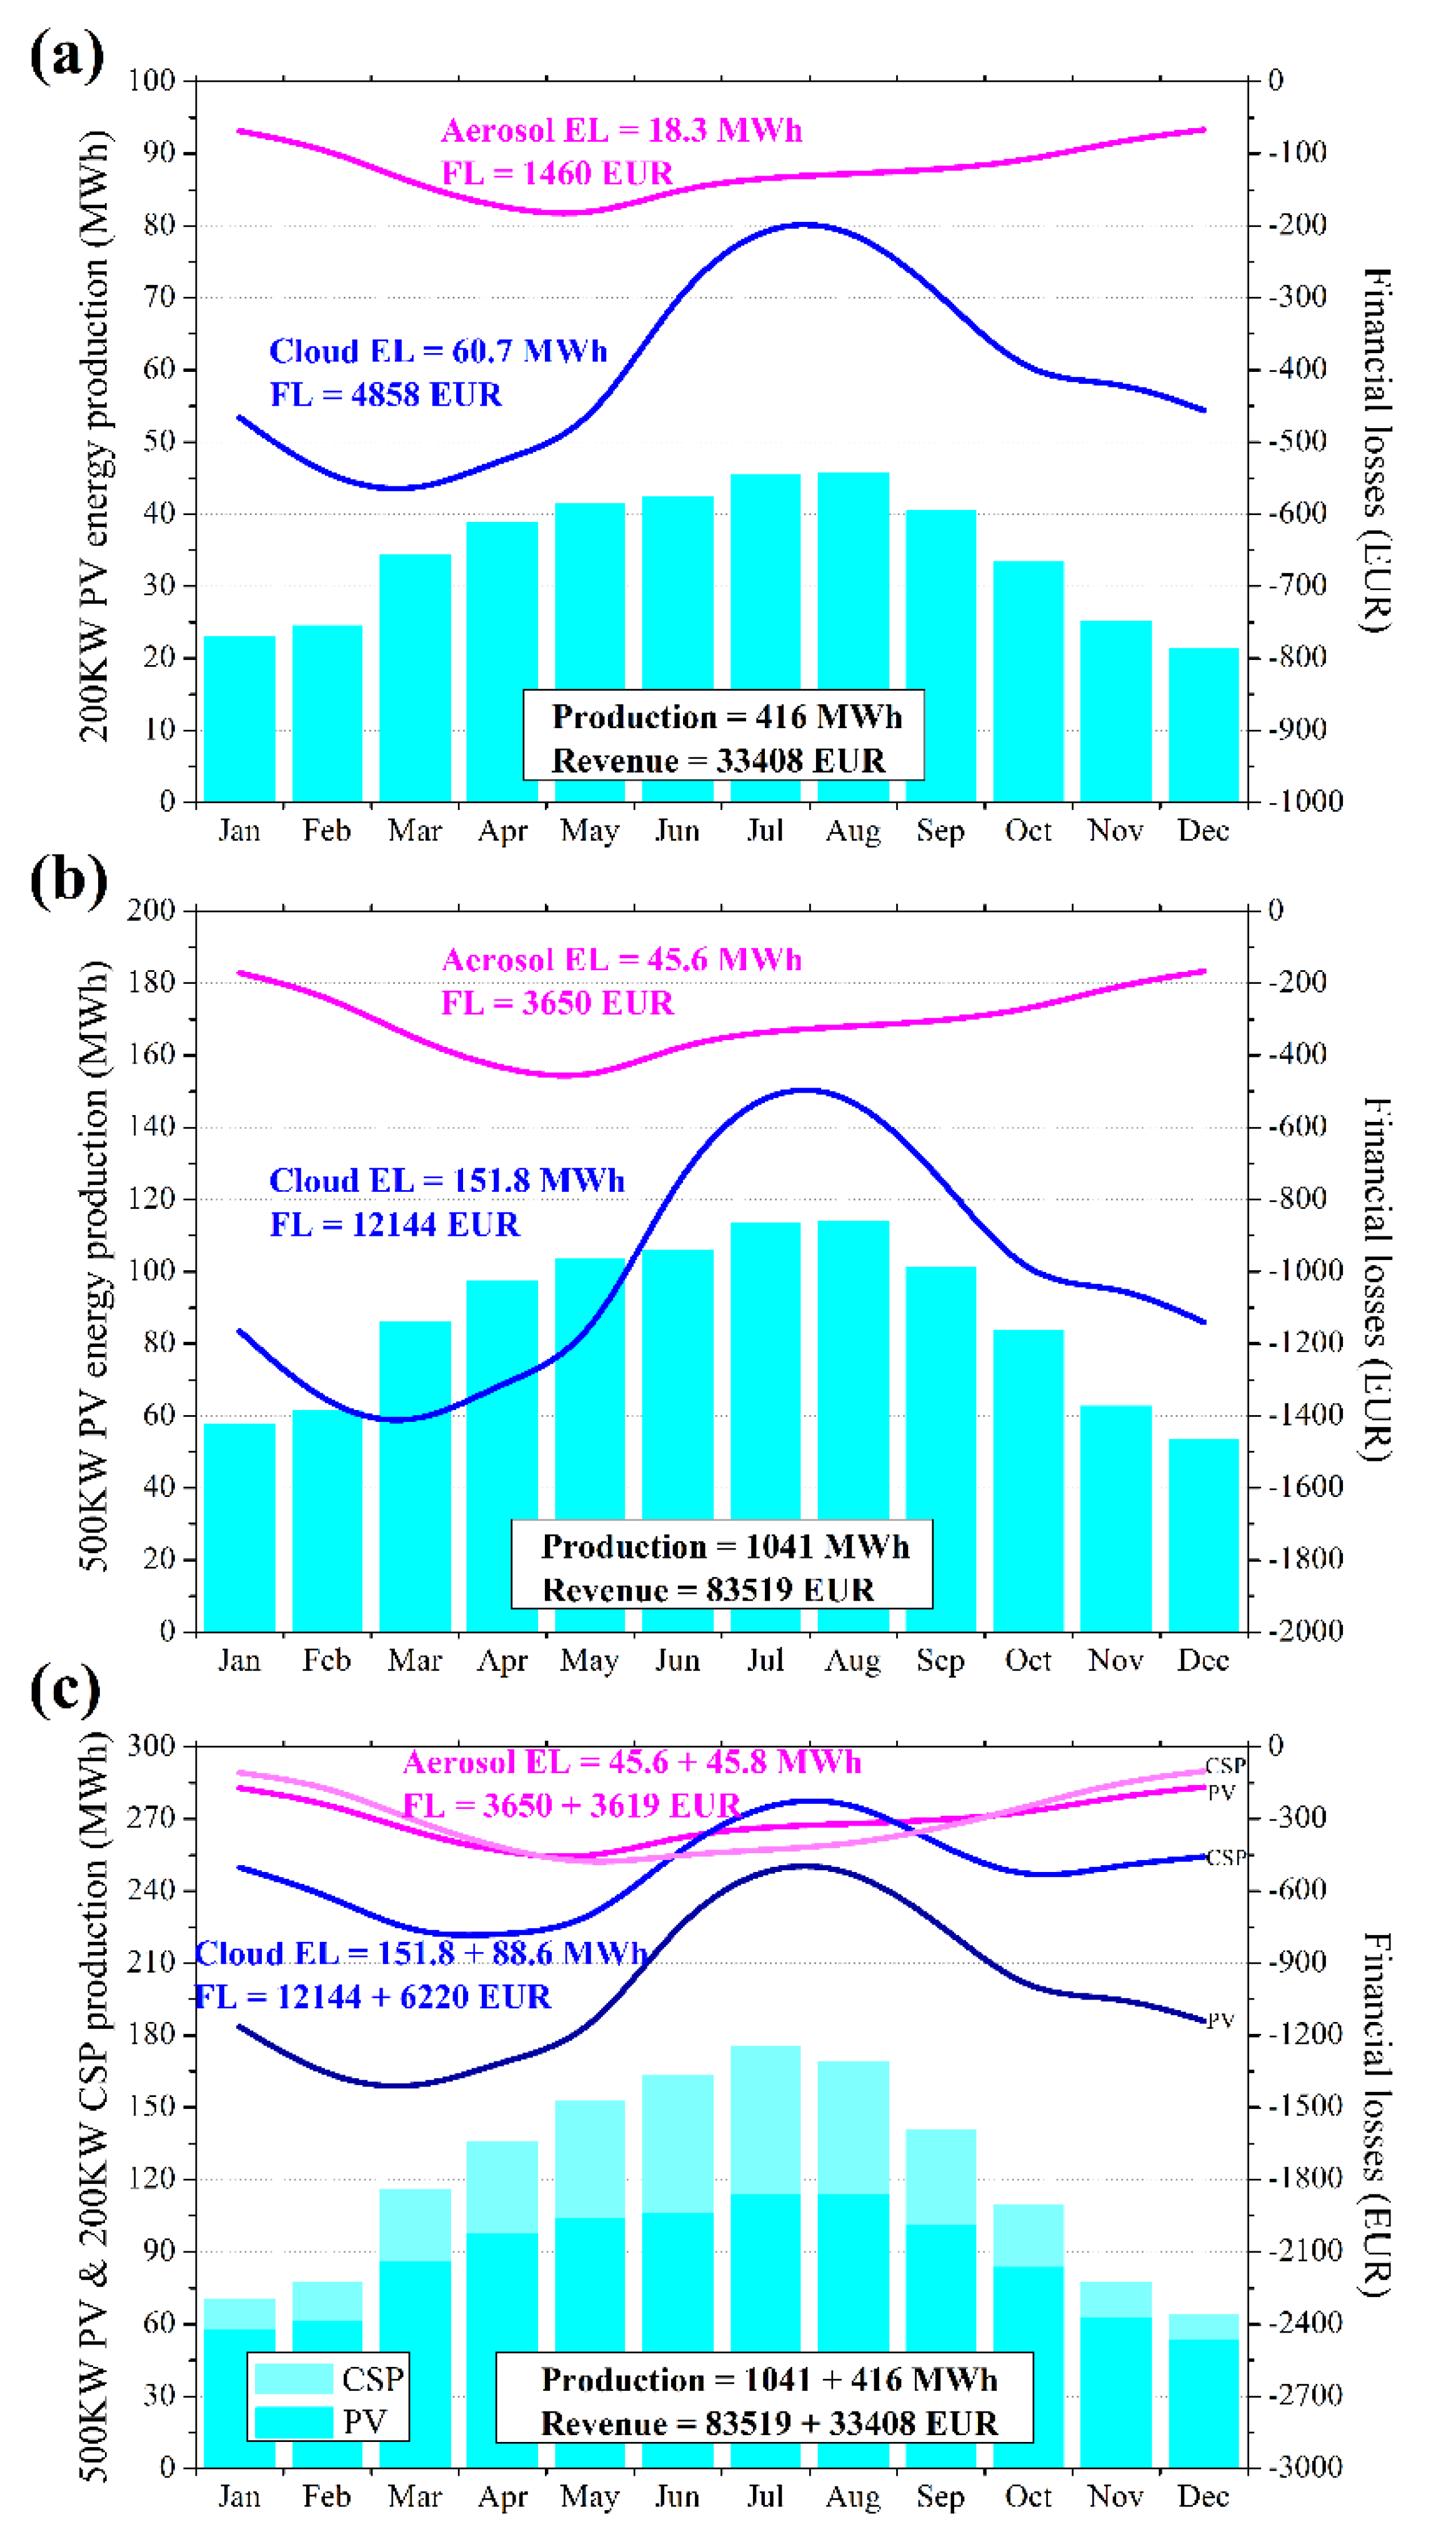
- A PV panel’s tilt equal to the latitude of the region is able to provide an increase to the final annual produced energy up to 7.2% as compared to the horizontal installations. The aerosol and cloud effect on solar energy production was also quantified on a climatological basis, resulting an average 4–11% reduction from the aerosol presence and 14–22% due to clouds;
- -
- The aforementioned findings were used in order to provide a financial analysis for the studied scenarios, indicating an overall revenue of the order of 83,000–117,000 euro for the proposed solar plants that will cover the energy needs of the island with the ECCO followed by estimated losses of 3650–7269 and 12,144–18,364 euro from aerosol and cloud levels, respectively;
- -
- Concerning the excess energy during the summer months, an interconnection with the national electricity grid will be beneficial accompanied by potential storage solutions through batteries and/or conversions into hydrogen.
Author Contributions
Funding
Data Availability Statement
Acknowledgments
Conflicts of Interest
References
- Ioannidis, A.; Chalvatzis, K.J.; Li, X.; Notton, G.; Stephanides, P. The case for islands’ energy vulnerability: Electricity supply diversity in 44 global islands. Renew. Energy 2019, 143, 440–452. [Google Scholar] [CrossRef]
- Kaldellis, J.K.; Zafirakis, D. Present situation and future prospects of electricity generation in Aegean Archipelago islands. Energy Policy 2007, 35, 4623–4639. Available online: https://www.sciencedirect.com/science/article/pii/S0301421507001425 (accessed on 25 October 2022). [CrossRef]
- HAS. Greece in Numbers; Hellenic Statistical Authority: Piraeus, Greece, 2018. [Google Scholar]
- RAE Regulatory Authority for Energy-Non-Interconnected Islands—2022. Available online: https://www.rae.gr/non-interconnected-islands/?lang=en (accessed on 12 October 2022).
- Katsoulakos, N.M. An Overview of the Greek Islands’ Autonomous Electrical Systems: Proposals for a Sustainable Energy Future. Smart Grid Renew. Energy 2019, 10, 55–82. Available online: https://www.sciencedirect.com/science/article/pii/S0960148119306391 (accessed on 6 September 2022). [CrossRef] [Green Version]
- Ali, S.; Jang, C.M. Optimum Design of Hybrid Renewable Energy System for Sustainable Energy Supply to a Remote Island. Remote Sens. 2020, 12, 1280. [Google Scholar] [CrossRef] [Green Version]
- Khare, V.; Savita Nema, S.; Baredar, P. Solar–wind hybrid renewable energy system: A review. Renew. Sustain. Energy Rev. 2016, 58, 23–33. [Google Scholar] [CrossRef]
- Notton, G.; Nivet, M.; Zafirakis, D.; Motte, F.; Voyant, C.; Fouilloy, A. Tilos, the first autonomous renewable green island in Mediterranean: A Horizon 2020 project. In Proceedings of the 2017 15th International Conference on Electrical Machines, Drives and Power Systems (ELMA), Sofia, Bulgaria, 1–3 June 2017; pp. 102–105. [Google Scholar]
- Kaldellis, J.K.; Zafirakis, D. Prospects and challenges for clean energy in European Islands. The TILOS paradigm. Renew. Energy 2020, 145, 2489–2502. [Google Scholar] [CrossRef]
- National Documentation Centre. Available online: https://www.ekt.gr/el/news/23667 (accessed on 2 August 2021).
- Nikas, A.; Stavrakas, V.; Arsenopoulos, A.; Doukas, H.; Antosiewicz, M.; Witajewski-Baltviks, J.; Flamos, A. Barriers to and consequences of a solar-based energy transition in Greece. Environ. Innov. Soc. Transit. 2020, 35, 383–399. [Google Scholar] [CrossRef]
- Solar Energy Application|Solea. Available online: http://solea.gr/ (accessed on 12 October 2022).
- Kaldellis, J.K.; Doumouliakas, J.; Michalis, K. Chapter 416. Optimum Stand. Alone PV Solution, Including Financial Aspects. In Proceedings of the Renewables: The Energy for the 21st Century World Renewable Energy Congress VI, Brighton, UK, 1–7 July 2000; pp. 1966–1969. Available online: https://www.sciencedirect.com/science/article/abs/pii/B9780080438658504165 (accessed on 25 October 2022).
- Kaldellis, J.K.; Simotas, M.; Zafirakis, D.; Kondili, E.E. Optimum autonomous photovoltaic solution for the Greek islands on the basis of energy pay-back analysis. J. Clean. Prod. 2009, 17, 1311–1323. Available online: https://www.sciencedirect.com/science/article/pii/S0959652609001528 (accessed on 25 October 2022). [CrossRef]
- Giaconia, A.; Grena, R. A model of integration between PV and thermal CSP technologies. Sol. Energy 2021, 224, 149–159. Available online: https://www.sciencedirect.com/science/article/pii/S0038092X21004138 (accessed on 7 August 2022). [CrossRef]
- Weisser, D. On the economics of electricity consumption in small island developing states: A role for renewable energy technologies. Energy Policy 2004, 32, 127–140. Available online: https://www.sciencedirect.com/science/article/pii/S0301421503000478 (accessed on 6 September 2022). [CrossRef]
- Dumka, U.C.; Kosmopoulos, P.G.; Ningombam, S.S.; Masoom, A. Impact of Aerosol and Cloud on the Solar Energy Potential over the Central Gangetic Himalayan Region. Remote Sens. 2021, 13, 3248. [Google Scholar] [CrossRef]
- Elian, A.W.; Facundo, O.; Jacobo, S. Study of UV cloud modification factors in Southern Patagonia. AIP Conf. Proc. 2017, 1810, 110012. [Google Scholar] [CrossRef] [Green Version]
- Global Solar Atlas. Available online: https://globalsolaratlas.info/map (accessed on 25 October 2022).
- Global Monitoring Laboratory—Earth System Laboratory. Available online: https://gml.noaa.gov/ (accessed on 12 October 2022).
- Copernicus Atmosphere Monitoring Service (CAMS). Available online: https://atmosphere.copernicus.eu/global-forecast-plots (accessed on 7 August 2022).
- Eskes, H.; Huijnen, V.; Arola, A.; Benedictow, A.; Blechschmidt, A.-M.; Botek, E.; Boucher, O.; Bouarar, I.; Chabrillat, S.; Cuevas, E.; et al. Validation of reactive gases and aerosols in the MACC global analysis and forecast system. Geosci. Model Dev. 2015, 8, 3523–3543. [Google Scholar] [CrossRef] [Green Version]
- Dee, D.P.; Uppala, S. Variational bias correction of satellite radiance data in the ERA-Interim reanalysis. Q. J. R. Meteorol. Soc. 2009, 135, 1830–1841. [Google Scholar] [CrossRef]
- Lorraine, A.R.; Richard, G.K.; Levy, R.C.; Kaufman, Y.J.; Tanré, D.; Mattoo, S.; Martins, J.V.; Ichoku, C.; Koren, I.; Yu, H.; et al. Global aerosol climatology from the MODIS satellite sensors. J. Geophys. Res. Atmo. 2008, 113. [Google Scholar] [CrossRef] [Green Version]
- Remer, L.A.; Levy, R.C.; Mattoo, S.; Tanré, D.; Gupta, P.; Shi, Y.; Sawyer, V.; Munchak, L.A.; Zhou, Y.; Kim, M.; et al. The Dark Target Algorithm for Observing the Global Aerosol System: Past, Present, and Future. Remote Sens. 2020, 12, 2900. [Google Scholar] [CrossRef]
- Hsu, N.C.; Jeong, M.-J.; Bettenhausen, C.; Sayer, A.M.; Hansell, R.; Seftor, C.S.; Huang, J.; Tsay, S.-C. Enhanced Deep Blue aerosol retrieval algorithm: The second generation. J. Geophys. Res. Atm. 2013, 118, 9296–9315. [Google Scholar] [CrossRef]
- Filonchyk, M.; Yan, H.; Zhang, Z. Analysis of spatial and temporal variability of aerosol optical depth over China using MODIS combined Dark Target and Deep Blue product. Theor. Appl. Climatol. 2018, 137, 2271–2288. [Google Scholar] [CrossRef]
- Fountalakis, I.; Kosmopoulos, P.; Papachristopoulou, K.; Raptis, I.P.; Mamouri, R.E.; Nisantzi, A.; Gkikas, A.; Witthuhn, J.; Bley, S.; Moustaka, A.; et al. Effects of Aerosols and Clouds on the Levels of Surface Solar Radiation and Solar Energy in Cyprus. Remote Sens. 2021, 13. [Google Scholar] [CrossRef]
- Papachristopoulou, K.; Fountalakis, I.; Gkikas, A.; Kosmopoulos, P.; Natsos, P.T.; Hatzaki, M.; Kazadzis, S. 15-Year Analysis of Direct Effects of Total and Dust Aerosols in Solar Radiation/Energy over the Mediterranean Basin. Remote Sens. 2022, 14, 1535. [Google Scholar] [CrossRef]
- Derrien, M.; Le Gléau, H. SAFNWC/MSG Seviri Cloud Products, Météo-France/DP/Centre de Météorologie Spatiale. Available online: http://citeseerx.ist.psu.edu/viewdoc/download?doi=10.1.1.569.8731&rep=rep1&type=pdf (accessed on 25 October 2022).
- Derrien, M.; Le Gléau, H. MSG/SEVIRI cloud mask and type from SAFNWC. Int. J. Remote Sens. 2005, 26, 4707–4732. [Google Scholar] [CrossRef]
- Roebeling, R.A.; Fejit, A.J.; Stamnes, P. Cloud property retrievals for climate monitoring: Implications of differences between SEVIRI on METEOSAT-8 and AVHRR on NOAA-17. J. Geophys. Res. 2006, 111, 20210. [Google Scholar] [CrossRef]
- Mayer, B.; Kylling, A. Technical note: The libRadtran software package for radiative transfer calculations—Description and examples of use. Atmos. Chem. Phys. 2005, 5, 1855–1877. [Google Scholar] [CrossRef] [Green Version]
- Kosmopoulos, P.; Kazadzis, S.; Taylor, M.; Raptis, P.I.; Keramitsoglou, I.; Kiranoudis, C.; Bais, A.F. Assessment of surface solar irradiance derived from real-time modelling techniques and verification with ground-based measurements. Atmos. Meas. Tech. 2018, 11, 907–924. [Google Scholar] [CrossRef] [Green Version]
- Photovoltaic Geographical Information System. Available online: https://re.jrc.ec.europa.eu/pvg_tools/en/ (accessed on 7 August 2022).
- Kaldellis, J.K. Supporting the Clean Electrification for Remote Islands: The Case of the Greek Tilos Island. Energies 2021, 14, 1336. [Google Scholar] [CrossRef]
- Kosmopoulos, P.G.; Kazadzis, S.; El-Askary, H.; Taylor, M.; Gkikas, A.; Proestakis, E.; Kontoes, C.; El-Khayat, M.M. Earth-Observation-Based Estimation and Forecasting of Particulate Matter Impact on Solar Energy in Egypt. Remote Sens. 2018, 10, 1870. Available online: https://www.mdpi.com/2072-4292/10/12/1870 (accessed on 12 October 2022). [CrossRef] [Green Version]
- Masoom, A.; Kosmopoulos, P.; Kashyap, Y.; Kumar, S.; Bansal, A. Rooftop Photovoltaic Energy Production Management in India Using Earth-Observation Data and Modeling Techniques. Remote Sens. 2020, 12, 1921. Available online: https://www.mdpi.com/2072-4292/12/12/1921 (accessed on 12 October 2022). [CrossRef]
- Hellenic Electricity Distribution Network Operator S.A. Available online: https://deddie.gr/en/ (accessed on 7 August 2022).
- Monteiro, A.; Basart, S.; Kazadzis, S.; Votsis, A.; Gkikas, A.; Vandenbussche, S.; Tobias, A.; Gama, C.; García-Pando, C.P.; Terradellas, E.; et al. Multi-sectoral impact assessment of an extreme African dust episode in the Eastern Mediterranean in March 2018. Sci. Total Environ. 2022, 843, 156861. [Google Scholar] [CrossRef]
- Anagnostopoulos, P.; Spyridaki, N.-A.; Flamos, A. A “New-Deal” for the Development of Photovoltaic Investments in Greece? A Parametric Techno-Economic Assessment. Energies 2017, 10, 1173. [Google Scholar] [CrossRef]
- Fountoukis, C.; Figgis, B.; Ackermann, L.; Ayoub, M.A. Effects of atmospheric dust deposition on solar PV energy production in a desert environment. Sol. Energy 2018, 164, 94–100. Available online: https://www.sciencedirect.com/science/article/pii/S0038092X18301270 (accessed on 25 October 2022). [CrossRef]
- Kawamoto, H.; Guo, B. Improvement of an electrostatic cleaning system for removal of dust from solar panels. J. Electrost. 2018, 91, 28–33. Available online: https://www.sciencedirect.com/science/article/pii/S0304388617303169 (accessed on 6 September 2022). [CrossRef]
- Masoom, A.; Kosmopoulos, P.; Bansal, A.; Kazadzis, S. Solar Energy Estimations in India Using Remote Sensing Technologies and Validation with Sun Photometers in Urban Areas. Remote Sens. 2020, 12, 254. [Google Scholar] [CrossRef] [Green Version]
- Raptis, P.I.; Moustaka, A.; Kosmopoulos, P.; Kazadzis, S. Selecting Surface Inclination for Maximum Solar Power. Energies 2022, 15, 4784. [Google Scholar] [CrossRef]
- Evenflow SPRL. Business Plan for the Establishment, Operation and Exploitation of a Solar Farm: Aswan’s Solar Plant Project, Report 2017. Available online: http://solea.gr/wp-content/uploads/2018/03/Aswan-Solar-Plant-Business-Plan.pdf (accessed on 11 November 2022).
- Hofierka, J.; Kaňuk, J. Assessment of photovoltaic potential in urban areas using open-source solar radiation tools. Renew. Energy 2009, 34, 2206–2214. [Google Scholar] [CrossRef]
- Ben-tayeb, A.; Diouri, M.; Meziane, R.; Steli, H. Solar radiation attenuation by aerosol: Application to solar farms. Air Qual. Atmos. Health 2020, 13, 259–269. [Google Scholar] [CrossRef]
- International Energy Agency. World Energy Outlook 2022. Available online: https://www.iea.org/reports/world-energy-outlook-2022 (accessed on 25 October 2022).


| Scenario 0 | Output (kWh/m2) | Output (MWh) | Area (m2) |
|---|---|---|---|
| PV CS 200 KW | 102.97 | 416.47 | 4044.58 |
| PV CdTe 200 KW | 115.44 | 416.47 | 3607.67 |
| Months | Output PV (MWh) | Consumption (MWh) | Energy Coverage Percentage % |
| Jan | 23.08 | 23.00 | 100.35 |
| Feb | 24.57 | 21.00 | 117.01 |
| Mar | 34.50 | 22.00 | 156.81 |
| Apr | 38.97 | 20.75 | 187.79 |
| May | 41.45 | 21.00 | 197.38 |
| Jun | 42.44 | 22.00 | 192.91 |
| Jul | 45.42 | 26.25 | 173.02 |
| Aug | 45.67 | 29.00 | 157.47 |
| Sept | 40.46 | 24.25 | 166.83 |
| Oct | 33.50 | 20.75 | 161.47 |
| Nov | 25.07 | 19.50 | 128.56 |
| Dec | 21.34 | 21.50 | 99.28 |
| Scenario 1 | Output (kWh/m2) | Output (MWh) | Area (m2) |
|---|---|---|---|
| PV CS 500 KW | 102.97 | 1041.16 | 10,111.29 |
| PV CdTe 500 KW | 115.44 | 1041.16 | 9019.06 |
| Months | Output PV (MWh) | Consumption (MWh) | Energy Coverage Percentage % |
| Jan | 57.70 | 68.00 | 84.85 |
| Feb | 61.43 | 66.00 | 93.07 |
| Mar | 86.24 | 67.00 | 128.72 |
| Apr | 97.42 | 65.75 | 148.16 |
| May | 103.62 | 66.00 | 157.00 |
| Jun | 106.10 | 67.00 | 158.36 |
| Jul | 113.55 | 71.25 | 159.36 |
| Aug | 114.17 | 74.00 | 154.28 |
| Sept | 101.14 | 69.25 | 146.05 |
| Oct | 83.76 | 65.75 | 127.39 |
| Nov | 62.67 | 64.50 | 97.17 |
| Dec | 53.36 | 66.50 | 80.24 |
| Scenario 2 | Output (kWh/m2) | Output (MWh) | Area (m2) |
|---|---|---|---|
| PV CS 500 KW | 102.97 | 1041.16 | 10,111.29 |
| PV CdTe 500 KW | 115.44 | 1041.16 | 9019.06 |
| Months | Output PV (MWh) | Consumption (MWh) | Energy Coverage Percentage % |
| Jan | 57.70 | 53.00 | 108.87 |
| Feb | 61.43 | 51.00 | 120.45 |
| Mar | 86.24 | 67.00 | 128.72 |
| Apr | 97.42 | 65.75 | 148.16 |
| May | 103.62 | 66.00 | 157.00 |
| Jun | 106.10 | 67.00 | 158.36 |
| Jul | 113.55 | 71.25 | 159.36 |
| Aug | 114.17 | 74.00 | 154.28 |
| Sept | 101.14 | 69.25 | 146.05 |
| Oct | 83.76 | 65.75 | 127.39 |
| Nov | 62.67 | 49.50 | 126.61 |
| Dec | 53.36 | 51.50 | 103.62 |
| Scenario 3 | Output (kWh/m2) | Output Mirrors (kWh/m2) | Output (MWh) | Area (m2) | Mirrors (m2) |
|---|---|---|---|---|---|
| CSP PT 200 KW | 68.26 | 204.77 | 416.47 | 6101.23 | 2033.84 |
| CSP ST 200 KW | 53.77 | 292.51 | 416.47 | 7745.40 | 1423.78 |
| PV CS 500 KW | 102.97 | 102.97 | 1041.16 | 10,111.29 | 10,111.29 |
| PV CdTe 500 KW | 115.44 | 115.44 | 1041.16 | 9019.06 | 9019.06 |
| Months | Output 500 + 200 KW (MWh) | Total Consumption (MWh) | Energy Coverage Percentage % | ||
| Jan | 70.79 | 68.00 | 104.11 | ||
| Feb | 78.02 | 66.00 | 118.21 | ||
| Mar | 116.26 | 67.00 | 173.52 | ||
| Apr | 136.40 | 65.75 | 207.45 | ||
| May | 152.82 | 66.00 | 231.54 | ||
| Jun | 163.95 | 67.00 | 244.70 | ||
| Jul | 175.81 | 71.25 | 246.75 | ||
| Aug | 169.70 | 74.00 | 229.33 | ||
| Sep | 140.99 | 69.25 | 203.60 | ||
| Oct | 110.05 | 65.75 | 167.37 | ||
| Nov | 78.00 | 64.50 | 120.92 | ||
| Dec | 64.82 | 66.50 | 97.48 | ||
Publisher’s Note: MDPI stays neutral with regard to jurisdictional claims in published maps and institutional affiliations. |
© 2022 by the authors. Licensee MDPI, Basel, Switzerland. This article is an open access article distributed under the terms and conditions of the Creative Commons Attribution (CC BY) license (https://creativecommons.org/licenses/by/4.0/).
Share and Cite
Kosmopoulos, P.G.; Mechilis, M.T.; Kaoura, P. Solar Energy Production Planning in Antikythera: Adequacy Scenarios and the Effect of the Atmospheric Parameters. Energies 2022, 15, 9406. https://doi.org/10.3390/en15249406
Kosmopoulos PG, Mechilis MT, Kaoura P. Solar Energy Production Planning in Antikythera: Adequacy Scenarios and the Effect of the Atmospheric Parameters. Energies. 2022; 15(24):9406. https://doi.org/10.3390/en15249406
Chicago/Turabian StyleKosmopoulos, Panagiotis G., Marios T. Mechilis, and Panagiota Kaoura. 2022. "Solar Energy Production Planning in Antikythera: Adequacy Scenarios and the Effect of the Atmospheric Parameters" Energies 15, no. 24: 9406. https://doi.org/10.3390/en15249406