Article

Refurbishment of Natural Gas Pipelines towards 100% Hydrogen—A Thermodynamic-Based Analysis

1
HyCentA Research GmbH, Inffeldgasse 15, A-8010 Graz, Austria
2
Institute of Thermodynamics and Sustainable Propulsion Systems, Graz University of Technology, Inffeldgasse 19, A-8010 Graz, Austria
*
Author to whom correspondence should be addressed.
Energies 2022, 15(24), 9370; https://doi.org/10.3390/en15249370
Submission received: 31 October 2022 / Revised: 5 December 2022 / Accepted: 7 December 2022 / Published: 10 December 2022
(This article belongs to the Topic Hydrogen Generation, Storage, and Utilization)

Abstract

:
Hydrogen is a key enabler of a sustainable society. Refurbishment of the existing natural gas infrastructure for up to 100% H2 is considered one of the most energy- and resource-efficient energy transportation methods. The question remains whether the transportation of 100% H2 with reasonable adaptions of the infrastructure and comparable energy amounts to natural gas is possible. The well-known critical components for refurbishment, such as increased compressor power, reduced linepack as well as pipeline transport efficiencies, and their influencing factors were considered based on thermodynamic calculations with a step-by-step overview. A H2 content of 20–30% results in comparable operation parameters to pure natural gas. In addition to transport in pipelines, decentralized H2 production will also play an important role in addressing future demands.

1. Introduction

There is a broad consensus that we need to get away from fossil fuels, especially natural gas (NG). The reasons for this are, on the one hand, the high GWP of ~25 [1], the numerous ultra-emissions during production and distribution [2,3], and the difficult strategic and geopolitical relationships with the supplier countries. The world’s dependence on gas imports from a few countries has attracted considerable attention lately. Not only households but also important industry sectors require huge amounts of gas. Natural gas accounted for 25% of all primary energy sources consumed in Europe in 2021 [4]. The majority of it is imported.
The transformation of the energy system towards renewable and independent energy sources offers enormous potential for the elimination of climate-damaging emissions as well as for Europe as a location for science and innovation [5].
Green hydrogen offers the potential to ensure both: a completely sustainable energy supply and mobility, as well as geopolitical independence [6]. However, still only approximately 0.7% of H2 demand is supplied with green hydrogen (from renewables) or from fossil fuel plants equipped with carbon capture and utilization infrastructure (CCUS) [7].
Fast and effective green hydrogen production is necessary. Due to constant sharp cost decreases for renewable energies and the rising efficiencies of electrolysers, the costs for green hydrogen will become more competitive with gray or blue hydrogen (To simplify the different hydrogen production methods, a color code was introduced to label the production processes [8]. The most common are: gray hydrogen, produced by reforming NG and therefore produced from fossil fuels; blue hydrogen, produced by reforming NG but with CO2 captured and stored; green hydrogen, produced by renewable energies via water electrolysis; and brown hydrogen. The least expensive way to make H2 is to turn coal into a gas and then react it with high-temperature steam (steam reforming). This process creates a lot of CO2 emissions.) in the near future [9].
However, there are already a great number of applications for hydrogen, beginning with the chemical industry, which is so far one of the major consumers of hydrogen. Future prognosis predicts a sharp increase in hydrogen demand for all kinds of areas of applications, such as the steel industry and mobility, among many others [10,11]. The resulting hydrogen demand must be met with large import quantities. A conversion from natural gas to renewable hydrogen is in many sectors the most promising approach with minor adaptions [10].
The most practical as well as efficient is a large-scale, centralized production, which also needs a climate-friendly and functional transportation system. Taking advantage of the existing NG infrastructure, such as the pipeline network for transportation and underground storage, such as salt caverns, is an obvious solution. Within the last decade, much research has been conducted in this field, leading to similar research outcomes: the natural gas infrastructure is in most cases suitable for hydrogen with a few adaptions [12,13,14,15].
Repurposing makes it possible for investments in the natural gas networks to continue to be used. This means that climate protection is implemented efficiently as well as in a resource-saving manner. Simultaneously, transportation in repurposed NG-infrastructure offers the highest cost efficiencies over long distances and large volumes [16].
The most critical components/areas are compressors and the reduced linepack, as well as hard steel pipelines, which are mainly used in long-distance, offshore regions [17,18,19].
NG consists mostly of methane (>80% mole percent) and its composition varies depending on the region from which it is extracted. The other components are N2 (1-10%), CO2 (0.1–2%), and other hydrocarbons, such as ethane (1.5–7%), propane (0.1–1.5%), butane (0.003–0.15%), and pentane (0.01–0.07%) [20]. Hydrogen has approx. one-third of the volumetric energy content compared to methane (Table 1). However, in order to keep the velocity intact over long distances, either more powerful compressors or a larger number of compressors are necessary.
Some of the gas properties for hydrogen and methane are summarized in Table 1. If not stated otherwise, all given gas properties are at normal conditions (0 °C, 1.01325 bar). The different gas properties of H2 and NG lead to different flow behaviors that have to be considered in order to establish the transportation of 100% H2 in refurbished NG pipelines. This research paper considers the contributing factors and gives an overview of the technical challenges and the thermodynamic calculations, starting from pure NG and raising the share of H2 up to 100%. As a result, technical potentials, and challenges are derived.
Within the last months, refurbishment of natural gas pipelines for up to 100% H2 has raised increased attention, which has also resulted in a large number of publications. One of the major focus points is still the influence of hydrogen on the pipeline materials, such as embrittlement [24,25,26,27,28,29,30,31,32]. Several authors [24,27,28,32] provide a detailed overview of hydrogen embrittlement and its influence variables. Bouledroua et al. [29] showed that hydrogen embrittlement of steel pipelines in contact with the hydrogen environment, together with the transient gas flow, significantly increased transient pressure values, and also increased the probability of failure of a cracked pipeline. Li et al. [30] provided a detailed overview of hydrogen embrittlement-related problems with specific emphasis on hydrogen behaviors, hydrogen embrittlement and related characterizations, and mitigation strategies. Martin et al. [31] provided proof that X70 pipeline steel fracture toughness and fatigue behavior are within acceptable bounds for hydrogen service. Andrews et al. [25] investigated the influence parameters of fatigue crack growth acceleration and showed that the interaction of cyclic loads and hydrogen makes pipeline steel highly susceptible to cracking.
For the blending of H2, its technical feasibility, effects, and mixing behavior have also been greatly investigated [33,34,35,36,37,38]. Melaina et al. [38] provided a detailed overview of the key issues of blending H2 into NG-pipeline networks. Liu et al. [33] revealed the standing and flowing stratification of H2-CH4 blended gas and verified their findings through experiments. Eams et al. [34] proved that bottom-side injection promotes mixing within the flow interior and reduces wall concentration at the lower surface compared to top-side injection. This helps reduce embrittlement effects based on local hydrogen concentrations. Ekhtiari et al. [35] revealed that H2 concentrations of up to 15.8% occur by using multiple injection points and highlighted the importance of modeling both the gas as well as electricity systems when investigating any potential power-to-hydrogen installations. In a preliminary study, Pellegrini et al. [36] assess the green hydrogen blending potential in the natural gas network as a tool for policy makers, grid and network managers, and energy planners. Vaccariello et al. [37] investigated the blending of hydrogen into distribution gas networks, focusing on the steady-state fluid dynamic response of the grids and gas quality compliance issues at increasing hydrogen admixture levels. The results show that lower probabilities of violating fluid dynamics and quality restrictions are obtained when hydrogen injection occurs close to or in correspondence with the system city gate.
The critical erosive limiting velocity as one limiting technical parameter is discussed in detail by Mischner [39]. The author comes to the conclusion that flow velocities above 40 m/s are permissible in the used NG pipe.
The focus of this work is the calculation of flow characteristics (pressure, velocity, mass flow, etc.) based on the thermodynamic properties of hydrogen compared to natural gas. Questions of technical feasibility are not addressed and would go beyond the scope of this paper. Technical issues are addressed in detail in the papers cited above, among others. The physical properties of the pipe are represented by geometric parameters, operating pressure, and wall roughness. The material, age, and overall condition of the pipe are aggregated using the parameter wall roughness.
This paper will provide a step-by-step overview of the thermodynamic foundations for refurbishing the NG grid. Pressure losses with rising H2 content, which led to increased compressor power, were calculated using MATLAB simulations. The lower energy buffer (linepack) with rising H2 content was also evaluated. Furthermore, thermodynamic calculations of the isentropic and isothermal compression for radial and piston compressors, respectively, were carried out. In order to methodically identify the influence of the H2 concentration, two scenarios were compared, namely, constant energy flow, and constant pressure drop. Finally, to compare the distribution options of pure hydrogen, the thermodynamic transport efficiencies of different transport technologies are compared.

2. Materials and Methods

In this chapter the methodology used in the making of this work will be described.

2.1. Pressure Loss Calculation

A 1-D simulation model for the calculation of pressure loss in a straight pipe was developed in MATLAB. The pressure loss is calculated using the differential form of the Darcy–Weisbach equation [40] as follows:
d p = λ · ρ ( p , T ) · d x D · u 2 2       [ Pa ]
where d x and D are the length and diameter of the pipe segment, respectively, u is the flow velocity, ρ ( p , T ) is the density of the gas, and λ is the Darcy friction factor. Since, due to the pressure drop, the density and velocity (and subsequently the friction factor) can change significantly along a pipe at the pipeline length scale of several km, the differential equation can not be easily solved analytically by simple integration over the whole pipe. Therefore, the pipe was one-dimensionally discretized in the length direction into multiple shorter segments. At a segment length of 1 km, further segment length reduction did not significantly impact the resulting pressure drop over the total pipe length. The friction factor can either be determined from the Moody diagram or calculated using analytical correlations depending on the flow regime [40]. To determine whether the flow is laminar or turbulent, the Reynolds number [40] is calculated from the pipeline diameter, flow velocity, fluid density, and dynamic viscosity of the fluid μ as follows:
R e = D · u · ρ μ       [ ]
Since the gas flow in pipelines is turbulent, which can be verified by plugging the corresponding values from Table 1 into Equation (2), the Colebrook–White equation [40] can be used:
1 λ = 2 · log ( 2.51 R e · λ + k 3.7 · D )       [ ]  
The pipe’s relative roughness k for different materials can be found in tabular form in the literature. The typical values for steel pipes range from 0.02 to 0.15 mm, depending on the pipe’s condition and age [23,40].
Since the friction factor in Equation (3) appears on the left-hand side of the equation and inside the logarithm on the right-hand side, the equation has to be solved numerically. An iterative approach was programmed in MATLAB. The flow diagram can be seen in the figure below (Figure 1). As an initial guess, a reasonable value of 0.012 for the friction factor was chosen, which led to a convergence in less than 10 iterations.

2.2. Mixture Properties

To investigate the effects of hydrogen blending content in the NG grid, different gas compositions were investigated. The gas composition of NG in the grid can vary depending on the gas source, with methane having the highest content [40]. In this work, a methane content of 100% was assumed for the NG for simplicity. For the NG-hydrogen mixtures, the hydrogen volume fraction ν H 2 was increased in steps of 5% up to 100%. For the calculations presented in this work, several fluid properties of the NG-hydrogen mixture are required. The molar mass of the mixture can be calculated as follows:
M mix = M CH 4 · ν CH 4 + M H 2 · ν H 2       [ kg mol   ]
where M i is the molar mass of the pure fluid and ν i is the volume fraction. With the molar mass of the mixture the mass fractions of the gas components can be calculated:
w i = ν i · M i M mix       [ ]
Analogously the following mixture properties are calculated [41,42]:
  • Density:
1 ρ mix = 1 ρ CH 4 · w CH 4 + 1 ρ H 2 · w H 2       [ kg m 3 ]
  • Lower heating value:
L H V mix = L H V CH 4 · w CH 4 + L H V H 2 · w H 2       [ J kg ]
  • Specific heat capacity isobaric:
c p , mix = c p , CH 4 · w CH 4 + c p , H 2 · w H 2       [ J kg · K ]
  • Specific heat capacity isochoric:
c v , mix = c v , CH 4 · w CH 4 + c v , H 2 · w H 2       [ J kg · K ]
For the calculation of the dynamic viscosity of the mixture, the equation derived by Wilke [43] was used:
μ mix = i = 1 n ν i · μ i j ν j · φ i , j [ Pa · s ]
with
φ i , j = ( 1 + ( μ i μ j ) 0.5 ( M j M i ) 0.25 ) 2 ( 8 · ( 1 + M i M j ) ) 0.5   [ ]
The key properties of hydrogen and methane can be seen in Table 1. For the calculation of the real gas properties of hydrogen and methane at specific conditions (temperature, pressure), an interface to the open-source CoolProp [44] library was implemented. A constant operating temperature was assumed in the pipe segment. The average value of the inlet and outlet pressures of the segment was used for the property calls. The equations of state (EOS) for the calculation of real gas properties, such as density, used by CoolProp are based on Helmholtz energy formulations [22,44].

2.3. Scenario Building

Two scenarios investigating the effects of hydrogen content in NG were considered, in order to establish comparability:
  • Scenario 1: constant energy flow E ˙ at different hydrogen contents, with 100% NG as the reference case: E ˙ NG = E ˙ H 2 = const .
  • Scenario 2: constant pressure drop over 100 km at different hydrogen contents, with 100% NG as the reference case; Δ p NG   = Δ p H 2 = const .
Scenario 1 was first and foremost chosen in order to determine if it is possible to transport the same energy content with hydrogen as with NG without changing the infrastructure (pipe dimensions, etc.). Furthermore, the most important result following this scenario is whether additional compressor stations at shorter distances are required, as well as the impact on compressor power. By assuming a constant pressure drop at various NG-H2 mixtures in scenario 2, no additional compressor stations are required compared to the 100% NG reference case. However, with increased H2 content, a decrease in transportable energy is expected in this scenario.

2.3.1. Scenario 1-Constant Energy Flow E ˙

The transported energy content of the gas inside the pipeline can be described as a product of the lower heating value and the mass flow of the gas.
E ˙ = L H V · m ˙       [ W ]
By applying:
m ˙ = A · ρ · u       [ kg s ]
with A as the area of the pipe cross-section, Equation (12) can be rewritten as:
E ˙ = L H V · A · ρ · u             [ J s ]
Due to hydrogen having a lower density than methane, higher flow velocities are required with increased hydrogen content in order to transport the same amount of energy as the 100% NG reference case. Higher flow velocities lead to higher pressure losses, which could require expanding the pipeline infrastructure with further compressor stations. The required flow velocity of the NG-hydrogen mixture can be calculated from the 100% NG reference case using the constant energy flow condition:
E ˙ = L H V CH 4 · A · ρ CH 4 · u CH 4     = L H V mix · A · ρ mix · u mix = const .       [ W ]
It follows:
u mix = u CH 4 ,   ref · ρ CH 4 · L H V CH 4 ρ mix · L H V   mix       [ m s ]
with u CH 4 , ref as the mean velocity of the 100% NG reference case. The pressure loss can be calculated using Equation (1). Since the outlet pressure is required for the calculation of the fluid properties, an iterative approach according to the flow chart in Figure 2 is required. Furthermore, since the density is a non-linear function of pressure, the pressure drop over longer distances is also not linear. Therefore, for the calculation of the pressure drop, the total pipe length is discretized 1D into multiple shorter segments. The approach depicted in Figure 2 is used for each length segment, with the outlet pressure of the i-th segment used as the inlet pressure of the subsequent i+1-th segment: p out ,   i = p in ,   i + 1 .

2.3.2. Scenario 2: Constant Pressure Drop Δp

The pressure drop of 100% NG at the reference flow velocity of 8 m/s over a distance of 100 km is set as a reference for the cases with varying H2/CH4 ratios. With the reference pressure drop, the flow velocity can be calculated by transforming the Darcy–Weisbach equation (Equation (1)). Since the friction factor λ is also a function of the flow velocity, the calculation is performed iteratively by guessing an initial flow velocity. The iterative process is similar to that presented in Scenario 1, with the flow velocity being iterated instead of the outlet pressure.

2.4. Compressor Power and Energy Buffer

To investigate the effects of hydrogen blending content on the required compressor power, the ideal compression process was modeled in MATLAB. The compressor types typically used in pipelines are radial and piston compressors [42]. For the radial compressor, the ideal compression is assumed to be isentropic:
Δ s = c p · ln T 2 T 1 R · ln p 2 p 1 = 0
Using the ideal gas equation [6]:
p · v = R · T M
where v is the specific volume (reciprocal of density) and R the gas constant, Equation (17) can be transformed to the following form:
p · v κ = constant
The isentropic exponent κ is the ratio of the isobaric and isochoric specific heat capacities. The specific work of a radial compressor is calculated as follows:
w o r k = 1 2 v   d p       [ J kg ]
By applying Equation (19) to solve the integral in Equation (20) and multiplying the work with the mass flow, the compressor power of the isentropic radial compressor can be calculated:
P = m ˙ · κ κ 1 · p 1 ρ 1 · ( ( p 2 p 1 ) κ 1 κ 1 )       [ W ]
Indices 1 and 2 indicate the state at the compressor inlet and outlet, respectively.
For the piston compressor, the ideal compression is isothermal. The compressor power of the isothermal piston compressor is calculated as follows for ideal gas:
P = m ˙ · R · T M · ln p 2 p 1       [ W ]
Finally, the energy buffer of a stationary pipeline segment at constant pressure and temperature is calculated by:
E = A · L · ρ ( T , p ) · L H V       [ J ]

2.5. Boundary Conditions of the Reference Case

The typical technical specifications of a gas transport pipeline are selected as input variables for the thermodynamic analysis [20]. One example is the Austrian transport pipeline TAG, which is part of the European Hydrogen Backbone (EHB) and therefore considered to be refurbished until 2030 [45]. The specifications and assumptions are summarized in Table 2 and serve as the main variables of the reference case.
The transported energy amount of 14,856,000 kWh/h presented in the table results from Equation (14) by inserting the average velocity of 8 m/s and the average density over the 100 km distance after performing the iterative calculation according to Figure 2. Thus, this value represents the reference transportable energy amount for the constant energy flow scenario (Scenario 1).

3. Results and Discussion

In the following chapter, the results of the thermodynamic analysis are illustrated and discussed. As a reference case, 0% H2 at 8 m/s and 70 bar operating pressure are assumed in the depictions below.

3.1. Validation of the Analytical Approach with CFD Simulation Models

As a first validation step, the resulting pressure drops as well as the shapes of the calculated curves (velocity and pressure over the distance, transportable energies as a function of hydrogen content, etc.) were compared quantitively and qualitatively, respectively, with literature, showing good agreement. The publications with similar model approaches used for the comparison and validation include Haeseldonckx et al. [19], Adam et al. [21], Abbas et al. [46], Mischner [23], and Krieg [47].
To verify the accuracy of the 1D pressure drop model in MATLAB in comparison to results obtained by solving the complete set of Navier–Stokes equations and turbulence models, the results from the 1D model were compared and validated using a 2D CFD simulation model in the commercial software ANSYS Fluent [48]. The axis-symmetric geometry of a straight pipe segment with a length of 500 m was modeled and meshed, see Figure 3.
The simplification of using a 2D axis symmetric geometry instead of the full 3D model was performed, since no relevant 3D phenomena occur in such types of simple pipe flow. For the inlet boundary conditions, an operating pipeline pressure of 70 bar was prescribed. Three cases with different gas compositions were considered: 100% CH4, 50% CH4 50% H2, and 100% H2. From Equation (15), the required mass flows of the mixtures, to satisfy the constant energy flow condition, can be calculated. These mass flows are prescribed at the outlet boundary condition of the respective case. The relevant model settings and boundary conditions of the 2D CFD validation cases are summarized in Table 3 and Table 4, respectively. The cell size was gradually reduced to ensure mesh independence from the results.
The conservation equations for continuity, momentum, energy, and turbulence, as well as species for Case 2, were solved until convergence was reached [48]. The convergence was determined by the residuals of the respective conservation equation falling several orders of magnitude, as well as by tracking the outlet pressure of each iteration until it was constant. The pressure drop over the 500-m long segment was calculated and compared with the results obtained from the MATLAB model, see Table 5. The relative error presented in the table is calculated by dividing the absolute error (absolute difference of the pressure drops calculated by the two models) by the pressure drop calculated in Fluent. For Case 1 and Case 3 with 100% CH4 and 100% H2, respectively, the difference between Fluent and MATLAB is below 100 Pa, showing excellent agreement. By linearly extrapolating this difference over 500 m to 100 km, the error is below 20 kPa. The relative error in both cases is below 1%. A slightly higher discrepancy between the pressure drops of the models was obtained for Case 2, where a 50% CH4 50% H2 mixture was calculated. The difference for the 500-m segment is 508 Pa with a relative error of approx. 4.6%. After extrapolation to 100 km, where the pressure drop is between 30 and 40 bar depending on the mixture composition, this results in a discrepancy between the models of 1–1.5 bar. Although the discrepancy is bigger compared to the other two cases, the impact on the results presented in this work is still negligible. Therefore, it can be concluded that the MATLAB pressure drop model and its accuracy are sufficient for the calculations presented in this work.

3.2. Energy Transported Ė

The lower volumetric heating value L H V of methane is approximately three times higher than that of hydrogen, and the density is even approximately nine times higher (see Table 1). Therefore, the analysis of the amount of energy Ė that can be transported with an NG/H2 blend in refurbished pipelines is a particularly relevant parameter. In order to establish comparability between NG and H2 energy transport, as an input constraint, the driving pressure gradient ΔpH2 = ΔpNG = 18.2 bar is the same for both (reference case condition).
Figure 4a shows the result of the relative Ė as a function of the H2 volume fraction in NG. The course of the chart shows that the transportable energy has a minimum at approximately 90% H2 volume fraction. Ė of a pure H2 pipeline is 83% compared to the maximum transport capacity of NG.
The characteristic of the profile of Ė can be revealed by further analysis of its equation (Equation (15)). The lower heating value L H V and density ρ of the blend decrease linearly with the volumetric fraction of H2. The function of the flow velocity (Figure 4c, Δp = const.) in terms of the H2 volume fraction is non-linear. Higher H2 content leads to disproportionately higher velocities. Up to approx. 90% of the H2 volume fraction, the increasing velocity cannot compensate for the decreasing values of L H V and ρ (the first total derivative of Equation (14) with respect to the H2 volume fraction is negative). At volume fractions above 90%, the high positive velocity gradient leads to an increase in Ė.
Scenario Δp = const in Figure 4c represents the initial boundaries ΔpH2 = ΔpNG and therefore the same constraints for calculation of Ė above (Figure 4a). As it can be seen, the flow velocity and correspondingly the volume flow (Figure 4c) increase, which thus compensates for the decreasing volumetric heating value of H2. The calculated flow velocity is maximum at 100% hydrogen fraction (25 m/s), and the value is approximately three times higher than the flow velocity of pure NG. In order to keep the energy transport at a constant level, the flow velocity has to rise even more (Scenario 1: ĖH2 = ĖNG = const. in Figure 4c). In order to transport an equal amount of energy Ė with pure hydrogen compared to 100% NG, the flow velocity has to reach a ratio of 36 m/s and, thus, almost quadruple. The increase in flow velocity implies two problems that need to be investigated for practical application but are beyond the scope of this work: erosive effects on the pipe material, as well as oscillation and corresponding noise emissions. Both contribute to fatigue and a reduced lifespan.
Scenario 1 (ĖH2 = ĖNG = const.) can also be used to derive the pressure drop over the transport distance as a function of the H2 fraction (Figure 5).
Compression should occur after a pressure drop of approx. 50% for the compressor to be able to operate at a favorable pressure ratio. With the chosen boundary and framework conditions (Table 2), pure NG has to be re-compressed after a distance of approx. 165 km. In contrast, H2 has to be compressed after approx. 100 km. Currently used radial compressors tolerate an H2 share of up to 40% [49]. In order to be able to transport the same amount of energy, compression must take place after approximately 150 km at a 40% H2 share. Current guidelines of the ÖVGW in Austria and the DVGW in Germany allow a H2 share of 10% [50]. In this case, the pressure level would drop from the current 35 bar to approximately 32 bar upon arrival at the compressor station. This calculated pressure difference can be classified as unproblematic.

3.3. Compressor Power

Raising the H2 fraction leads to an increase in compressor power (Figure 6). Analyzing the thermodynamic equivalent process, both compressor working principles (piston and radial compressor) are nearly equal in energy consumption. In order to apply an equal pressure drop (Figure 6, Δp = const.), the compressor power consumption increases up to 240%. To ensure constant energy flow (Figure 6, Ė = const.), the compressor capacity increases to 720–780% at 100% H2.
Based on the technical operating principles of the two compressor technologies, piston compressors can compress H2 with high efficiency. At the same time, however, they reach limits in terms of volume flow. By raising the number of cylinders, increasing the drive power and arranging several compressors in parallel, piston compressors can be operated economically up to a volume flow of approx. 750,000 m3/h [51]. For higher volume flows, radial compressors are used. The higher flow rate of H2 results in a higher impeller speed c. Specifically, the speed increases with the ratio of the flow velocities under the square root (Equation (24)). For both scenarios, this means an increase in c by a factor of 1.7–2.
c H 2 c NG = u H 2 u NG
At the same time, this means that the mechanical stress on the blades increases with the square of c. This leads to a higher mechanical load by a factor of 2.89–4 [51].
As a consequence, rotational speeds and impeller diameters have to be reduced in order to not exceed the permissible impeller tip speed. Studies have shown, that compression ratios of 1:1.3 per impeller and peripheral speeds of 700 m/s are recommended for efficient compression. Currently, no radial compressor that can fulfill these requirements for operating at a share of 100% H2 is available on the market. One reason for this is that there are no suitable test environments for extensive investigation of oscillation behavior and lifespan. In general, it is expected that in the near future a radial compressor will be developed that meets the requirements of 100% H2 [52].

3.4. Energy Buffer

An important function of pipelines is to buffer energy. When there is little or no demand at the receiving side, the transport flow velocity approaches zero, and the pipeline acts as a storage tank. This case is shown in Figure 7. The reference case (70 bar, 100% NG) is used for the relative representation of the buffered energy as a function of pressure level and H2 fraction.
The chart shows that the buffered energy decreases with rising H2 volume fraction. The reason for this is the lower volumetric heating value of hydrogen, which is approximately three times lower (see Table 1). Correspondingly, at 70 bar the stored energy with 100% H2 is approximately 70% less compared to that with pure NG. Increasing the pressure to 100 bar would increase the buffered energy to approximately 35%. Storage options with higher pressure levels off-grid thus become more important.

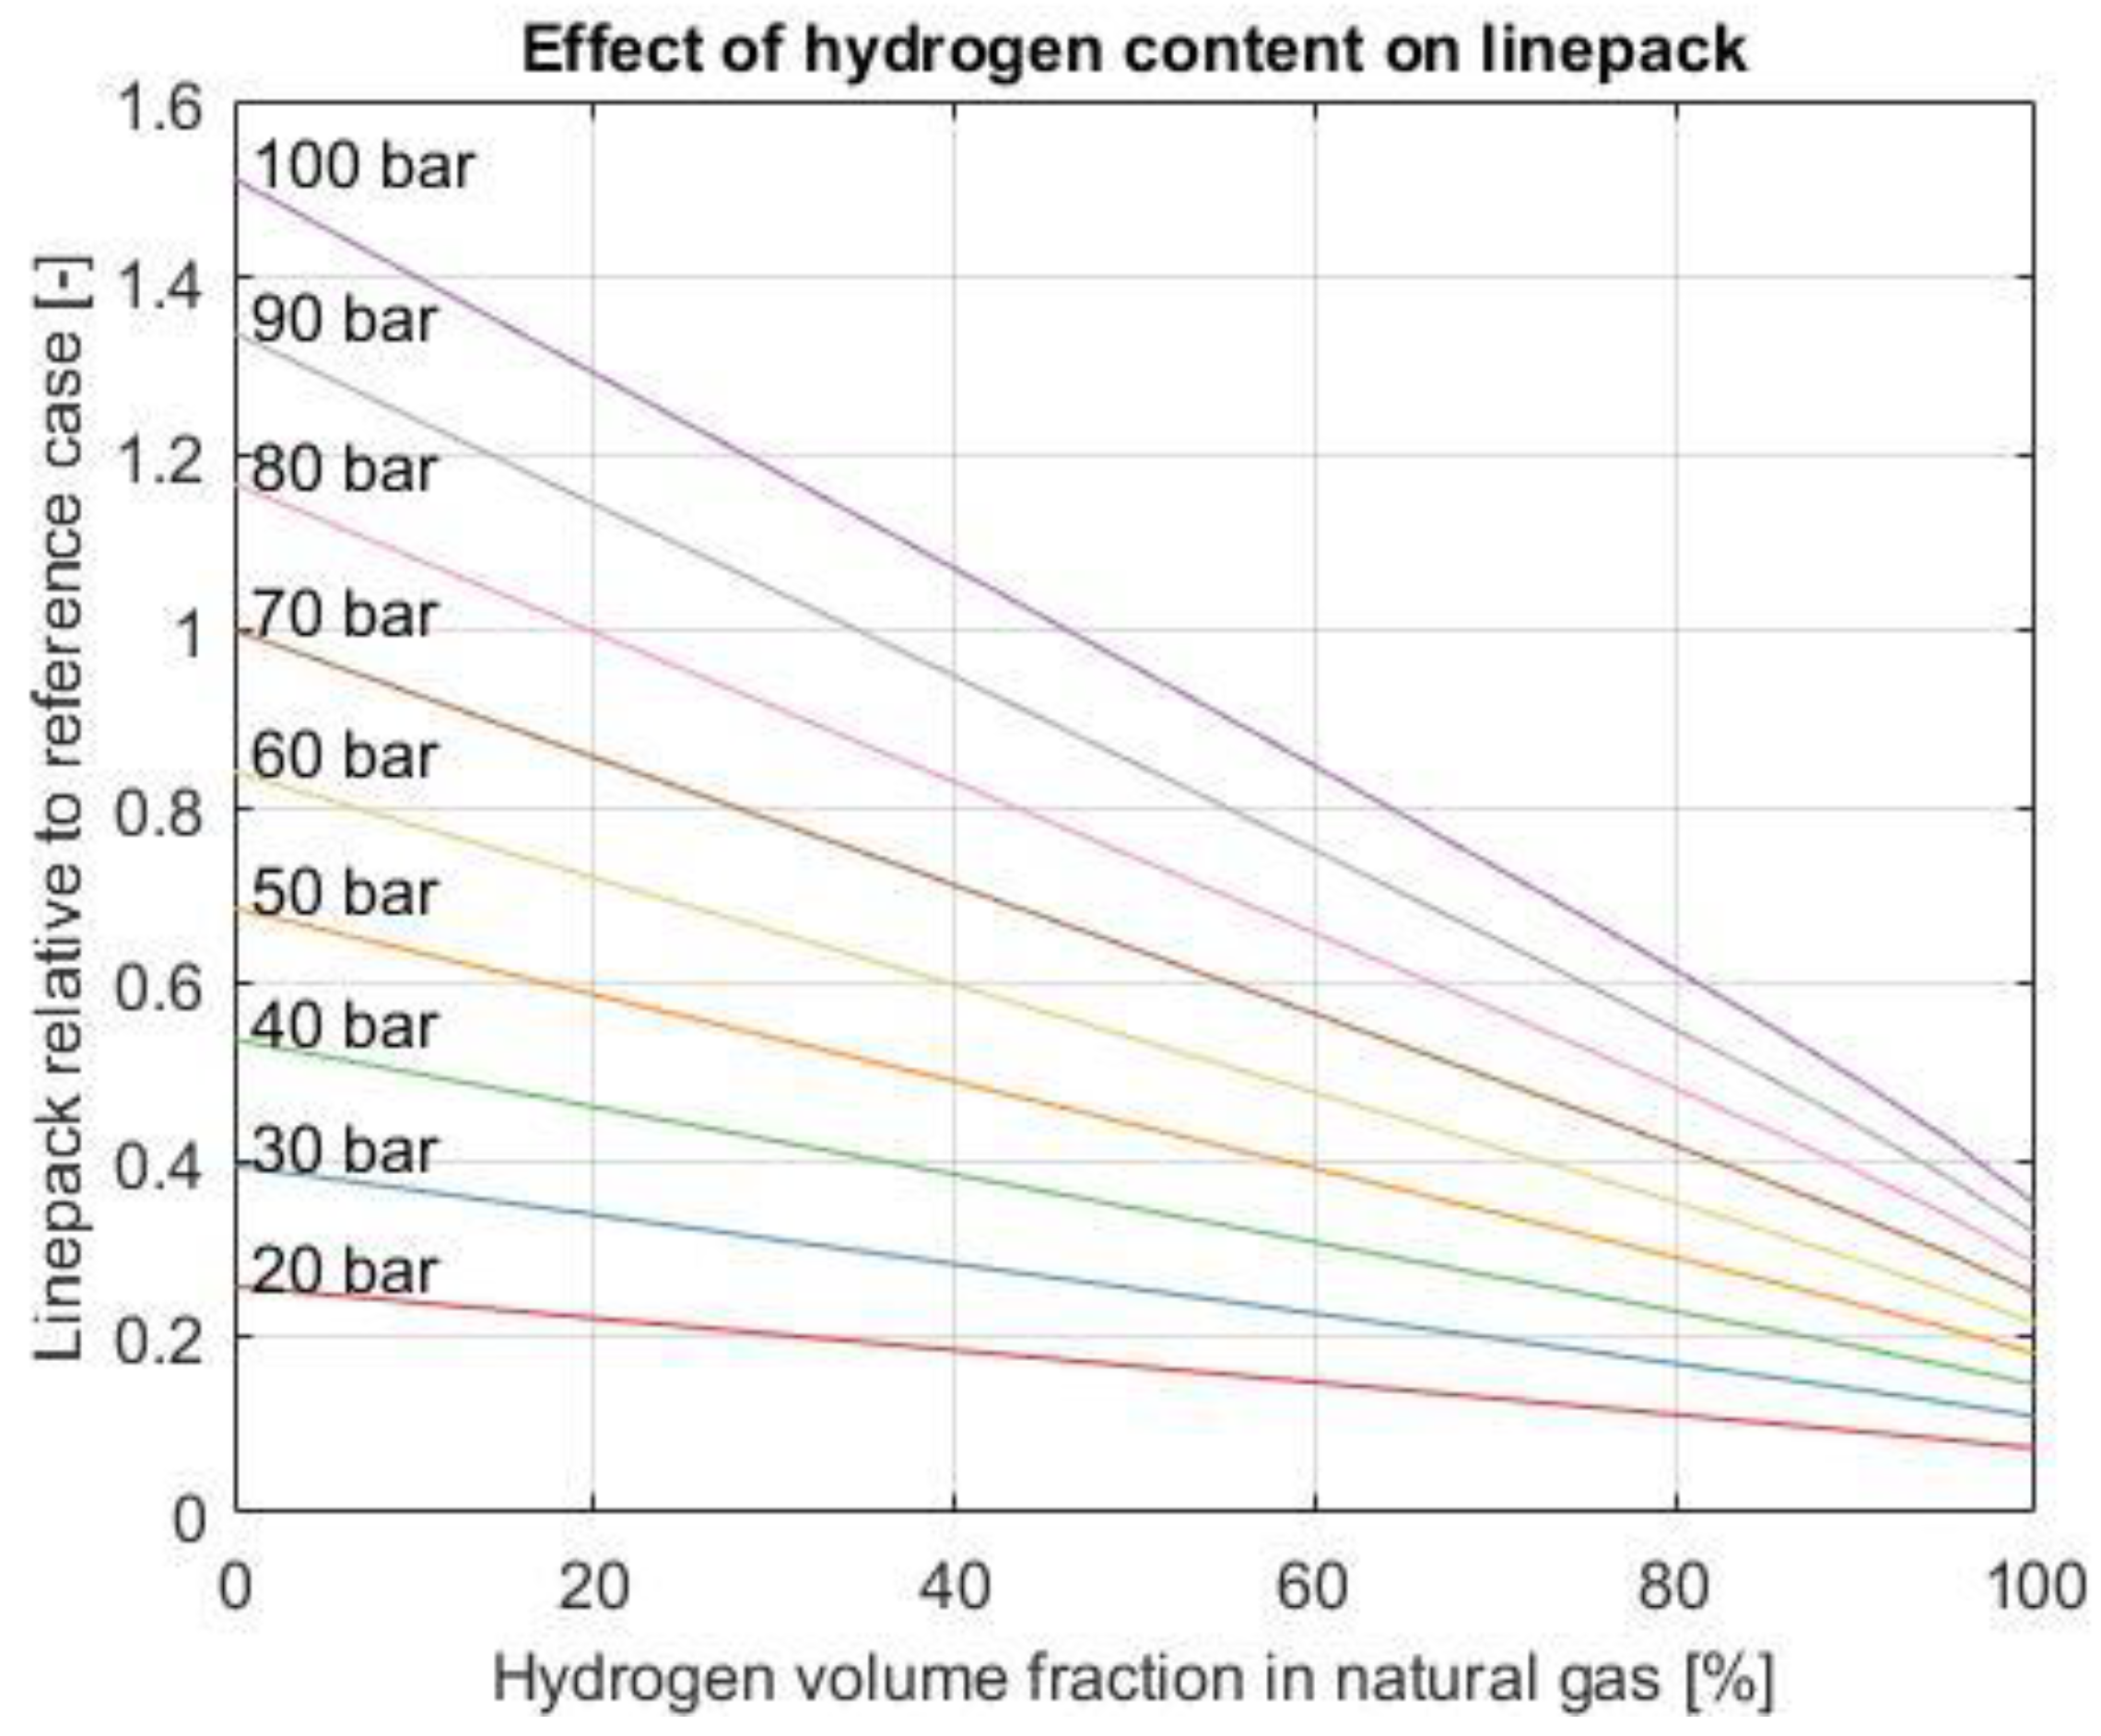
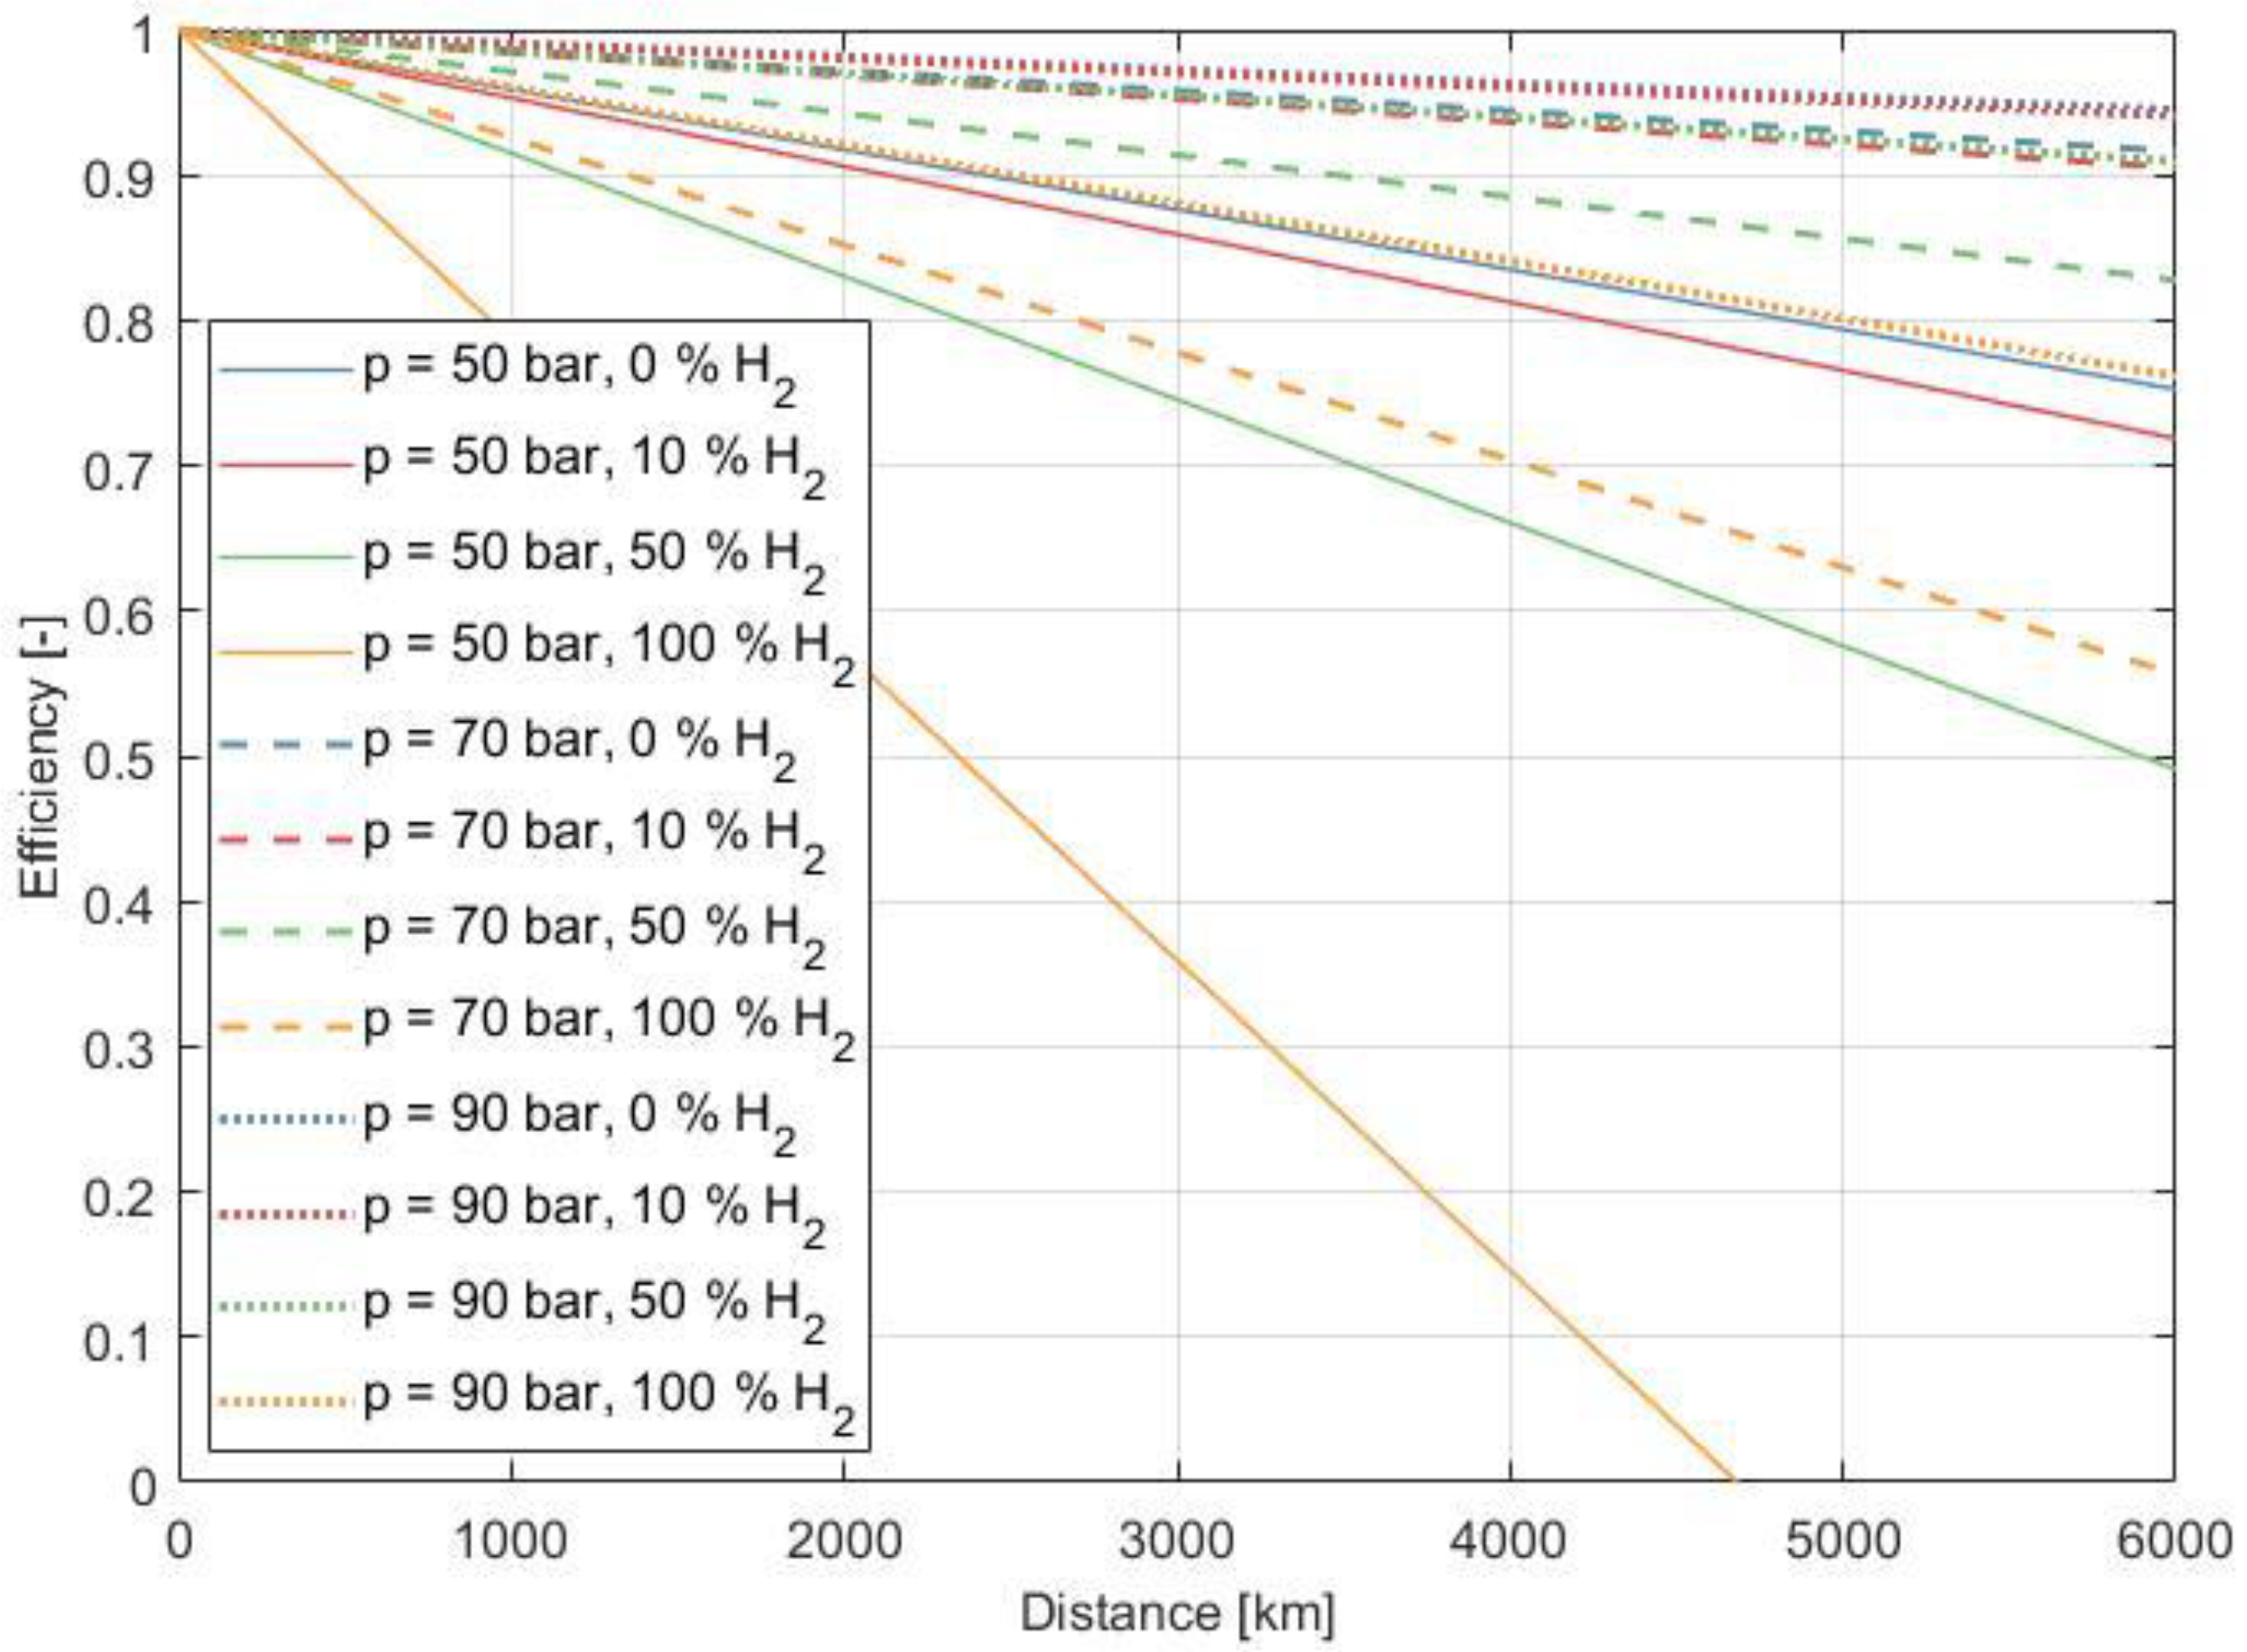
3.5. Pipeline Transport Efficiency η T

A suitable parameter for evaluating the power consumption for compression P is the transport efficiency η T (Equation (25)). Since both chemically bound energy and calculated power consumption represent pure exergy, the comparison is permissible (efficiencies of both compressor types are considered to be 100% in order to compare basic thermodynamical behavior).
η T = E ˙ P E ˙       [ ]
One of the core questions is: What transport efficiency can be achieved over relevant transport distances? To answer this question, the total compressor power P is calculated. In order to establish comparability, it is assumed that the same amount of energy is transported as with NG (Scenario 1 ĖH2 = ĖNG = const.). Analogous to the transport of NG, it is also assumed that recompression to the operating pressure takes place after a pressure loss of 50%. The results are depicted in Figure 8. The required recompressions are marked with asterisks.
A transport distance of approximately 3000 km corresponds to the distance from Morocco to Central Europe (linear distance). This distance can be covered with an efficiency of nearly 78% under the chosen, representative framework conditions. At 5000 km, the efficiency is 63% for pure H2.

3.6. Influences on Transport Efficiency η T

In this chapter, the parameters wall roughness k, pressure level MOP and diameter D and their influence on the transport efficiency η T are investigated. To establish comparability, Scenario 1 (ĖH2 = ĖNG = const.) and the reference case parameters are assumed as framework and boundary conditions. The analyzed parameters were varied in order to quantify their influence on the transport efficiency.

3.6.1. Wall Roughness k

In repurposed pipelines, wall roughness is a core parameter. To quantify the influence, the values 0.1 and 0.01 mm are chosen as the upper and lower bounds, respectively. According to the literature, 0.1 represents a used, rusty pipe with deposits. In contrast, 0.01 represents the roughness of a new steel pipe [20]. Further special resistances, which are generated by pitches, flanges, weld seams, etc., are deliberately not taken into account here in order to be able to consider entirely the influence of the wall roughness. The total flow resistances can only be calculated for the specific application with other methods (e.g., CFD simulation). These are not the subject of the considerations here. Figure 9 depicts the results.
The influence of wall roughness is significant and becomes more relevant with increasing H2 volume share. This can be clearly derived from the increasing difference between the curves for 100% H2 compared to 0% H2 (marked violet in Figure 9). After 3000 km of transport distance, the difference in transport efficiency at 0% H2 share is 1–2 percentage points, while at 100% H2 it is approximately 7 percentage points. For the transport of 100% H2, this means that a reduction of the wall roughness from 0.1 to 0.01 mm enables approximately 800 km longer transport with the same energy input (3000 km instead of 2200 km). This signifies that measures to reduce wall roughness prior to conversion to 100% H2 will contribute significantly to reducing the required compressor power and thus enhance economic and energetic efficiency.

3.6.2. Operating Pressure MOP

Another parameter that can be varied in repurposed pipelines is the maximum operating pressure MOP. The following Figure 10 illustrates the influence of the operating pressure on the transport efficiency.
Again, it can be derived that the influence of the operating pressure on the transport efficiency becomes more significant with increasing H2 share. Higher operating pressure leads to an increase in compressor power due to a less favorable compression ratio and, in absolute numbers, higher compression work. This can also directly be derived from Equation (20). The compressor inlet pressure p 1 (= pipeline pressure after the pressure drop) linearly increases the compressor power P . However, fewer compressor stations are required, as a larger distance can be covered with a relatively constant pressure loss of 50%. Therefore, although the compressor power per station increases, the decrease in the nr. of stations leads to an overall increase in the transport efficiency over long distances.

3.6.3. Pipeline Diameter

One approach for making pipelines H2-ready is to use liners to combine both H2-compatible materials and reduced wall roughness [53]. The diameter can also be changed during this process. A significant reduction in diameter can also be intentionally caused in order to adapt the transport volume to the production capacities. Therefore, the influence of the diameter on the transport efficiency is examined in Figure 11.
According to Equation (1), the diameter D influences the pressure drop Δp linearly and indirectly proportionally which explains the effect. Thus, the pressure drop decreases with increasing diameter. In terms of repurposing existing pipelines, increasing the diameter is not a realistic option. It is shown that a reduction of the diameter, by using liner inserts f.e., negatively affects the transport efficiency if the same amount of energy shall be transported compared to the reference case. The reduction in diameter therefore also results in a decrease in the transported energy.

3.6.4. Distance between Compressor Stations for Hydrogen Pipeline Transport

All influencing variables become visible when illustrating the required number of compressor stations. For this purpose, Figure 12 shows the number of recompression steps for the transport of 6000 km.
As can be seen from the illustration for the reference case, with today’s compressor distance and current framework conditions, a H2 share of up to 20% can be implemented without any restrictions and the same amount of energy can be transported as with pure NG. This statement also corresponds to the above findings regarding transport efficiency and transportable energy amount. With slight adjustments to the operating conditions, an increase to 40% is also possible by using existing infrastructure and recompression distances. Furthermore, it can be seen that a reduction in friction from k = 0.1 to k = 0.01 mm leads to a significant decrease in number of recompressions from 60 to 43 for the 100% H2 case. Additionally, it can be derived that the increase in diameter as well as pressure level results in a reduction in the number of required compressor stations.

3.7. H2 transport Efficiencies of Different Distribution Technologies

The scenarios analysed above compare the transport efficiencies of different H2-NG mixtures. In this sub-chapter, the efficiency of different transport technologies for the distribution of pure H2 are compared. In [54] the transport efficiencies of different distribution options are initially compared and discussed. These considerations shall now be expanded with the findings from this work. The following means of on-land transportation will be considered: GH2 200 bar trailer ( m H 2 , load = 300 kg H2 loading capacity), GH2 500 bar trailer ( m H 2 , load = 1100 kg H2), liquid hydrogen trailer ( m H 2 , load = 3500 kg H2) and pipeline transport. For the pipeline transport efficiency, the curve according to Figure 8 at 100% H2 is selected. The transport efficiency as a function of the distance x for the transport by trailer can be calculated as follows:
η T ( x ) = E 0 E Transport · x m H 2 , load · L H V       [ ]
E0 represents the initial required compression work at different pressure levels or the liquefaction energy for the gaseous and liquid storage respectively. For the initial compression work, isothermal compression from 1 bar to the pressure level for transport (200, 500 bar) with a piston compressor (according to Equation (22)) is assumed. Energy demand for liquefaction of 1 kg H2 is usually cited in literature at approx. 30% of its gravimetric energy density (LHV) and thus amounts to 36 MJ/kg [6].
The average fuel consumption of a trailer is 30 litres of diesel per 100 km [55]. In the case of H2 transport, however, it must be assumed that the trailer has to travel the same distance back empty, as an alternative freight cannot be transported for technical reasons. This means that the fuel demand effectively doubles and is therefore 60 litres per 100 km of distance between hydrogen source and hydrogen consumer, resulting in approx. ETransport = 25.56 MJ/km. For the purposes of this analysis, the fuel consumption is assumed constant and independent of the loading state or routing. The results are plotted in Figure 13.
The direct comparison of the different transport efficiencies is slightly biased due to the different characteristics of the means of transport. Pipeline transport allows for continuous mass flow and 24/7 operation. In addition, a multiple of the mass of a trailer load can be transported. However, pipeline transport requires a complex and strategically long-term infrastructure. Trailer transport is discontinuous and much more flexible. On the other hand, only significantly smaller quantities can be transported. To transport larger quantities via trailers, more vehicles are required, creating a logistic problem and traffic congestion as well as increased CO2-emissions if powered by fossil fuels. Nevertheless, the diagram allows a basic assessment of the efficiencies that can be achieved:
  • Pipeline transport is the most energy-efficient method of transporting H2 on land in large quantities and over long distances.
  • GH2 efficiency increases significantly with the pressure level. The losses for the initial compression are marginal compared to the transport losses.
  • LH2 liquefaction efforts are amortized after approx. 2200 km of trailer transport.

4. Conclusions and Outlook

This paper provides a methodological approach using thermodynamic and pressure drop models for the assessment of the influence of the hydrogen volume fraction in natural gas on various key technical parameters. The model allows for rapid parameter studies for different boundary and framework conditions. The main focus lies on the calculation of the transportable energy content, pressure drop, compressor power, and required distance between stations, as well as the energy storage capacity of a stationary pipe segment. Operating and framework conditions of a typical transport pipeline (DN1000, 70 bar, 8 m/s) were set as benchmarks for comparison.
The results show that transporting the same energy content as the benchmark case (100% NG) is possible from a technical standpoint, even at 100% H2. However, mixtures with higher hydrogen content require additional compressor stations at shorter distance intervals as well as increased compressor power per station. For pure hydrogen, the compressor power per station is greater by a factor of 2–3 compared to the reference case for the same compression ratio, while the required distance between compressor stations decreases by 33%. This leads to a significant decrease in transport efficiency of up to 37%, over long distances up to 6000 km. However, for lower hydrogen contents up to 30%, the decrease in transport efficiency is below 7%, while the compressor power is greater by a manageable factor of ~1.5.
Furthermore, due to hydrogen having a smaller density than NG, the linepack at 100% H2 decreases by 70% relative to the reference case. Even if the pressure is increased up to 100 bar, the storage capacity with 100% H2 is below 40% relative to the reference case. This leads to the need for off-grid storage options in order to be able to compensate for failures or fluctuations.
Lastly, the influence of the pipe diameter, wall roughness, and operating pressure on transport efficiency were investigated. It can be concluded that higher operating pressures are beneficial for transport efficiency. However, the maximum permissible pressure is limited depending on the materials used. Furthermore, the wall roughness shows a significant impact on transport efficiency. For new steel pipes (0.01 mm roughness), the increase in transport efficiency is up to 10% depending on the scenario compared to older pipes (0.1 mm roughness) due to lower friction and subsequently lower pressure loss per unit distance. Minimizing the wall roughness can be achieved either through regular maintenance or the use of special liner materials. While the increase in diameter also leads to higher transport efficiencies, it would require a complete restructuring of the existing pipelines, which contradicts the motivation of this work regarding refurbishing the existing infrastructure. Pipelines with lower diameters are only suitable at shorter distances or for the transport of lower energy content.
Research in the field of the H2 pipeline will continue at HyCentA. Currently, H2 quality is being intensively analyzed. When transporting H2 in the repurposed NG grid, achievable H2 quality plays a crucial role. Depending on the consumer, high demands can be placed on purity. This is contrasted with the history and use of NG pipelines. Experience shows that various groups of substances, e.g., from odorization to adsorption processes on the pipeline wall and deposition at low points, can still be detected many years after entry into this pipeline has ended. When transporting H2, these contaminants will desorb from the pipe walls and enter the gas. These contamination levels and achievable H2 quality are currently being analyzed at the HyCentA. Furthermore, the H2-compatibilities of individual components of the NG infrastructure, such as valves and seals, are characterized. In the course of this project, in Austria, the first NG pipeline will also be repurposed for the transport of H2.

Author Contributions

Conceptualization, N.K., T.S., I.G. and A.T.; methodology, N.K., T.S. and I.G.; software, N.K.; validation, N.K. and T.S.; formal analysis, N.K. and T.S.; investigation, N.K., T.S. and I.G.; resources, M.S. and A.T.; data curation, N.K. and T.S.; writing—original draft preparation, N.K., T.S. and I.G.; writing—review and editing, N.K., T.S., I.G. and A.T.; visualization, N.K. and I.G.; supervision, M.S. and A.T.; project administration, M.S. and A.T.; funding acquisition, M.S. and A.T. All authors have read and agreed to the published version of the manuscript.

Funding

This research was funded by the Austrian Research Promotion Agency FFG as part of the project “UpHy-II” (grant number 887041), as well as funded within the COMET program by the Federal Ministry Republic of Austria (BMK, BMDW), the “Steirische Wirtschaftsförderungsgesellschaft”, and the province of Upper Austria as part of “HyTechnonomy“ (grant number 882510).

Data Availability Statement

Not applicable.

Acknowledgments

The authors would like to thank all participating industrial and scientific partners as well as the Hydrogen Initiative Flagship Region Austria Power & Gas (WIVA P&G).

Conflicts of Interest

The authors declare no conflict of interest.

References

  1. Myhre, G.; Shindell, D.; Bréon, F.-M.; Collins, W.; Fuglestvedt, J.; Huang, J.; Koch, D.; Lamarque, J.-F.; Lee, D.; Mendoza, B.; et al. Anthropogenic and Natural Radiative Forcing. In Climate Change 2013: The Physical Science Basis. Contribution of Working Group I to the Fifth Assessment Report of the Intergovernmental Panel on Climate Change; Stocker, T.F., Quin, D., Plattner, G.-K., Tignor, M., Allen, S.K., Boschung, J., Nauels, A., Xia, Y., Bex, V., Midgley, P.M., Eds.; Cambridge University Press: Cambridge, UK; New York, NY, USA,, 2013; pp. 659–740. [Google Scholar]
  2. Lauvaux, T.; Giron, C.; Mazzolini, M.; d’Aspremont, A.; Duren, R.; Cusworth, D.; Ciais, P. Global assessment of oil and gas methane ultra-emitters. Science 2022, 375, 557–561. [Google Scholar] [CrossRef] [PubMed]
  3. Irakulis-Loitxate, I.; Guanter, L.; Liu, Y.-N.; Varon, D.J.; Maasakkers, J.D.; Zhang, Y.; Wofsy, S.C.; Thorpe, A.K.; Duren, R.M.; Frankenberg, C.; et al. Satellite-based survey of extreme methane emissions in the Permian basin. Sci. Adv. 2021, 7, eabf4507. [Google Scholar] [CrossRef] [PubMed]
  4. Statistical Review of World Energy. 2021|70th Edition. 2021. Available online: Bp.com/energyoutlook (accessed on 14 June 2022).
  5. Trattner, A.; Klell, M.; Radner, F. Sustainable hydrogen society–Vision, findings and development of a hydrogen economy using the example of Austria. Int. J. Hydrog. Energy 2022, 47, 2059–2079. [Google Scholar] [CrossRef]
  6. Klell, M.; Eichlseder, H.; Trattner, A. Wasserstoff in der Fahrzeugtechnik; Springer: Berlin/Heidelberg, Germany, 2018. [Google Scholar]
  7. International Energy Agency, I.E.A. The Future of Hydrogen: Seizing Today’s Opportunities. Report Prepared by the I.E. A for the G20, Japan. Available online: https://iea.blob.core.windows.net/assets/9e3a3493-b9a6-4b7d-b499-7ca48e357561/The_Future_of_Hydrogen.pdf (accessed on 7 June 2022).
  8. Winters, J. What Are the Colors of Hydrogen. Available online: https://www.asme.org/topics-resources/content/infographic-what-are-the-colors-of-hydrogen (accessed on 30 November 2022).
  9. World Energy Council. Hydrogen Demand and Cost Dynamics: Working Paper. Available online: https://www.worldenergy.org/publications/entry/working-paper-hydrogen-demand-and-cost-dynamics (accessed on 28 March 2022).
  10. Wang, A.; Jaro, D.; Mavins, D.; Moultak, M.; Schimmel, M.; van der Leun, K. Analysing Future Demand, Supply, and Transport of Hydrogen. European Hydrogen Backbone. Available online: https://gasforclimate2050.eu/?smd_process_download=1&download_id=718 (accessed on 9 November 2021).
  11. European Hydrogen Backbone. Five Hydrogen Supply Corridors for Europe in 2030, May 2022. Available online: https://ehb.eu/files/downloads/EHB-Supply-corridor-presentation-Full-version.pdf (accessed on 24 October 2022).
  12. Wang, A.; van der Leun, K.; Peters, D.; Buseman, M. European Hydrogen Backbone: How Dedicated Hydrogen Infrastructure Can Be Created. Available online: https://gasforclimate2050.eu/?smd_process_download=1&download_id=471 (accessed on 9 November 2021).
  13. ENTSOG, Gas Infrastructure Europe, Hydrogen Europe. Transport & Speicherung von Wasserstoff: Zahlen & Fakten. Available online: https://www.gasconnect.at/fileadmin/Broschueren-Folder/entsog_gie/entsog_gie_he_QA_hydrogen_transport_and_storage_DE_210630.pdf (accessed on 9 November 2021).
  14. Linke, G. Technical-Economic Considerations of Delivering Hydrogen via the Gas Grid: H2 Research, Standards and operational Support of the German Gas & Water Association (DVGW). 2021. Available online: https://www.irena.org/events/2021/Dec/Hydrogen-in-the-Gas-Grid-Workshop-Series (accessed on 15 November 2022).
  15. European Union Agency for the Cooperation of Energy Regulators. Transporting Pure Hydrogen by Repurposing Existing Gas Infrastructure: Overview of Existing Studies and Reflections on the Conditions for Repurposing. Available online: https://acer.europa.eu/Official_documents/Acts_of_the_Agency/Publication/Transporting%20Pure%20Hydrogen%20by%20Repurposing%20Existing%20Gas%20Infrastructure_Overview%20of%20studies.pdf (accessed on 30 September 2022).
  16. International Renewable Energy Agency, I.R. ENA. Geopolitics of the Energy Transformation: The Hydrogen Factor. Available online: https://www.irena.org/-/media/Files/IRENA/Agency/Publication/2022/Jan/IRENA_Geopolitics_Hydrogen_2022.pdf (accessed on 15 November 2022).
  17. Fink, S. Untersuchung zur Wasserstoffversprödung von Gasrohrleitungen; Technische Universität Graz: Graz, Austria, 2021. [Google Scholar]
  18. Gondal, I.A.; Sahir, M.H. Prospects of natural gas pipeline infrastructure in hydrogen transportation. Int. J. Energy Res. 2012, 36, 1338–1345. [Google Scholar] [CrossRef]
  19. Haeseldonckx, D.; D’haeseleer, W. The use of the natural-gas pipeline infrastructure for hydrogen transport in a changing market structure. Int. J. Hydrog. Energy 2007, 32, 1381–1386. [Google Scholar] [CrossRef]
  20. Horlacher, H.-B.; Helbig, U. Rohrleitungen 2; Springer: Berlin/Heidelberg, Germany, 2018. [Google Scholar]
  21. Adam, P.; Heunemann, F.; Engelshove, S.; Bussche, C.; von dem Thiemann, T. Wasserstoffinfrastruktur–Tragende Säule der Energiewende: Umstellung von Ferngasnetzen auf Wasserstoffbetrieb in der Praxis. 2020. Available online: https://www.get-h2.de/wp-content/uploads/200915-whitepaper-h2-infrastruktur-DE.pdf (accessed on 15 November 2022).
  22. Bell, I.H.; Wronski, J.; Quoilin, S.; Lemort, V. CoolProp. Available online: www.coolprop.org (accessed on 26 June 2022).
  23. Mischner, J. Zur hydraulischen Berechnung von Niederdruckleitungen für Erdgas-Wasserstoff-Gemische: Teil 1. GWF Gas + Energie. 2021, 3, 58–69. [Google Scholar]
  24. Laureys, A.; Depraetere, R.; Cauwels, M.; Depover, T.; Hertelé, S.; Verbeken, K. Use of existing steel pipeline infrastructure for gaseous hydrogen storage and transport: A review of factors affecting hydrogen induced degradation. J. Nat. Gas Sci. Eng. 2022, 101, 104534. [Google Scholar] [CrossRef]
  25. Andrews, R.M.; Gallon, N.; Huising, O.J.C. Assessing Damaged Pipelines Transporting Hydrogen. J. Pipeline Sci. Eng. 2022, 100066. [Google Scholar] [CrossRef]
  26. Mohtadi-Bonab, M.A. Effect of different parameters on hydrogen affected fatigue failure in pipeline steels. Eng. Fail. Anal. 2022, 137, 106262. [Google Scholar] [CrossRef]
  27. Wu, X.; Zhang, H.; Yang, M.; Jia, W.; Qiu, Y.; Lan, L. From the perspective of new technology of blending hydrogen into natural gas pipelines transmission: Mechanism, experimental study, and suggestions for further work of hydrogen embrittlement in high-strength pipeline steels. Int. J. Hydrog. Energy 2022, 47, 8071–8090. [Google Scholar] [CrossRef]
  28. Sun, Y.; Frank Cheng, Y. Hydrogen-induced degradation of high-strength steel pipeline welds: A critical review. Eng. Fail. Anal. 2022, 133, 105985. [Google Scholar] [CrossRef]
  29. Bouledroua, O.; Hafsi, Z.; Djukic, M.B.; Elaoud, S. The synergistic effects of hydrogen embrittlement and transient gas flow conditions on integrity assessment of a precracked steel pipeline. Int. J. Hydrog. Energy 2020, 45, 18010–18020. [Google Scholar] [CrossRef]
  30. Li, H.; Niu, R.; Li, W.; Lu, H.; Cairney, J.; Chen, Y.-S. Hydrogen in pipeline steels: Recent advances in characterization and embrittlement mitigation. J. Nat. Gas Sci. Eng. 2022, 105, 104709. [Google Scholar] [CrossRef]
  31. Martin, M.L.; Connolly, M.; Buck, Z.N.; Bradley, P.E.; Lauria, D.; Slifka, A.J. Evaluating a natural gas pipeline steel for blended hydrogen service. J. Nat. Gas Sci. Eng. 2022, 101, 104529. [Google Scholar] [CrossRef]
  32. Wang, H.; Tong, Z.; Zhou, G.; Zhang, C.; Zhou, H.; Wang, Y.; Zheng, W. Research and demonstration on hydrogen compatibility of pipelines: A review of current status and challenges. Int. J. Hydrog. Energy 2022, 47, 28585–28604. [Google Scholar] [CrossRef]
  33. Liu, C.; Pei, Y.; Cui, Z.; Li, X.; Yang, H.; Xing, X.; Duan, P.; Li, L.; Li, Y. Study on the stratification of the blended gas in the pipeline with hydrogen into natural gas. Int. J. Hydrog. Energy, in press (corrected proof). 2022. [Google Scholar] [CrossRef]
  34. Eames, I.; Austin, M.; Wojcik, A. Injection of gaseous hydrogen into a natural gas pipeline. Int. J. Hydrog. Energy 2022, 47, 25745–25754. [Google Scholar] [CrossRef]
  35. Ekhtiari, A.; Flynn, D.; Syron, E. Investigation of the Multi-Point Injection of Green Hydrogen from Curtailed Renewable Power into a Gas Network. Energies 2020, 13, 6047. [Google Scholar] [CrossRef]
  36. Pellegrini, M.; Guzzini, A.; Saccani, C. A Preliminary Assessment of the Potential of Low Percentage Green Hydrogen Blending in the Italian Natural Gas Network. Energies 2020, 13, 5570. [Google Scholar] [CrossRef]
  37. Vaccariello, E.; Trinchero, R.; Stievano, I.S.; Leone, P. A Statistical Assessment of Blending Hydrogen into Gas Networks. Energies 2021, 14, 5055. [Google Scholar] [CrossRef]
  38. Melaina, M.W.; Antonia, O.; Penev, M. Blending Hydrogen into Natural Gas Pipeline Networks: A Review of Key Issues; National Renewable Energy Laboratory: Golden, CO, USA, 2013. [CrossRef]
  39. Mischner, J. Zur Frage der Strömungsgeschwindigkeiten in Gasleitungen. GWF Gas + Energie 2021, 2021, 44–63. [Google Scholar]
  40. Bschorer, S. Technische Strömungslehre; Springer: Berlin/Heidelberg, Germany, 2018. [Google Scholar]
  41. Moran, M.J.; Shapiro, H.N.; Boettner, D.D.; Bailey, M.B. Fundamentals of Engineering Thermodynamics, 9th ed.; Wiley: Hoboken, NJ, USA, 2018. [Google Scholar]
  42. Eichelseder, H.; Sturm, P. Thermodynamik; Institute of Internal Combustion Engines and Thermodynamics, TU Graz: Graz, Austria, 2018. [Google Scholar]
  43. Wilke, C.R. A Viscosity Equation for Gas Mixtures. J. Chem. Phys. 1950, 18, 517–519. [Google Scholar] [CrossRef]
  44. Bell, I.H.; Wronski, J.; Quoilin, S.; Lemort, V. Pure and Pseudo-pure Fluid Thermophysical Property Evaluation and the Open-Source Thermophysical Property Library CoolProp. Ind. Eng. Chem. Res. 2014, 53, 2498–2508. [Google Scholar] [CrossRef] [PubMed] [Green Version]
  45. van Rossum, R.; Jens, J.; La Gaudia, G.; Wang, A.; Kühnen, L.; Overgaag, M. European Hydrogen Backbone: A European Hydrogen Infrastructure Vision Covering 28 Countries. Available online: https://gasforclimate2050.eu/?smd_process_download=1&download_id=1038 (accessed on 5 April 2022).
  46. Abbas, A.J.; Hassani, H.; Burby, M.; John, I.J. An Investigation into the Volumetric Flow Rate Requirement of Hydrogen Transportation in Existing Natural Gas Pipelines and Its Safety Implications. Gases 2021, 1, 156–179. [Google Scholar] [CrossRef]
  47. Krieg, D. Konzept und Kosten Eines Pipelinesystems zur Versorgung des Deutschen Straßenverkehrs mit Wasserstoff. RWTH Aachen University, Dissertation, 2012. Forschungszentrum Jülich GmbH: Jülich, 2012. Available online: https://juser.fz-juelich.de/record/136392/files/Energie% (accessed on 20 July 2022).
  48. ANSYS Inc. Ansys Fluent Theory Guide, 2022R1 2022. Available online: https://ansyshelp.ansys.com/account/secured?returnurl=/Views/Secured/prod_page.html?pn=Fluent&pid=Fluent&prodver=22.1&lang=en (accessed on 20 July 2022).
  49. Adam, P.; Barton, M.; Lake, K.; Schulz, M. Hydrogen Compression–An Integral Part of the H2 Value Chain: White Paper. Available online: https://www.siemens-energy.com/global/en/offerings/technical-papers/whitepaper-h2-compression.html (accessed on 25 May 2022).
  50. Österreichische Vereinigung für das Gas- und Wasserfach–ÖVGW. Richtlinie G B210 Gasbeschaffenheit; 2021. Available online: https://portal.ovgw.at/pls/f?p=101:203::::RP,203:P203_ID,P203_FROM_PAGE_ID:1075524,202 (accessed on 20 July 2022).
  51. Bender, B.; Göhlich, D. Dubbel Taschenbuch für den Maschinenbau 3: Maschinen und Systeme; Springer: Berlin, Heidelberg, 2020. [Google Scholar]
  52. Di Bella, F. Development of a Centrifugal Hydrogen Pipeline Compressor: Technical Memorandum No. 1785. Available online: https://www.osti.gov/servlets/purl/1227195 (accessed on 19 May 2022).
  53. United Pipeline System. Tite Liner Thermoplastic Pipeline Lining System. Available online: https://www.aegion.com/capabilities/hdpe-pipe-lining (accessed on 28 June 2022).
  54. Pertl, P. Well-to-Wheel Potentials of H2-Mobility; Wien, 2019. Available online: https://www.a3ps.at/sites/default/files/conferences/2014/papers/15_pertl_well-to-wheel_potentials_of_h2_mobility_a3ps_pertl.pdf;. (accessed on 20 July 2022).
  55. Rodriguez, F.; Delgado, O.; Muncrief, R. The International Council on Clean Transportation. Fuel consumption testing of tractor-trailers in the European Union and the United States 2018. Available online: https://theicct.org/wp-content/uploads/2021/06/EU_HDV_Testing_BriefingPaper_20180515a.pdf (accessed on 15 November 2022).
Figure 1. Iterative calculation of the friction factor λ.
Energies 15 09370 g001
Figure 2. Iterative calculation of the pressure drop in a pipe segment.
Energies 15 09370 g002
Figure 3. Simulation domain of the axis symmetric pipe segment.
Energies 15 09370 g003
Figure 4. (a) Transported energy, (b) lower heating value, (c) flow velocity, and (d) density as a function of H2 volume fraction in NG.
Energies 15 09370 g004
Figure 5. (a) Pressure drop in pipeline as a function of distance for the transport of the equal amount of energy (Scenario 1) and (b) pressure drop after 100 km for Scenarios 1 and 2.
Energies 15 09370 g005
Figure 6. Compressor power of the thermodynamic equivalent processes of piston and radial compressor.
Energies 15 09370 g006
Figure 7. Energy buffer in H2-Pipeline as function of H2 volume fraction at different pressures.
Energies 15 09370 g007
Figure 8. Transport efficiency of pipelines as function of H2 fraction and distance.
Energies 15 09370 g008
Figure 9. Influence of wall roughness on transport efficiency.
Energies 15 09370 g009
Figure 10. Influence of operating pressure on transport efficiency.
Energies 15 09370 g010
Figure 11. Influence of pipe diameter on transport efficiency.
Energies 15 09370 g011
Figure 12. Number of required recompressions.
Energies 15 09370 g012
Figure 13. Transport efficiencies of different H2 distribution technologies.
Energies 15 09370 g013
Table 1. Comparison of H2 and CH4 characteristics [21,22,23].
CharacteristicH2CH4
Molar mass [kg/kmol]2.01616.04
Gravimetric energy density [MJ/kg]/[kWh/kg] 119.93/33.31455.598/15.444
Upper volumetric heating value [MJ/Nm3]/[kWh/Nm3]12.744/3.54039.830/11.064
Lower volumetric heating value [MJ/Nm3]/[kWh/Nm3]10.782/2.99535.896/9.971
Density [kg/Nm³]0.08980.7175
Specific gravity [-]0.06960.5537
Density at 70 bar, 10 °C [kg/m3]5.745955.353
Upper Wobbe index [MJ/Nm348.3453.45
Lower Wobbe index [MJ/Nm3]40.9048.17
Specific heat capacity [kJ/(kg·K)]14.1982.1810
Kinematic viscosity [cm2/s]0.93420.1429
Table 2. Technical specifications and assumptions.
Specifications and Assumptions
Line typeGas transport line
Natural gas composition100% CH4
Transported energy amount14,856,000 kWh/h
Inner diameterDN 1000
Maximum operating pressureMOP 70
MaterialL450MB
Line length100 km
Average gas temperature283 K
Initial pressure70 bar
Average gas flow velocity at 100% NG8 m/s
Average wall roughness k0.1 mm
Table 3. Model settings.
Model Settings
Energy equationon
Turbulence modelRealizable- k-ε
Wall modelEnhanced wall treatment
Real gas modelRedlich-Kwong
Species transportCH4 and H2
Table 4. Boundary conditions.
Case 1Case 2Case 3
Gas composition100% CH450% CH4 50% H2100% H2
Temperature [K]283
Inlet pressure [bar]70
Outlet massflow [kg/s]297.12256.88123.80
Wall flux [W/m2]0
Wall roughness [mm]0.1
Table 5. Comparison of pressure drop according to 2D CFD in ANSYS Fluent and the MATLAB model.
Δp Fluent [Pa]Δp Matlab [Pa]Relative Error [%]
Case 1: 100% CH4784978000.6243
Case 2: 50% CH4 50% H211008105004.6148
Case 3: 100% H213194131000.7124
Publisher’s Note: MDPI stays neutral with regard to jurisdictional claims in published maps and institutional affiliations.

