Article

Numerical Simulation of Thermo-Hydro-Mechanical Processes at Soultz-sous-Forêts

1
Group of Geothermal Technologies, Technical University Munich, 80333 Munich, Germany
2
Group of Geothermal Science and Technology, Institute of Applied Geosciences, Technische Universität Darmstadt, Schnittspahnstrasse 9, 64287 Darmstadt, Germany
3
Department of Chemical Engineering, Sharif University of Technology, Tehran 11365-11155, Iran
4
Department of Applied Geophysics, Indian Institute of Technology (Indian School of Mines), Dhanbad 826004, India
5
GeoThermal Engineering GmbH, 76227 Karlsruhe, Germany
6
Geoenergy Section, GFZ, 14473 Potsdam, Germany
*
Authors to whom correspondence should be addressed.
Energies 2022, 15(24), 9285; https://doi.org/10.3390/en15249285
Submission received: 7 November 2022 / Revised: 30 November 2022 / Accepted: 5 December 2022 / Published: 7 December 2022
(This article belongs to the Topic Geothermal Energy Technology and Current Status)

Abstract

:
Porosity and permeability alteration due to the thermo-poro-elastic stress field disturbance from the cold fluid injection is a deciding factor for longer, more economic, and safer heat extraction from an enhanced geothermal system (EGS). In the Soultz-sous-Forêts geothermal system, faulted zones are the main flow paths, and the resulting porosity–permeability development over time due to stress reorientation is more sensitive in comparison with the regions without faulted zones. Available operational and field data are combined through a validated numerical simulation model to examine the mechanical impact on the pressure and temperature evolution. Results shows that near the injection wellbore zones, permeability and porosity values are strongly affected by stress field changes, and that permeability changes will affect the overall temperature and pressure of the system, demonstrating a fully coupled phenomenon. In some regions inside the faulted zones and close to injection wellbores, porosity doubles, whereas permeability may be enhanced up to 30 times. A sensitivity analysis is performed using two parameters which are not well discussed in the literature the for mechanical aspect, but the results in this study show that one of them impacts significantly on the porosity–permeability changes. Further experimental and field works on this parameter will help to model the heat extraction more precisely than before.

1. Introduction

Fractured geothermal systems, also known as enhanced geothermal systems (EGSs), are a subset of geothermal systems where the rocks (mostly granites) have very low permeability and little or no water content. Naturally occurring fractures or fracture clusters (or even faults) might be present based upon the site’s stress field and tectonic history. It is preferable to drill wells close to or intersecting these structures to utilize them without the need to spend time and resources to create an artificial fracture network. However, natural fractures generally do not have the desired permeabilities for the fluid flow. In such cases, we stimulate the fractures through hydraulic, chemical, or thermal stimulation. A series of hydraulic stimulations were performed at Soultz-sous-Forêts from 1993 to 1996 at a depth of 2800–3500 m. This led to the creation of a large fracture network across an area of more than 3 km2 [1]. Many circulation tests were also performed at this site before the start of its commercial production in 2016. The amount of data from this site is far beyond any other HDR geothermal site in the world. We used the site data to build a comprehensive thermo-hydro-mechanical (THM) model of the granite reservoir to examine the mechanical parameters’ impact on the pressure and temperature development during the cold fluid injection.
The Hot Dry Rock (HDR) project at Soultz-sous-Forêts, France, started in 1984, and drilling started in 1987 [
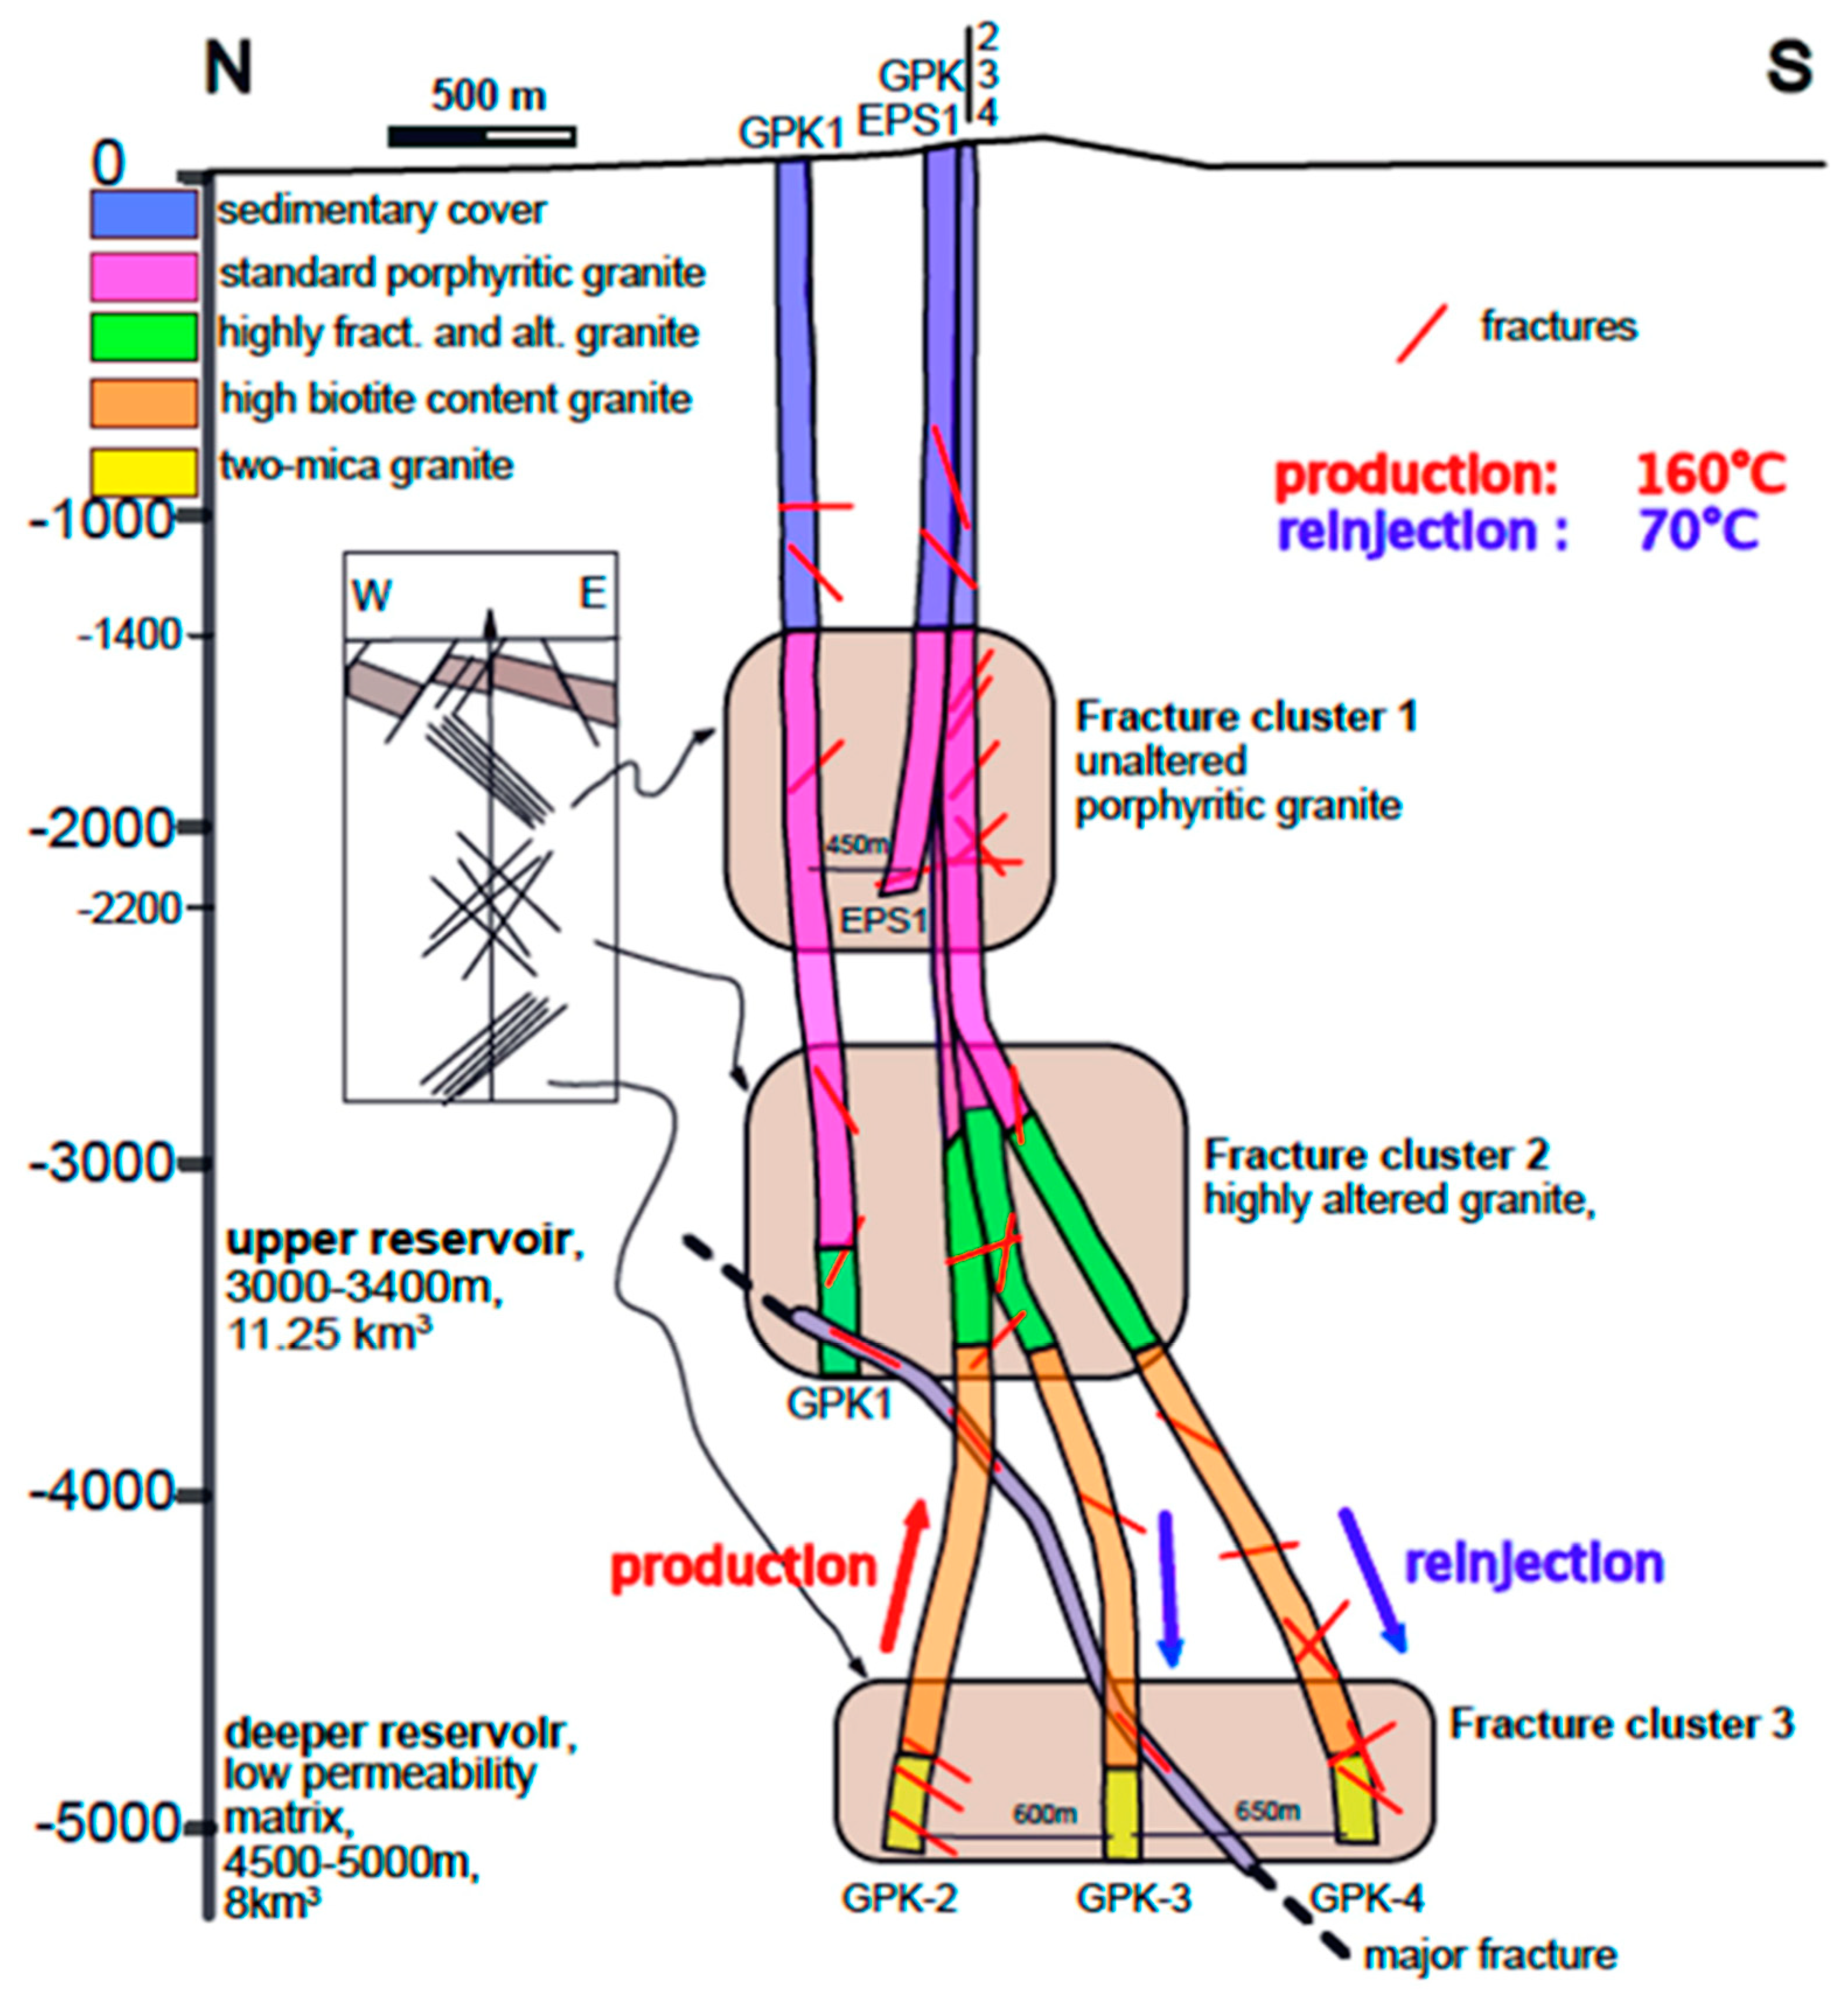
2]. It is one of the first projects of its kind in mainland Europe. The term ‘Enhanced Geothermal System (EGS)’ has been coined at this site. Geothermal work has been going on at this site for the past 30 years which was subject to extensive geoscientific studies. The main objective of this project was to generate electricity by tapping the crystalline (granitic) section of the reservoir. Several wells were drilled over this period, and commercial production started in 2016. For the commercial production, a three-well system with two injector wells (GPK-3 and GPK-4) and one producer well (GPK-2) are in operation (see Figure 1). The brine is recovered from the reservoir at a temperature of 160 °C and is passed through an organic Rankine cycle (ORC), where the heat from the brine is used to heat isobutane which then powers the turbine [3]. After this, the cooled brine is re-injected back into the reservoir through an injector at 70 °C. Figure 1 is a schematic diagram of the wells and the parts of the reservoir the wells go through. During the MEET project (multidisciplinary and multi-context demonstration of enhanced geothermal systems exploration and exploitation techniques and potentials), the possibility of the using colder fluid injection (40 °C) is examined to increase heat extraction amount from this site.
Soultz-sous-Forêts is situated in the Upper Rhine Graben (URG), which is a continental rift structure and extends up to a length of 300 kms, making it the central section of the European Cenozoic Rift system. The stratigraphy of this site begins with Mesozoic and Cenozoic sediments on the top reaching to depths of 1.4 km, followed by the crystalline basement divided by naturally fractured granite. The sedimentary section of the site can broadly be divided into two distinct kinds, namely the fluvial deposits of 350 m in thickness, known as Buntsandstein, and the alluvial deposits (Permian) from the Variscan orogeny [4]. The thermal initialization of the Soultz-sous-Forêts geothermal site is well studied in the literature [5]. It has been found that the sedimentary section has a geothermal gradient of >100 °C/km, whereas the granitic section has a gradient of 10–12 °C/km. This might be due to the drastic drop in the heat production values of granite with depth 6 μ W / m 3 at a depth of 1400 m to 2.7 μ W / m 3 at a depth of 3700 m [6].
At the Soultz-sous-Forêts site, 52 structures that includes 39 fracture zones, 7 microseismic structures, and 6 vertical seismic profiles (VSPs) are reported by [7]. Furthermore, Dezayes et al. [8] observed that 39 fracture zones have a general strike of N160° E at this geothermal site. However, in this study, only five zones of fractures are considered which have their intersection with at least one of the wellbores, and their properties are laid out in Table 1 [9,10]. It is to be noted that the fracture zones are numbered based on their depths of intersection with one of the wellbores.
Various studies have been performed on numerical modelling of this site as well. Vallier et al. [12] performed a thermo-hydro-mechanical (THM) study which showed convection loops of temperature distribution in the reservoir of almost 1.3 kms in size. They compared these results for different permeabilities, and the circulation loops appear only at a permeability of 10−14 m2. For permeabilities less than the order of −14, the loops start to diminish and are completely gone when we reach the order of −17 in the layers which accommodate circulation of fluids. Our previous thermo-hydro (TH) model was validated using the data of 1163 days of operation. We modelled cases with four different re-injection temperatures for a duration of 100 years, and we observed that the thermal breakdown at the production well was less than 20 °C even after 100 years of operation [10]. This showed that the production can continue for a long time without worrying about the thermal breakdown.
Considering the available literature on the THM behavior of the heat extraction from the geothermal reservoirs, it is clear that most of the researchers used the Barton–Bandis model [13] to update the stress field based on the aperture variations. During these studies, variation in the porosity of the fracture and the porosity–permeability variation in the matrix zone is not considered. In most cases, due to the difficulties of considering all the fractures, equivalent porous media is assumed instead of the fractured medium. To account for all of the possible variations, the porosity and permeability variations should be considered not only for the large-scale fracture but also for the equivalent porous medium. To accomplish this, Rutqvist et al. [14] formulated an equation for stress–porosity dependency. This dependency may be used in the equations between the porosity and permeability. Davis and Davis [15] provided the relationships between the porosity and permeability for different rock types which may be used to update the permeability values based on the porosity obtained from the equations developed by Rutqvist et al. [14]. In similar studies, researchers tried to use THM simulations to include the fracture aperture (or permeability) variation on the heat extraction performance of the geothermal reservoirs. Zhao et al. [16] simulated the heat extraction from an idealized fractured hot dry rock and observed that the fracture aperture tripled for 150 °C decreases in the temperature [16]. Furthermore, Wang et al. [17] developed a semi-analytical correlation for the THM behavior and showed that fracture permeability may increase up to seven times its initial value. They also concluded that the fracture permeability is more sensitive to the cold fluid injection compared with the rock matrix. Later, Pandey and Vishal examined the sensitivity of the affecting parameters on the performance of a single-fractured geothermal system. Their study revealed that fracture aperture is controlled by the poroelasticity at the initial time and, at the later times, the thermoelasticity is the main controlling factor. In this study, the fracture aperture was enhanced to almost twice its initial value [18]. In another study, Pandey et al. [19] examined the fracture aperture alteration for different joint stiffness, thermal expansion coefficients, and rock matrix permeability in a single-fracture system. Here, they reported fracture aperture enhancement of up to three times after 30 years of operation [19]. Yao et al. [20] used the local thermal non-equilibrium theory through the THM approach to examine the behavior of an ideal 3D-EGS system. After 80 years of the cold fluid injection, they observed an up to four times increase in the fracture permeability near the injection wellbore. Salimzadeh et al. [21] reported the fracture aperture changes in a single fractured system. For the cases with higher initial temperature and stress, they observed a higher change in the fracture aperture. For the highest initial temperature and stress ( T i = 250 ° C and σ i = 75 MPa) the fracture aperture increases up to eight times, while for the case with ( T i = 80 ° C and σ i = 60 MPa), the fracture aperture does not even double. In another study, for the multiple-fracture system, Vik et al. [22] showed that the stress field resulting from a fracture affects the aperture of the other fracture. In these conditions, the fracture aperture changes will be different than the single fracture model. Yuan et al. [23] examined the THM behavior of enhanced geothermal system in the Raft River geothermal field using numerical simulations. Their simulation resulted in a permeability enhancement of up to five times in different directions due to the cold fluid injection. Cui et al. [24] examined a penny-shaped fracture in EGS for 30 years of operation. Due to the thermo-poro-elastic effects, the fracture aperture increases up to six times its initial value. Aliyu and Archer [25] considered a multi-lateral fracture to examine the heat extraction from hot dry rock geothermal systems. Their simulation results show an up to 10 times increase in the fracture permeability for the different spacing in the multi-lateral fracture system after 30 years of operation. In a recent study, Kang et al. [26] reported that, of the fracture aperture changes due to the thermoelasticity, around 22% result from poroelasticity after one year of the numerical simulation. However, the contribution of the thermal stress on the fracture aperture increases with time and, after 30 years, its impact increases to 161% in comparison to the hydraulic effects.
To examine the possible impact of the mechanical changes on the THM processes of the Soultz-sous-Forêts, based on the geological geometry, well trajectory, and the fracture zones, numerical models are developed in this study. Although the geological settings and thermo-hydraulically related parameters of the Soultz-sous-Forêts are well characterized, there is ongoing ambiguity regarding the mechanical parameters and their impacts. To shed light on the mechanical impact of pressure and temperature evolution, the overall process is considered by assuming a high range of the changes on the mechanical parameters which couples the porosity, permeability, and stress field. In the present study, we examine the proposed relationships for the porosity–permeability and the stress from the literature, and observe that it is possible to simplify them to insert the mechanical impact with two parameters measured experimentally. In spite of most previous studies, porosity and permeability changes are not only examined for the fractured zones, but their impact on the matrix zone is also considered during this study. This manuscript is organized in the following manner: first we discuss the operational condition and numerical simulation models in the methodology section, followed by results and discussion with consideration of the sensitivity analysis on the mechanical parameters.

2. Methodology and Problem Formulation

A cubic space of 8 km along each side is considered around the GPK-2, GPK-3, and GPK-4, as shown in Figure 2. Previously, we assumed a homogeneous and isotropic permeability field for the matrix zone, and our TH simulations resulted in a good match with the operational data for the short period. In the long period, pressure and temperature fronts are well-developed, which may result in the thermo-poroelasticity changes at the reservoir which are the main concern of this study. The injection flow rates for GPK-3 and GPK-4 are 19.6 kg/s and 9.7 kg/s, respectively, and the production flow rate of the GPK-2 is set as 29.3 kg/s based on the recent operational data for this site [10]. As discussed previously, the five fracture zones are considered as a large fracture with an equivalent hydraulic conductivity, which is obtained through the operational data ([11] Table 1). The remaining fracture zones are not considered during the numerical simulation. Previously, we showed that this simplification does not affect the overall TH behavior of the system through the matching of the numerical simulation results with the operational data. The fracture zones inside the geometry are considered as internal boundaries. The diameter of the wellbores is small, and for the simplification and making the meshing feasible, they are represented by a line. The trajectory of the wellbores is taken from the field measurements [11].
We assume that mechanical changes are elastic; therefore, we couple thermo-poroelasticity response of the rock to the pressure and temperature changes to update the porosity and permeability values. For the fluid flow, the top and boundaries are considered as no flow boundary condition and the side boundaries are open for fluid flow. The top boundary is insulated for the heat transfer, whereas a constant heat flux of 0.07 W/m2 is assigned at the bottom boundary [27]. Based on the open boundary for the fluid flow, it is assumed that side boundaries are open for the heat transfer. For the geomechanical aspect, the bottom boundary is assigned with a fixed constraint boundary condition and the top boundary is assigned for free displacement. Roller boundary conditions are assigned on the sides of the numerical model geometry. The initial temperature of the system is assigned based on the geothermal gradient in the region [28]. Hydrostatic pressure is used for the initial pore pressure of the system. Based on operator’s experience, in addition to the initial open-hole section, it is assumed that GPK-3 is injecting in the interval 1282–4852 m (depth reference ground level) and GPK-2 is producing from 1264–4244 m [9]. A homogeneous flow is assigned alongside these intervals. Here, we examined the reservoir response toward the cold fluid injection and hot water production, and we did not investigate the heat loss resulting from the fluid movement through the wellbore. For more details on the wellbore effect, readers are suggested to consider [10]. The possible geochemical reaction and their impact on the porosity and permeability changes is not considered in this study. The governing equations describing the behavior of the system are explained below.

2.1. Mass Conservation

The following governing equations are used for mass transfer, heat transfer, and the stress field calculations. All of the equations are adopted from the COMSOL Multiphysics [29].
The conservation of mass transport by considering the pore-pressure, temperature, and volume changes are shown by the following equation:
ρ l ϕ m S l + 1 ϕ m S m p t ρ l α m ϕ m β l + 1 ϕ m β m T t + ρ l α m ε V t = · ρ l k m μ p
where ρ l , ϕ m ,     S l ,   S m , p , α m , β l ,   β m , T , ε V , k m , and μ are the fluid density, reservoir porosity, storage coefficient of the matrix, storage coefficient of fluid, pressure, Biot’s coefficient of the matrix, thermal expansion coefficient of the rock, thermal expansion coefficient of the fluid, temperature, pore volumetric strain in reservoir, matrix permeability and the fluid viscosity, respectively. Here, ϕ m S l + 1 ϕ m S m and α m ϕ m β l + 1 ϕ m β m represents the storage coefficient of saturated porous media and equivalent thermal expansion coefficient of porous media.
For the fractures, the flow along the width is ignored due to the higher differences between the fracture length and fracture width. Based on this assumption, we have the following equation:
ρ l ϕ f S l + 1 ϕ f S f b h p t ρ l α f ϕ f β l + 1 ϕ f β f b h T t + ρ l α f b h ε V t = T · b h ρ l k f μ T p + n · ρ k m μ p              
where ϕ f ,     S f , α f , β f , k f , and b h are the fracture porosity, storage coefficient of the fracture, Biot’s coefficient of fracture, thermal expansion coefficient of the fracture zone, fracture permeability, and the hydraulic aperture, respectively. Here, ϕ f S l + 1 ϕ f S f and α f ϕ f β l + 1 ϕ f β f represents the storage coefficient of the saturated fracture zone and equivalent thermal expansion coefficient of the fracture zone. Here, n · ρ k m μ p is the mass flux exchange between saturated reservoir and the fracture zone.

2.2. Energy Balance

With the line assumption for the wellbore geometry, effects of the wellbore on the simulation can be shown with a source and sink term. The latent heat of water is used to measure this term based on the temperature difference between the injection water and the local temperature of the rock. To simulate the heat transfer between the rock matrix and the fluid, the local thermal non-equilibrium model is used. Combining the heat conduction and heat exchange between the fluids for the rock matrix results in the governing equation. Equation (3) is as follows:
1 ϕ m ρ m C p , m T m t = · 1 ϕ m λ m T m + q m l T l T m
where C p , m , T m , λ m , q m l , and T l are the specific heat capacity of the rock matrix, rock temperature, heat conductivity of the rock matrix, rock matrix–pore fluid interface heat transfer coefficient, and pore fluid temperature, respectively.
To make a connection between the rock and the fracture for the heat transfer, it is assumed that total thermal energy leaving the rock matrix through the rock interface is received by the adjunct fracture using the following equation:
1 ϕ f b h ρ f C p , f T m t = T · 1 ϕ f b h λ f T T m + b h q f l T l T m + n · 1 ϕ m λ m T m
where C p , f , λ f , and q f l are the specific heat capacity of the fracture, heat conductivity of the fracture, and the rock fracture–fluid interface heat transfer coefficient, respectively. Here n · 1 ϕ m λ m T m represents the heat flux exchange across the matrix and fracture.
The heat convection term in the energy balance equation is calculated as follows:
ϕ m ρ l C p , l T l t + ϕ m ρ l C p , l k m p μ · T l                                     = · ϕ m λ l T l + q m l T m T l
The coupled heat exchange between the fluid and fracture is as follows:
ϕ f b h ρ l C p , l T l t + ϕ f b h ρ l C p , l k f p μ · T T l                                                                          = T · ϕ f b h λ l T T l + b h q f l T m T l + n · ϕ l λ l T l

2.3. Stress

As it is mentioned, we assumed that the deformation is elastic. Therefore, the stress–strain relationship is obtained by combining the following thermo-poroelastic equations:
σ i j = 2 G ε i j + λ t r ε δ i j α p p δ i j 2 G 1 + ν 3 1 2 ν ϕ l β l + 1 ϕ m β m T δ i j
where σ i j ,   G ,   λ , t r ,   ε ,   δ i j ,   α p , and ν are the total stress, Lame’s 1st and 2nd constants, the trace operator, strain, Kronecker delta function, Biot’s coefficient of the porous media, and the Poisson ratio, respectively. In this manuscript, a positive value of stress is considered in the tension mode.
The deformation equation of porous media is obtained by combining the following equilibrium equations:
G u i , j j + G + λ u j , j i α p p , i 2 G 1 + ν 3 1 2 ν β T T , i + f i = 0
where u j , j i and f i are displacement and the external body force, respectively.
During the heat extraction from the geothermal reservoirs, the rock will experience intense changes in the pressure and temperature. Pressure increases inside the fracture and temperature reduction will ultimately decrease the compressive normal stress on the fracture surfaces, and the fracture aperture will increase. In a similar manner, the porosity and permeability of the matrix zone will be enhanced between the wells.
The adopted version of the equations for porosity changes with respect to the pressure and temperature variation is used to update the porosity values during the simulations [14]. In this system, fractures are the main flow pathways, and their porosity is a strong function of the stress changes. Equation (9) is as follows:
φ φ 0 = a + e x p c σ a + e x p c σ 0
where φ ,   φ 0 , a ,   c ,   σ ,   and σ 0 are the porosity of the porous medium, initial porosity of the porous medium, the ratio of residual porosity to the initial porosity, constant for the porosity-stress function, stress value, and initial stress, respectively. This system is a fractured model and the ratio of the residual to the initial porosity is a small number compared to a nonfractured reservoir. Here, we performed a sensitivity analysis and considered three values of a = 0.3 ,   0.5 , and 0.7 to examine the overall process. Rutqvist et al. [14] used a value close to 1.5 for c . Here, to examine the impact of this parameter, three values, namely 1, 1.5, and 2, are considered for the different porosity-stress dependency. Davis and Davis [15] proposed the relationship to correlate the porosity and permeability changes. In this study, rocks of mean pore diameter 60 µm are considered for which values of γ vary between 2.68 and 3.15. Here, in this study, we assumed the value of γ = 3.
k = k 0 e γ φ φ 0 1
Initial stress field are assigned based on the data reported by Valley and Evans [30].
  σ h = 1.78   MPa 14.06 z   MPa / km  
  σ H = 1.17   MPa + 22.95 z   MPa / km  
  σ v = 1.30   MPa 25.50 z   MPa / km
We summarize the initial and boundary conditions in Table 2.

2.4. Fluid Properties

The thermophysical properties of water, such as dynamic viscosity, specific heat capacity, density, and thermal conductivity, are updated based on the calculated temperature distribution during the simulation using the following equations [29].
Dynamic viscosity is calculated as follows:
μ = 1.38 2.12 × 10 2 × T 273.15 1 + 1.36 × 10 4 × T 273.15 2                                     − 4.65 × 10 7 × T 273.15 3 + 8.90 × 10 10 × T 273.15 4                                                              − 9.08 × 10 13 × T 273.15 5 + 3.85 × 10 16 × T 273.15 6   0 140   ° C
μ = 4.01   × 10 3 2.11   × 10 5   × T 273.15 1 + 3.86   × 10 8   × T 273.15 2     − 2.40   × 10 11   × T 273.15 3   140 280   ° C                    
Specific heat capacity is calculated as follows:
C p = 1.20 × 10 4 8.04 × 10 1 × T 273.15 1 + 3.10 × 10 1 × T 273.15 2                     − 5.38 × 10 4 × T 273.15 3 + 3.63 × 10 7 × T 273.15 4
Density is calculated as follows:
ρ = 1.03 × 10 5 × T 273.15 3 1.34 × 10 2 × T 273.15 2 + 4.97 × T 273.15 + 4.32 × 10 2                                                                                                                        
Thermal conductivity is calculated as follows:
κ = 8.69 × 10 1 + 8.95 × 10 3 × T 273.15 1 1.58 × 10 5 × T 273.15 2 + 7.98 × 10 9 × T 273.15 3                                                          
To solve these equations in a fully coupled manner, COMSOL Multiphysics version 5.5 is used [29] through the finite element method. In the fully coupled manner, all data exchange happens internally. Therefore, the computing process is more efficient [31,32,33]. The provided methodology is previously validated with the operational data and gives a good match in comparison to the benchmark problems from the literature [34,35]. Details of the numerical simulations are available in [36]. Free tetrahedral meshes are used to simulate the THM process. To capture the behavior inside the fracture zone, smaller meshes are used. The total number of domain elements, boundary elements, and edge elements is 61,069, 4455, and 517, respectively. Furthermore, the maximum and minimum element size for the matrix zone are 573 m and 71.6 m, respectively, whereas for the fracture zone these values are 251 m and 10.7 m, respectively. The pressure involved terms are discretized by quadratic methods, temperature involved terms are discretized with linear methods, and displacement-related terms are discretized using the quadratic serendipity method.

3. Results and Discussions

Based on Equation (9), parameters a and c need to be defined for the numerical simulation. Here, a shows the ratio of the remaining porosity to the initial porosity in the known stress field. Due to the involved fractures, the porosity of the fractures will be highly sensitive to the stress changes. Therefore, we assumed that at the high stress condition of the reservoir, the porosity of the fracture will decrease intensely in comparison to the initial value. To perform a sensitivity analysis on this parameter, we considered three values of a . Here c is another parameter which controls the porosity dependency on the stress values. Previously, researchers used a value close to 1.5 to include this parameter during the calculation [14]. Considering this, here, a sensitivity analysis is performed by assuming two additional values, as follows: one higher and one lower than the base case. Therefore, to consider the sensitivity in both these parameters, nine different scenarios are designed, and we investigate the impact of the porosity, stress, and permeability relationship on the thermo-hydro-mechanical processes occurring inside the reservoir in Soultz-sous-Forêts (see Table 3).
In each time step, based on the calculated stress field, the porosity field will be updated using Equation (9), and this porosity field will be the basis to calculate the new permeability field for the next step of the simulation. Case 5 from Table 3 is selected as the base case.
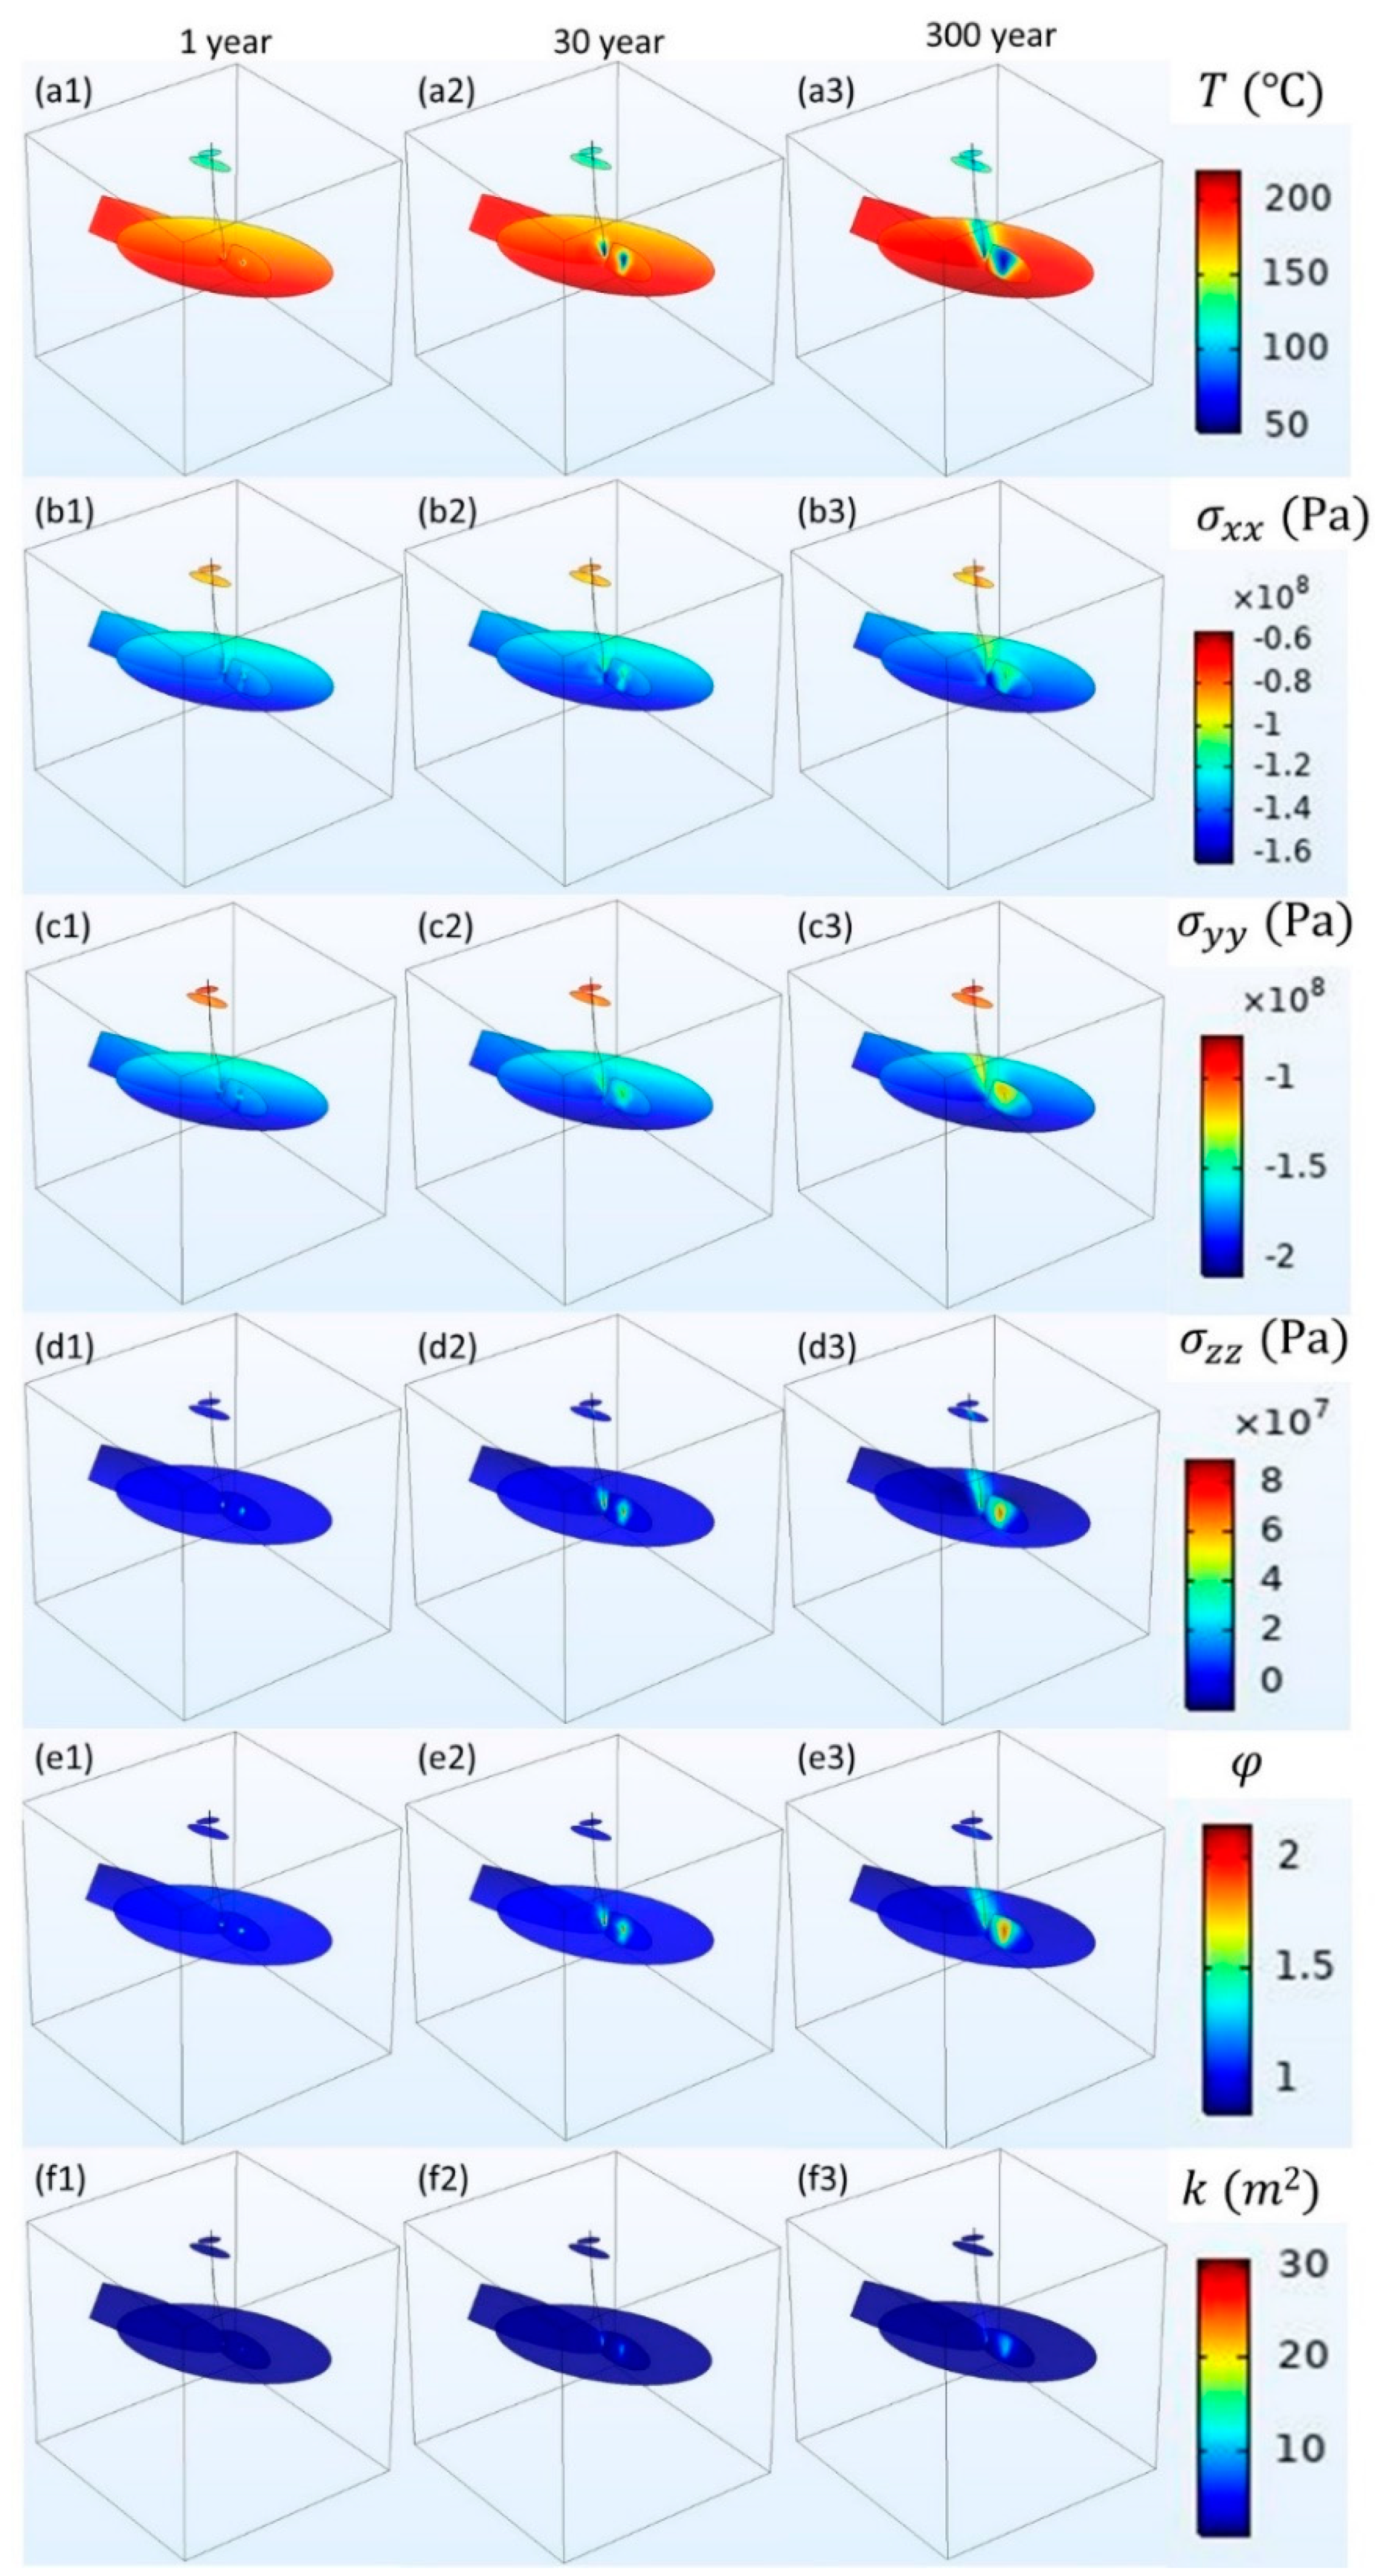
Figure 3 shows the temperature, effective stress, porosity, and permeability variations of the faulted zone for 1, 30, and 300 years after the operation for the base case. Figure 3(a1,a2,a3) shows that thermal breakthrough at the bottom hole section is not observed for the entire operation at the given injection and production rates. With the development of cold front around the injection wellbores, thermoelasticity coupled with the poroelasticity decreases the compressive stress, as in Figure 3(b1,b2,b3,c1,c2,c3,d1,d2,d3). Injection flow rate at the surface for the GPK-3 is higher than for GPK-4, but most of the fluid does not reach the open hole section due to the high leakage rate. Based on this, we are observing an intense change in temperature and the stress field in the vicinity of GPK-4 rather than GPK-3. Here, the results are presented on the surface of the faulted zone which has higher permeability in comparison to the matrix zone. Due to this, the temperature and stress variation for the matrix zone, which is not shown here, is much smaller. Previously, it has been shown that the poroelasticity effects are concentrated around the wellbores, while thermoelasticity can impact on a wider region [18,19,36,37]. Comparing the temperature field with the stress components confirms this behavior and the total stress in the wide region of the reservoir is mainly controlled by the thermoelasticity. Due to the considered free surface boundary condition at the top surface, stress in the vertical direction can release excessive stress in comparison to the roller boundary condition, which is considered at the side boundaries. Based on this, horizontal stresses are more in the compressive mode. Furthermore, initial stress in the y-direction is more in the compressive mode in comparison to the x-direction. This results in higher compressive stress in the y-direction during the operating period. By injecting cold fluid, the stress field increases in tensile mode in all directions which causes an increase in porosity in the effective areas based on Equation (9). Figure 3(e1,e2,e3) shows that porosity increment with respect to the initial value which represents that it may double in the region close to the injection wellbore. It should be noted that porosity variation inside the faulted zone is mainly controlled by the fracture aperture variation, which has the possibility to be doubled [16,17,18,19,20,21,22,23,24,25,26]. Figure 3(f1,f2,f3) shows the permeability development based on the Equation (10). Results represent that a small variation in the porosity may impact the permeability values intensely, while in Figure 3(f3), permeability around GPK-4 may increase up to 30 times the initial value. It is to be noted that in previous studies, Cui et al. [24] and Salimzadeh et al. [21] observed the fracture aperture increase up to 6 and 8 times, respectively, which is equivalent to 36 and 64 times increase in the fracture permeability, respectively. Based on this, this localized permeability increase is a well-known phenomenon. However, these high permeability changes are mainly restricted in the vicinity the wellbore regions only. It is to be noted that in the reservoir scale calculation, we ignored the fracture initiation and propagation caused by the stress field variations.
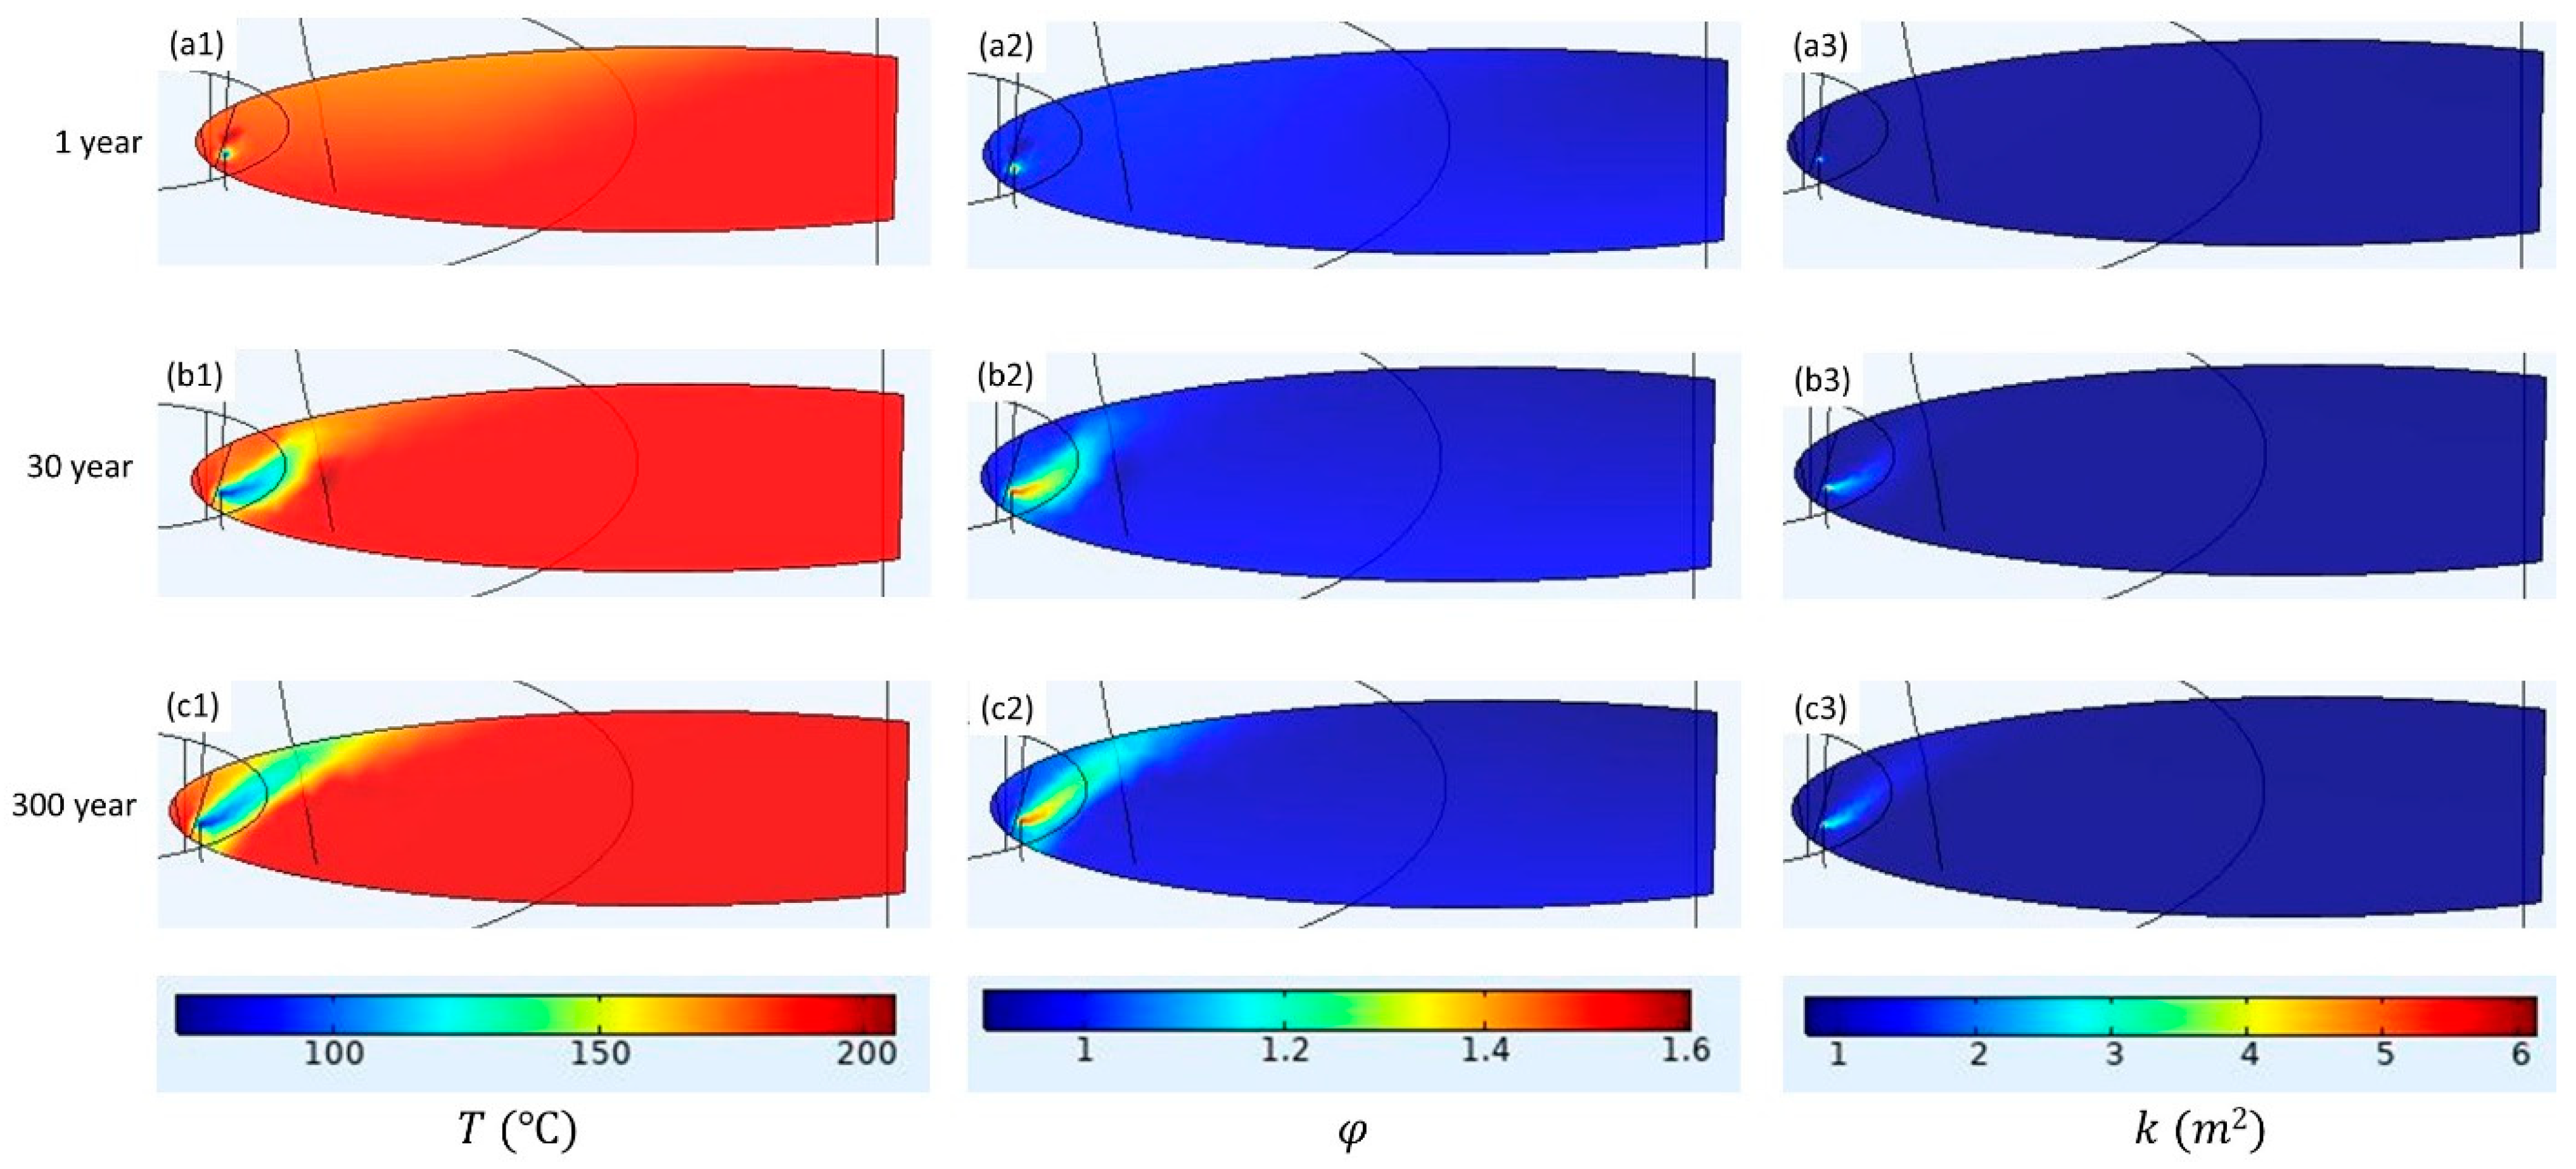
For better understanding of the THM process governing the fracture aperture changes and heat extraction, the faulted zone of FZ4760 is selected as an example, and temperature, porosity, and permeability changes for this faulted zone are shown in Figure 4. In the initial time (one year), Figure 4(a1) shows that temperature front is restricted around the GPK-3. Due to the lower compressive stress in the upper section of the faulted zone, porosity and permeability of this area is higher in comparison to the lower section using Equations (9) and (10). For the later times (30 years and 300 years), in Figure 4(b1,c1), the temperature sways toward the top region instead of an elliptical temperature distribution between the injection and production wells. Due to the high impact of the thermal stress on the porosity changes, the porosity pattern follows up a similar pattern to the temperature distributions, as seen in Figure 4(a2,b2,c2). During the cold fluid injection, pressure increases and, synchronously, temperature reduction favors the reduction in the compressive stress except in the area closer to the production well. Therefore, in most of the reservoir, the final to initial porosity value ratio is larger than one. The maximum porosity increment occurs for the region closer to the injection well, and its magnitude is approximately 1.6. The permeability field resulting from the porosity changes is shown in Figure 4(a3,b3,c3). The coldest region connecting these two injections–production wellbores shows an approximately 6 times increase in permeability, whereas the previous studies including Yao et al. [20], Yuan et al. [23], Wang et al. [17], and Aliyu et al. [25] observed fracture permeability increase up to 4, 5, 7, and 10 times, respectively. These permeability changes depend on the boundary condition and are also dependent on fluid and rock properties. The region surrounding the coldest zone has an increase in permeability ratio of up to 3 times, and the outermost region shows an increase in permeability ratio by 1.5 times in the doublet region. Beyond the doublet, the porosity and permeability are affected less. Based on these finding, considering a simple horizontal fracture or multiple horizontal fractures in the doublet region provides misleading results in comparison to real cases where the fracture dip is not zero. Furthermore, consideration of a mechanical behavior results in a nonsymmetric temperature front between the doublets. Considering the case with fracture initiation and propagation, porosity and permeability ratio increases will be higher due to new fractures. Figure 4(c1,c2,c3) shows that the temperature penetration rate is extremely low, whereas, after 300 years, just a small area of the reservoir is impacted with the stress field changes. In comparison to the hydraulic fracturing or acidizing process, which are mainly controlled by the pressure pulses and the fluid penetration, the thermally induced permeability changes studied in this work are much smaller and slower.
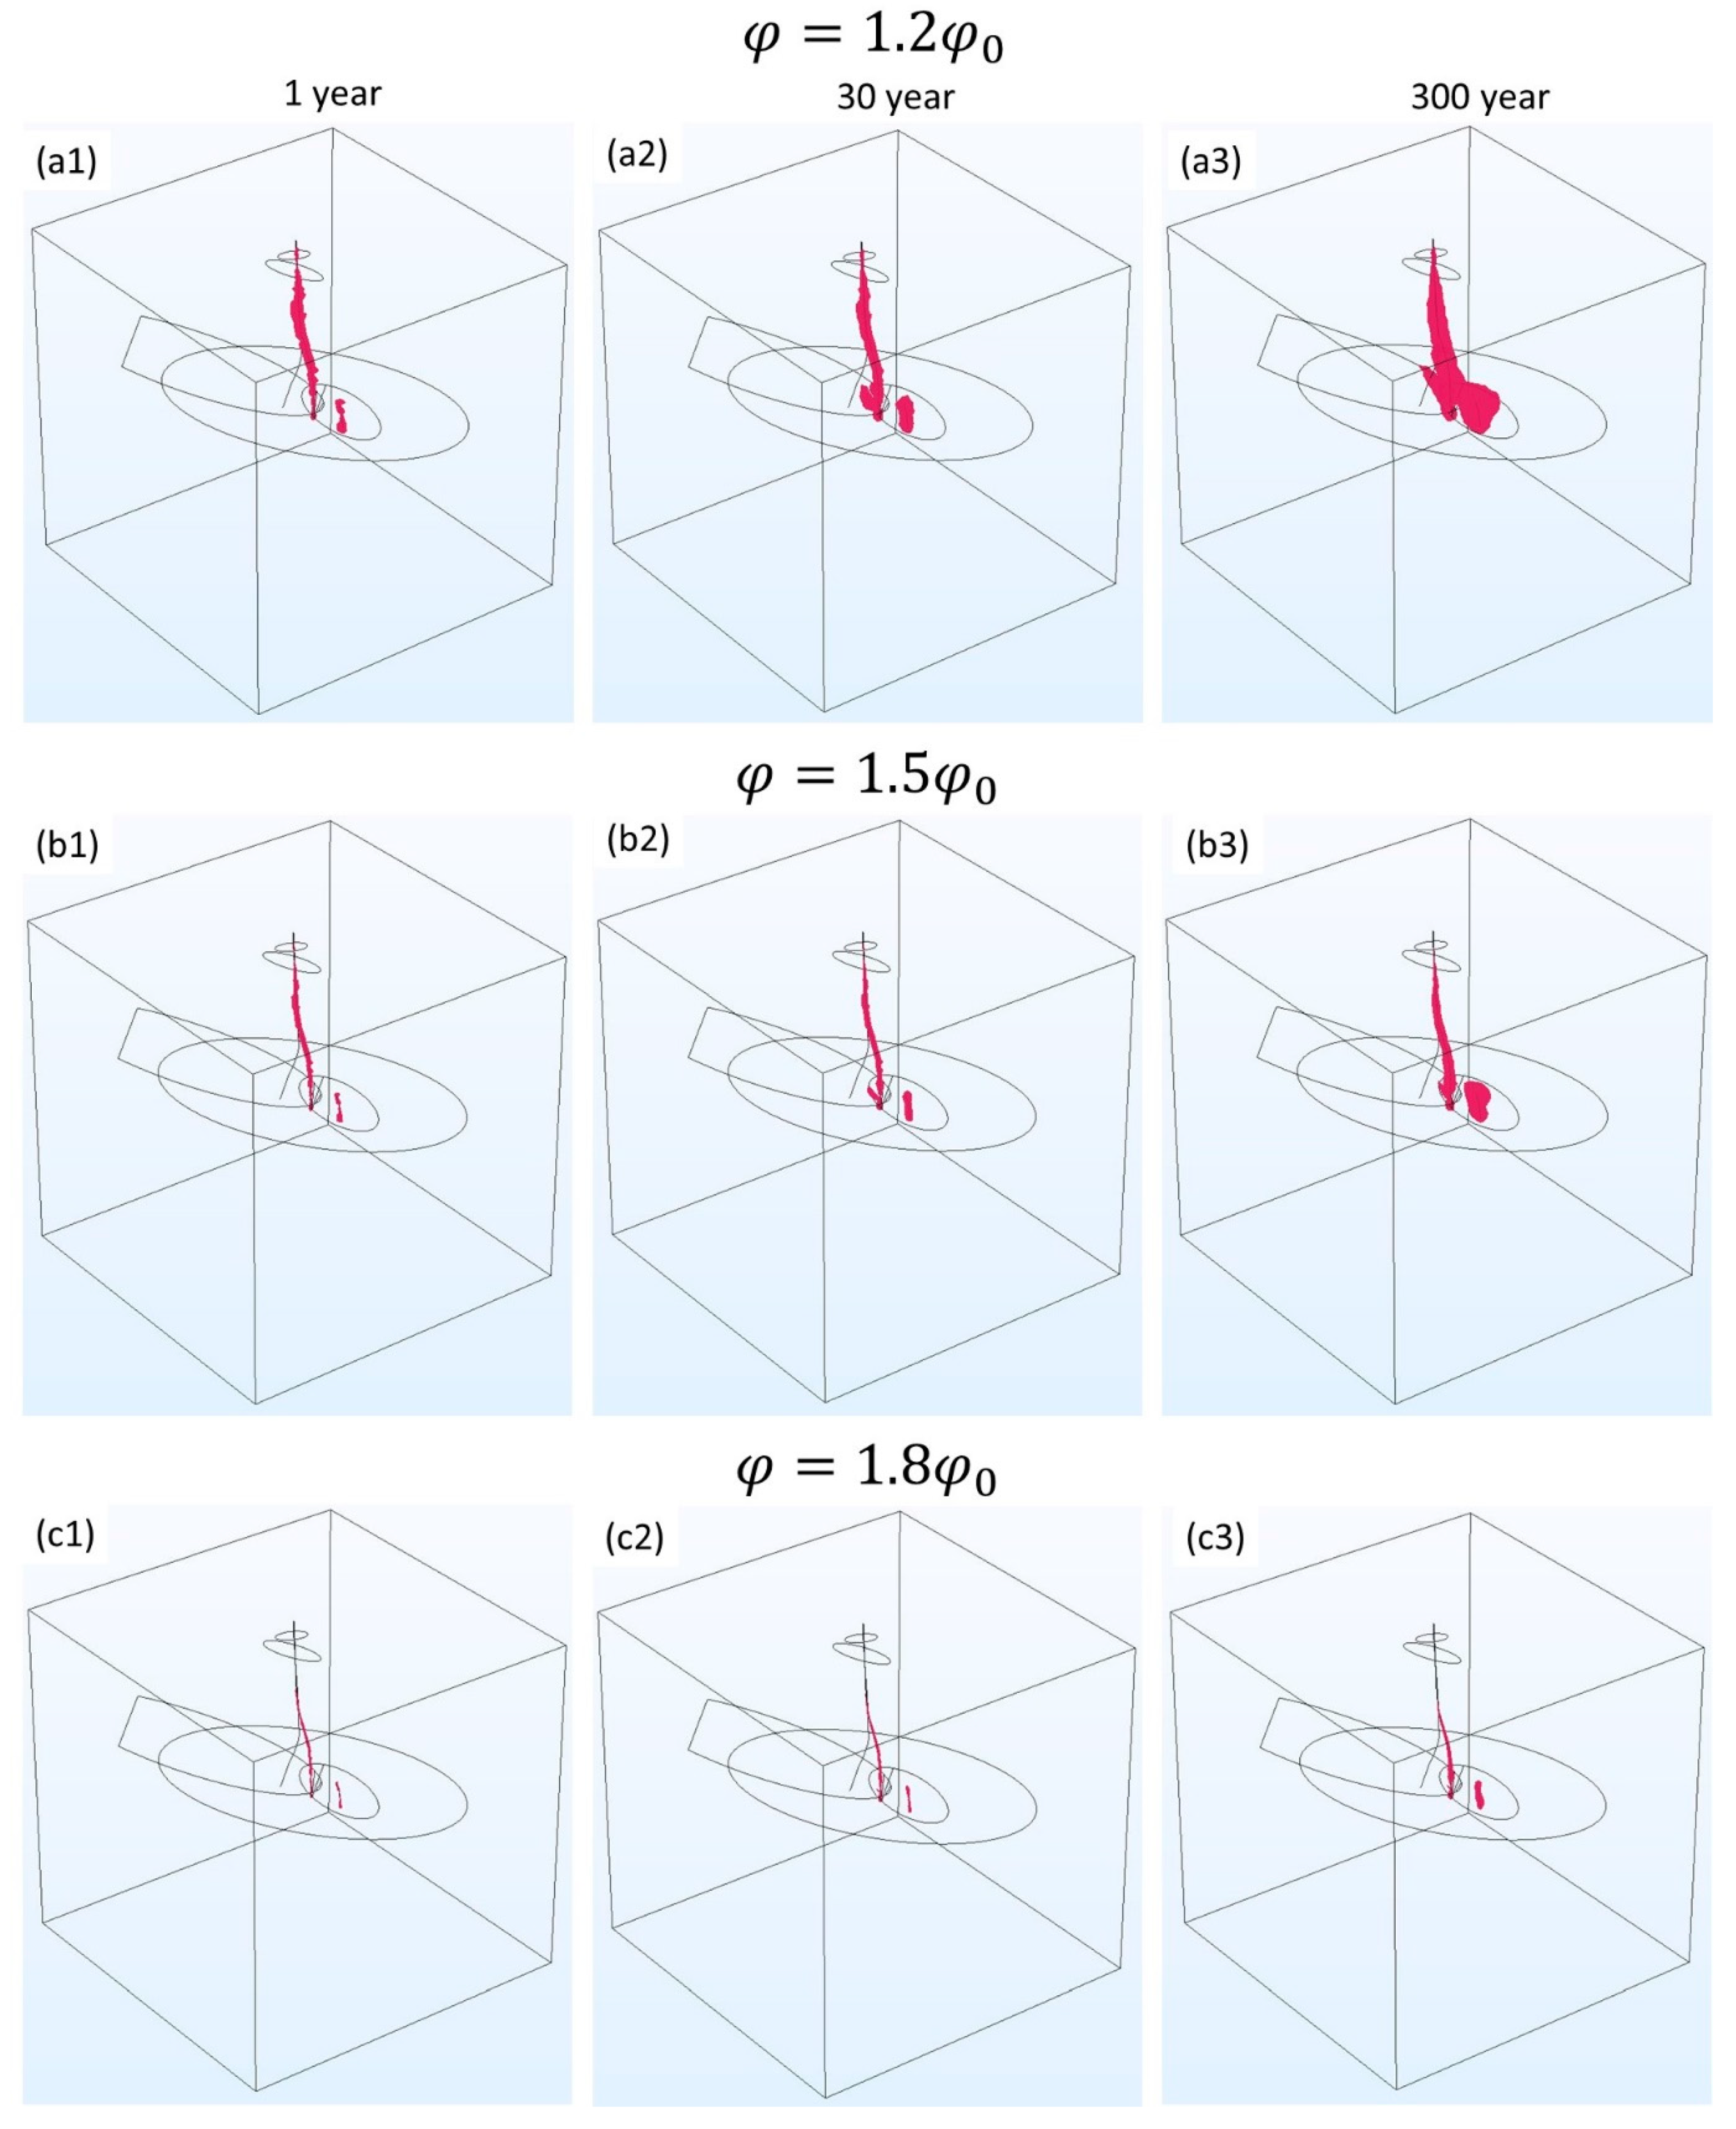
To examine the changes in the porosity values in 3D space, isosurface distributions are generated for the base case. Results are shown for the three values of porosity ratio as follows: 1.2, in Figure 5(a1,a2,a3), 1.5, in Figure 5(b1,b2,b3), and 1.8, in Figure 5(c1,c2,c3), after 1, 30, and 300 years of operation. It is important to note that there is a leakage along the GPK-2 and GPK-3, and that these two wells are much closer to each other in the upper region of the reservoir. This results in a higher porosity increase in the upper region and smaller porosity increase at the bottom hole section in the vicinity of GPK-3 at the early time (one year). Since there is no leakage for GPK-4, a higher porosity increase is observed in the bottom section after one year, as seen in Figure 5(a1). From Figure 5(a2,a3,b2,b3), the porosity enhancement inside the faulted zone is higher in comparison to the matrix zone, as expected. Due to the higher rate of injection, at the open hole section of GPK-4, a wider area of the porosity increase zone is observed. The isosurface of 1.5 shows slight penetration from the wellbore toward the reservoir, while the isosurface of 1.8 is visible only for the wellbore region. The porosity increase is restricted to the injection wellbores, and there are no detectable changes in the porosity of the bottom hole of GPK-2. Previously, we showed that production rate is a strong function of permeability in the vicinity of the production well [37] and the changes around the injection wellbores may not affect the production rate considerably. Based on this, we expect not to see a detectable change in the production flow rate or energy extraction for the entire operational period. Higher conductivity of FZ4925 results in a higher porosity increase inside the faulted zone. However, due to unavailability of any direct connection between this faulted zone and the production wellbore, we cannot expect energy extraction enhancement from this porosity increase. Due to the fluid flow connectivity between GPK-2 and GPK-3 in the upper region, injected cold fluid does not expand much around the injection wellbore for the entire operational duration. The leaked fluid from the injection wellbore reaches the production wellbore and, thus, overall fluid loss is limited.
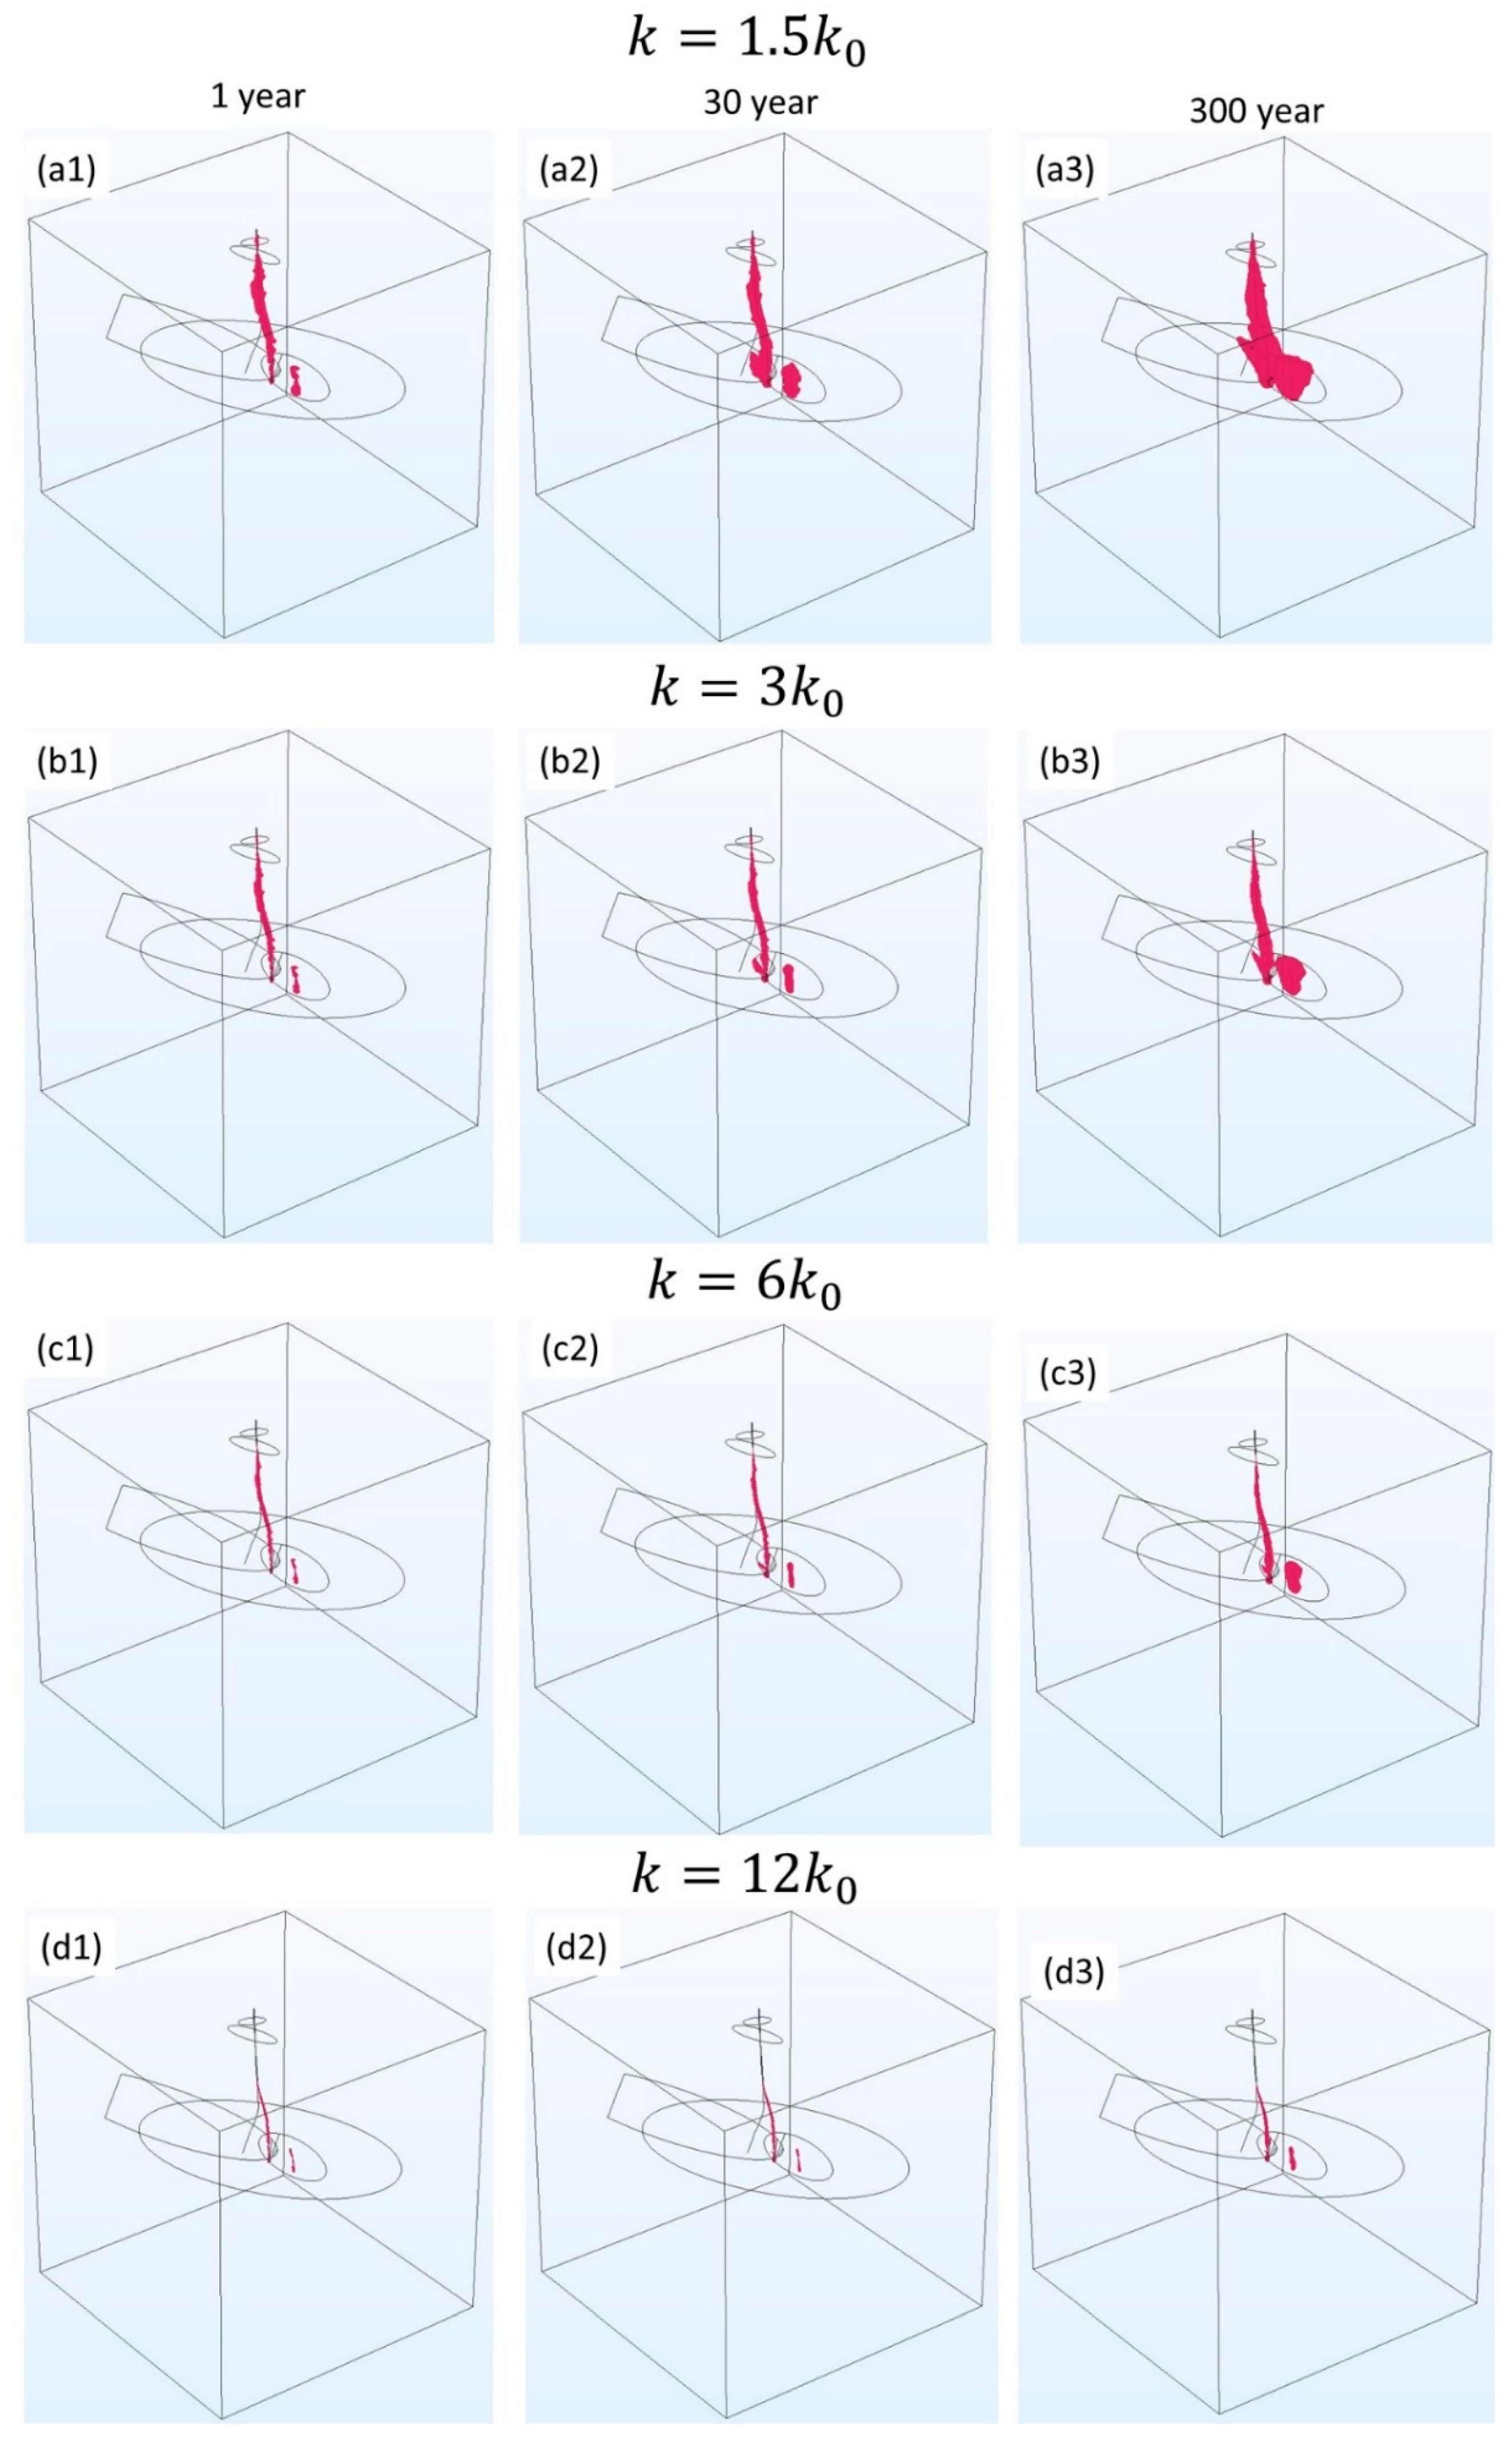
Furthermore, we have investigated the changes in the permeability of the reservoir and the faulted region values in 3D space using isosurface distributions for the base case. Four different values of permeability increase are shown in Figure 6, as follows: (a1,a2,a3) 50%, (b1,b2,b3) 200%, (c1,c2,c3) 500%, and (d1,d2,d3) 1100% increase from the initial permeability values. Similar to the results for the porosity changes, permeability variation also depicts a higher permeability increase in the upper regions of the GPK-2 and GPK-3 at an early time; however, this enhancement is not sustainable. At later times (30 years and 300 years) it is clearly visible that the permeability increase is much larger in the regions closer to the bottom hole section of the injection wellbores and enhancement inside the FZ4925 is higher in comparison to other faulted zones. The permeability increment near the bottom hole section of the production wellbore is negligible and the resulting production flow rates are smaller. The fluid flowing in GPK-3 and GPK-4 toward GPK-2 remains in contact with the hot rock for a longer period of time, and its potential to decrease the temperature of the rock diminishes at the bottom hole region. It is noteworthy that the 500% of permeability increment is restricted to only the wellbores and, therefore, it does not affect the production flow rate. However, due to this permeability increment, pressure buildup and the consequent seismic events will decrease. Figure 6(a1) shows that, after one year, there is not enough of a permeability increase in the faulted zone FZ4925 in the vicinity of the production wellbore. However, at 30 years, there is a large region of high permeability in the FZ4925 toward the production wellbore. The fluid arriving in this region further increases the permeability of FZ4760, as shown in Figure 6(a3) after 300 years. A similar behavior is clearly evident in Figure 6(b2,c2). It is interesting to note that permeability does not increases significantly in the leakage region due to a small fluid resident time in that region, and this is an economically attractive finding.
So far, we have presented the THM results for the base case. In the following section, a sensitivity analysis is performed for the parameters governing the geomechanical behavior of the entire reservoir, as listed in Table 3. 
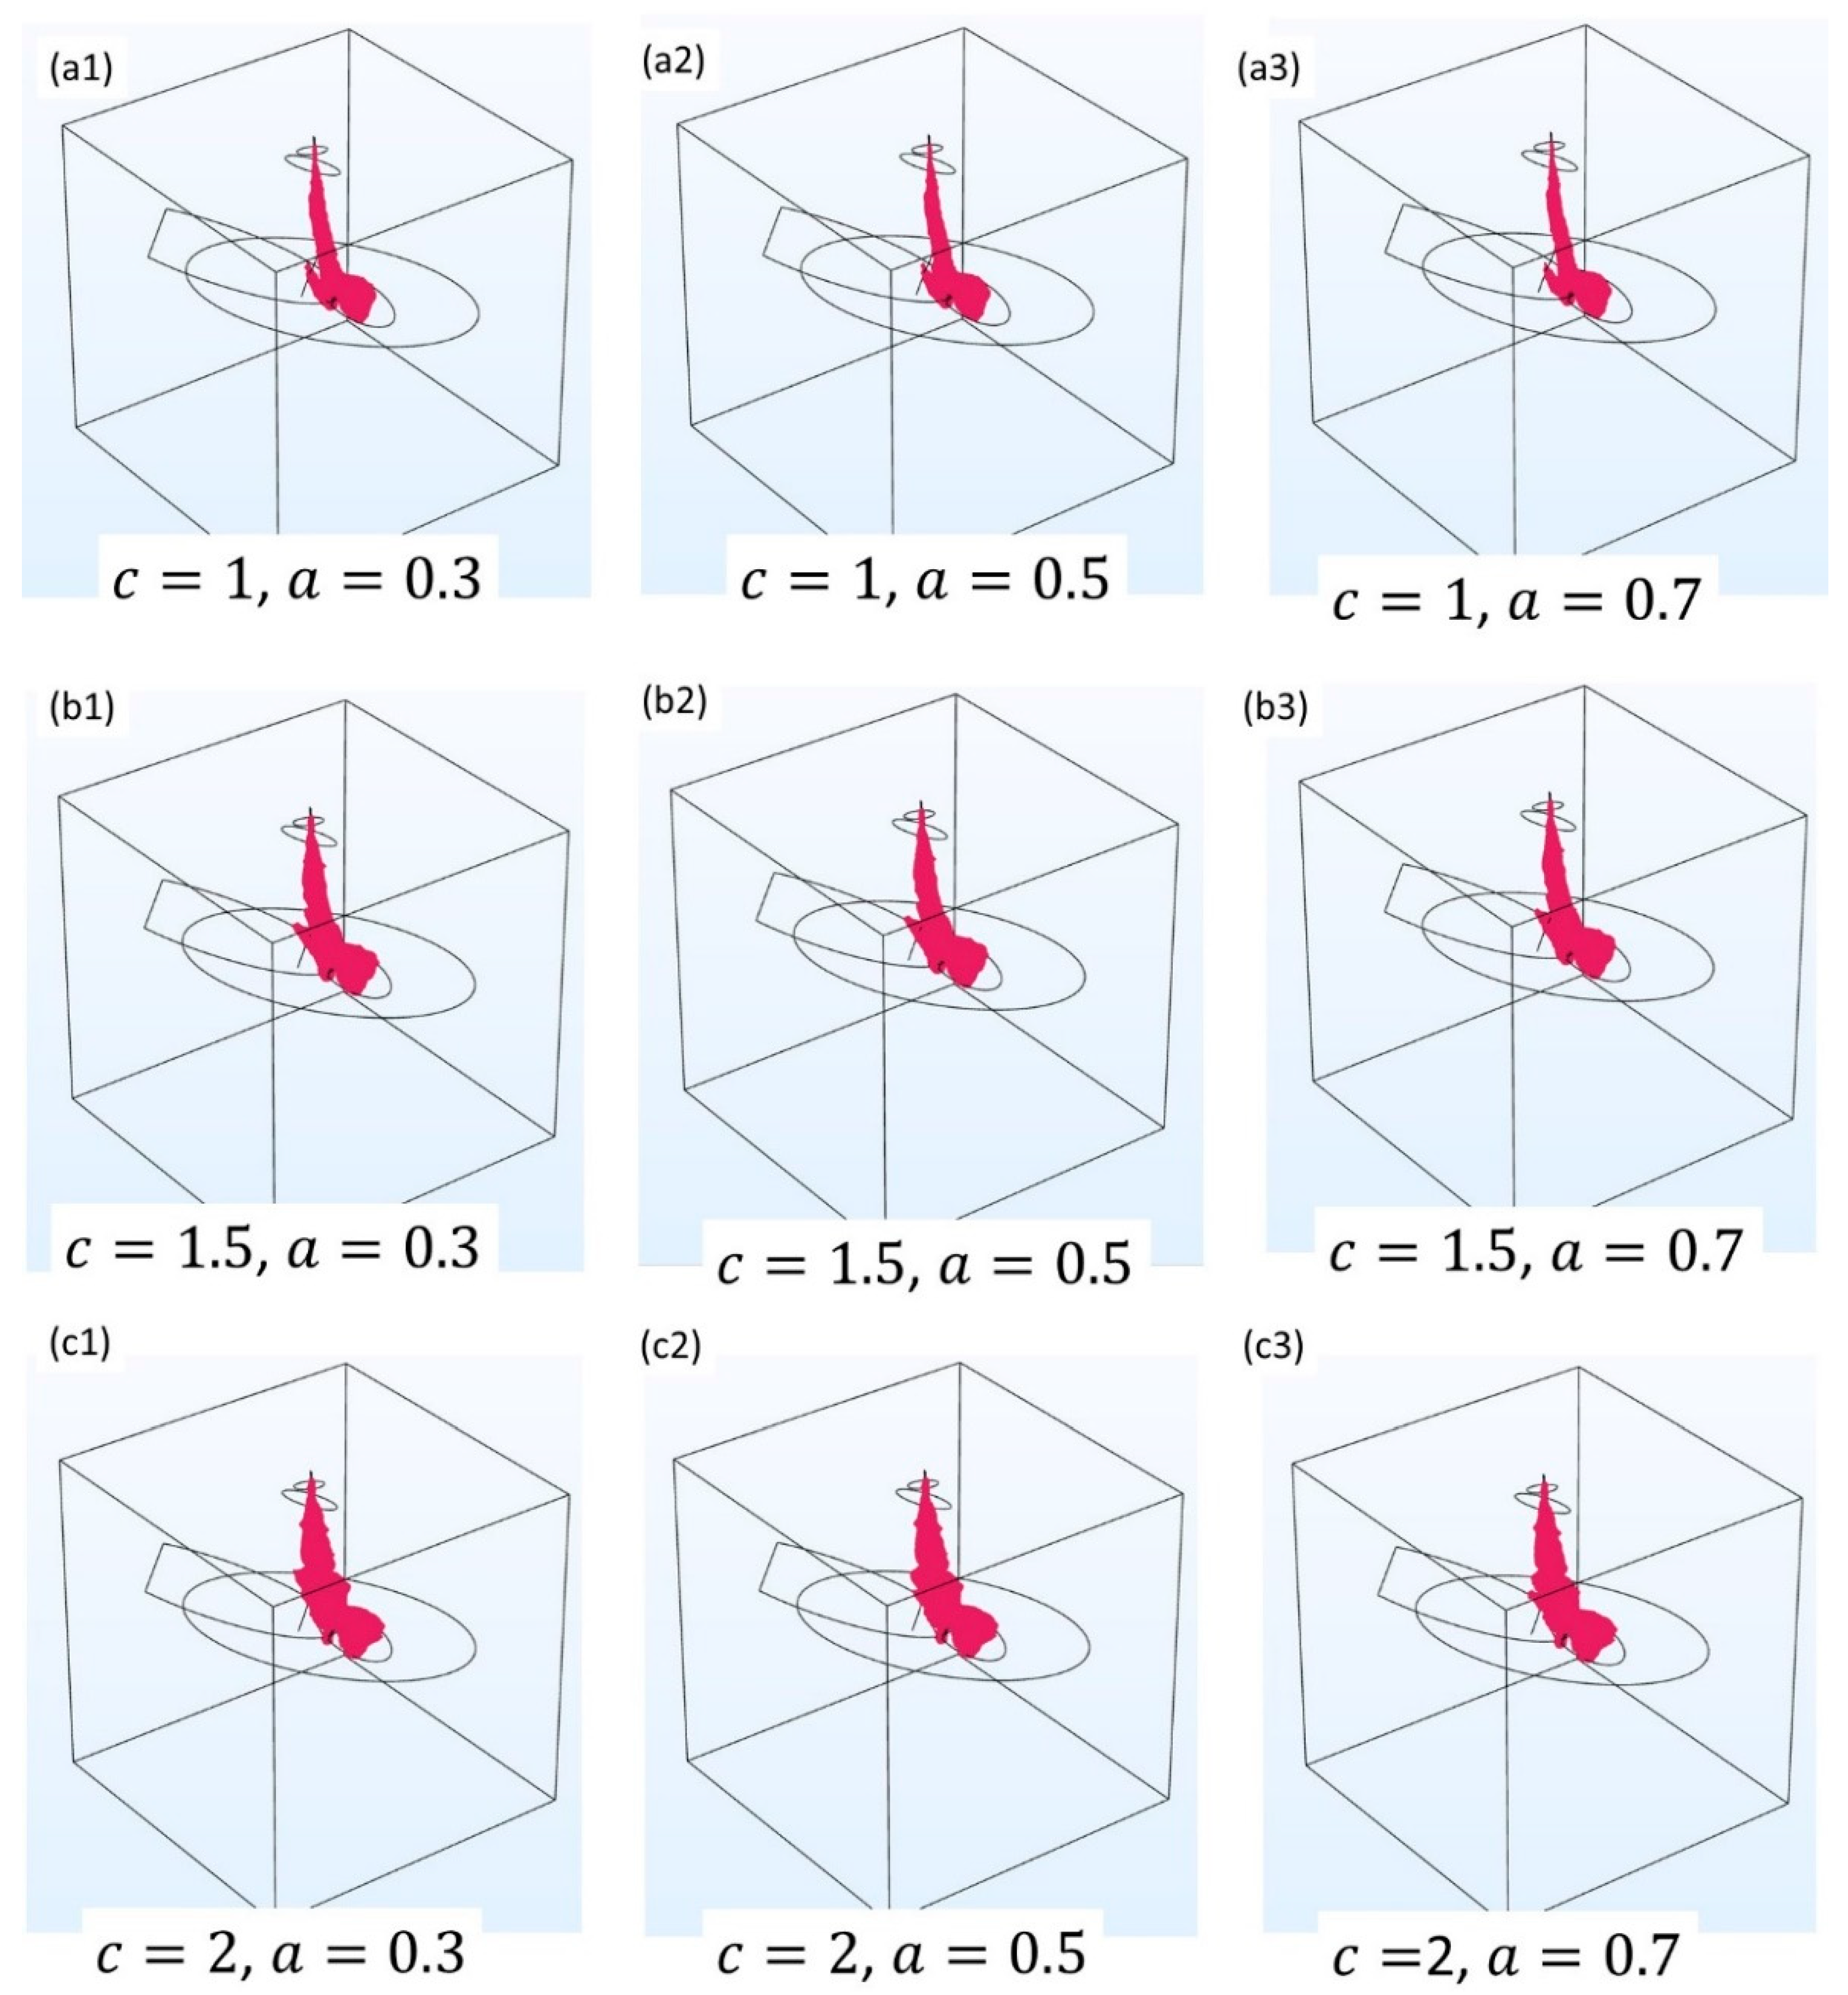
Figure 7 shows permeability isosurfaces where the isosurface values represent a 50% increase in permeability with respect to the initial permeability after 300 years of operation. Figure 7(a1,b1,c1) shows the cases with different values of c and a = 0.3 . In comparison to Figure 7(a2,b2,c2), with a = 0.5 and 7(a3,b3,c3), with a = 0.7 , the porosity reduction at the maximum attainable stress field for cases shown by Figure 7(a1,b1,c1) demonstrates higher values. Based on this, while the left column has the highest permeability values, the right column shows the lowest permeability increase. However, permeability changes are not a strong function of a . Here, c is a controlling factor for the permeability changes, not only in the bottom hole zone but also in the upper section of the wellbores. A case with a = 0.3 and c = 2 shows the highest permeability changes between the examined cases. By increasing the c values, the high permeability region around the casing leakage zone expands due to the increase in the porosity. In the similar manner, the high permeability region in the bottom holes of the wells for the cases with c = 2 is larger. However, after 300 years of the simulation, this region does not contribute to the fluid production near the open hole zone.
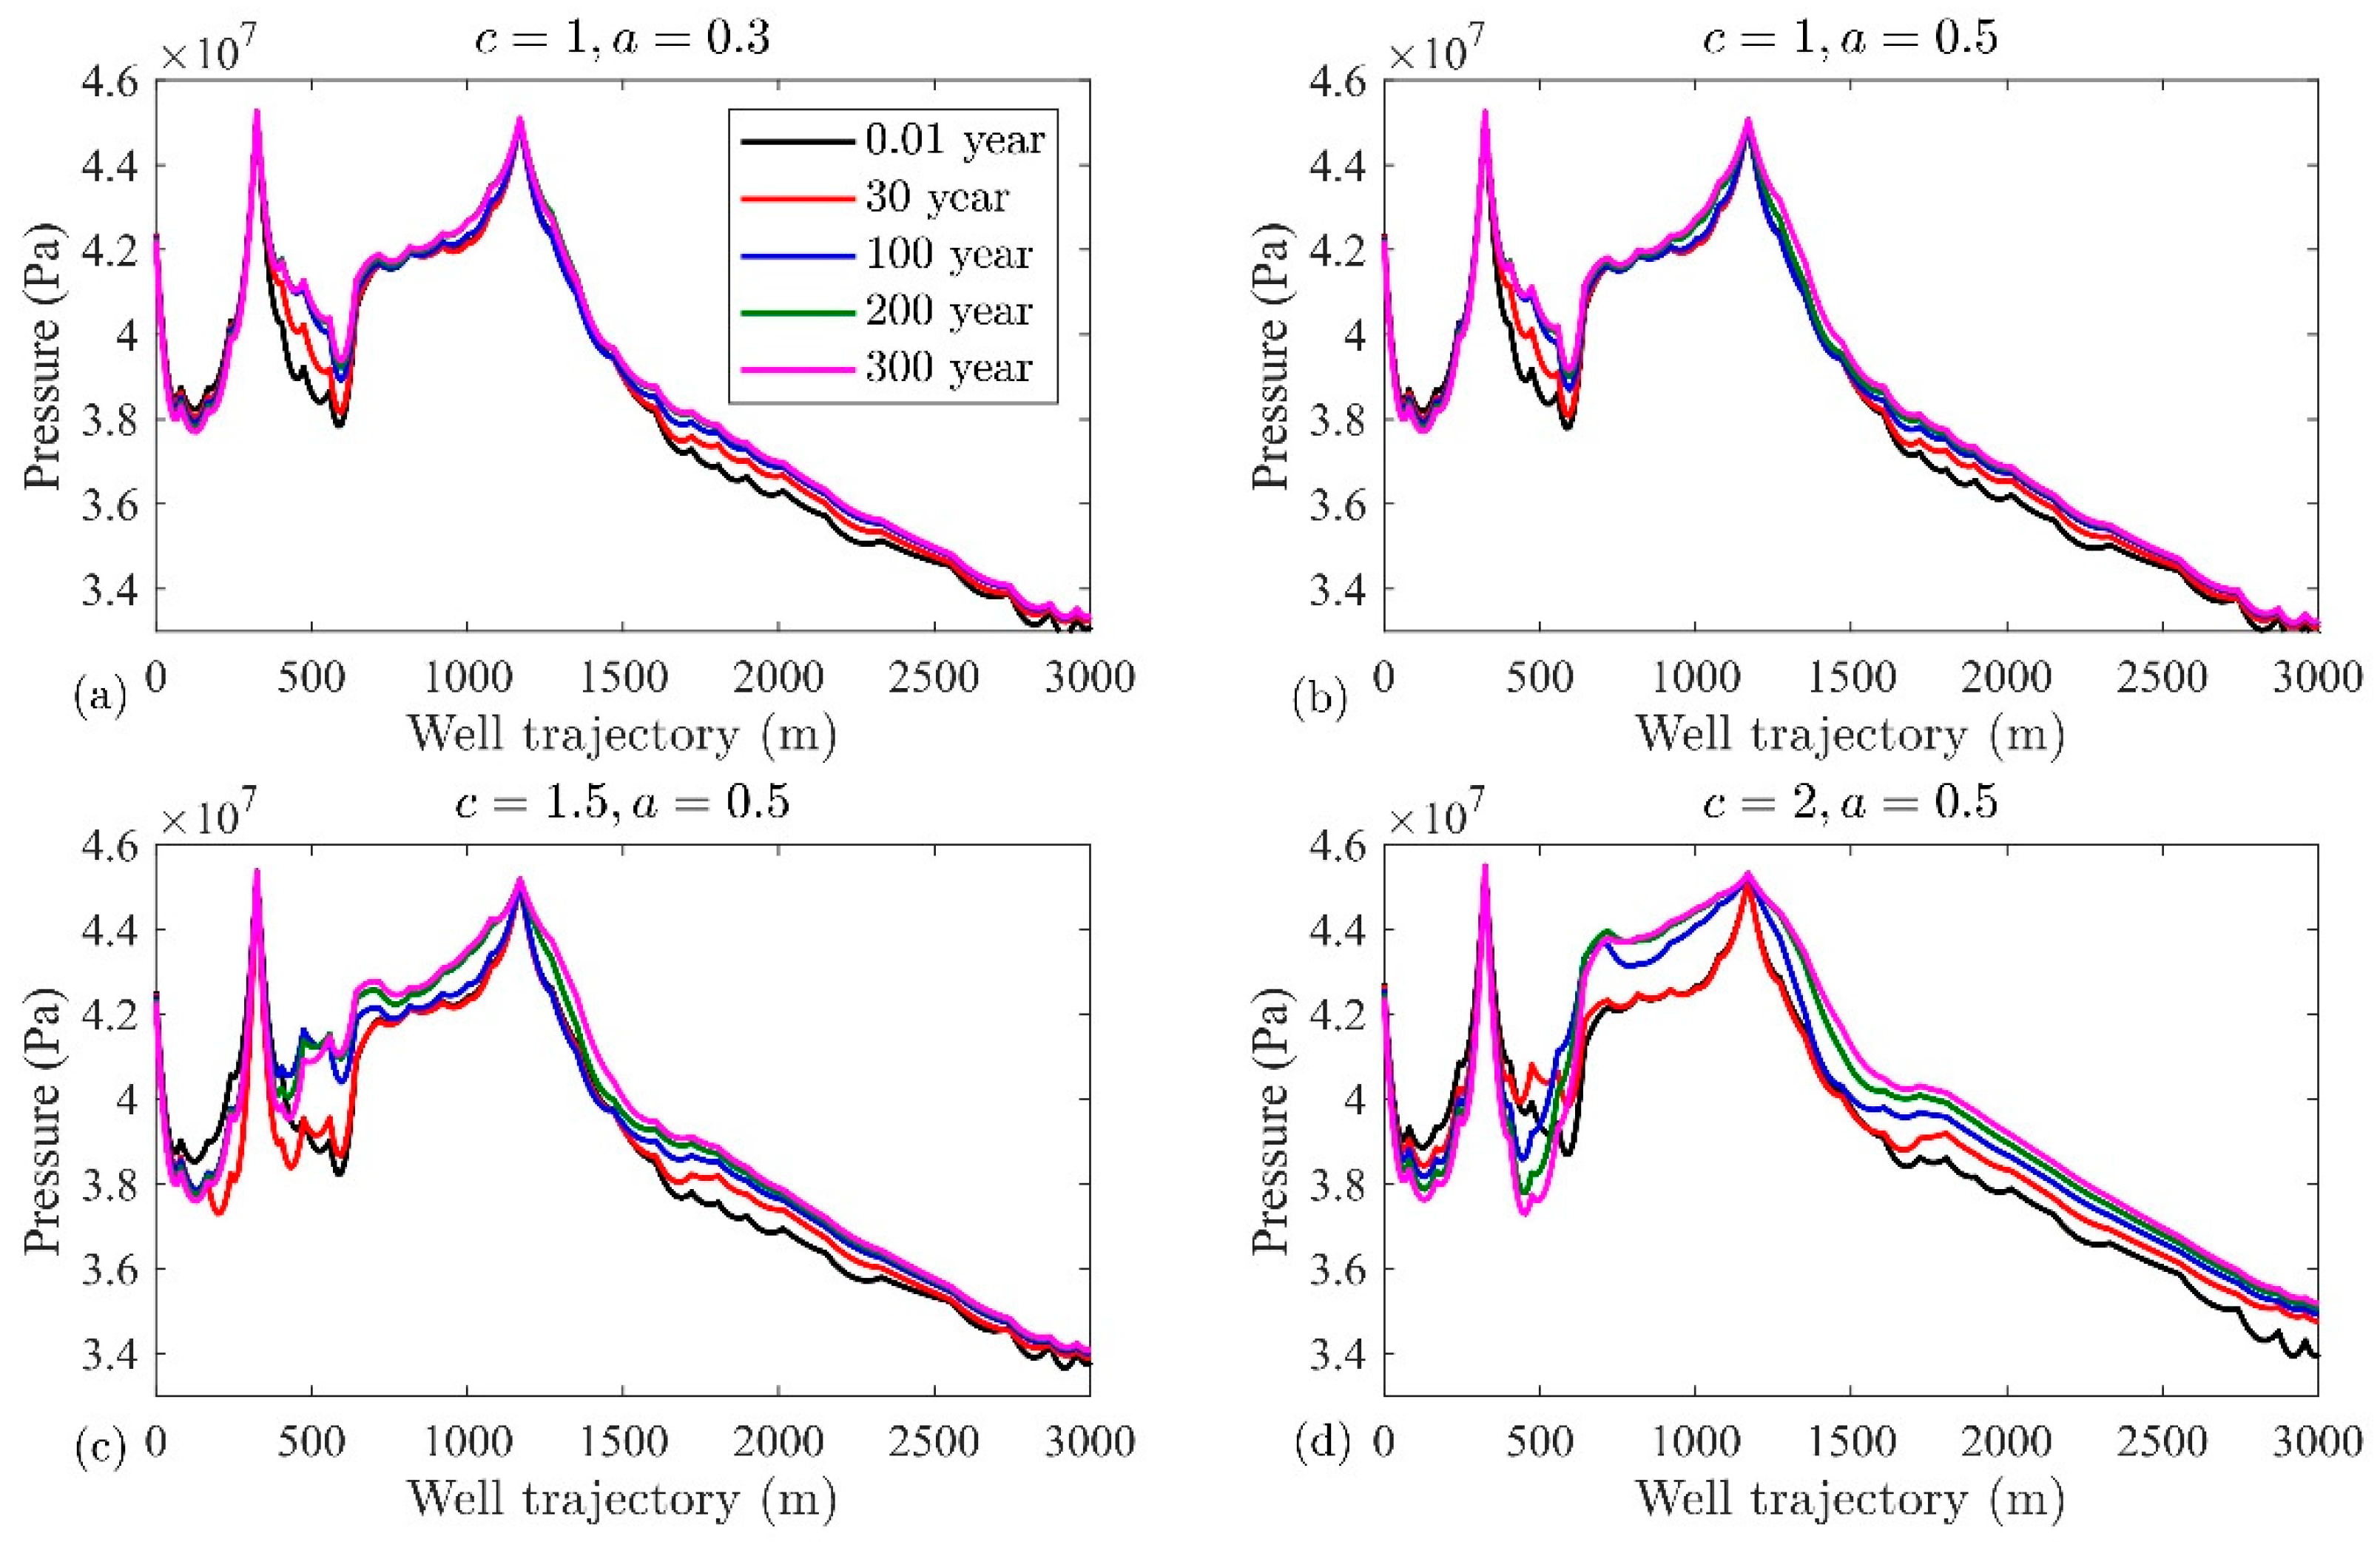
From the heat extraction aspect, pressure and temperature changes inside the reservoir are the main controlling factors. To track these changes, the production wellbore is selected, and corresponding pressure and temperature variation alongside it is provided in Figure 8 and Figure 9, respectively. Two peaks in Figure 8 indicate the intersection point of the faulted zones (FZ4760 and FZ4770) and the production wellbore. Figure 8a,b shows the effect of the a on the pressure changes alongside the production well. Comparison reveals that a has a negligible impact on the pressure variation along the GPK-2. Due to the higher conductivity of this faulted zone, pressure loss inside them will be negligible, and pressure at the intersecting point will be close to the pressure at the GPK-3 in the same fault. It is to be noted that the naming of the faulted zones is performed based on the intersection point between GPK-3 and the respective fault. These two faults (FZ4760 and FZ4770) have a closed proximity depth intersection with GPK-3, and their pressure values are, consequently, close. Based on this, the two peaks in Figure 8 have similar pressure values. As time progresses, permeability inside the matrix zone increases due to thermoporoelastic processes, as demonstrated in Figure 6. Furthermore, due to the constant injection and production rates, with higher permeability, the pressure gradient between the injection and production well decreases and the pressure alongside the production well in the matrix zone increases. However, for the more stress-sensitive cases, the presence of the faulted zone may change the increasing trend of the pressure with time (Figure 8c,d). For these cases, due to the greater increase in the permeability in the bottom hole section of the production wellbores, the pressure drawdown resulting from the fluid production is higher in comparison to the pressure increases from the fluid injection. Therefore, until the intersecting region between the FZ4760 and the production wellbore, there is a nonmonotonic pressure variation with time.
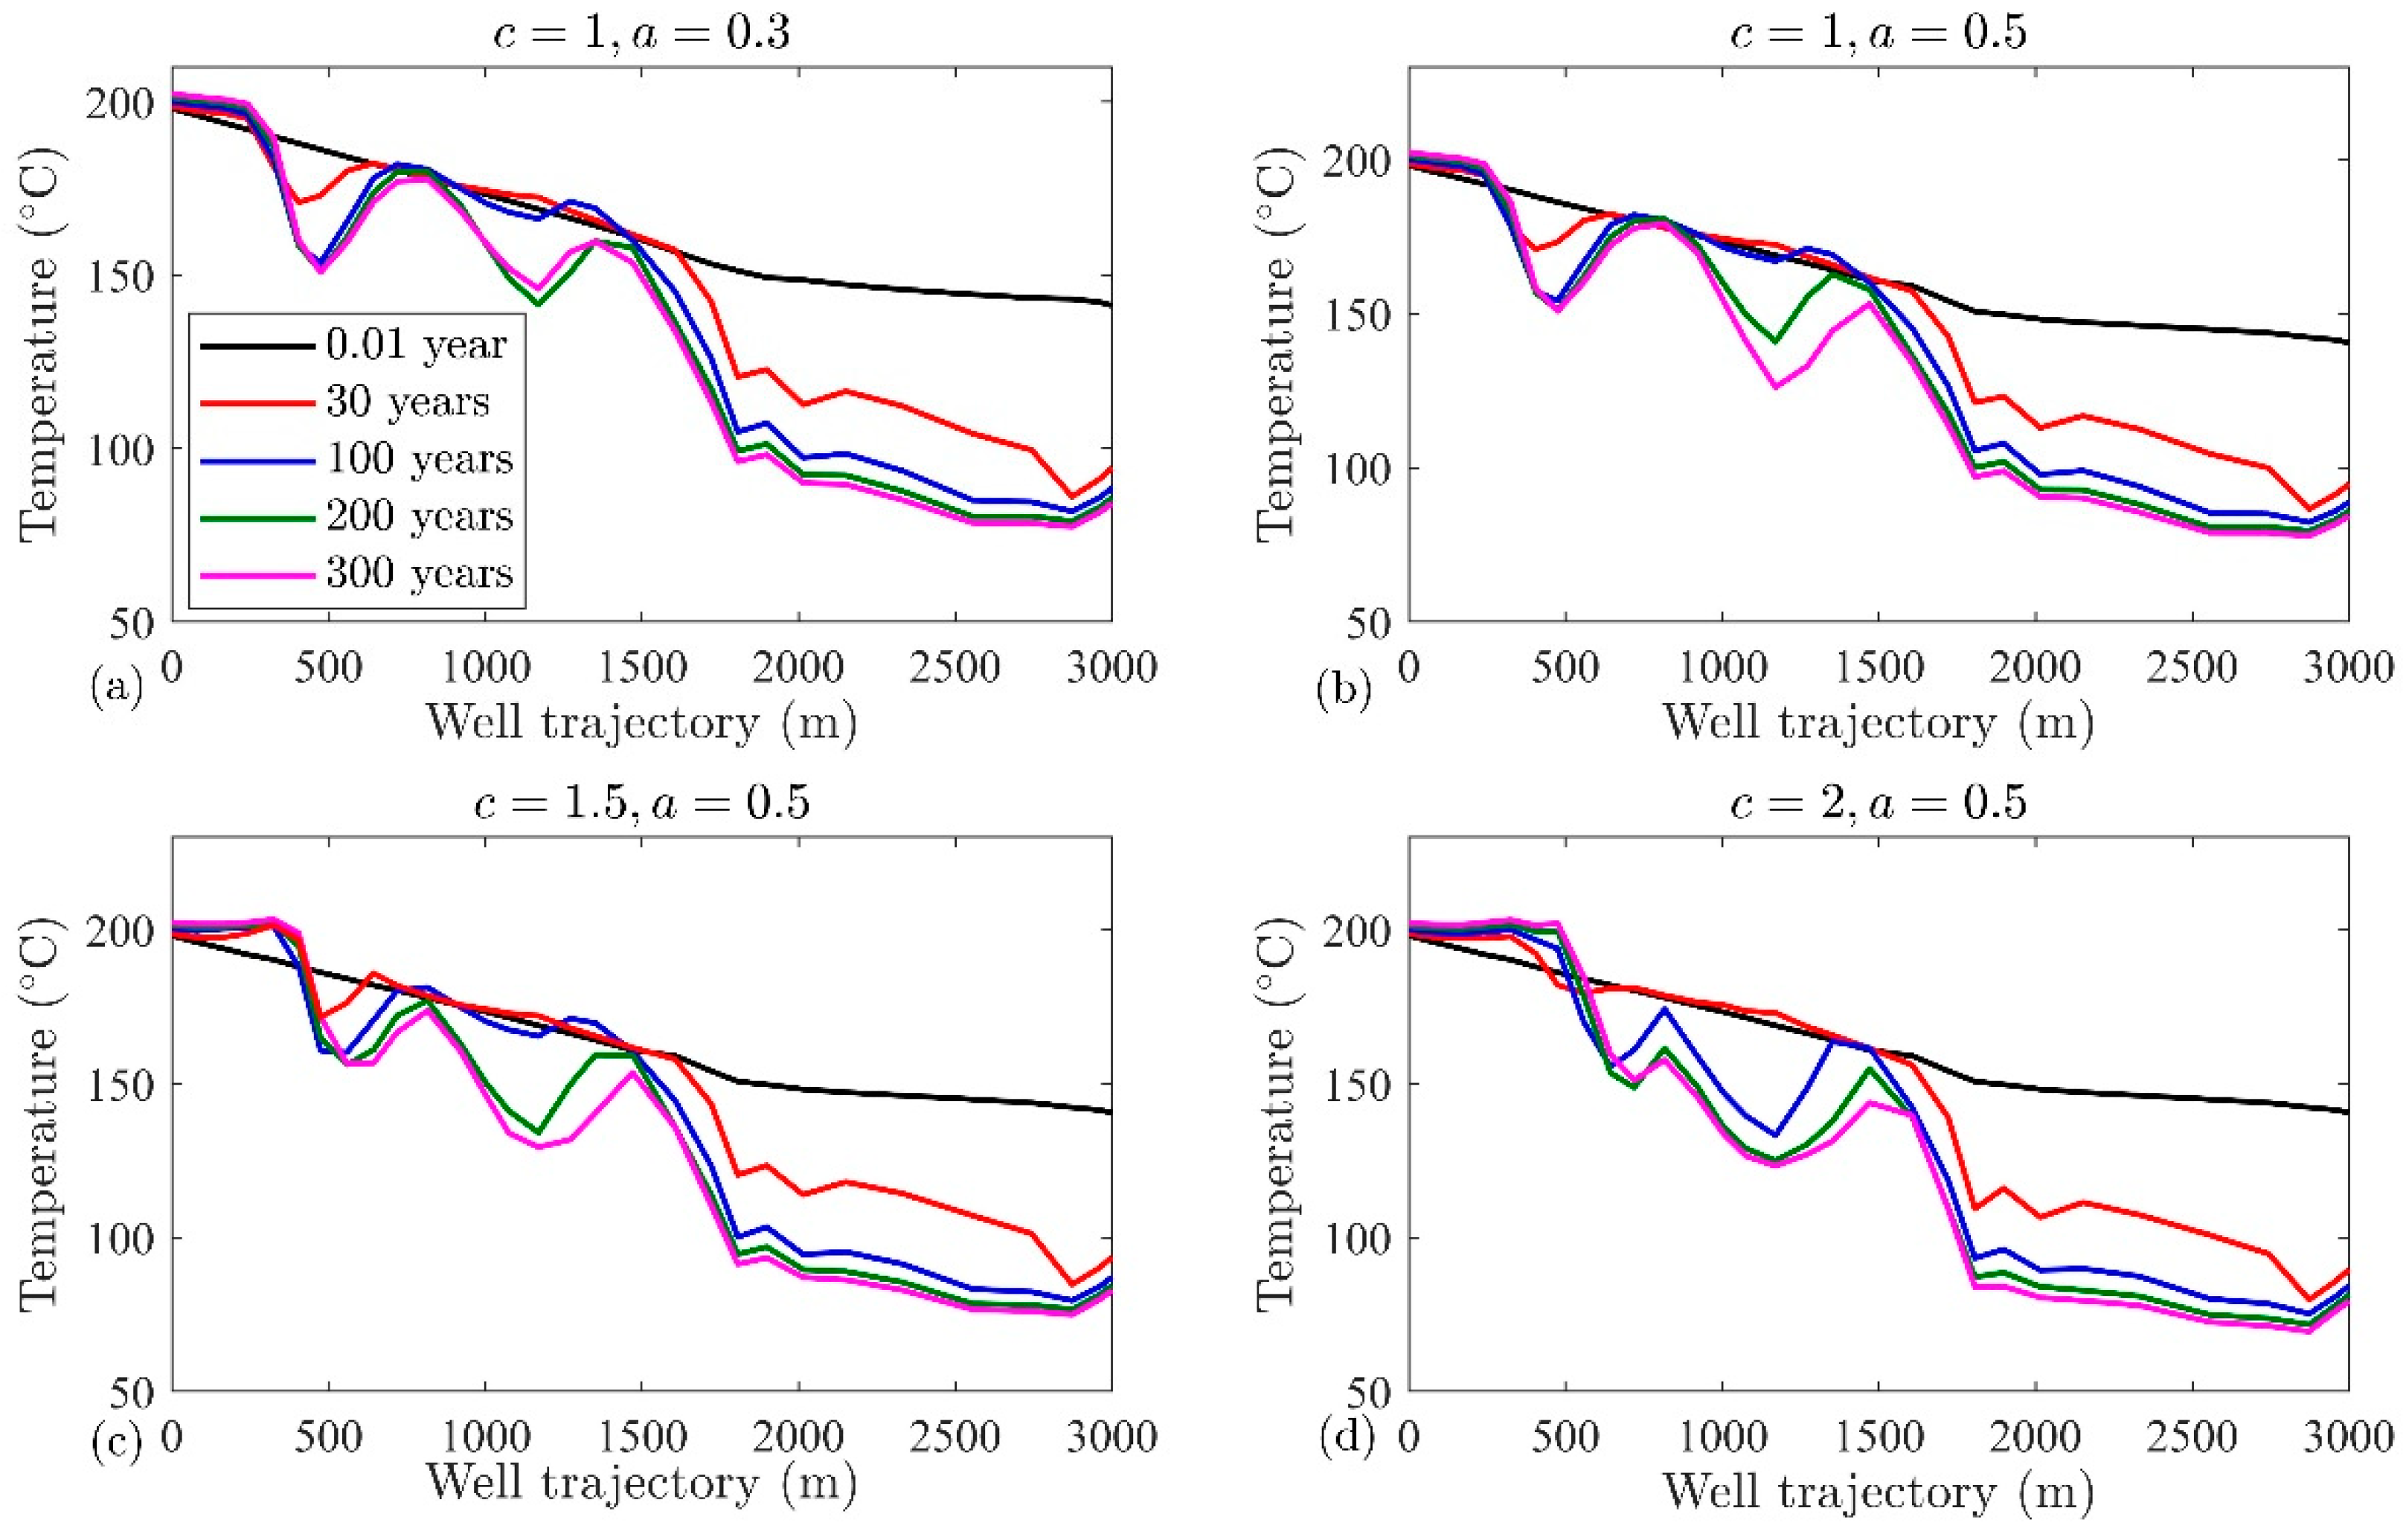
For the temperature analysis, we start from the base case. Figure 9c shows the temperature variation alongside the GPK-2 for the base case and its sensitivity to the a and c values (Figure 9a,b,d). Figure 9c shows a temperature increase in the bottom hole section of GPK-2 in comparison to the initial temperature of the reservoir. This can be explained by Figure 4 (left column), where it is clear that the fluid movement is from the bottom toward the top section. Fluid in the bottom zone has a higher temperature and it increases the temperature alongside the GPK-2 near the bottom hole section (red curve in Figure 9c). Up to 300 years of operation, the local minimum in the temperature occurs for the intersection of GPK-2 with FZ4770. For this point and the surrounding zone, injected cold fluid impact is quicker due to the higher permeability enhancement. The second local minimum is for the intersection of GPK-2 with the FZ4760. Beyond this region, or at a distance beyond 1500 m from the bottom hole of the GPK-2, there is a rapid temperature reduction caused by the closeness of the GPK-2 and GPK-3. In the open hole region of the GPK-2 (up to a distance almost 1500 m from the bottom), until 100 years, the temperature remains almost constant due to the higher distance between the GPK-2 and GPK-3, except at the intersection of GPK-2 and FZ-4770. However, for 200 years and 300 years, the temperature reduction front reaches the GPK-2 at the intersection point with FZ4760. For the upper regions, the temperature reduction front drastically affects GPK-2 at 30 years, whereas the change beyond this time is minimal. Figure 9a,b are the cases with a little dependency to the stress field changes. Comparing with Figure 9c, these cases show a negligible temperature increase in the bottom section of GPK-2 due to the lower conductivity of the faulted zone to support the hot fluid. Furthermore, due to the lower support of the FZ4770 in Figure 9a,b, even 30 years of operation shows a local minimum for the intersection of GPK-3 with the faulted zone. Comparing Figure 9a,b, it is clear that a has negligible impact on the temperature along the GPK-2. Due to the higher permeability enhancement in the matrix zone of Figure 9c, it shows a temperature reduction in the matrix zone between the two faulted zones in comparison to the case shown by Figure 9b. This confirms that the c value is not only important for the faulted zone but also for the matrix zone. Figure 9d shows the intensified picture of this behavior. The temperature alongside GPK-2 decreases with increasing the c value (see Figure 9b–d).

4. Conclusions

A fully coupled thermo-hydro-mechanical process considering thermo-poro-elastic stresses for Soultz-sous-Forêts is numerically modeled. Porosity and permeability alterations in the matrix and the faulted zones are considered. Two mechanical parameters that are necessary to track the coupled nature of the porosity–permeability–stress fields are identified. A sensitivity analysis shows that one of them is important and the other is not a very essential parameter. The permeability changes are in the range of the reported values for the idealized system, but they do not affect the heat extraction rate at the bottom hole region. Except for the faulted zone intersection with the production wellbore, temperature remains almost constant for a long production duration at the bottom hole zone. Fast temperature reduction occurs in the upper zone where there is leakage in the vicinity of the injection and production well. Porosity may double in the vicinity of the injection wellbore, but it mainly changes up to 50% of the initial value. In a similar manner, the permeability increases up to 30 times in some regions close to the injection wellbores, while it is possible for the permeability to increase up to 3 times in a wider section surrounding the injection wellbore. In this study, we kept the injection and production rates based on the operational data and performed a sensitivity analysis on the mechanical parameters. In future works, we will consider different operational scenarios (injection and production rates, and temperature) and examine the thermo-poroelastic stress field changes resulting from cold fluid injection. This will build a basis for seismic event analysis and making a safe EGS operational window.

Author Contributions

Conceptualization, S.M. and M.S.; methodology, S.M. and M.S.; software, S.M. and M.S.; validation, S.M., M.S. and R.M.; formal analysis, S.M., M.S., R.M., S.K.T. and K.B.; investigation, S.M., M.S., R.M., S.K.T. and K.B.; resources, K.B. and I.S.; data curation, S.M., M.S. and K.B.; writing—original draft preparation, S.M., M.S., R.M. and S.K.T.; writing—review and editing, S.M., M.S. and I.S.; visualization, S.M. and M.S.; supervision, K.B. and I.S.; project administration, I.S.; funding acquisition, I.S. All authors have read and agreed to the published version of the manuscript.

Funding

The work is conducted as a part of the MEET project that has received funding from the European Union’s Horizon 2020 research and innovation program under grant agreement No 792037.

Acknowledgments

Authors have received support from the Group of Geothermal Science and Technology, Institute of Applied Geosciences, Technische Universität Darmstadt. The authors would like to warmly thank the Soultz-sous-Forêts site owner, EEIG Exploitation Minière de la Chaleur, for information access about the Soultz site. We acknowledge support by the Deutsche Forschungsgemeinschaft (DFG, German Research Foundation) and the Open Access Publishing Fund of Technical University of Darmstadt.

Conflicts of Interest

The authors declare no conflict of interest.

References

  1. Baumgätner, J.; Gérard, A.; Baria, R.; Jung, R.; Tran-Viet, T.; Gandy, T.; Aquilina, L.; Garnish, J. Circulating the HDR Reservoir at Soultz: Maintaining Production and Injection Flow in Complete Balance. In Proceedings of the 23rd Workshop on Geothermal Reservoir Engineering, Stanford, CA, USA, 26–28 January 1998. [Google Scholar]
  2. Gérard, A.; Genter, A.; Kohl, T.; Lutz, P.; Rose, P.; Rummel, F. The deep EGS (enhanced geothermal system) project at soultz-sous-Forêts (Alsace, France). Geothermics 2006, 35, 473–483. [Google Scholar] [CrossRef]
  3. Genter, A.; Fritsch, D.; Cuenot, N.; Baumgärtner, J.; Graff, J.-J. Overview of the current activities of the European EGS Soultz project: From exploration to electricity production. In Proceedings of the 34th Workshop on Geothermal Reservoir Engineering, Stanford, CA, USA, 9–11 February 2009. [Google Scholar]
  4. Duringer, P.; Aichholzer, C.; Orciani, S.; Genter, A. The Complete Lithostratigraphic Section of the Geothermal Wells in Rittershoffen (Upper Rhine Graben, Eastern France): A Key for Future Geothermal Wells. BSGF Earth Sci. Bull. 2019, 190, 13. [Google Scholar] [CrossRef] [Green Version]
  5. Ledésert, B.A.; Hébert, R.L. How Can Deep Geothermal Projects Provide Information on the Temperature Distribution in the Upper Rhine Graben? The Example of the Soultz-Sous-Forêts-Enhanced Geothermal System. Geosciences 2020, 10, 459. [Google Scholar] [CrossRef]
  6. Guillou-Frottier, L.; Carre, C.; Bourgine, B.; Bouchot, V.; Genter, A. Structure of hydrothermal convection in the Upper Rhine Graben as inferred from corrected temperature data and basin-scale numerical models. J. Volcan. Geoth. Res. 2013, 256, 29–49. [Google Scholar] [CrossRef] [Green Version]
  7. Sausse, J.; Dezayes, C.; Dorbath, L.; Genter, A.; Place, J. 3D model of fracture zones at Soultz-sous-Forêts based on geological data, image logs, induced microseismicity and vertical seismic profiles. Comptes Rendus Geosci. 2010, 342, 531–545. [Google Scholar] [CrossRef]
  8. Dezayes, C.; Genter, A.; Valley, B. Structure of the low permeable naturally fractured geothermal reservoir at Soultz. Comptes Rendus Geosci. 2010, 342, 517–530. [Google Scholar] [CrossRef] [Green Version]
  9. Baujard, C.; Rolin, P.; Dalmais, É.; Hehn, R.; Genter, A. Soultz-sous-Forêts Geothermal Reservoir: Structural Model Update and Thermo-Hydraulic Numerical Simulations Based on Three Years of Operation Data. Geosciences 2021, 11, 502. [Google Scholar] [CrossRef]
  10. Mahmoodpour, S.; Singh, M.; Turan, A.; Bär, K.; Sass, I. Hydro-Thermal Modeling for Geothermal Energy Extraction from Soultz-sous-Forêts, France. Geosciences 2021, 11, 464. [Google Scholar] [CrossRef]
  11. Rolin, P.; Hehn, R.; Dalmais, E.; Genter, A. D3.3 Hydrothermal Model Matching Colder Reinjection Design, WP3: Upscaling of Thermal Power Production and Optimized Operation of EGS Plants; MEET Project Report, EU H2020 Grant Agreement No-792037; EU: Maastricht, The Netherlands, 2018. [Google Scholar]
  12. Vallier, B.; Magnenet, V.; Schmittbuhl, J.; Fond, C. Large scale hydro-thermal circulation in the deep geothermal reservoir of Soultz-sous-Forêts. Geothermics 2020, 78, 154–169. [Google Scholar] [CrossRef]
  13. Barton, N.; Bandis, S.; Bakhtar, K. Strength, deformation and conductivity coupling of rock joints. Int. J. Rock Mech. Min. Sci. Geomech. Abstr. 1985, 22, 121–140. [Google Scholar] [CrossRef]
  14. Rutqvist, J.; Wu, Y.S.; Tsang, C.F.; Bodvarsson, G. A modeling approach for analysis of coupled multiphase fluid flow, heat transfer, and deformation in fractured porous rock. Int. J. Rock Mech. Min. Sci. 2002, 39, 429–442. [Google Scholar] [CrossRef]
  15. Davies, J.P.; Davies, D.K. Stress-dependent permeability: Characterization and modeling. SPE J. 2001, 6, 224–235. [Google Scholar] [CrossRef]
  16. Zhao, Y.; Feng, Z.; Feng, Z.; Yang, D.; Liang, W. THM (Thermo-hydro-mechanical) coupled mathematical model of fractured media and numerical simulation of a 3D enhanced geothermal system at 573 K and buried depth 6000–7000 M. Energy 2015, 82, 193–205. [Google Scholar] [CrossRef]
  17. Wang, Y.; Li, T.; Chen, Y.; Ma, G. A three-dimensional thermo-hydro-mechanical coupled model for enhanced geothermal systems (EGS) embedded with discrete fracture networks. Comput. Methods Appl. Mech. Eng. 2019, 356, 465–489. [Google Scholar] [CrossRef]
  18. Pandey, S.N.; Vishal, V. Sensitivity analysis of coupled processes and parameters on the performance of enhanced geothermal systems. Sci. Rep. 2017, 7, 17057. [Google Scholar] [CrossRef] [Green Version]
  19. Pandey, S.N.; Chaudhuri, A.; Kelkar, S. A coupled thermo-hydro-mechanical modeling of fracture aperture alteration and reservoir deformation during heat extraction from a geothermal reservoir. Geothermics 2017, 65, 17–31. [Google Scholar] [CrossRef]
  20. Yao, J.; Zhang, X.; Sun, Z.; Huang, Z.; Liu, J.; Li, Y.; Xin, Y.; Yan, X.; Liu, W. Numerical simulation of the heat extraction in 3D-EGS with thermal-hydraulic-mechanical coupling method based on discrete fractures model. Geothermics 2018, 74, 19–34. [Google Scholar] [CrossRef]
  21. Salimzadeh, S.; Nick, H.M.; Zimmerman, R.W. Thermoporoelastic effects during heat extraction from low-permeability reservoirs. Energy 2018, 142, 546–558. [Google Scholar] [CrossRef] [Green Version]
  22. Vik, H.S.; Salimzadeh, S.; Nick, H.M. Heat recovery from multiple-fracture enhanced geothermal systems: The effect of thermoelastic fracture interactions. Renew. Energy 2018, 121, 606–622. [Google Scholar]
  23. Yuan, Y.; Xu, T.; Moore, J.; Lei, H.; Feng, B. Coupled thermo–hydro–mechanical modeling of hydro-shearing stimulation in an enhanced geothermal system in the raft river geothermal field, USA. Rock Mech. Rock Eng. 2020, 53, 5371–5388. [Google Scholar] [CrossRef]
  24. Cui, X.; Wong, L.N.Y. A 3D thermo-hydro-mechanical coupling model for enhanced geothermal systems. Int. J. Rock Mech. Min. Sci. 2021, 143, 104744. [Google Scholar] [CrossRef]
  25. Aliyu, M.D.; Archer, R.A. Numerical simulation of multifracture HDR geothermal reservoirs. Renew. Energy 2021, 164, 541–555. [Google Scholar] [CrossRef]
  26. Kang, F.; Li, Y.; Huang, X.; Li, T. Competition between cooling contraction and fluid overpressure on aperture evolution in a geothermal system. Renew. Energy 2022, 186, 704–716. [Google Scholar] [CrossRef]
  27. Kohl, T.; Bächler, D.; Rybach, L. Steps towards a comprehensive thermo-hydraulic analysis of the HDR test site Soultz-sous-Forêts. In Proceedings of the World Geothermal Congress, Kyushu-Tohoku, Japan, 28 May–10 June 2000; pp. 2671–2676. [Google Scholar]
  28. Pribnow, D.; Schellschmidt, R. Thermal tracking of upper crustal fluid flow in the Rhine Graben. Geophys. Res. Lett. 2000, 27, 1957–1960. [Google Scholar] [CrossRef]
  29. COMSOL Multiphysics® v. 5.5. COMSOL AB: Stockholm, Sweden. Available online: www.comsol.com (accessed on 19 March 2020).
  30. Valley, B.; Evans, K.F. Stress state at Soultz-sous-Forêts to 5 km depth from wellbore failure and hydraulic observations. In Proceedings of the 32nd Workshop on Geothermal Reservoir Engineering, Stanford, CA, USA, 22–24 January 2007; pp. 17469–17481. [Google Scholar]
  31. White, J.A.; Borja, R.I. Block-preconditioned Newton–Krylov solvers for fully coupled flow and geomechanics. Comput. Geosci. 2011, 15, 647–659. [Google Scholar] [CrossRef]
  32. Guo, L.; Huang, H.; Gaston, D.R.; Permann, C.J.; Andrs, D.; Redden, G.D.; Lu, C.; Fox, D.T.; Fujita, Y. A parallel, fully coupled, fully implicit solution to reactive transport in porous media using the preconditioned Jacobian-Free Newton-Krylov Method. Adv. Water Resour. 2013, 53, 101–108. [Google Scholar] [CrossRef]
  33. Zhang, H.; Guo, J.; Lu, J.; Li, F.; Xu, Y.; Downar, T.J. An assessment of coupling algorithms in HTR simulator TINTE. Nucl. Sci. Eng. 2018, 190, 287–309. [Google Scholar] [CrossRef]
  34. Bai, B. One-dimensional thermal consolidation characteristics of geotechnical media under non-isothermal condition. Eng. Mech. 2005, 22, 186–191. [Google Scholar]
  35. Mahmoodpour, S.; Singh, M.; Turan, A.; Bär, K.; Sass, I. Simulations and global sensitivity analysis of the thermo-hydraulic-mechanical processes in a fractured geothermal reservoir. Energy 2022, 247, 123511. [Google Scholar] [CrossRef]
  36. Mahmoodpour, S.; Singh, M.; Bär, K.; Sass, I. Thermo-hydro-mechanical modeling of an Enhanced geothermal system in a fractured reservoir using CO2 as heat transmission fluid-A sensitivity investigation. Energy 2022, 254, 124266. [Google Scholar] [CrossRef]
  37. Mahmoodpour, S.; Singh, M.; Bär, K.; Sass, I. Impact of Well Placement in the Fractured Geothermal Reservoirs Based on Available Discrete Fractured System. Geosciences 2022, 12, 19. [Google Scholar] [CrossRef]
Figure 1. Schematic diagram of wells with different fracture clusters in color coded strata [5].
Energies 15 09285 g001
Figure 2. Geometry of the Soultz-sous-Forêts geothermal site used for numerical modeling in this study. Here, the faults are numbered based on their intersection depths with the wellbores; the roller boundary condition assigned at the side walls (shown by roller symbol), the bottom boundary is restricted to the displacement, and top boundary is free to the movement. Production well is shown with the red color while the injection wells are shown by blue colors.
Energies 15 09285 g002
Figure 3. THM results for the base case scenario where a is 0.5 and c is 1.5. The left column indicates simulation results after 1 year, middle column shows results after 30 years, and the right column shows results after 300 years for (a1,a2,a3) temperature, (b1,b2,b3) principle stress in x-direction, (c1,c2,c3) principle stress in y-direction, (d1,d2,d3) principle stress in z-direction, (e1,e2,e3) porosity changes ratio compared to the initial values, and (f1,f2,f3) permeability changes ratio compared to the initial values.
Energies 15 09285 g003
Figure 4. THM results for the fault FZ4760 and the base case stress scenario i.e., a is 0.5 and c is 1.5. (a1,b1,c1) Temperature and (a2,b2,c2) porosity changes ratio compared to initial values, and (a3,b3,c3) permeability changes compared to initial values. Here, the temperature changes inside the fault zone significantly influences the porosity and permeability variation.
Energies 15 09285 g004
Figure 5. Porosity isosurfaces along the injection wellbores due to THM processes at a time of 1 year (left column), 30 years (middle column), and 300 years (right column) for a 20% increase from the initial value (a1,a2,a3), 50% increase (b1,b2,b3), and 80% increase over the initial value (c1,c2,c3).
Energies 15 09285 g005
Figure 6. Permeability isosurfaces along the injection wellbores due to THM processes at times of 1 year (left column), 30 years (middle column), and 300 years (right column) for 0.5 times increase from the initial value (a1,a2,a3), 3 times increase (b1,b2,b3), 6 times increase over the initial value (c1,c2,c3), and 12 times increase over the initial value (d1,d2,d3).
Energies 15 09285 g006
Figure 7. Permeability isosurfaces for a 50% increase over the initial permeability due to THM processes at time of 300 years.
Energies 15 09285 g007
Figure 8. Pressure variation along the production well where the well trajectory is measured from the bottom of the production well.
Energies 15 09285 g008
Figure 9. Temperature variation along the production well where the well trajectory is measured from the bottom of the production well.
Energies 15 09285 g009
Table 1. Properties of the five sets of fractures [9,11].
ParameterUnitFZ1800FZ2120FZ4760FZ4770FZ4925
Hydraulic conductivitym·s−16.08 × 10−61.7 × 10−50.052 × 10−56.3 × 10−5
Specific storage1·m−12 × 10−62 × 10−62 × 10−62 × 10−62 × 10−6
Porosity-0.10.10.10.10.1
Thermal conductivityW·m−1·K−12.52.52.52.52.5
Thermal capacityJ·m−3 K−12.9 × 10−62.9 × 10−62.9 × 10−62.9 × 10−62.9 × 10⁻⁶
Thicknessm12158151
Heat productionW·m−33 × 1063 × 1063 × 1063 × 1063 × 106
Transmissivitym2·s−17.3 × 10−52.55 × 10−40.43 × 10−46.3 × 10−5
Table 2. Initial and boundary conditions for this study.
Hydraulic Component
ParametersConditions
Initial pressureHydraulic gradient
Side boundary wallsOpen flow
Top and bottom surfacesNo flow
Thermal component
Initial temperatureTaken from Pribnow and Schellschmidt (2000)
Side boundary wallsOutflow allowed
Bottom surfaceConstant heat flux of 0.07 W/m2
Top surfaceConstant temperature
Mechanical component
Initial stress fieldTaken from Valley and Evans (2007)
Side boundary wallsRoller boundary conditions
Bottom surfaceFixed constrained
Top surfaceFree displacement
Table 3. Properties of the nine scenarios to examine the mechanical impact based on Equation (9).
Case Number123456789
c 1111.51.51.5222
a 0.30.50.70.30.50.70.30.50.7
Publisher’s Note: MDPI stays neutral with regard to jurisdictional claims in published maps and institutional affiliations.

