
LCA of Mixed Generation Systems in Singapore: Implications for National Policy Making
Institute of Sustainability for Chemicals, Energy and Environment, 1 Pesek Road, Jurong Island, Singapore 627833, Singapore
Energies 2022, 15(24), 9272; https://doi.org/10.3390/en15249272
Submission received: 3 November 2022
/
Revised: 29 November 2022
/
Accepted: 3 December 2022
/
Published: 7 December 2022
(This article belongs to the Special Issue Life Cycle Assessment of Energy and Environment)
Abstract
:The decarbonization of electrical power generation systems is one of Singapore’s national political agendas to reduce national greenhouse emissions. LCA is applied to assess the trade-offs of national implementation of electricity generation from conventional fossil-fuel power plants, compared to low-carbon alternatives. The first aim of LCA is to quantify the emission inventory of national electrical generation within the geographical boundary of Singapore, and next to generate the potential environmental impacts of Global Warming Potential, Acidification, and Eutrophication. Various scenarios are tested for a projected diversity of fuel resource mixes considered for years 2030 and 2040 and a hypothetical scenario where 100% renewable energy is employed and imported as the nation transitions towards a low-carbon energy future. Further discussions on the additional LCA model indicators should be included for the potential of low-carbon hydrogen application.
1. Introduction
As a highly industrialized and urbanized nation, energy plays an important role in shaping Singapore’s economic development. The increase in national electricity consumption for industrial and household needs has led to the need for obtaining various types of energy feedstock (e.g., fossil-based fuels and renewable energy resources), which may pose environmental or sustainability concerns. It is important to project the environmental profile of the changing landscape of the nation’s electrical generation systems taking into account the diversity of the energy resource portfolio [1]. As a city-state with no fossil fuel resources, Singapore relies entirely on imports to meet its growing natural gas demands, used mainly for electrical power generation and petrochemical production. The major source of natural gas comes mostly from West Natuna’s offshore gas field, other parts of Indonesia, and the rest from Malaysia. Besides natural gas, the second main fossil fuel resource imported is crude oil. Sources of crude oil are mainly shipped from Middle Eastern countries such as Saudi Arabia, Kuwait, Qatar, United Arab Emirates [2]. Another energy generation system is waste-to-energy (WTE) plants, or incineration facilities, which make use of heat generated from the calorific values of wastes to produce electricity [3]. As an important move toward the transition of a low-carbon nation, alternative sources of energy are sought.
To the best of our knowledge, no reported work has been conducted to evaluate the national trade-offs of energy mix portfolio—for the comparison of fossil fuels vs. renewable resources—via cradle-to-gate (resource supply-to-power) LCA application. The importance of this work is to provide implications for strategic policy making as the nation moves towards a low-carbon energy future.
1.1. Solar Power
With the aim to reduce greenhouse gas (GHG) emissions, Singapore is prompted to employ large-scale solar photovoltaic (PV) in the near future [4]. Over the past decades, research breakthroughs in solar technologies have made giant leaps to enable higher conversion efficiency at lower cost, resulting in exponential increases in global installed capacities [5]. Solar energy is also considered to be a non-polluting source of energy; its use is not accompanied by the release of harmful gases (e.g., oxides of C/N/S and/or VOCs) and particles (e.g., soot, heavy metals, and dust) [6].
1.2. Liquefied Natural Gas (LNG)
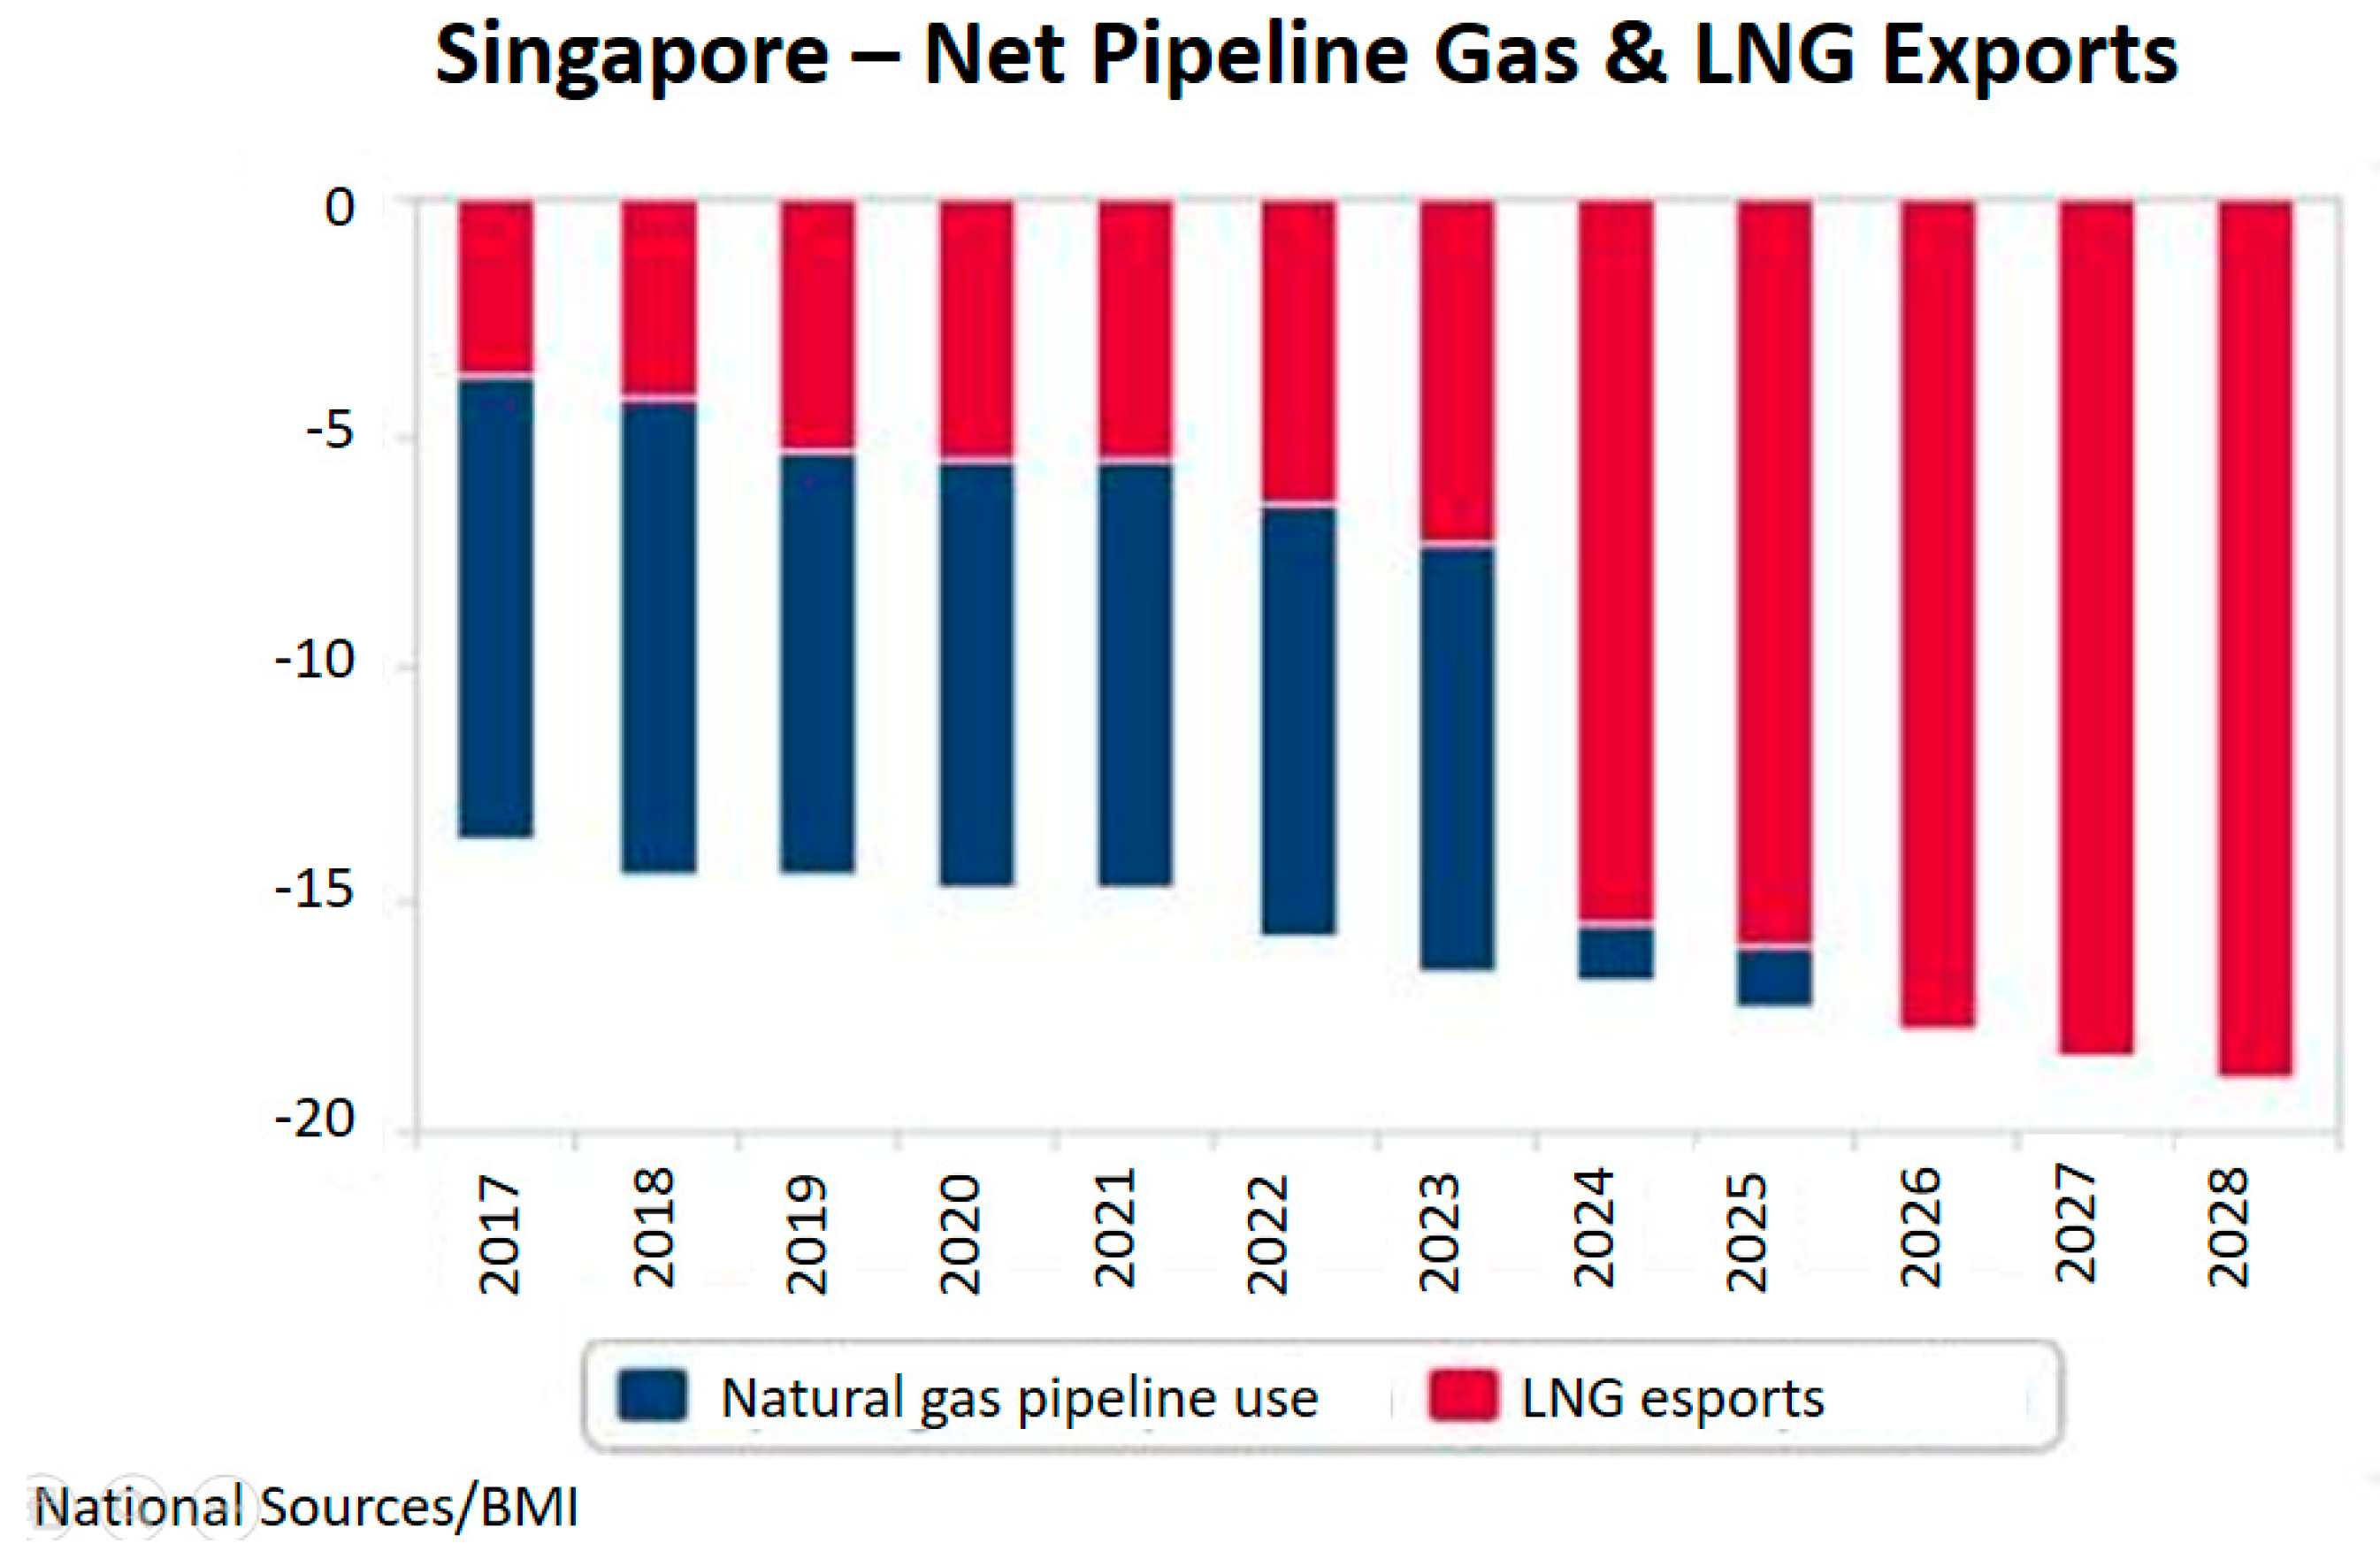
With plans to diversify energy resources, liquefied natural gas (LNG) will begin to play a bigger role in power generation in the coming years. A graph predicting the increased volume of LNG imports is shown in Figure 1 [7]. LNG can be delivered by ocean tankers from neighboring countries to Singapore. This will help the options for fossil fuel requirements and, at the same time, help to safeguard the nation’s future energy needs [8]. A vast volume of LNG is located in Western Australia, where the world’s largest LNG project is situated [9]. Indonesia, another LNG producer, has established strategic national projects in the energy sector with the aim of exporting more LNG to Singapore. Among the LNG projects are the Indonesia Deepwater Development (IDD) and Jambaran-Tiung Biru Field in Java. Exports of LNG from Indonesia are expected to play a major part in Singapore’s energy portfolio in the next coming years [10]. After the transportation of LNG to its destination, regasification is also required [11,12]. The specific work required for liquefaction can range from 907 to 1080 kJ/kg LNG [13,14]. Regasification of LNG to NG can require ca. 853 kJ/kg [15].
1.3. Renewable Hydrogen and Bioenergy
The cleanest way to produce hydrogen is through water-splitting technologies coupled with renewable energy sources. In order to achieve large-scale hydrogen-to-electricity supply chains, reliable systems for hydrogen production, storage, and distribution are vitally important. As research and demonstration activities of hydrogen technology progress, one of the energy sources for the nation is expected to come from renewable hydrogen [16].
Agricultural by-products can be found in neighboring countries such as Malaysia or Indonesia. Rice husk contains about 30–50% of organic carbon and has a high heat value of around 16 MJ/kg [17]. The biomass resource can be used to generate fuel, heat, or electricity [18,19]. Most bioenergy plants use direct-fired combustion systems where the biomass is combusted directly to produce high-pressure steam that drives turbine generators to generate electricity.
1.4. Wind and Hydropower
Wind and hydropower are both regarded as renewable energy technologies that emit lesser emissions that pollute the environment [20]. Apart from greenhouse gas reductions, such renewable energy generation technologies can also help in reducing the dependency on fossil fuels [21]. It has been estimated that roughly 10 million MW of energy are continuously available in the earth’s wind. Studies have already been performed to determine the environmental benefits of different types of hydropower concepts [22] and wind power technologies [23].
2. Materials and Methods
Life cycle assessment (LCA) is applied to demonstrate how the diversification of the fuel supply portfolio is an important factor that affects the impacts of electrical production systems within the geographical boundary of Singapore for the following:
- (i)
- National inventory emissions for 2020 according to national fuel mix (compared to the year 2010), and next, the associated environmental impacts of electricity generation from different supplies of fuels for the functional unit of 1 MWh.
- (ii)
- Environmental impacts of projected fuel mixes for 2030 and 2040; and a futuristic scenario where 100% renewable energy technologies are applied and imported. The projected scenarios serve to generate the impacts for 1 TWh.
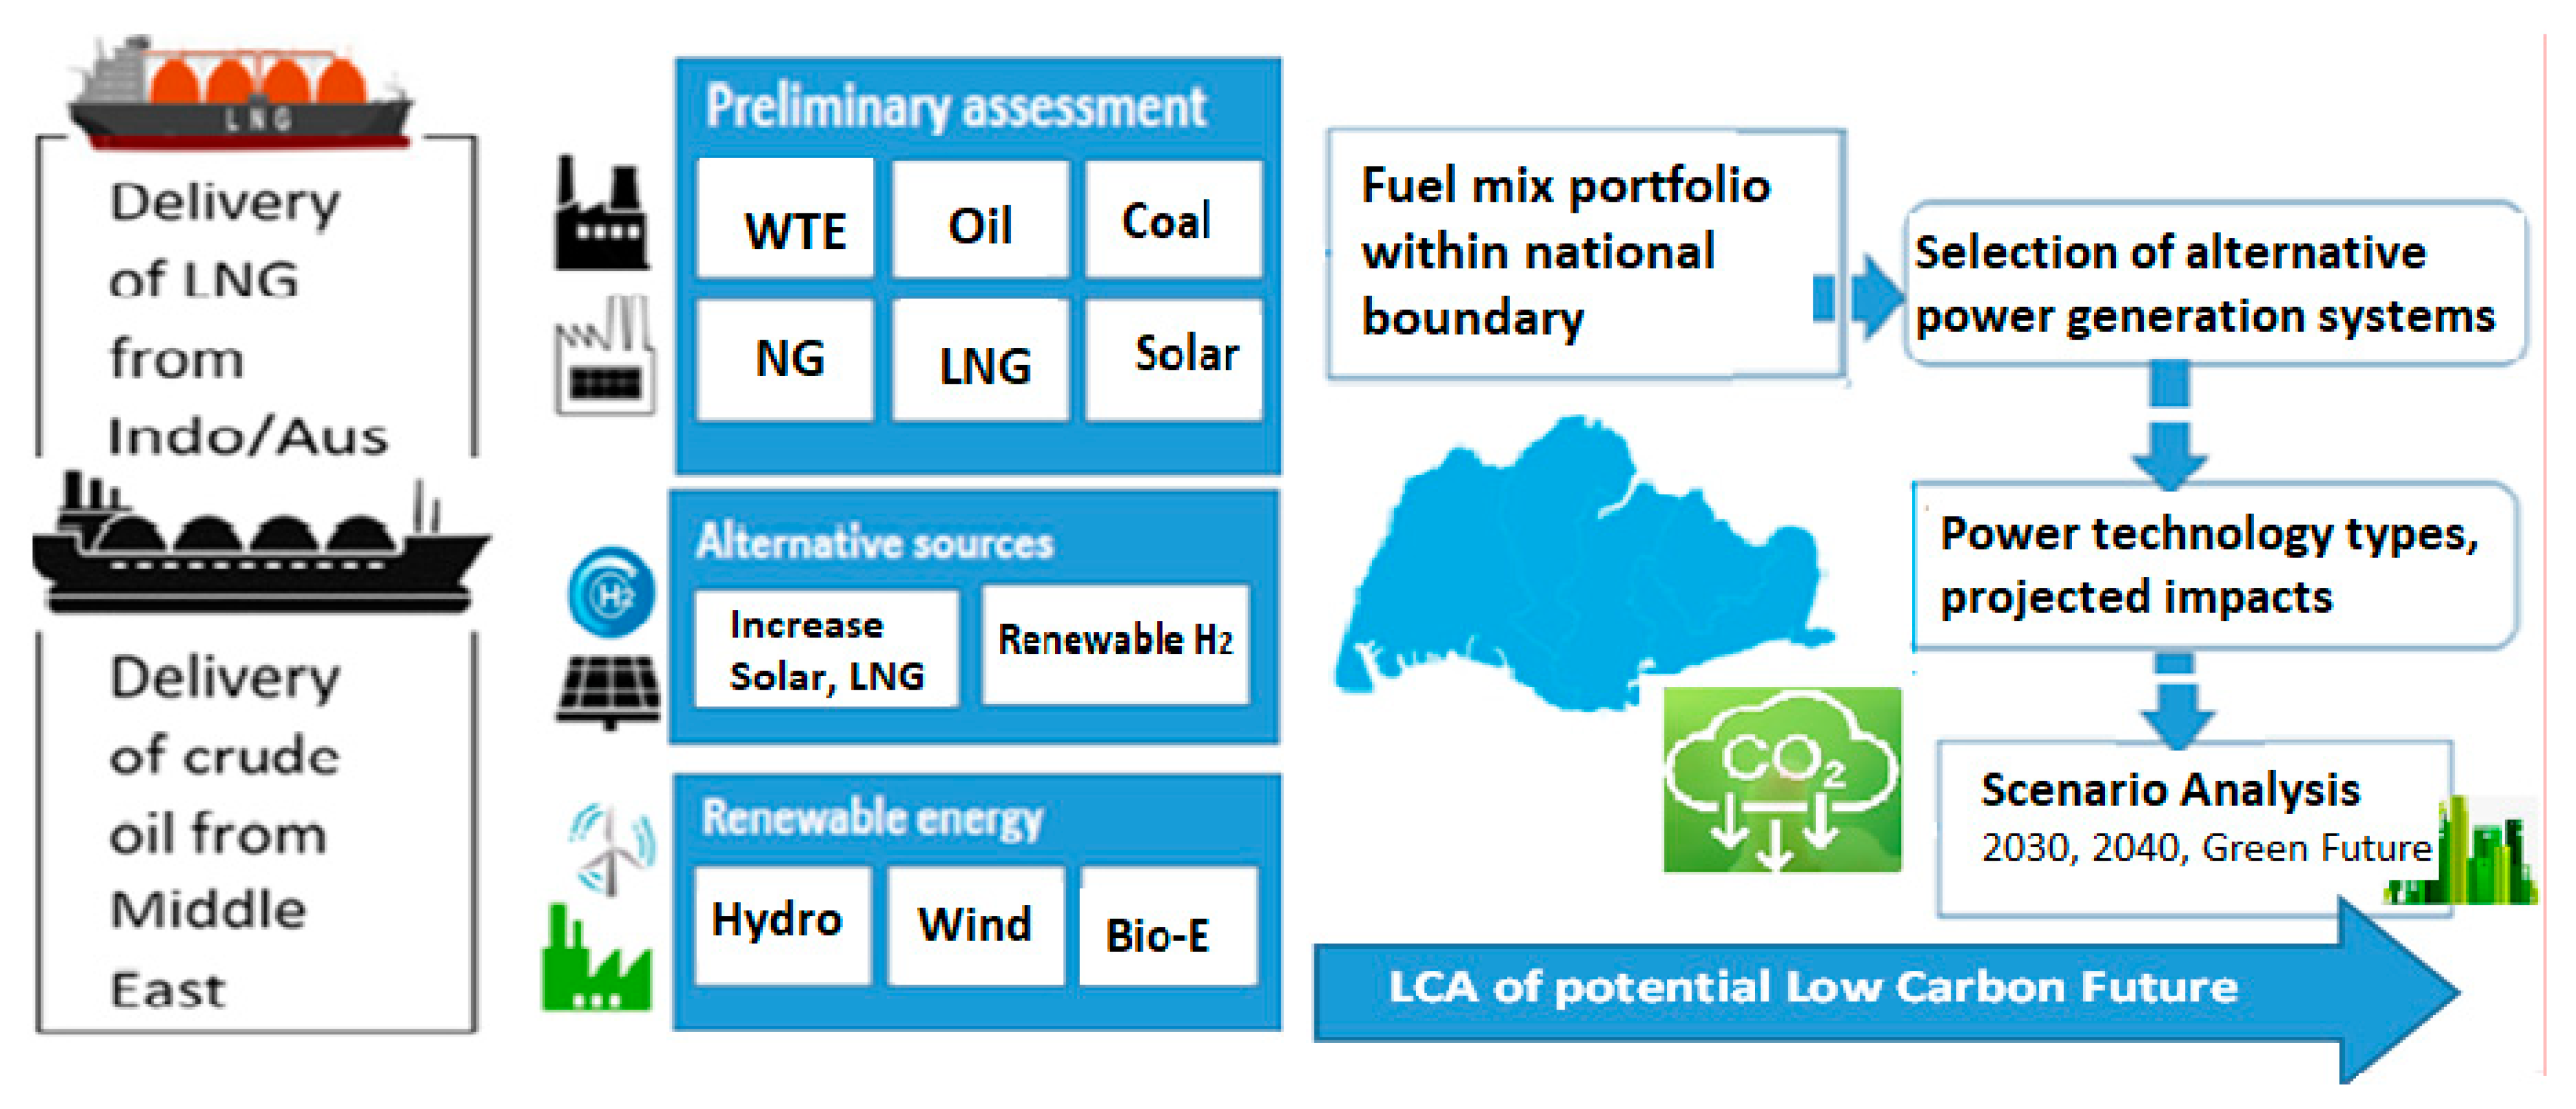
The overall methodology is illustrated in Figure 2.
2.1. Life Cycle Assessment (LCA)
Life cycle assessment (LCA) studies of electricity supply play a central role in various nations and regions, especially in the aim of establishing low-carbon energy scenarios to aid in policy making. At a national level, structural LCA pathways are designed to connect the consumption of fossil resources to the electrical power production network, similar to the case of a previous cradle-to-gate LCA work [2].
2.1.1. Case Study Settings
The LCA investigation is conducted with the fuel mix for the year 2020 projected as 95.2% natural gas, 0.7% petroleum products, 1.2% coal, 1.45% WTE, and 1.45% Solar PV [24]. The stages addressed in the LCA method include the extraction and transportation of fossil fuels and end with the combustion of different fuel types to generate 1 MWh of electrical power. Life cycle inventory (LCI) data and information flow form the foundation of the LCA modeling structure. The material and energy flow associated with each life cycle inventory (LCI) of power generation are collected from existing LCI databases and reports [25,26,27]. Unavailable information is extracted from other articles (e.g., [4,12,28]).
The calorific values of each fuel type are: 24–30 MJ/kg for coal, 43–46 MJ/kg for crude oil, 47–52 MJ/kg for natural gas (NG), and ~53.5 MJ/kg of LNG. Typical coal power plant efficiency ranges from 32% to 42%. Steam turbines can achieve ca. 45% efficiency. The power plant efficiency for the NGCC system is 48.8% [26]. An advanced LNG power plant is reported to achieve an overall efficiency of 55% [29]. The specific amount of fuel types and delivery parameters to Singapore is detailed in Table A1 (Appendix A). The associated gate-to-gate and cradle-to-gate LCI calculations for the year 2020 are compiled in Table A2 and Table A3, respectively.
2.1.2. Annual Scenario Analysis
To further enhance energy security and, at the same time, reduce GHG emissions, a wide range of renewable energy technologies are expected to be employed. Scenario analysis will be performed for the projected diversity of fuel mixes along with increased use of renewable energy. The increase in LNG imports will replace the use of NG in the upcoming years [7,30]. Considered a “cleaner and greener fuel”, plans and programs for LNG port receiving terminals are already ongoing [31,32]. Electricity generated by solar PV is also expected to play a more significant role in the future [33]. Since the rest of fossil fuel resources result in high GHG impacts, they will not be considered; moreover, with plans to proceed to become a zero-waste nation, WTE are also eliminated in future scenarios [34].
- ▪
- Projected fuel mixes for years 2030 and 2040
It was reported that the “largest floating solar farm” would be constructed in Singapore. The solar farm located at Tengeh Reservoir in western Singapore—covering about 45 football fields—is expected to produce a maximum capacity of 60 megawatts of electrical power [35]. In addition, as one of the options to enhance energy security, Singapore aims to be “the premier LNG bunkering hub in Asia” [31]. An estimation of around 60% of LNG will be applied for the fuel mix in 2030 [32]. For the year 2040, a steady increase in solar-powered energy (from 10% to 20%) and LNG (from 60% to 70%) will be expected; with NG remaining as the rest of the fuel mix (10%). The remaining electrical power portfolio is expected to be fueled by NG. Apart from low-carbon initiatives, Singapore plans to be a zero-waste city-nation [34].
- ▪
- Green Future: 100% renewable energy
Achieving long-term targets for GHG reductions will require a transition to energy low-carbon energy supply technologies. An ambitious target of 50% solar power is projected [36], along with renewable hydrogen (20%) [37]. A hypothetical scenario of energy imports to ensure a sustainable low-carbon future is investigated for a “100% renewable energy” scenario. The remaining 30% of electricity is supplied via imports of wind (10%), hydroelectric power (10%), and bioenergy (10%) from neighboring countries [19].
All the scenarios are compiled in Table 1.
The set of environmental impacts from the scenarios (Table 1) is projected for the total energy use for the years 2010, 2020, 2030, and 2040 and a “Green energy future”. Based on the statistics from [24], the predicted annual national electricity consumption for the years 2010–2040 is displayed in Table A4 (Appendix A). The results of TWh/year are generated for energy use in the following sectors: 42.5% industry-related, 36.8% commerce and services, 14.5% households, and 6.20% of energy use in other sectors (e.g., transportation, heating/cooling systems, etc.).
3. Results
3.1. Preliminary Assessment
In the first set of preliminary assessments, five environmental impacts are projected for 1 MWh. Life cycle impact assessment method CML 2001 was applied to generate:
- -
- Global Warming Potential (GWP), measured in kg CO2-eq;
- -
- Acidification Potential (AP), measured in kg SO2-eq;
- -
- Eutrophication Potential (EP), measured in kg phosphate-eq;
- -
- Human Toxicity Potential (HTP), measured in kg DCB-eq.
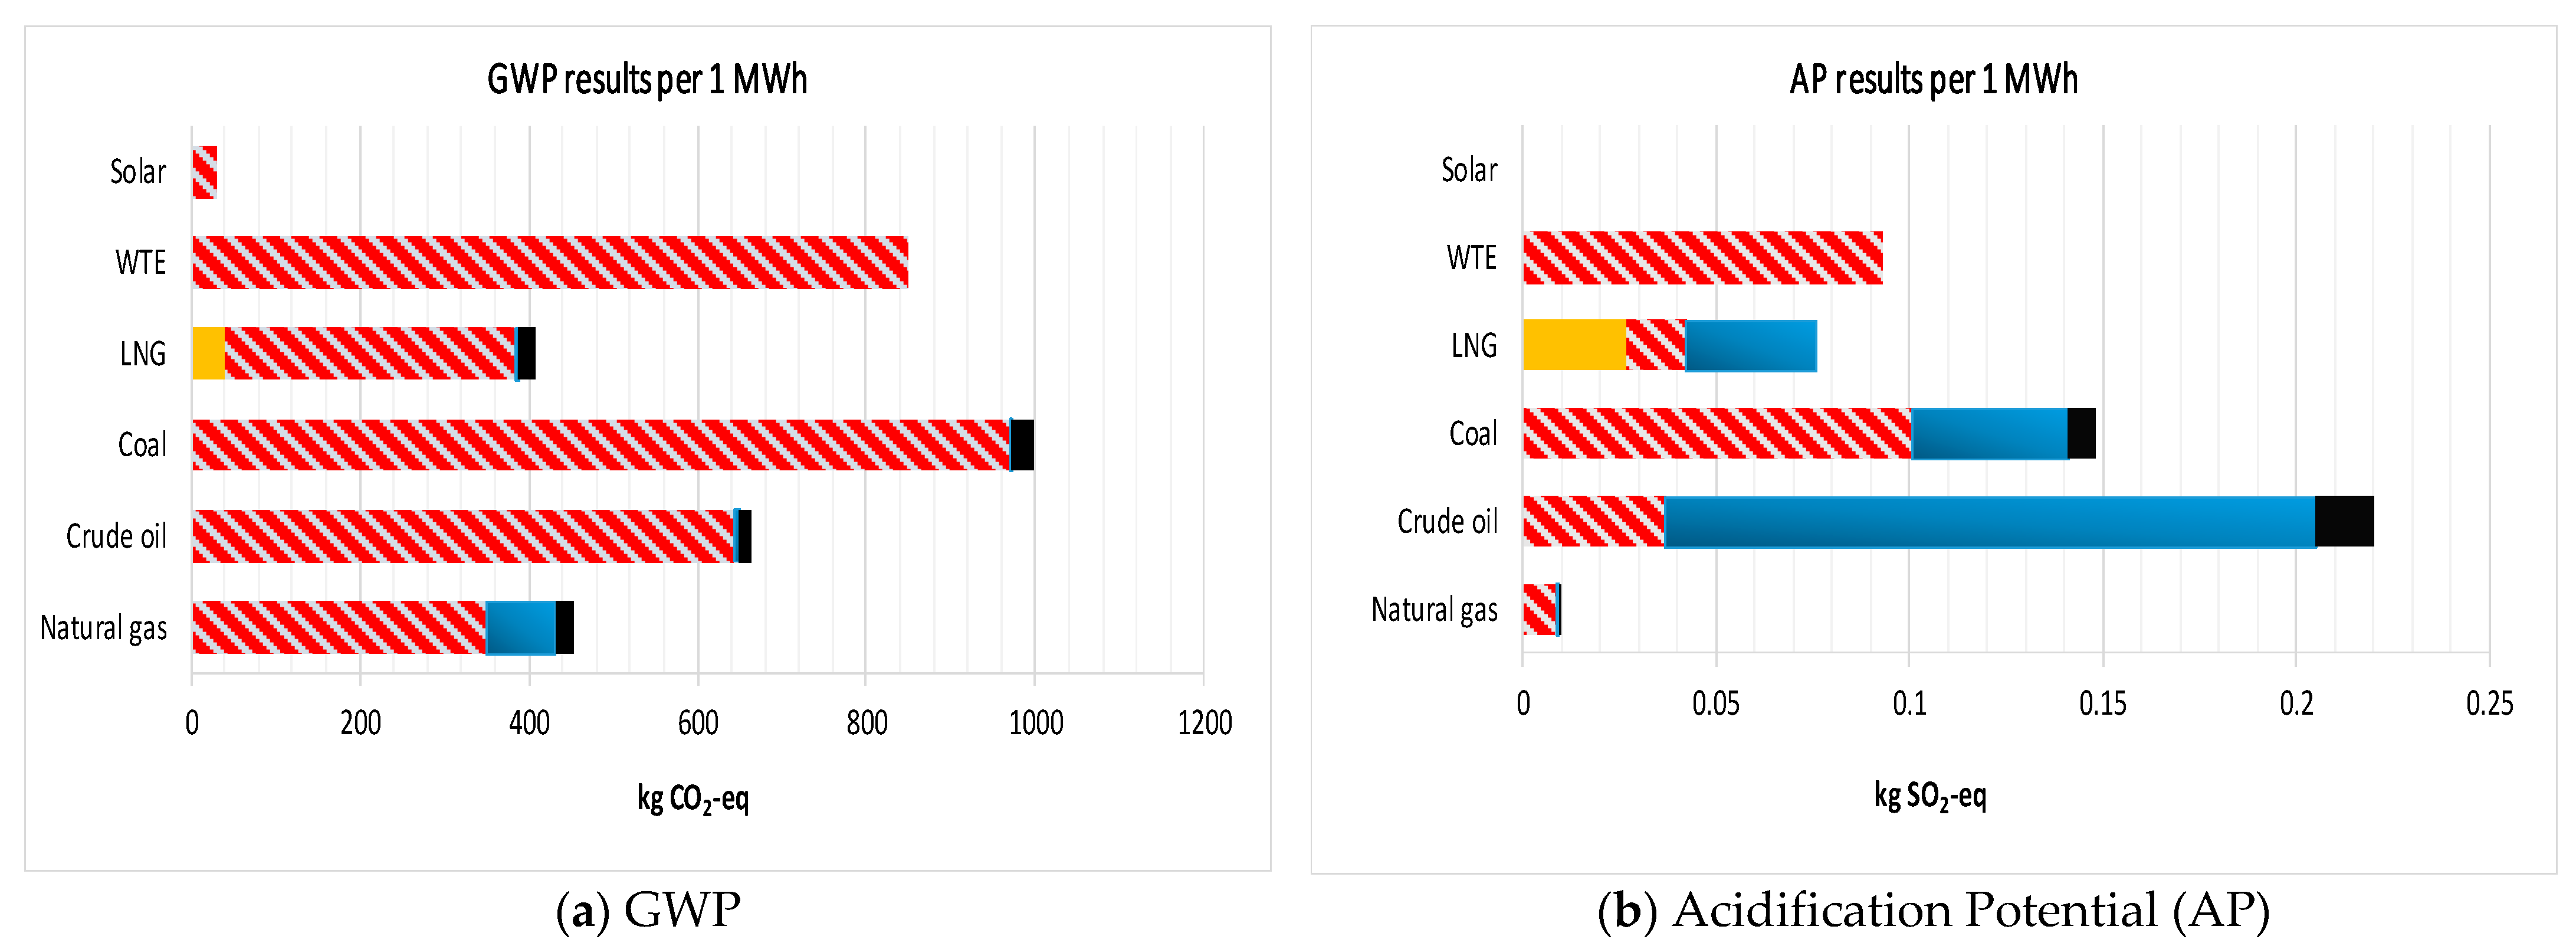
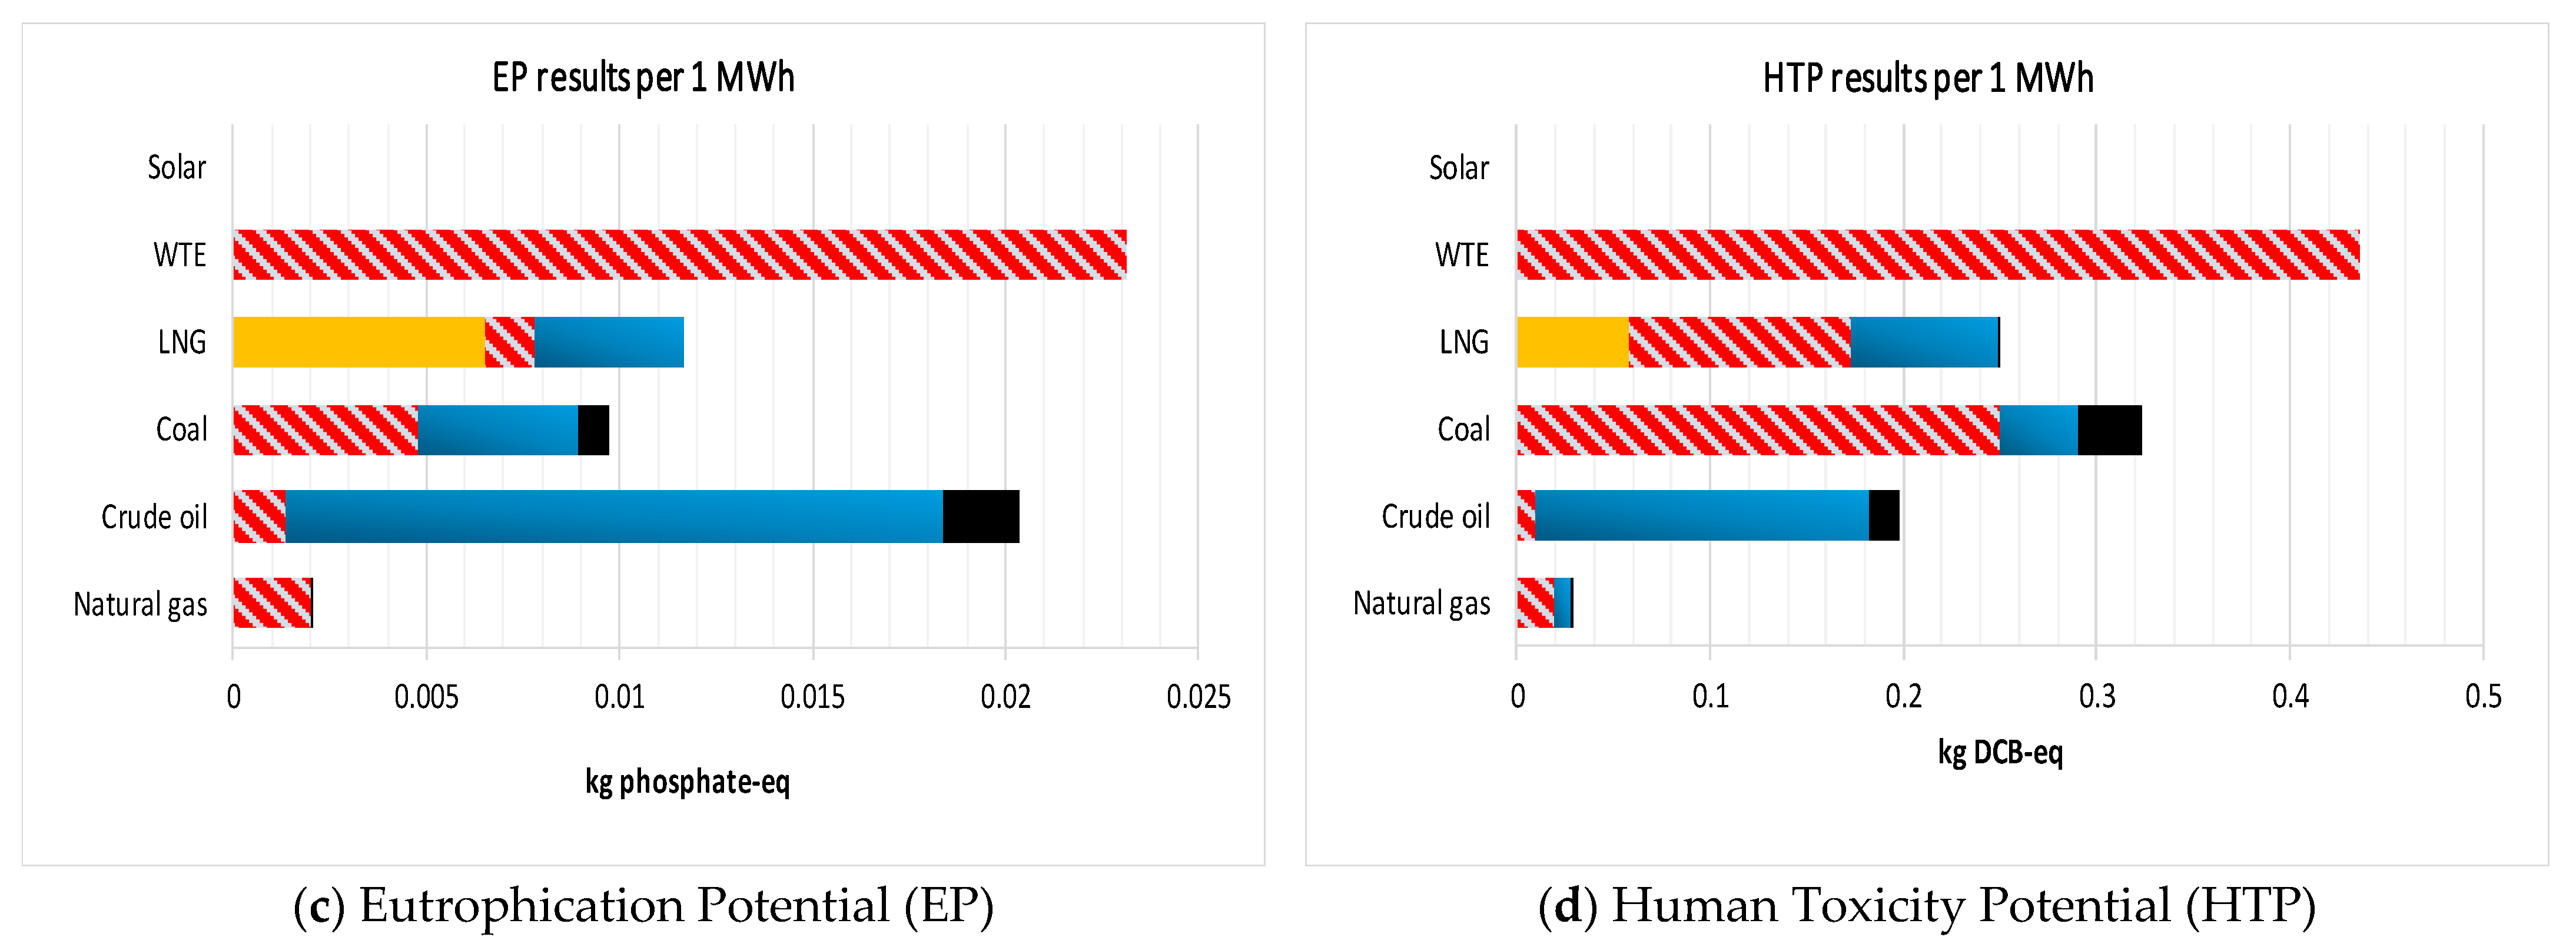
The five environmental impacts of GWP, AP, EP, and HTP for fuel extraction and transportation to combustion at the power plants to generate 1 MWh are reported in Figure 3a–d, respectively.
3.2. Scenario Test Results
3.3. Discussions: Preliminary Environmental Impacts for 1 MWh
From Figure 3a, the GWP impacts for fossil fuels to power combustion are 452, 664, 1000, and 205 for natural gas, crude oil, coal, and LNG kg CO2-eq/MWh, respectively. The GWP results are reasonably comparable to the LCA study carried out by Garcia et al. [38] for NGCC (423 kg CO2-eq/MWh) and coal-based power plants (1021 kg CO2-eq/MWh). However, fuel oil power production was reported by the authors to be higher (912 kg CO2-eq/MWh). It is observed that the GWP for WTE is 850 kg CO2-eq/MWh.
Jeswani and Azapagic [39] reported that an output of 519 net kWh and 452 kg CO2 are generated from CO2/MWh. Alternatively, EPA [40] stated that 2988 pounds of CO2 is released for every 1 MWh generated from the incineration of MSW (i.e., 1355 kg CO2 per MWh). The GWP results for solar is 30 kg CO2-eq/MWh. Fthenakis and Kim [41] claimed that a range of 17–39 kg CO2-eq/MWh can result from solar electric power. Another study carried out by Kim et al. (2019) estimated median values for PV technologies are below 50 kg CO2-eq/MWh.
The types of power combustion that generate the highest AP and EP results are from WTE and coal-based power generation due to NOx and SO2 emissions, as displayed in Figure 3b,c. The coal-fired electrical generation system contributes to up to 68% AP and 50% EP. In other related studies, high emissions of acidic gasses were also reported to be released by both WTE and coal-fired power plants. According to Chen and Christensen [42], emissions of 1.42 kg NOx and 0.45 kg SO2 are emitted to the environment for every 1-ton MSW feed input at an incineration or WTE plant. As for coal-fired combustion, both AP and EP results are mostly contributed by significant emissions, which can be as high as 820 kg/MWh NOx and 940 kg/MWh SO2 [43]. For the case of crude oil, significant results of AP and EP mainly come from ocean tanker transportation (76% AP and 84% EP). Emissions of SO2 and NOx from long-distance ocean transportation are a growing environmental concern [44]. Programs to reinforce environmental regulations for shipping companies will potentially reduce the environmental footprint caused by marine transportation [45,46].
It can be observed from Figure 3d that the HTP impact for WTE is rather significant. Air pollutants from WTE or incinerator facilities can potentially lead to toxic impacts that negatively affect human health, as highlighted by Allsopp et al. [47]; however, various environmental management options to control or reduce such pollutants already exist and can be carried out [48].
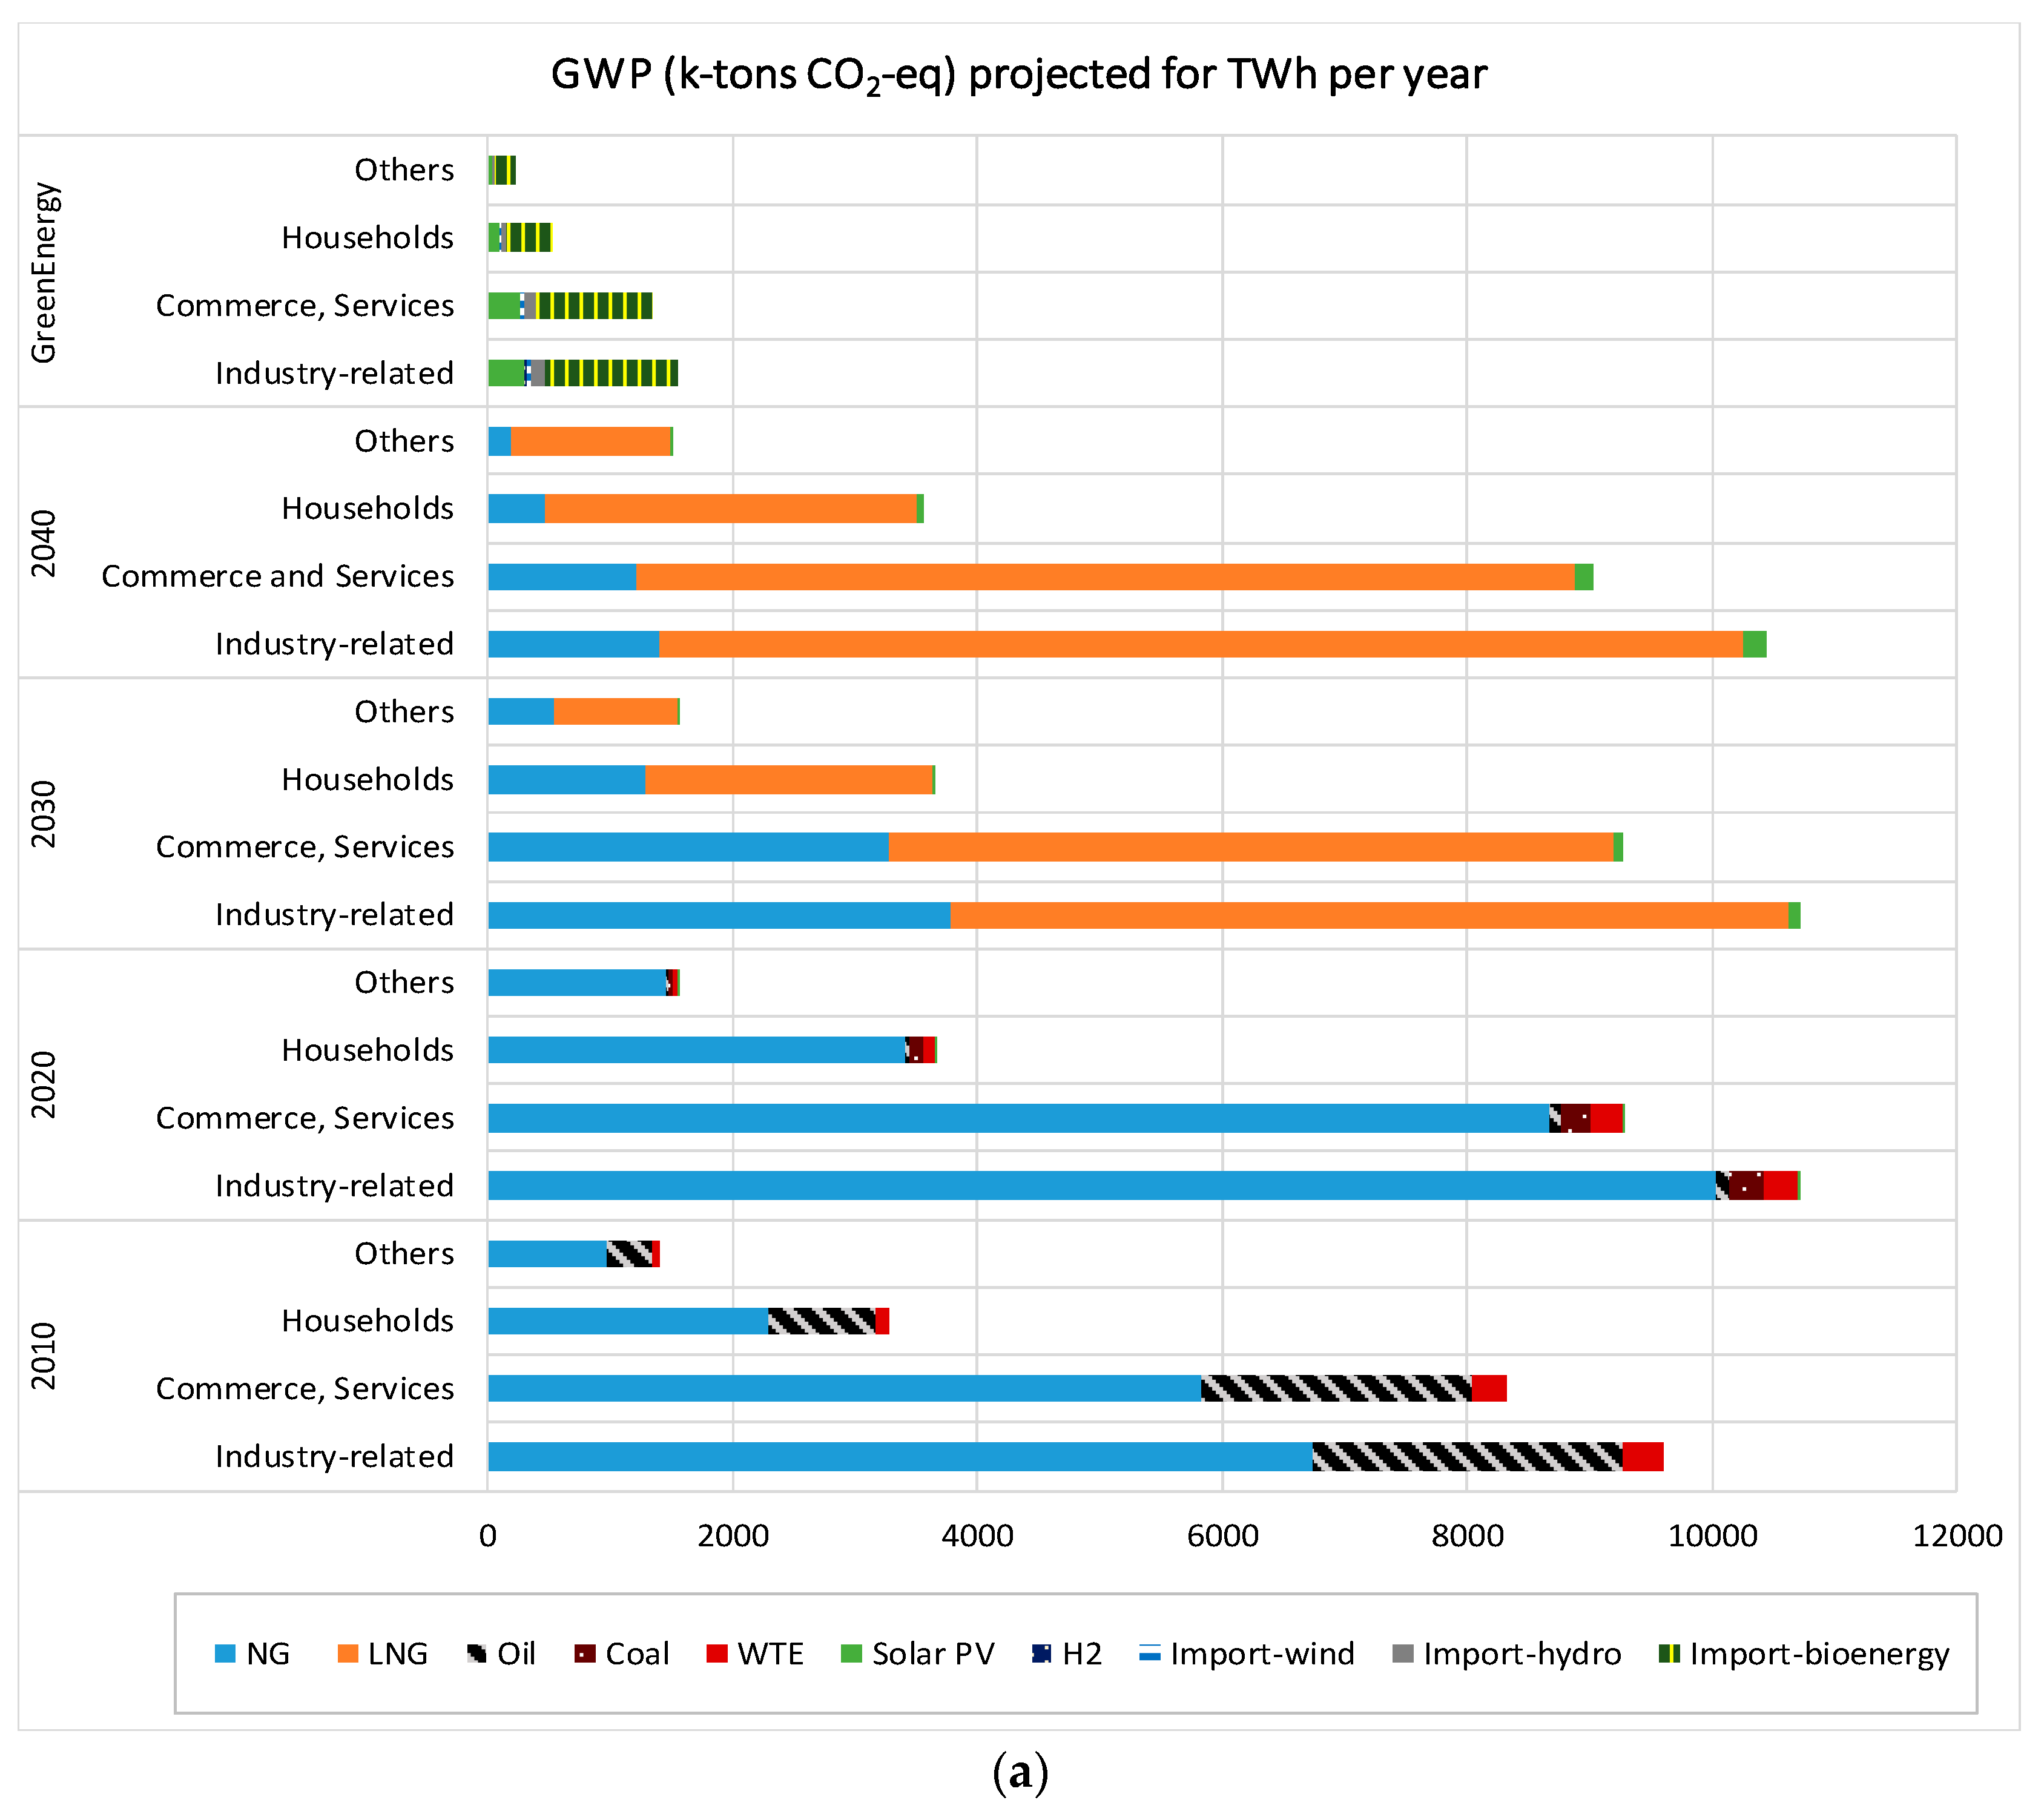
3.4. Projected Scenarios for Annual TWh
Figure 4a shows that all the results demonstrate that the highest GWP emissions are mostly from industry-related energy use—the GWP results dropped from 10,713 ktons/TWh CO2-eq in the year 2020 to 3667 ktons/TWh CO2-eq in the green energy scenario. The results in the years 2020 and 2030 also imply that an increase in LNG use has a significant effect on GWP. The total GWP decreased by merely 8.5% from 2010 to 2020, and 16.5% in 2030 when a fuel mix of 60% LNG, 30% NG, and 10% solar energy is employed. A noteworthy reduction of 85% is achieved from the year 2020 onward when 100% renewable energy is employed. This translates to an amount of ~ 21,540 kton of GHG reduction as the nation transits to a low-carbon future with renewable energy applications.
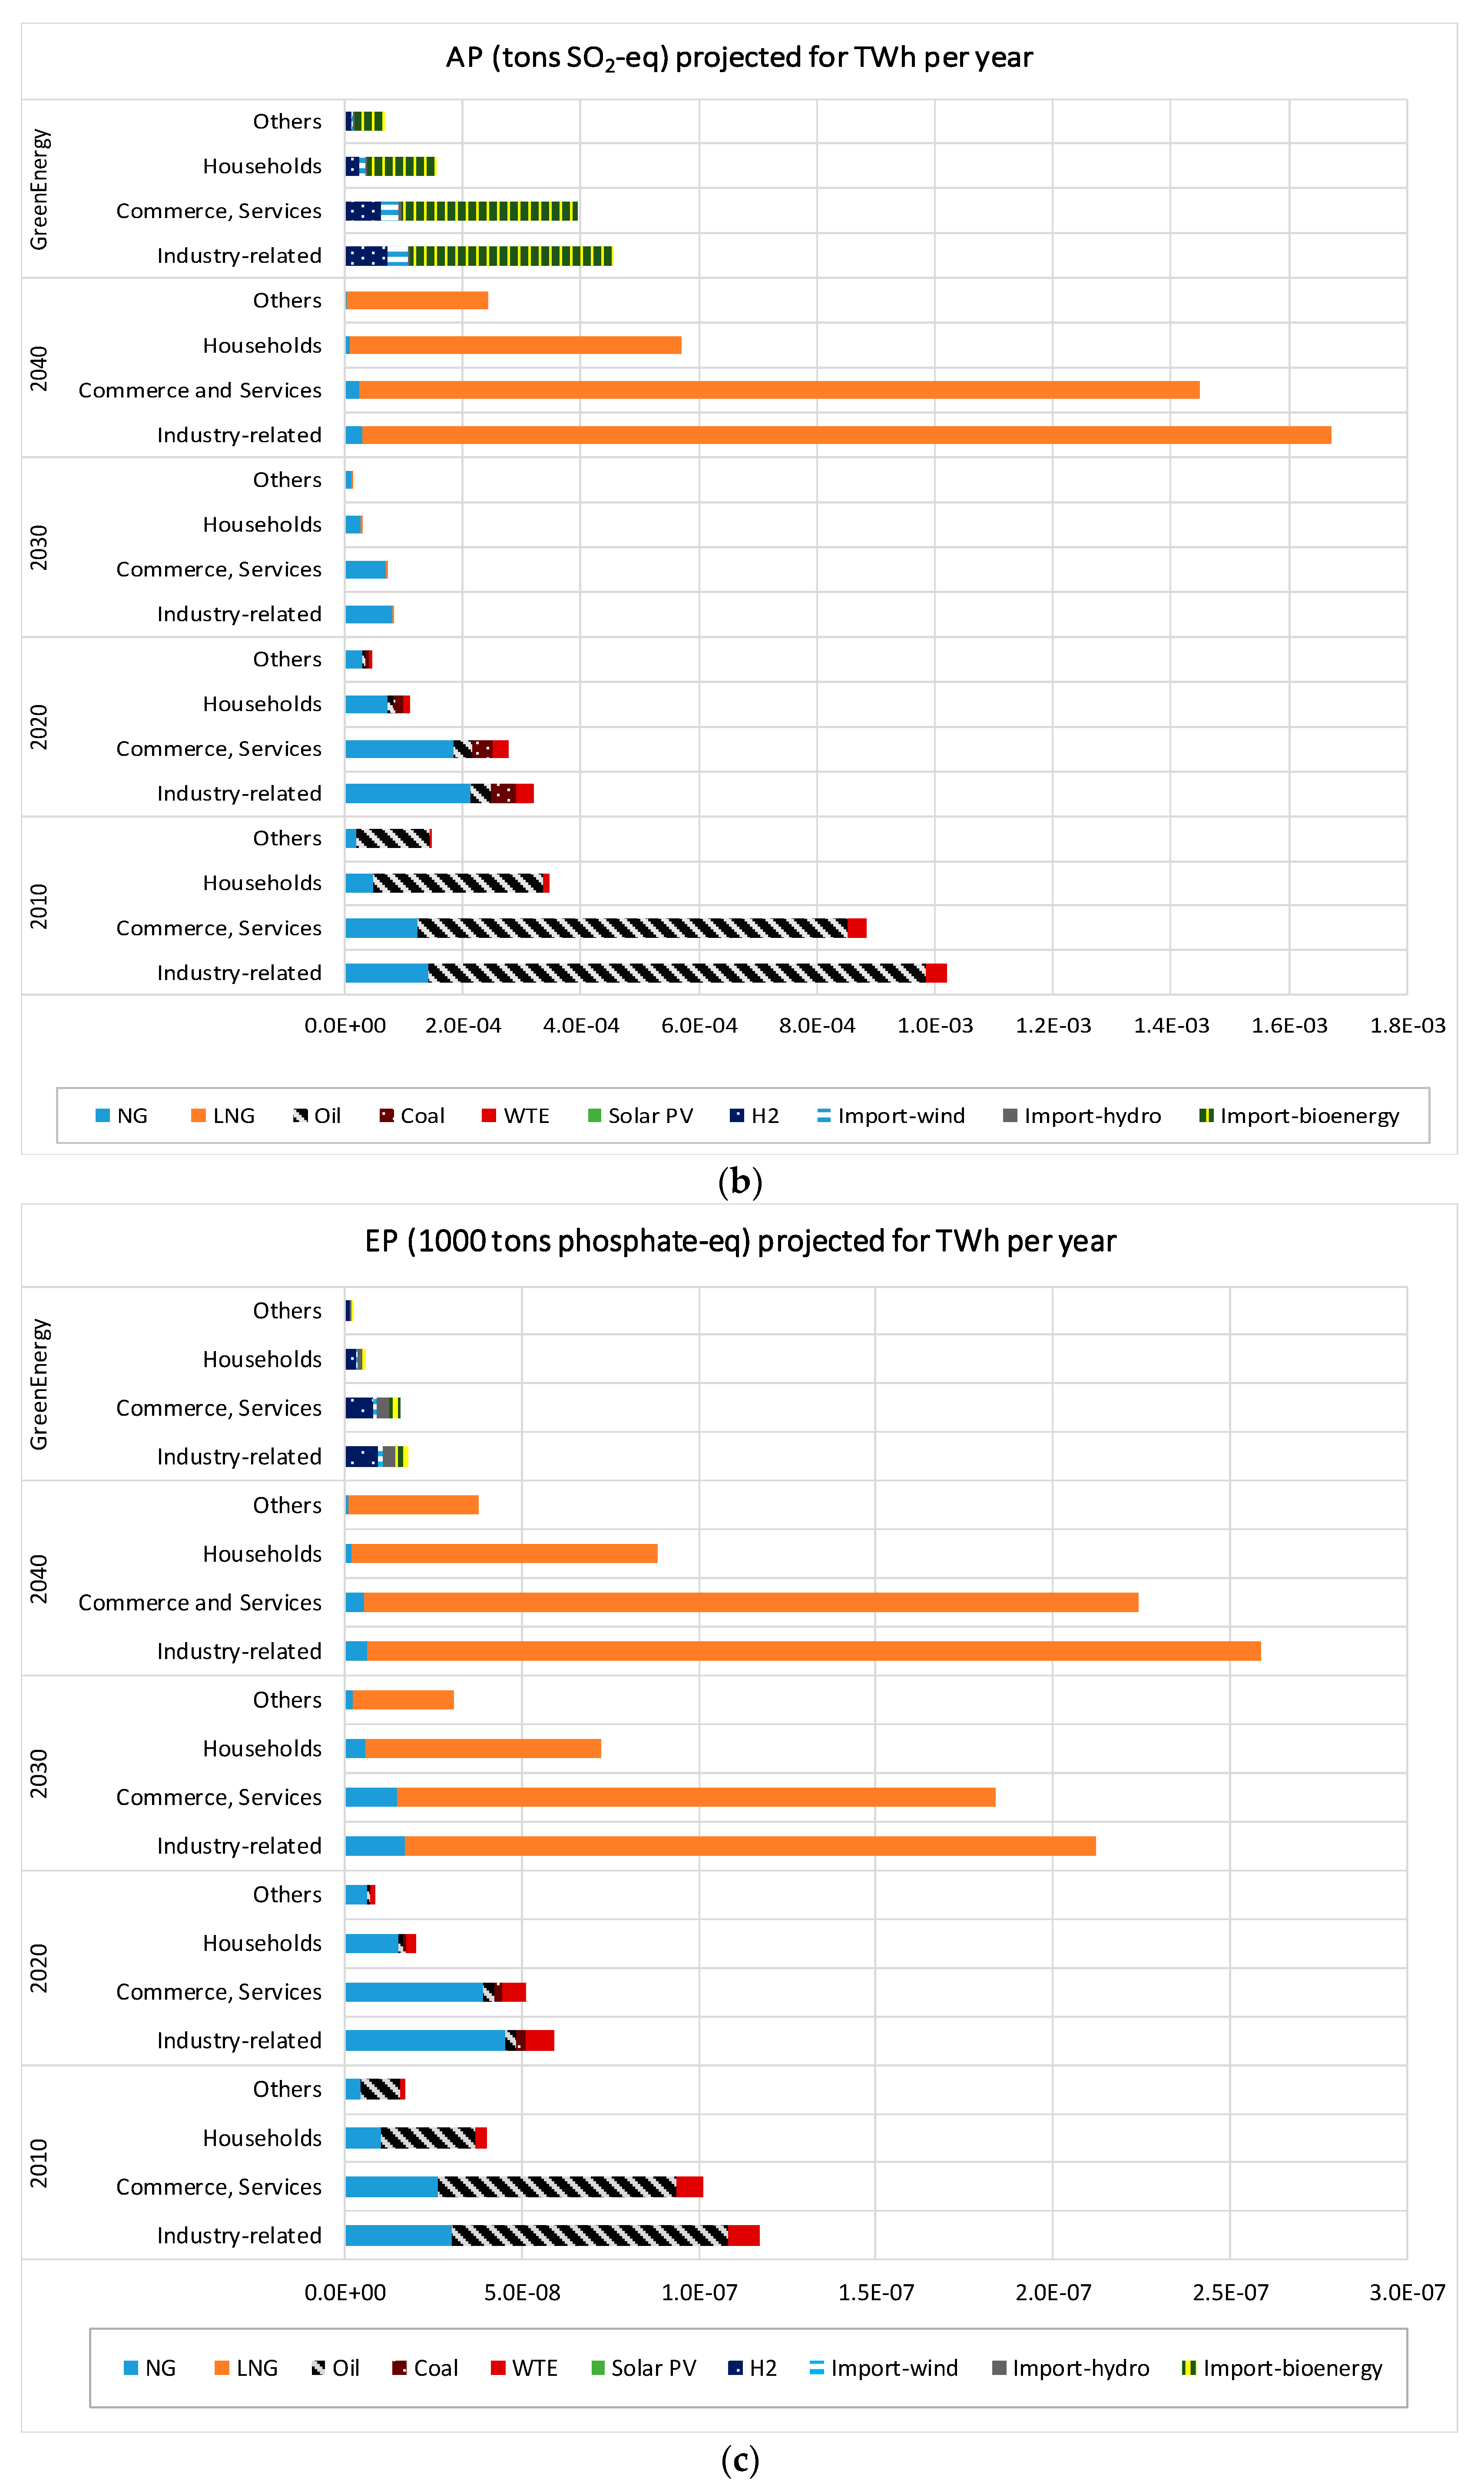
Figure 4b,c show that AP and EP impacts for 2010 are mainly caused by the crude oil production chain—the combined effects of oil extraction, ocean tanker, and combustion. Compared to years 2020 and 2030, higher AP and EP impacts for the year 2040 were observed due to the 70% use of Liquefied Natural Gas (LNG). The total combined AP impacts from the use of LNG for industry, commerce and services, households, and other sectors are 3,864,000 tons SO2-eq in the year 2040, and for EP, 593,328 tons phosphate-eq. The emissions are mostly due to LNG transportation [45,46]. AP results for bioenergy are comparable to the total of AP impacts in the year 2020 for the renewable energy scenario. EP impacts caused by hydropower are not as significant as fossil fuel power generation systems.
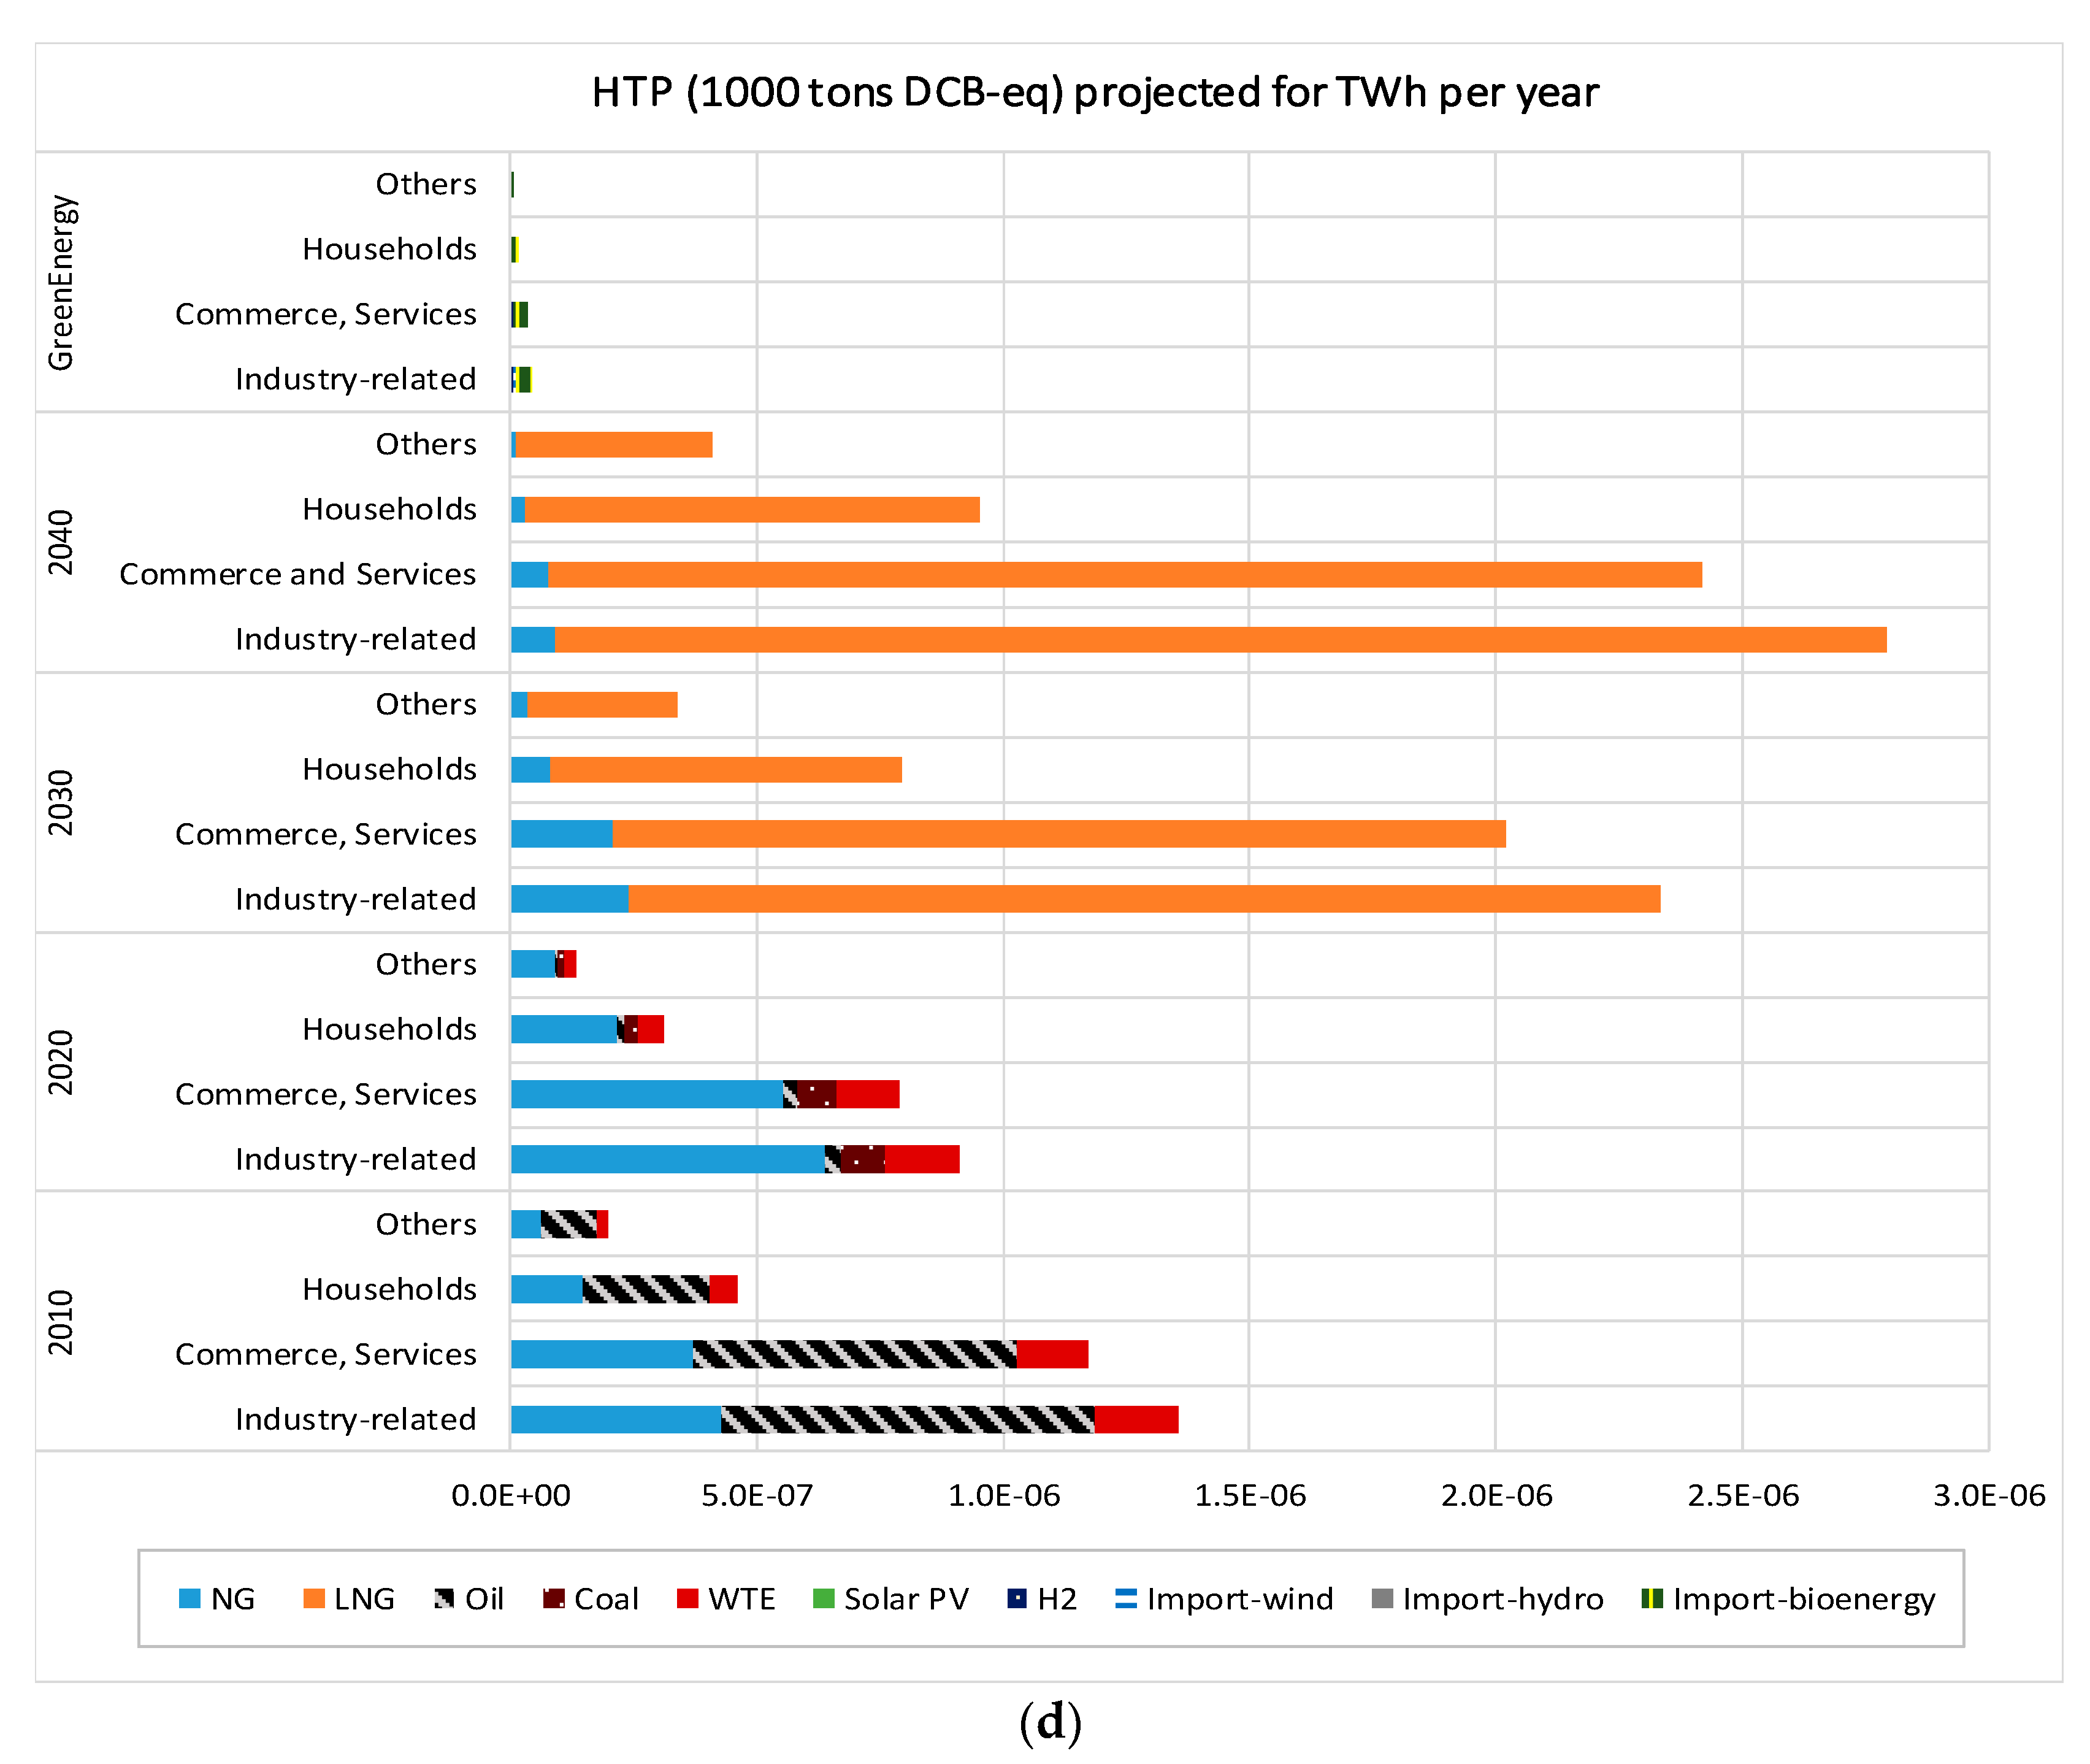
Figure 4d depicts human health impacts caused by pollutants that affect air quality. The highest HTP impacts for electrical generation are basically from WTE and coal (i.e., Figure 3d); however, none of them are included in the fuel portfolio for 2030 and 2040. Considering a large portion of fuel comes from LNG production and its associated processing and transportation, significant HTP impacts are observed. HTP impacts are mostly due to additional power required for the activities involved in LNG regasification [11,12]; the annual amount of HTP resulted in 5,965,058 ton DCB-eq. Apart from HTP impacts, other types of investigations cautioned that safety measures should be carried out for LNG processing facilities [49]. HTP impacts for the case of renewable energy are minimal compared to all other scenarios.
3.5. Further Discussion: Low-Carbon H2 production
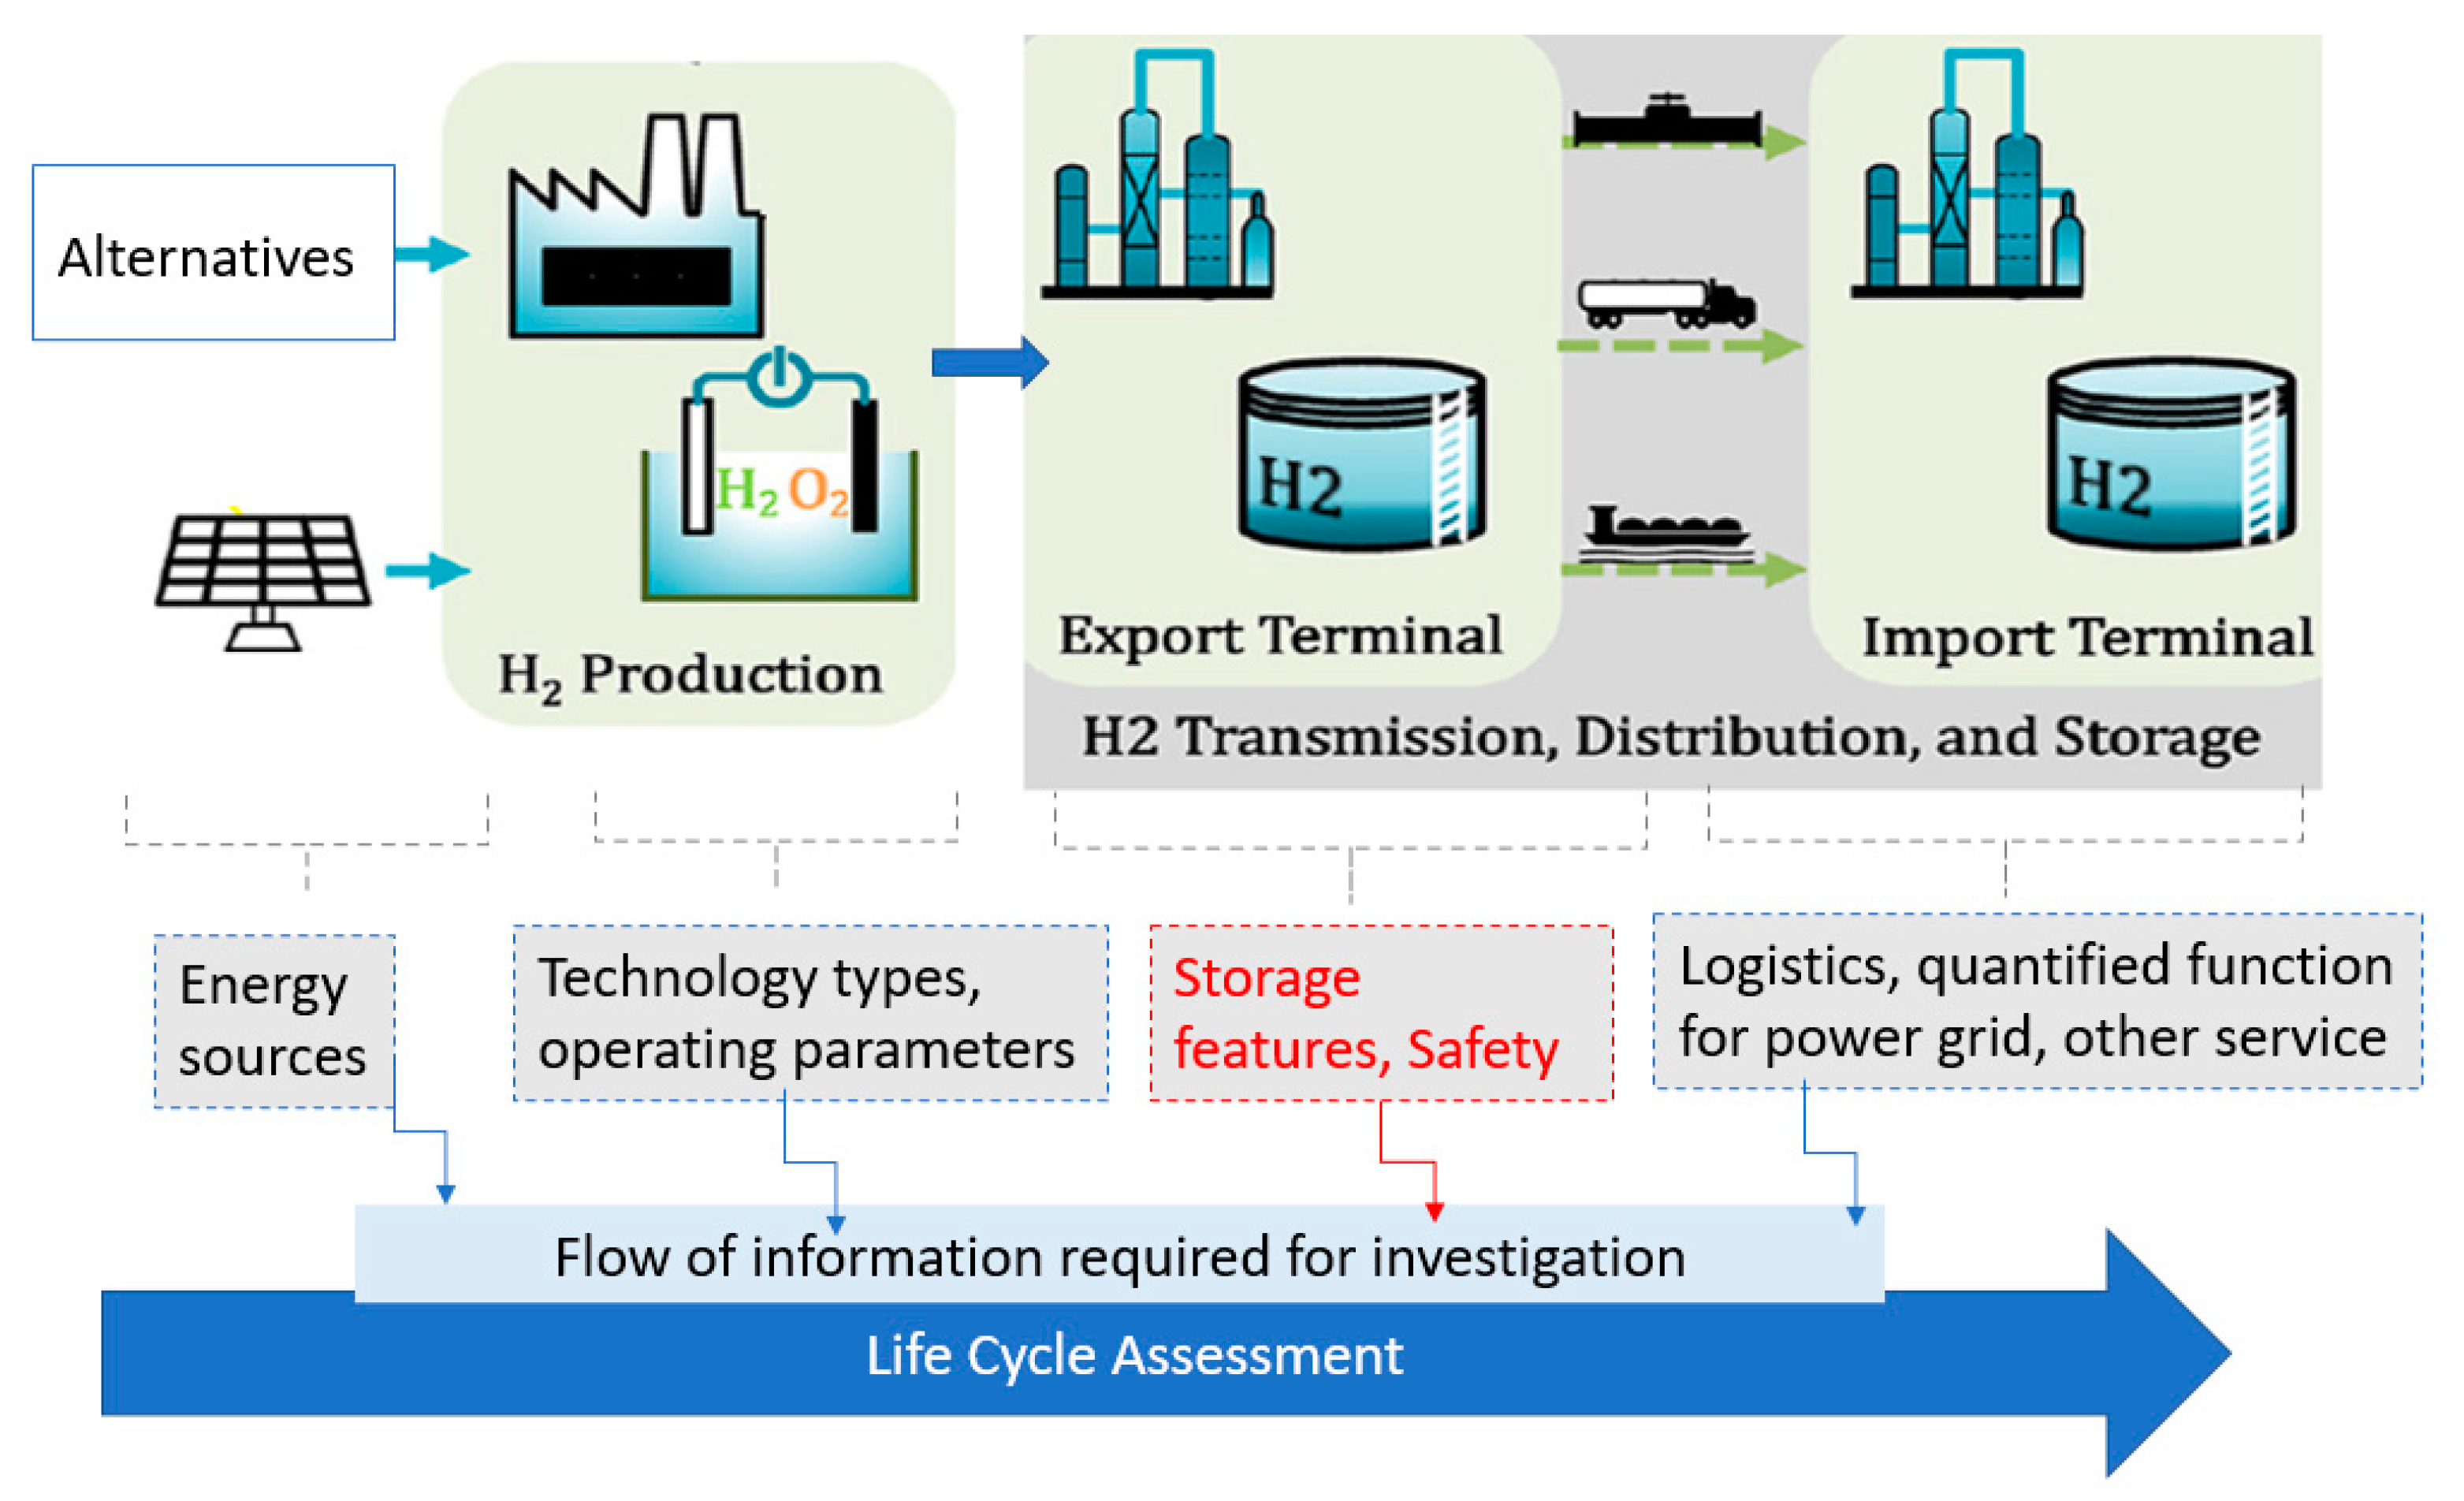
With steadfast ambitions for the decarbonization of energy and fuels, Energy Market Authority announced that the potential of low-carbon hydrogen energy will account for up to 60% of Singapore’s energy supply mix by 2050 [50]. It is suggested that along with the growing interest in implementing low-carbon hydrogen technology applications, extensive LCA investigation will have to be conducted to appropriately include additional safety standard [51,52] indicators. The following should be considered for LCA models of H2 systems: (i) types of energy use; (ii) production methods; (iii) storage (with safety features); (iv) delivery and utilization. An illustration of the details in the system parameters that should be considered for the LCA of hydrogen production is shown in Figure 5.
4. Conclusions and Policy Implications
Sustainability is a key concern for fast-growing industrial activities, and more sustainable energy systems are crucial to modern nations such as Singapore. Many efforts are underway to shed light on different national energy portfolio scenarios and provide guidance on making decisions for policy makers. The aim to achieve long-term targets for GWP reductions and, at the same time, increase energy security prompts countries such as Singapore to diversify fuel supplies. The following highlights are given to aid in policy decision making for national energy sustainability and security:
- ▪
- The highest GWP impacts were from coal and WTE.
- ▪
- With 100% renewable energy employed (‘Green Energy’ future), a noteworthy reduction of 85% GWP was achieved.
- ▪
- An increase in LNG supplies resulted in higher AP and EP impacts due to the transportation of ocean LNG tankers; higher HTP impacts were also observed due to the activities involved in LNG regasification activities.
- ▪
- Future LCA model parameters should include safety indicators for the potential of low-carbon hydrogen application.
Author Contributions
All LCA process models and environmental impacts were performed by Hsien H. Khoo. All authors have read and agreed to the published version of the manuscript.
Funding
This research received no external funding.
Institutional Review Board Statement
Not Applicable.
Informed Consent Statement
Not Applicable.
Data Availability Statement
All data are available in Appendix A section.
Conflicts of Interest
There is no conflict of interest; this work was conducted according to strict scientific, ethical standards.
List of Nomenclature
| AP | Acidification Potential |
| EP | Eutrophication Potential |
| GHG | Greenhouse gas |
| GWP | Global Warming Potential |
| HTTP | Human Toxicity Potential |
| LCI | Life cycle inventory |
| LNG | Liquefied Natural Gas |
| MWh | Megawatt-hour |
| NG | Natural gas |
| PV | Photovoltaic |
| TWh | Terawatt-hour |
| WTE | Waste-to-energy |
Appendix A

Table A1.
From fuel to Singapore.
| Source | Fuel Type (ca. Calorific Value in MJ/kg) | Estimated Amount Required (kg) to Generate 1 MWh | Transportation Type | Brief Description | Distance Travelled (km) |
|---|---|---|---|---|---|
| Indonesia, Malaysia | NG (48 MJ/kg) | 130 | Offshore long-distance gas pipeline | Grissik-Batam-Singapore pipeline | 468 |
| Indonesia | Coal (21.5 MJ/kg) | 295 | Sea travel freight shipment | From Palembang port, South Sumatra, to Jurong terminal | 559.3 |
| Middle East countries | Crude Oil (35.5 MJ/kg) | 178 | Ocean tanker for oil | Saudi Aramco’s Ju’aymah Terminal to Jurong terminal | 6846.8 |
| Australia | LNG (51 MJ/kg) | 124 | Ocean Tanker for LNG | 50% from Barrow Island port, WA, to Jurong Terminal | 3055.8 |
| Indonesia | Ocean tanker for LNG | 50% from Tanjung Emas port, Java, Indonesia to Jurong Terminal | 1266.8 |
Table A2.
Gate-to-gate LCI for 1 MWh.
| Air Emissions (kg) | 2010 | 2020 |
| Carbon dioxide (CO2) | 455.6 | 361 |
| Carbon monoxide (CO) | 0.12 | 0.0303 |
| Methane (CH4) | n.a | 8.7 × 10⁻⁶ |
| Nitrous oxide (N2O) | Negligible | Negligible |
| Nitrogen oxides (NOx) | 1.42 | 0.0168 |
| Sulfur dioxide (SO2) | 5.18 | 0.0021 |
| PM | 0.068 | 0.0213 |
| NMVOC | n.a | 0.00021 |
| VOC | 0.033 | 0.0007 |
Table A3.
Cradle-to-gate LCI for 1 MWh.
| Air Emissions (kg) | 2010 | 2020 |
| Carbon dioxide (CO2) | 568.3 | 390.6 |
| Carbon monoxide (CO) | 0.19 | 0.0304 |
| Methane (CH4) | n.a | 0.774 |
| Nitrous oxide (N2O) | 0.06 | 0.000437 |
| Nitrogen oxides (NOx) | 1.965 | 0.0172 |
| Sulfur dioxide (SO2) | 2.975 | 0.00289 |
| PM | 0.079 | 0.0218 |
| NMVOC | n.a | 0.000349 |
| VOC | 0.065 | 0.000485 |
Table A4.
Annual TWh.
| Year | TWh/Year |
|---|---|
| 2010 | 45 |
| 2020 | 55 |
| 2030 | 66 |
| 2040 | 73 |
| Green Energy Future | 79 |
References
- Burchart-Korol, D.; Pustejovska, P.; Blaut, A.; Jursova, S.; Korol, J. Comparative life cycle assessment of current and future electricity generation systems in the Czech Republic and Poland. Intl. J. Life Cycle Assess. 2018, 23, 2165–2177. [Google Scholar] [CrossRef] [Green Version]
- Tan, R.B.H.; Wijaya, D.; Khoo, H.H. LCI analysis of fuels and electricity generation in Singapore. Energy 2010, 35, 4910–4916. [Google Scholar] [CrossRef]
- Chan, J.K.H. The ethics of working with wicked urban waste problems: The case of Singapore’s Semakau Landfill. Landscape Urban Plan 2016, 154, 123–131. [Google Scholar] [CrossRef]
- Luo, W.; Khoo, Y.S.; Kumar, A.; Low, J.S.C.; Li, Y.; Tan, Y.S.; Wang, Y.; Aberle, A.G.; Ramakrishna, S. A comparative life-cycle assessment of photovoltaic electricity generation in Singapore by multicrystalline silicon technologies. Solar Energ. Mat. Solar Cells 2018, 174, 157–162. [Google Scholar] [CrossRef]
- Ludin, N.A.; Mustafa, N.I.; Hanafiah, M.M.; Ibrahim, M.A.; Teridi, M.A.M.; Sepeai, S.; Zaharim, A.; Sopian, K. Prospects of life cycle assessment of renewable energy from solar photovoltaic technologies: A review. Renew. Sustain. Energ. Rev. 2018, 96, 11–28. [Google Scholar] [CrossRef]
- Luther, J.; Reindl, T. Solar Photovoltaic (PV) Roadmap for Singapore; Report prepared for Singapore Economic Development Board (EDB) and Energy Market Authority (EMA); NCCS (National Climate Change Secretariat): Singapore, 2013. [Google Scholar]
- SBR (Singapore Business Review). LNG Imports to Triple and Displace Pipeline Gas within 10 Years. 2019. Available online: https://news.nestia.com/detail/LNG-imports-to-triple-and-displace-pipeline-gas-within-10-years/2953745 (accessed on 30 March 2022).
- CNA (Channel News Asia). Stepping on the Gas to Keep Singapore’s Lights Burning. 2018. Available online: https://www.channelnewsasia.com/news/cnainsider/lng-natural-gas-electricity-singapore-energy-security-tank-10088910 (accessed on 3 March 2022).
- Gorgon LNG Project. 2020. Available online: https://www.hydrocarbons-technology.com/projects/gorgon-lng-project/ (accessed on 15 January 2022).
- Antaranews, Indonesia to Export 16 Cargoes of LNG to Singapore per Year. 2019. Available online: https://en.antaranews.com/news/122550/indonesia-to-export-16-cargoes-of-lng-to-singapore-per-year (accessed on 3 March 2022).
- Mehrpooya, M.; Hossieni, M.; Vatani, A. Novel LNG-based integrated process configuration alternatives for coproduction of LNG and NGL. Ind. Eng. Chem. Res. 2014, 53, 17705–17721. [Google Scholar] [CrossRef]
- Zhang, J.; Meerman, H.; Benders, R.; Faaij, A. Comprehensive review of current natural gas liquefaction processes on technical and economic performance. Appl. Therm. Eng. 2020, 166, 1–16. [Google Scholar] [CrossRef]
- Raj, R.; Suman, R.; Ghandehariun, S.; Kumar, A.; Tiwari, M.K. A techno-economic assessment of the liquefied natural gas (LNG) production facilities in Western Canada. Sustain. Energ. Technol. Assess. 2016, 18, 140–152. [Google Scholar] [CrossRef]
- Khan, M.S.; Karimi, I.A.; Lee, M. Evolution and optimization of the dual mixed refrigerant process of natural gas liquefaction. Appl. Therm. Eng. 2016, 96, 320–329. [Google Scholar] [CrossRef]
- Blagin, E.V.; Uglanov, D.A.; Dovgyallo, A.I. About LNG energy utilization efficiency estimation. Procedia Eng. 2016, 152, 209–218. [Google Scholar] [CrossRef]
- Chan, S.H.; Stempien, J.P.; Ding, O.L.; Su, P.-C.; Ho, H.K. Fuel cell and hydrogen technologies research, development and demonstration activities in Singapore–An update. Int. J. Hydro. Energ. 2016, 41, 13869–13878. [Google Scholar] [CrossRef]
- Manatura, K.; Lu, J.H.; Wu, K.T.; Hsu, H.T. Exergy analysis on torrefied rice husk pellet in fluidized bed gasification. Appl Thermal Eng. 2017, 111, 1016–1024. [Google Scholar] [CrossRef]
- Tillman, D.A. Biomass co-firing: The technology, the experience, the combustion consequences. Biomass Bioenerg. 2000, 19, 365–384. [Google Scholar] [CrossRef]
- Shafie, S.M.; Mahlia, T.M.I.; Masjuki, H.H.; Rismanchi, B. Life cycle assessment (LCA) of electricity generation from rice husk in Malaysia. Energ. Proced. 2012, 14, 499–502. [Google Scholar] [CrossRef] [Green Version]
- Trussart, S.; Messier, D.; Roquet, V.; Aki, S. Hydropower projects: A review of most effective mitigation measures. Energ. Pol. 2002, 30, 1251–1259. [Google Scholar] [CrossRef]
- Hanafi, J.; Riman, A. Life Cycle Assessment of a Mini Hydro Power Plant in Indonesia: A Case Study in Karai River. Procedia CIRP 2015, 29, 444–449. [Google Scholar] [CrossRef]
- Geller, M.T.B.; de Moura Meneses, A.A. Life Cycle Assessment of a Small Hydropower Plant in the Brazilian Amazon. J. Sust. Devp. Energ. Water Environ. Sys. 2016, 4, 379–391. [Google Scholar] [CrossRef] [Green Version]
- Wagner, H.J.; Baack, C.; Eickelkamp, T.; Epe, A.; Lohmann, J.; Troy, S. Life cycle assessment of the offshore wind farm alpha ventus. Energy 2011, 36, 2459–2464. [Google Scholar] [CrossRef]
- EMA (Energy Market Authority). 2020. Available online: https://www.ema.gov.sg/Singapore_Energy_Statistics.aspx (accessed on 5 February 2022).
- Ecoinvent. Life Cycle Inventory Database; Zurich, Switzerland. 2020. Available online: https://www.ecoinvent.org/ (accessed on 15 February 2022).
- Spath, P.L.; Mann, M.K. Life Cycle Assessment of a Natural Gas Combined-Cycle Power Generation System; Report No. NREL/TP-570-27715; National Renewable Energy Laboratory: Golden, CO, USA, 2000. [Google Scholar]
- Spath, P.L.; Mann, M.K.; Kerr, D.R. Life Cycle Assessment of Coal-fired Power Production; Report No. NREL/TP-570-25119; National Renewable Energy Laboratory: Golden, CO, USA, 1999. [Google Scholar]
- Jaramillo, P.; Griffin, W.M.; Matthews, H.S. Comparative Life-Cycle Air Emissions of Coal, Domestic Natural Gas, LNG, and SNG for Electricity Generation. Environ. Sci. Technol. 2007, 41, 6290–6296. [Google Scholar] [CrossRef]
- Gómez, M.R.; Garcia, R.F.; Carril, J.C.; Gómez, J.R. High efficiency power plant with liquefied natural gas cold energy utilization. J. Energ. Inst. 2014, 87, 59–68. [Google Scholar] [CrossRef]
- Chambers, S. Singapore Says LNG Is the Only Viable Fuel Solution, Readies Incentives; Asia Shipping Media Pte. Ltd.: Singapore, 2019. [Google Scholar]
- Prakash, J. Singapore’s LNG Drive Gets a Boost. 2020. Available online: https://www.gasworld.com/singapores-lng-drive-gets-a-boost/2018356.article (accessed on 28 May 2022).
- Yep, E. Analysis: LNG to Surpass Piped Gas in Singapore’s Future Energy Mix. SP Global. 2019. Available online: https://www.spglobal.com/platts/en/market-insights/latest-news/natural-gas/120619-lng-to-surpass-piped-gas-in-singapores-future-energy-mix (accessed on 1 March 2022).
- Reuters, Singapore Goes Big on Solar Power to Fight Climate Change. 2019. Available online: https://www.scmp.com/news/asia/southeast-asia/article/3035312/singapore-looks-sun-it-aims-expand-solar-power-use-2030 (accessed on 29 March 2022).
- MEWR (Ministry of the Environment and Water Resources). MEWR’s Inaugural Masterplan Charts Singapore’s Path towards a Zero Waste Nation. 2020. Available online: https://www.towardszerowaste.gov.sg/zero-waste-masterplan/ (accessed on 30 April 2022).
- Lim, J. One of World’s Largest Floating Solar Farms Coming Up in Tuas. 2020. Available online: https://www.straitstimes.com/singapore/environment/one-of-worlds-largest-floating-solar-farms-coming-up-in-tuas (accessed on 29 May 2022).
- Tan, A. Singapore Can Tap More Solar Power by 2050. The Straits Times. 2014. Available online: https://www.straitstimes.com/singapore/singapore-can-tap-more-solar-power-by-2050 (accessed on 30 May 2022).
- Tan, J.H.W. Hydrogen a More Sustainable Bet for S’pore’s Energy Future. IPS Commons. 2017. Available online: https://www.ipscommons.sg/hydrogen-a-more-sustainable-bet-for-spores-energy-future/ (accessed on 30 May 2022).
- Garcia, R.; Marques, P.; Freire, F. Life-cycle assessment of electricity in Portugal. Appl Energ. 2014, 134, 563–572. [Google Scholar] [CrossRef]
- Jeswani, H.K.; Azapagic, A. Assessing the environmental sustainability of energy recovery from municipal solid waste in the UK. Waste Manage. 2016, 50, 346–363. [Google Scholar] [CrossRef] [PubMed]
- EPA. Air Emissions from MSW Combustion Facilities. 2019. Available online: https://www.epa.gov/energy (accessed on 16 January 2022).
- Fthenakis, V.M.; Kim, H.C. Greenhouse-gas emissions from solar electric- and nuclear power: A life-cycle study. Energ. Pol. 2007, 35, 2549–2557. [Google Scholar] [CrossRef]
- Chen, D.; Christensen, T.H. Life-cycle assessment (EASEWASTE) of two municipal solid waste incineration technologies in China. Waste Manage. Res. 2010, 28, 508–519. [Google Scholar] [CrossRef] [PubMed]
- Wang, C.; Mu, D. An LCA study of an electricity coal supply chain. J. Ind. Eng. Manage. 2014, 7, 311–335. [Google Scholar] [CrossRef]
- Seddiek, I.S.; Elgohary, M.M. Eco-friendly selection of ship emissions reduction strategies with emphasis on SOx and NOx emissions. Int. J. Naval Architec. Ocean Eng. 2014, 6, 737–748. [Google Scholar] [CrossRef] [Green Version]
- Lister, J.; Poulsen, R.T.; Ponte, S. Orchestrating transnational environmental governance in maritime shipping. Glo. Environ. Change. 2015, 34, 185–195. [Google Scholar] [CrossRef] [Green Version]
- Halff, A.; Younes, L.; Boersma, T. The likely implications of the new IMO standards on the shipping industry. Energ. Pol. 2019, 126, 277–286. [Google Scholar] [CrossRef]
- Allsopp, M.; Costner, P.; Johnston, P. Incineration and human health. Environ. Sci. Pollut. Res. 2001, 8, 141–145. [Google Scholar] [CrossRef]
- Vehlow, J. Air pollution control systems in WtE units: An overview. Waste Manage. 2015, 37, 58–74. [Google Scholar] [CrossRef]
- Panwar, N.L.; Kaushik, S.C.; Kothari, S. Role of renewable energy sources in environmental protection: A review. Renew. Sustain. Energ. Rev. 2011, 15, 1513–1524. [Google Scholar] [CrossRef]
- KPMG Services. Taking Singapore forward as a Regional Green Hydrogen Hub. 2022. Available online: https://home.kpmg/sg/en/home/media/press-contributions/2022/07/taking-singapore-forward-as-a-regional-green-hydrogen-hub.html (accessed on 30 April 2022).
- Pasman, H.J.; Rogers, W.J. Safety challenges in view of the upcoming hydrogen economy: An overview. J. Loss. Prev. Process. Ind. 2010, 23, 697–704. [Google Scholar] [CrossRef]
- Aprea, J.L. Quality specification and safety in hydrogen production, commercialization and utilization. Int. J. H2 Energ. 2014, 39, 8604–8608. [Google Scholar] [CrossRef]
- Hong, X.; Thaore, V.B.; Karimi, I.A.; Farooq, S.; Wang, X.; Usadi, A.K.; Chapman, B.R.; Johnsonc, R.A. Techno-enviro-economic analyses of hydrogen supply chains with an ASEAN case study. Int. J. H2 Energ. 2021, 46, 32914–32928. [Google Scholar] [CrossRef]
Figure 1.
Expected increase in use of LNG [7].
Figure 1.
Expected increase in use of LNG [7].

Figure 2.
Overall methodology.

Figure 3.
Preliminary assessment: environmental impacts.


Figure 4.
(a) Projected GWP impacts for TWh/year. (b) Projected AP impacts for TWh/year. (c) Projected EP impacts for TWh/year. (d) Projected HTP impacts for TWh/year.
Figure 4.
(a) Projected GWP impacts for TWh/year. (b) Projected AP impacts for TWh/year. (c) Projected EP impacts for TWh/year. (d) Projected HTP impacts for TWh/year.


Figure 5.
LCA stages recommended for hydrogen production (adapted/modified from Hong et al. [53].
Figure 5.
LCA stages recommended for hydrogen production (adapted/modified from Hong et al. [53].

Table 1.
Projected Scenarios.
| Scenarios | Fossil Fuels | Other | Renewables | |||||||
|---|---|---|---|---|---|---|---|---|---|---|
| NG | Oil | Coal | LNG | WTE | Solar PV | Renewable H2 | Hydro * | Wind * | Bio-Energy * | |
| Year 2010 | 78% | 20% | 0 | 0 | 2% | 0 | 0 | 0 | 0 | 0 |
| Year 2020 | 95.2% | 0.7% | 1.2% | 0 | 1.45% | 1.45% | 0 | 0 | 0 | 0 |
| Year 2030 | 30% | 0 | 0 | 60% | 1% | 10% | 0 | 0 | 0 | 0 |
| Year 2040 | 10% | 0 | 0 | 70% | 0 | 20% | 0 | 0 | 0 | 0 |
| Green Energy | 0 | 0 | 0 | 0 | 0 | 50% | 20% | 10% | 10% | 10% |
* Imported electricity.
Publisher’s Note: MDPI stays neutral with regard to jurisdictional claims in published maps and institutional affiliations. |
© 2022 by the author. Licensee MDPI, Basel, Switzerland. This article is an open access article distributed under the terms and conditions of the Creative Commons Attribution (CC BY) license (https://creativecommons.org/licenses/by/4.0/).
Share and Cite
MDPI and ACS Style
Khoo, H.H. LCA of Mixed Generation Systems in Singapore: Implications for National Policy Making. Energies 2022, 15, 9272. https://doi.org/10.3390/en15249272
AMA Style
Khoo HH. LCA of Mixed Generation Systems in Singapore: Implications for National Policy Making. Energies. 2022; 15(24):9272. https://doi.org/10.3390/en15249272
Chicago/Turabian StyleKhoo, Hsien H. 2022. "LCA of Mixed Generation Systems in Singapore: Implications for National Policy Making" Energies 15, no. 24: 9272. https://doi.org/10.3390/en15249272
Note that from the first issue of 2016, this journal uses article numbers instead of page numbers. See further details here.