1. Introduction
Urban mobility has a central role in the dynamics of modern cities [
1,
2,
3,
4,
5,
6]. Data about transport mode usage are fundamental in a wide range of research areas, such as greenhouse gas emissions [
7], public transport services demand [
8,
9], consumers’ response to changes in transport cost [
10] and urban planning [
3]. This way, automated methods for transport mode identification can catalyze the development of systems that fit the needs of contemporary cities. Sensors, artificial intelligence, geospatial technologies and big data enable technologies for developing services and infrastructure in smart cities [
11,
12,
13,
14]. In this context, the growth in smartphone usage by individuals and the quality improvement of mobile Internet networks bring the possibility of employing cellphone sensors as data sources in machine learning systems [
15,
16].
Several solutions have been investigated to explore the problem of identifying transport modes [
17,
18,
19,
20,
21,
22,
23,
24]. Most works use traditional machine learning algorithms to classify transport modes, such as Decision Trees [
18], Random Forest [
19,
20], Bayesian Belief Networks [
23] and Recurrent Neural Networks [
24]. It should be noted that such works propose specific solutions with a typical dataset, being unable to identify transport in different situations. Other works use only a data source such as GPS [
17,
20,
24] or are limited to using a fixed set of rules based on the data characteristics [
17,
25], not adapting to changes in the environment and generating a low generalization level for transport mode identification.
Although the works mentioned above have explored different scenarios, they all share a common limitation: A large amount of data is required, which is transferred to a powerful central server to train and generate the identification model. User privacy can be compromised when data is sent to generate the model. Recent studies explored decentralized scenarios to classify transport modes to address this limitation [
15,
22,
26,
27,
28]. Both Martin et al. [
27] and Ferreira et al. [
15] proposed architectures in which the classifier model is moved to the client-side to transport mode detection locally. However, data still must be moved to the server-side at training rounds. The need to move training/inference data to a central server has several disadvantages: (i) concentrating all the user’s data on a central server increases the concerns about data privacy; (ii) in a real-life scenario, a large amount of data must be processed to deliver results in real time, increasing the coast of a central server; (iii) since data is collected from mobile devices, there must be a good mobile Internet connection to transfer the data to a central server, which can be challenging in some cities and neighborhoods.
The use of Federated Learning (FL) is one of the promising ways to solve the cited problems of centralized methods. FL is a machine learning approach that enables the use of traditional machine learning algorithms in a decentralized environment, in which the user data do not leave their source device [
29]. Unlike centralized machine learning, in Federated Learning, data are not sent from their origin to a centralized server [
29,
30]; all the training is conducted locally and only the resulting parameters are transferred. The central server is responsible for combining these parameters into a final model and delivering this result to client applications. Hence, FL’s main characteristic is that client data do not leave the source device, increasing privacy and data security [
29,
31]. Furthermore, in FL, the time spent on training and inference tends to be lower than in centralized methods [
32], leading to a shorter response time in transport mode detection. Furthermore, collaboration is easier on FL since storage and processing costs are divided among clients [
32]. This way, the system can be escalated to significant amounts of users, increasing the global accuracy of the model; meanwhile, no client data are shared. These characteristics are essential to the task of transport mode detection in a real-world scenario.
This research presents the Federated System for Transport Mode Detection (FedTM). FedTM explores using smartphone sensors to apply FL to transport mode detection. The following are our main contributions achieved in this research:
A Federated Learning mechanism is developed to address the issue of transport mode detection;
Centralized and decentralized machine learning algorithms are analyzed and compared, with a focus on the decentralized approach;
Sensor data are captured only during curves. Thereby, there is less energy consumption by the sensors and the data set generated is smaller, which facilitates processing by smartphones, which have less processing power than centralized servers.
The sensors employed as data sources are accelerometers, gyroscopes and GPS. The centralized models analyzed are Support Vector Machines (SVM), Decision Trees (DT), Random Forests (RF), Gradient Boosting (GBM) and Neural Networks. In the federated model, only Neural Networks are analyzed.
The remainder of the paper is structured in the following way.
Section 2 presents a literature review on methods proposed to solve the transport mode detection task.
Section 3 presents the FedTM’s architecture and characteristics and how data were collected and pre-processed. In
Section 4, FedTM is compared to centralized approaches on execution time and detection performance to be validated. A statistical comparison of the models is carried out as well. Finally,
Section 5 summarizes the main conclusions of the research study.
2. Related Works
Some studies [
17,
23,
33,
34,
35,
36] have made use of additional information supplied by the maps of the Geographic Information System (GIS). However, the data from the GIS are not always available and for this reason, the information from the GIS was not used in this research study.
Chen et al. [
17] developed GIS-based algorithms to detect transport mode and travel purpose in New York City using GPS data. The data were segmented and each segment was classified by a set of rules based on each mode characteristic. Six transport modes were analyzed with a success rate varying from 28.6% to 95.8% and a mean of 79.1%. The main disadvantage of this work is that the algorithm is composed of fixed rules created based on the study context, so it cannot evolve automatically like machine learning systems.
Feng and Timmermans [
23] explored the use of GPS and accelerometer data in the Bayesian Belief Network to detect transport mode in London. They used the accelerometer sensor to enrich the feature space since GPS alone has some issues such as signal loss and difficulty differentiating similar classes. This model was used to classify eight modes and resulted in inaccuracies from 88% to 99%.
Reddy et al. [
18] designed a fusion model with Decision Trees and employed the Hidden Markov Model (HMM) by making use of data from the GPS and accelerometer to classify the mode of traveling, which included stationary, walking, running, cycling and driving. This model achieved a degree of accuracy of 93.6%.
Stenneth et al. [
20] designed a model using Random Forest with GPS and a system of geographic information to classify the stationary travel mode, walking, cycling and traveling by car, bus or train. They tested five classifiers (Naive Bayes, Bayesian Network, Decision Trees, Random Forest, Multilayer Perceptron) and achieved the best precision rate of 93.5% with Random Forest.
Zhou et al. [
19] used data from the accelerometer and GPS to classify the mode of transport. Records of the date, time and acceleration data were obtained along three axes (i.e., x, y and z) and data on the geographic coordinates were taken from the GPS of smartphones. The Random Forest model was employed to classify the mode of transport and achieved a degree of accuracy of almost 94%.
Nirmal et al. [
37] proposed a system to detect and display the users’ transport modes in a real-time map. They tested five classifiers (Decision Trees, Random Forest, Support Vector Machine, Gradient Boosting and Neural Networks), achieving higher accuracy of 94% with Random Forests. The data are collected at the user’s smartphone and immediately sent to the server. The classification task is carried out on the server side and the map database is updated. Even though the system was designed to offer a real-time response to the edge user, concentrating the classification task in a central server may lead to slower responses in moments of high demand for classification.
Martin et al. [
27] studied the impact of dimension reduction techniques (more precisely, principal component analysis and recursive feature elimination) on GPS and accelerometer data. They employed Random Forest and K-nearest neighbors for the classification task. Their goal was to simplify data as possible to easily be processed in thin clients such as a smartphone. The main limitation of their work is that it was not defined how data would be shared between servers and clients for the training rounds.
Ferreira et al. [
15] explored accelerometer and GPS sensor data for transport mode detection using Random Forests models. In the training phase, the smartphones collect data, then send it to a central server that trains the Random Forest model. As soon as the training is done, the model is distributed to the client applications installed on the smartphones that can now classify transport modes in real time, with no need for Internet connection and with lower timing issues since the whole procedure is carried out locally. When the user has good Internet access, all the data collected during the application usage are sent to the server to be used in new training rounds and be available for future research. The success rate of this system ranged from 82.11% to 97.28%, depending on the transport mode analyzed.
In most of the studies cited in this work, different degrees of precision were achieved when classifying transport modes. All these studies employed a central server to gather the data generated by the sensors and then move to the next phases of training and classification. The approach followed by [
15] is the one that came closest to a fully decentralized environment: the classification is carried out locally in the edge devices (smartphones), but data must be sent to the server to train the model.
Centralizing the transport mode detection task has some limitations: (i) moving the data to a central server generates concerns about data privacy and security; (ii) data processing and storage are costly in a big data scenario; (iii) smartphones need a good Internet connection to send a sensor’s data and receive the classification results in real time. This way, this research explores the use of distributed Neural Networks to identify transport modes, analyzing the trade-off between accuracy and privacy by comparing the distributed model to some centralized ones.
Table 1 summarizes the characteristics of the cited works and FedTM.
Furthermore, in previous research studies, two sensors were used to determine the mode of transport and collect the data throughout the whole journey made by the vehicle. In other words, the different devices for data collection were conditioned by the route followed by the vehicle and thus required a considerable amount of energy consumption. Unlike the case of the other studies discussed, this research relies on a fusion of five smartphone sensors to pick up the information provided by the vehicles and the data collection was only carried out when the driver of the vehicle took a curve. This meant that there was less energy consumption on the part of the smartphone.
3. Federated System for Transport Mode Detection-FedTM
This section introduces FedTM, a federated system for transport mode detection. FedTM is a system whose main objective is to classify the transport modes using data from smartphones, without such data having to be moved to a central server. For this, FedTM was developed using Neural Networks and FL. FedTM allows a classifier model to be trained and deployed on smartphones without transferring data to the server. In addition, our system shortens training time in a decentralized environment, with a high hit rate using only data collected during curves in the route.
The rest of this section is organized as follows.
Section 3.1 gives an overview of the FedTM.
Section 3.2 presents the concepts and technologies used in the FedTM and the system itself in more detail.
Section 3.3 describes how the data used in this work were collected. Finally,
Section 3.4 explains how the pre-processing of the raw data is carried out.
3.1. Overview
To solve the task of transport mode detection, FedTM modelled a federated Neural Network. This federated model is shared among all clients and both training and inference are carried out locally on the smartphone.
Figure 1 illustrates an overview of the FedTM. The central server is only responsible for coordinating the process (Label A,
Figure 1). In the FedTM architecture, the smartphone is the client device and it generates the sensors’ data for transport mode detection during curves along the user trip. These data are processed only locally, so training and inference occur in the user’s device (Label B,
Figure 1). In this way, it is possible to decrease the response time and increase privacy in the transport mode detection.
On the client side (Label B,
Figure 1), a local model is trained with the local data that never leaves the device. Each client updates the server using parameters from its own locally trained model (Label C,
Figure 1). The server (Label A,
Figure 1) aggregates these clients’ updates into a new global model. The global update is then delivered to all clients (Label D,
Figure 1) who can now detect transport mode. This way, clients enjoy a classification model trained with all the client’s data but no training or inference data exchange.
This way, FedTM is an appropriate solution to the transport mode detection task whenever greater data privacy, faster training time, less server-side processing and more decentralization are essential requirements of the system, being aware that these aspects come at the cost of a lower accuracy score.
3.2. Mechanism for Transport Mode Detection in FedTM
Machine Learning (ML) technology relies on training data to be used in the learning process. Generally, these data are generated and owned by different parties. A traditional solution to train an ML model is to transfer all the data to a centralized server responsible for the training process [
29].
When it comes to transport mode detection, this traditional approach to data processing faces some challenges. Moving user data to a central server may compromise privacy and data security [
29]. The smartphone data used in transport mode detection can track users’ mobility habits. This way, data concerns assume significant relevance for developing such systems. Beyond this, the network that transfers data to the server may affect the user’s experience, leading to high response times [
27], particularly relevant in the case of transport mode detection since the data source is a mobile device with no guarantee of a good Internet connection. Furthermore, with the advance of big data in smart cities, processing and storing significant amounts of data in a central server can become very costly [
38]. This high cost of processing and storing data may impede employing a transport mode detection system in a real-world scenario.
A mechanism for transport mode detection in FedTM was modeled based on FL to solve these challenges. FL is an ML approach developed to train a global model. At the same time, the training data remains distributed over its source devices (in our case, smartphones) [
39], creating a federation of participating devices (called clients that are the smartphones in FedTM) coordinated by a central server. Each smartphone has its local training dataset, never uploaded to the central server. Instead, each smartphone trains a local model. After this training, these different models are shared and combined to reach a consensus for the final model. This communication of trained models must be carefully designed to ensure the privacy and safety of the original data and the model itself [
40].
FedTM has a higher level of privacy during the training phase of the learning process because the FL employed adds noise to client updates to ensure that it is impossible to generate the original training data and guarantee clients’ anonymity [
40]. Furthermore, since data are not centralized in one node, FedTM is less likely to suffer mass data leaks. In addition to the privacy benefit, FedTM reduces the amount of network usage if the training dataset is large. This happens because the per-client traffic is equal to the number of training rounds times the size of each update and each update’s size is generally tiny compared to the whole training dataset [
40]. This way, even smartphones with low-quality Internet access can join the FedTM without giving up a good user experience.
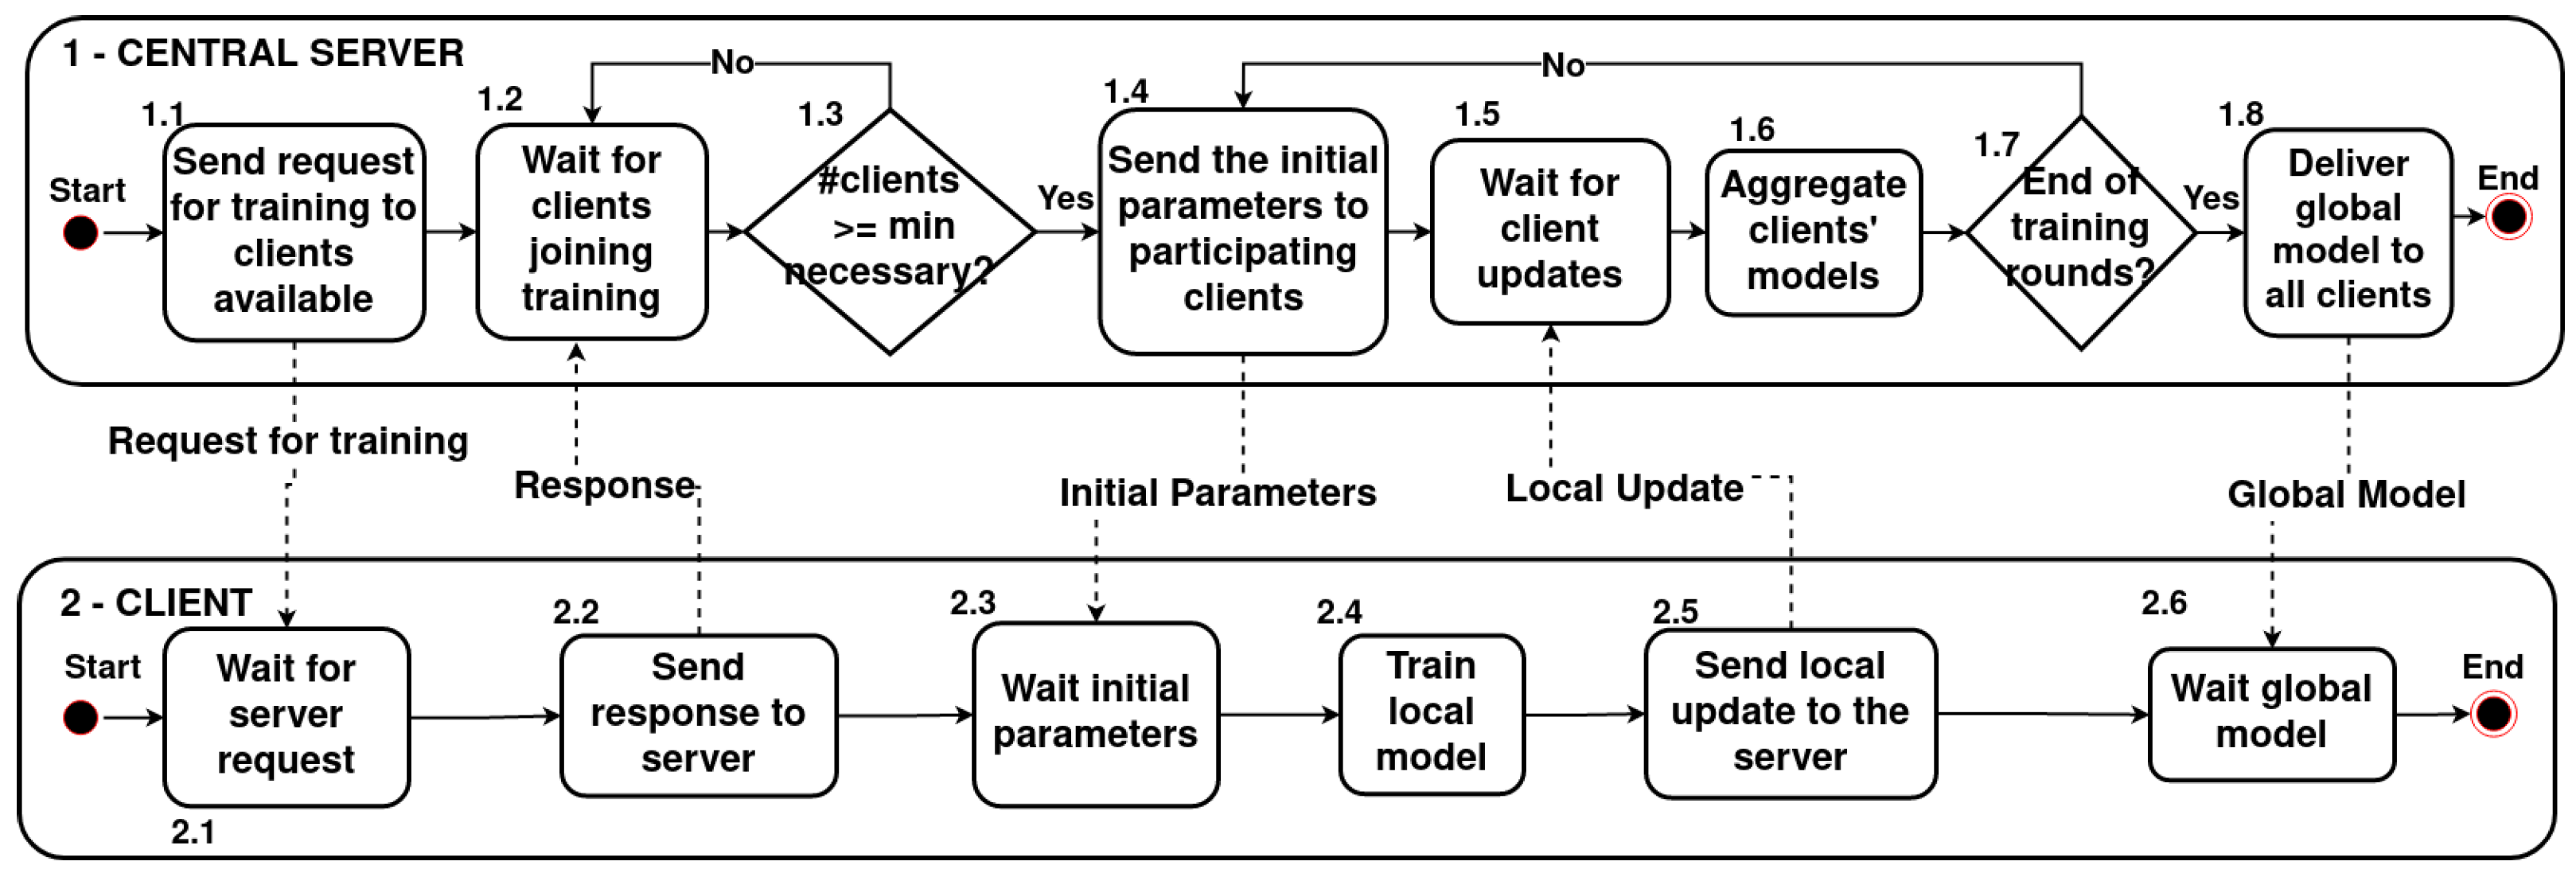
In FedTM, there are two phases: model training and model inference. The flowchart present in
Figure 2 illustrates in detail the training process of FedTM. First, the server starts the training process by sending the clients (smartphones) a request to join the FedTM training process (Label 1.1,
Figure 2). The client available sends a response to the server (Label 2.2,
Figure 2). Once the minimum number of clients necessary is reached, the server sends the initial parameters to the participants’ clients (Label 1.4,
Figure 2). These initial parameters may be random (in the case of the first training of the system) or the current version of the global model of the FedTM. On the client side, labelled training data are collected, pre-processed and used in local training (Label 2.4,
Figure 2). This training phase generates a local model for each FedTM client. The clients send updated information to the central server to combine these local models into a more generalized global model (Label 2.5,
Figure 2). Then, the server aggregates this information into a global model (Label 1.6,
Figure 2). This process repeats for a defined number of training rounds. When all rounds are finished (Label 1.7,
Figure 2), the server sends the final global model to all clients (even to those that did not join the training process) (Label 1.8,
Figure 2).
At FedTM inference time, the smartphones use the global model provided by the central server to classify their unlabeled data. During the whole process of training and inference, the only data exchanged between server and smartphones are the initial parameters (that may be random, in the case of the first training phase of FedTM or the current global model) and updates of local and global models (Labels 1.4, 2.5, 1.8,
Figure 2).
Due to its decentralization characteristic, in which training and inference are carried out locally on the users’ smartphones, FedTM has some advantages in transport mode detection:
It is harder to track a user’s mobility habits since the sensor’s information does not leave the smartphone;
Only the updated parameters are shared, reducing the total amount of network usage;
Processing and storage coasts are divided among clients, making the system resources cheaper and more easily scalable;
Response time in transport mode detection is lower since there is no need for remote requests at inference time.
A fully connected Neural Network classifier was developed to check transport mode detection in a decentralized learning environment. For this, we used the TensorFlow
https://www.tensorflow.org/ (accessed on 29 November 2022). library from the Python language. The FedTM’s Neural Network first layer receives all 24 features. It has one hidden layer of 48 neurons with a relu activation function. Its output layer employs softmax as an activation function. The Adam Optimizer was employed to optimize the accuracy of the model. This Neural Network architecture is illustrated in
Figure 3.
To implement its Neural Network in a federated manner, FedTM used the Flower
https://flower.dev/ (accessed on 29 November 2022) framework. This framework offers abstract methods for the developer to implement the learning logic at the server and client sides. It also provides strategies to combine the partial training models generated by the client processes. In FedTM, the Flower server was configured to have two rounds of Federated Learning with a minimum of three clients per round. The aggregation strategy adopted in FedTM (Label 1.6,
Figure 2) was the Federated Average (FedAvg), which the Flower library already implements. Each client takes one step of gradient descent on the local model using its data in this strategy. Once the client training is done, the server generates the global model as the weighted average of the local models trained by the clients. This FedAvg repeats according to the number of training rounds defined.
3.3. Data Acquisition
For training and validation of the FedTM proposal, a labeled dataset of smartphone sensors data was used. The data collection was carried out in Brazil in Belem-PA and Bujaru-PA from 30 May 2018 until 7 June 2018. Three transport modes were used: (i) car, (ii) bus and (iii) motorcycle. Five drivers were selected to diversify the drivers’ profiles: two for cars, two for motorcycles and one for buses.
A co-driver went along with the driver during the route. Data were collected only during curves (see
Figure 4). At the beginning of each curve, the co-driver was responsible for the activation of the data collection. When the curve was completed, this passenger ended the collection process. Only one person was designated for this task.
The sensors’ parameters collected are listed in
Table 2. The following smartphone sensors were employed: accelerometer, GPS, magnetometer, gyroscope and velocity. Accelerometer, gyroscope, GPS, magnetometer and velocity were used at 10 Hz. The accelerometer, gyroscope and magnetometer supplied the information shown in the three axes (x, y and z). The GPS sensor calculated the bearings between latitude and longitude points, while the velocity sensor provided information about the vehicle’s speed.
3.4. Data Pre-Processing
A lot of information is generated for each interval curve, depending on sensor frequency and duration. The mean value and the standard deviation for each parameter were calculated to group these data. In addition, the attributes from Equation (
1) were standardized as follows:
where
New value of an instance after standardization
x Current value of the instance
μ Arithmetic mean of the parameter
σ Standard deviation of the parameter
This way, the final dataset used in this work has the features listed in
Table 3.
4. Results and Discussions
This section evaluates FedTM and compares it to centralized solutions. The goal is to check how good FedTM is in the task of transport mode detection relative to other approaches. This test comparison is handy since FL systems generally have lower performance than a centralized system. Comparing FedTM with centralized models makes it possible to evaluate the trade-off between accuracy and privacy. In addition to the classification performance tests, the training time of FedTM will be measured and compared with a centralized version of the FedTM Neural Network. This test aims to check the hypothesis that the training time is lower than centralized methods due to the decentralization and parallelization characteristics of FedTM.
The remainder of this section is organized as follows.
Section 4.1 presents the setup for the testing, including the dataset division, the model parameters and the computational environment.
Section 4.2 presents the results of the execution time and detection performance tests. It also includes the analysis of FedTM performance compared with centralized approaches. Furthermore, this subsection presents a statistical comparison of the centralized models and FedTM using the Kolmogorov–Smirnov test to check the similarity of these classifiers.
4.1. Setup
The dataset used to train and validate FedTM has 132 samples after pre-processing. This dataset was divided using the hold-out method, with 75% of the samples for training and 25% for validation. The FedTM tested has three clients during the training process. Since the training dataset is unbalanced, random oversampling techniques were employed to balance the FedTM training data.
This Neural Network employed in FedTM has a hidden layer of 48 neurons with a relu activation function and the output layer uses softmax as an activation function. The Adam Optimizer was employed to optimize the accuracy of the model. The FedTM’s model’s first parameters (those used to initialize the clients before the first round of training) are random values defined by the Flower library as default. In order to assess the performance of the FedTM, other centralized models were used for comparison. The centralized classifiers comprise a Neural Network with the same parameters as FedTM and other traditional ML classifiers already listed in the Introduction section. These traditional classifiers were implemented with the aid of the scikit-learn
https://scikit-learn.org/ (accessed on 29 November 2022) library and their configuration parameters are shown in
Table 4.
The computational environment in which the tests were taken has the following configuration. CPU: Intel(R) Core(TM) i3-4005U CPU@1.70 GHz. GPU: none. Memory capacity: 8‘GB. Operating system: Linux version 5.4.0-107-generic (buildd@lcy02-amd64-058) (gcc version 9.4.0 (Ubuntu 9.4.0-1ubuntu1 20.04.1)).
4.2. Results
This subsection presents the evaluation results of FedTM and the centralized models used for comparison purposes. First, transport mode detection performance will be presented and analyzed. Then, the training time of FedTM will be compared to the training time of a Neural Network with the same configuration. This way, it will be possible to validate the hypothesis of FedTM being faster in the training phase. Finally, a statistical comparison of the models’ equivalence using Kolmogorov–Smirnov will be presented.
4.2.1. Transport Mode Detection Performance
In order to verify the performance of the FedTM transport mode detection, the metrics of accuracy, precision, recall, f1 and kappa scores were used. This evaluation was performed ten times with the dataset shuffled.
Table 5 shows the mean values of these metrics with a 95% confidence interval.
The metrics presented in
Table 5 show that FedTM underperforms all centralized approaches analyzed. That is expected behaviour since centralized training is more accurate than FL once information is lost when different models are combined [
29]. This way, FL presents a trade-off in which its benefits of bigger data privacy and lower processing at the server side come at the cost of a decrease in the model’s performance.
Some characteristics of the metrics presented in
Table 5 are worth being noticed. First, the bus is the transport mode with the worst metrics in traditional models (SVM, DT, GBM and RF). When using Neural Networks, the motorcycle and the car are the worst indices. According to the motorcycle precision, about 39% of samples classified as motorcycles are not motorcycles (false positives). According to the car recall, only about 72% of cars are classified correctly, despite the high precision in classifying cars (about 89%). This indicates that the Neural Network used in the FedTM classifies many cars as motorcycles, hurting the rates of both classes. The buses, in turn, perform well, with good recall and accuracy metrics. Finally, the FedTM kappa metric, which measures how far the model is from a completely random model, is 15 percentage points below the centralized Neural Network, demonstrating the performance loss due to decentralization.
Figure 5 shows the confusion matrices for each model analyzed. It shows that FedTM and the other classifiers misclassify cars. Motorcycles are classified correctly, but some cars and buses are classified as motorcycles. Overall, the matrices are very close because of the small dataset used.
4.2.2. Training Time Performance
In order to verify the hypothesis that the FedTM has a shorter training time than the centralized Neural Network, a test was carried out in which the training time on the FedTM server and clients and the centralized training time were measured. For this test, the FedTM federated server was configured to have three clients and two training rounds, with each client having a dataset of 33 samples. The centralized Neural Network has a dataset of 99 samples, representing the combination of data from the three customers. The results obtained are shown in
Figure 6.
Note that the federated server had a shorter processing time than the centralized one (see
Figure 6) because the processing on the server is only the task of combining the models coming from the clients. Clients, in turn, had a longer processing time than the centralized server because the two training rounds were measured; the training took place twice for each client. The FedTM feature of most processing in training being located on the client-side allows the server administrator to spend fewer resources on data processing, making the FedTM deployment cheaper. Furthermore, the fact that clients in the federated model are executed repeatedly during the training rounds allows the number of epochs of the FedTM Neural Network to be smaller than that of the centralized Neural Network (see
Figure 7). Note that the federated model (used in the FedTM) converges to an optimal epoch value before the centralized model.
A test was carried out with an increasing number of clients to complement the time analysis conducted previously and check if the FedTM has faster training than the centralized Neural Network in a scenario where the number of clients increases. For this, the FedTM received an increasing number of clients, each with 99 training samples, while the centralized model received the combination of these training samples. The processing time results are shown in
Figure 8. Note that the processing times of both the FedTM and the centralized model grow linearly. However, the FedTM grows at a substantially slower rate. For 30 clients, the most significant amount tested, FedTM clients, averaged about 1.82 s, while the centralized model spent about 10.3 s, demonstrating the drop in FedTM training time due to system parallelism.
4.2.3. Statistical Comparison of Models
This section will present the statistical comparison of the FedTM with the centralized models. For this, the Kolmogorov–Smirnov test (KS test) will be used to compare the similarity of the FedTM with the centralized models. KS is a non-parametric test that measures the distance between two probability distributions. Knowing that each machine learning model generates a distribution of the output data, what we want to verify with the KS test how close each classifier’s generated probability distributions are. The choice to apply the KS test is justified because it is not sensitive to the type of distribution; that is, we can compare two models, even if they do not have a Gaussian distribution. In this test, the null hypothesis, the test () assumes that the models are the same. If the null hypothesis is accepted, there is no difference between the analyzed models. The alternative hypothesis () assumes that the models are different. To accept the null hypothesis, the p-value of the KS test must be greater than 0.05. Otherwise, the null hypothesis can be rejected, with the ML models being different with a 95% confidence interval.
The results of the KS test are shown in
Table 6. First, note that the FedTM is similar to the centralized Neural Network and this is expected behaviour since the classifier’s configuration is the same. FedTM is also similar to SVM and different from other classifiers.
Figure 9 shows the relationship between accuracy and the training sample number of tested models. These curves confirm the results of model similarity given by the KS test. The FedTM, the Neural Network and the SVM have similar accuracy curves. The other classifiers differ from FedTM mainly by converging to high levels of accuracy with fewer training samples.
Tree-based models (DT, RF and GBM) perform better with small and straightforward datasets than more complex models, such as SVMs and NNs, that have similar lower results. This result is a consequence of the small dataset used. This way, FedTM, centralized Neural Network and SVM were considered similar at the KS test due its similar shape accuracy curves with the dataset used.
5. Conclusions
This paper showed that it is possible to detect transport modes decentralized from smartphone sensor data. Data about transport mode usage are essential in several research areas, such as greenhouse gas emissions, forecasting demand for public transport, studying user responses to increases in transport costs and urban planning. The FedTM system presented in this article provides an automated and scalable method for obtaining such data with a high hit rate.
FedTM was developed using artificial Neural Networks and FL. Due to the FL, the FedTM differs from the approaches proposed in previous studies, given that decentralization provided an increase in privacy, lower response time, reduction of computational costs and less use of the mobile network by the user. In addition, the FedTM uses data collected only during the curves of the route, reducing the total amount of data to be processed and the energy expenditure by activating sensors during collection. Thus, the approach presented in this paper is more suitable for practical use than others already present in the literature.
Given the objective of evaluating the FedTM’s performance in detecting transport modes, the metrics of accuracy, precision, recall, f1 score and kappa were analyzed. In addition to the FedTM itself, centralized methods (SVM, DT, RF, GBM and Neural Networks) were also tested. This way, it was possible to compare the performance of the FedTM with that of a centralized approach. The FedTM achieved an average accuracy of 80.6% in the tests and did not obtain any metric superior to the centralized methods tested. Such behaviour is expected since the federated training process occurs at the cost of a decrease in the hit rate. Still, FedTM is more easily scalable, so it can compensate for its lower accuracy by employing a more significant number of clients in the training phase. In addition to the metrics tests, a statistical analysis was performed using the Kolmogorov–Smirnov test. This test showed that the FedTM learning curve is similar to the SVM and the centralized neural network.
Two tests were carried out during the training phase to validate the performance at runtime. FedTM was run with just three clients in the first test and its centralized equivalent with a dataset equivalent to the three clients combined. The FedTM clients had a slightly longer runtime than the centralized model. The FedTM server had a substantially shorter runtime, demonstrating that server-side processing costs for FedTM are lower than for a centralized approach. In turn, analyzing the FedTM’s gains in scale, a test was conducted with an increasing number of clients. The FedTM had a lower rise in processing time than the centralized model in this test. In the test case with 30 clients, the FedTM took about 1.82 s to perform the training, while the centralized model took 10.3 s. Thus, the FedTM proved to be the best performer at runtime.
From the results and analyses presented in this work, it is possible to conclude that the FedTM is a suitable system for detecting transport modes using smartphone sensor data. Its decentralization characteristic differentiates it from other approaches already present in the literature. Despite having lower accuracy than centralized models, the FedTM has more significant data privacy and security guarantees. In addition, FedTM has gains in training time and lower server-side computational cost, making it more easily scalable. These characteristics are essential in a practical scenario, making the FedTM a good alternative.
As future work, we intend to analyze the relationship between the increase in accuracy versus the increase in FedTM processing time. This is because the system architecture runs on smartphones, which do not have processing capacity guarantees. Still, we intend to propose a methodology to automate the activation of sensors for the collection of data only in curves. Finally, we intend to extend our experiment setup to analyze the FedTM in more detail, adding new metrics in the analyzed scenario.
Author Contributions
Conceptualization, I.C.C., R.I.M., R.H.T. and G.P.; Methodology, I.C.C., R.I.M., R.H.T., L.Y.M., V.P.G., J.U., G.P. and G.P.R.F.; Investigation, I.C.C.; Data curation, I.C.C.; Writing—original draft, I.C.C., L.Y.M., V.P.G., J.U., G.P., G.D.A.N. and G.P.R.F.; Writing—review & editing, V.P.G., J.U., G.P., G.D.A.N. and G.P.R.F.; Supervision, G.P.R.F. All authors have read and agreed to the published version of the manuscript.
Funding
Geraldo P. Rocha Filho would like to thank the FAPESP (São Paulo Research Foundation) under grant #2021/06210-3. Rodolfo Ipolito Meneguette would like to thank the FAPESP (São Paulo Research Foundation) under grant #2020/07162-0.
Data Availability Statement
Conflicts of Interest
The authors declare no conflict of interest.
References
- Meneguette, R.; De Grande, R.; Ueyama, J.; Filho, G.P.R.; Madeira, E. Vehicular Edge Computing: Architecture, Resource Management, Security and Challenges. ACM Comput. Surv. 2021, 55, 1–46. [Google Scholar] [CrossRef]
- Wegener, M. The future of mobility in cities: Challenges for urban modelling. Transp. Policy 2013, 29, 275–282. [Google Scholar]
- Liua, B.; Yan, L.; Wang, Z. Reclassification of urban road system: Integrating three dimensions of mobility, activity and mode priority. Transp. Res. Procedia 2017, 25, 627–638. [Google Scholar]
- Rocha Filho, G.P.; Meneguette, R.I.; Torres Neto, J.R.; Valejo, A.; Weigang, L.; Ueyama, J.; Pessin, G.; Villas, L.A. Enhancing intelligence in traffic management systems to aid in vehicle traffic congestion problems in smart cities. Ad. Hoc. Netw. 2020, 107, 102265. [Google Scholar] [CrossRef]
- Meneguette, R.I.; Filho, G.P.; Guidoni, D.L.; Pessin, G.; Villas, L.A.; Ueyama, J. Increasing intelligence in inter-vehicle communications to reduce traffic congestions: Experiments in urban and highway environments. PLoS ONE 2016, 11, e0159110. [Google Scholar] [CrossRef] [Green Version]
- Geraldo Filho, P.; Villas, L.A.; Gonçalves, V.P.; Pessin, G.; Loureiro, A.A.; Ueyama, J. Energy-efficient smart home systems: Infrastructure and decision-making process. Internet Things 2019, 5, 153–167. [Google Scholar] [CrossRef]
- Toledo, A.L.L.; Rovere, E.L.L. Urban Mobility and Greenhouse Gas Emissions: Status, Public Policies and Scenarios in a Developing Economy City, Natal, Brazil. Sustainability 2018, 10, 3995. [Google Scholar] [CrossRef] [Green Version]
- Paulley, N.; Balcombe, R.; Mackett, R.; Titheridge, H.; Preston, J.; Wardman, M.; Shires, J.; White, P. The demand for public transport: The effects of fares, quality of service, income and car ownership. Transp. Policy 2006, 13, 295–306. [Google Scholar] [CrossRef] [Green Version]
- Meneguette, R.I.; Boukerche, A. Vehicular Clouds Leveraging Mobile Urban Computing Through Resource Discovery. IEEE Trans. Intell. Transp. Syst. 2020, 21, 2640–2647. [Google Scholar] [CrossRef]
- Pereira, R.S.; Lieira, D.D.; da Silva, M.A.; Pimenta, A.H.; da Costa, J.B.; Rosário, D.; Meneguette, R.I. A novel fog-based resource allocation policy for vehicular clouds in the highway environment. In Proceedings of the 2019 IEEE Latin-American Conference on Communications (LATINCOM), Salvador, Brazil, 11–13 November 2019; pp. 1–6. [Google Scholar] [CrossRef]
- Paiva, S.; Ahad, M.A.; Tripathi, G.; Feroz, N.; Casalino, G. Enabling Technologies for Urban Smart Mobility: Recent Trends, Opportunities and Challenges. Sensors 2021, 21, 2143. [Google Scholar] [CrossRef]
- Sim, S.H.; Lee, J.J. Special Issue on “Smart City and Smart Infrastructure”. Sensors 2021, 21, 7064. [Google Scholar] [PubMed]
- Meneguette, R.I.; Boukerche, A. A cooperative and adaptive resource scheduling for Vehicular Cloud. In Proceedings of the 2017 IEEE Symposium on Computers and Communications (ISCC), Heraklion, Greece, 3–6 July 2017; pp. 398–403. [Google Scholar] [CrossRef]
- Yang, H.; Yuan, J.; Li, C.; Zhao, G.; Sun, Z.; Yao, Q.; Bao, B.; Vasilakos, A.V.; Zhang, J. BrainIoT: Brain-like productive services provisioning with federated learning in industrial IoT. IEEE Internet Things J. 2021, 9, 2014–2024. [Google Scholar] [CrossRef]
- Ferreira, P.; Zavgorodnii, C.; Veiga, L. edgeTrans-Edge transport mode detection. Pervasive Mob. Comput. 2020, 69, 101268. [Google Scholar] [CrossRef]
- Meneguette, R.I.; Boukerche, A.; Pimenta, A.H.M. AVARAC: An Availability-Based Resource Allocation Scheme for Vehicular Cloud. IEEE Trans. Intell. Transp. Syst. 2019, 20, 3688–3699. [Google Scholar] [CrossRef]
- Chen, C.; Gong, H.; Lawson, C.; Bialostozky, E. Evaluating the feasibility of a passive travel survey collection in a complex urban environment: Lessons learned from the New York City case study. Transp. Res. Part A Policy Pract. 2010, 44, 830–840. [Google Scholar] [CrossRef]
- Reddy, S.; Mun, M.; Burke, J.; Estrin, D.; Hansen, M.; Srivastava, M. Using mobile phones to determine transportation modes. ACM Trans. Sens. Netw. TOSN 2010, 6, 13. [Google Scholar] [CrossRef]
- Zhou, X.; Yu, W.; Sullivan, W.C. Making pervasive sensing possible: Effective travel mode sensing based on smartphones. Comput. Environ. Urban Syst. 2016, 58, 52–59. [Google Scholar] [CrossRef]
- Stenneth, L.; Wolfson, O.; Yu, P.S.; Xu, B. Transportation mode detection using mobile phones and GIS information. In Proceedings of the 19th ACM SIGSPATIAL International Conference on Advances in Geographic Information Systems, Chicago, IL, USA, 1–4 November 2011; pp. 54–63. [Google Scholar]
- Pereira, R.; Boukerche, A.; da Silva, M.A.C.; Nakamura, L.H.V.; Freitas, H.; Rocha Filho, G.; Meneguette, R.I. FORESAM-FOG Paradigm-Based Resource Allocation Mechanism for Vehicular Clouds. Sensors 2021, 21, 5028. [Google Scholar] [CrossRef]
- Meneguette, R.I.; Filho, G.P.R.; Bittencourt, L.F.; Ueyama, J.; Krishnamachari, B.; Villas, L.A. Enhancing intelligence in inter-vehicle communications to detect and reduce congestion in urban centers. In Proceedings of the 2015 IEEE Symposium on Computers and Communication (ISCC), Larnaca, Cyprus, 6–9 July 2015; pp. 1–6. [Google Scholar] [CrossRef]
- Feng, T.; Timmermans, H.J. Transportation mode recognition using GPS and accelerometer data. Transp. Res. Part Emerg. Technol. 2013, 37, 118–130. [Google Scholar]
- Simoncini, M.; Taccari, L.; Sambo, F.; Bravi, L.; Salti, S.; Lori, A. Vehicle classification from low-frequency GPS data with recurrent Neural Networks. Transp. Res. Part C 2018, 91, 176–191. [Google Scholar] [CrossRef]
- Meneguette, R.I.; Madeira, E.R.M.; Bittencourt, L.F. Multi-network packet scheduling based on vehicular ad hoc network applications. In Proceedings of the 2012 8th International Conference on Network and Service Management (cnsm) and 2012 Workshop on Systems Virtualiztion Management (svm), Las Vegas, NV, USA, 22–26 October 2012; pp. 214–218. [Google Scholar]
- de Sousa, P.H.F.; Almeida, J.S.; Ohata, E.F.; Nogueira, F.G.; Torrico, B.C.; de Albuquerque, V.H.C.; Hassan, M.M.; Kumar, N.; Hassan, M.R.; Filho, P.P.R. Intelligent 3D Objects Classification for Vehicular Ad Hoc Network Based on Lidar and Deep Learning Approaches. IEEE Trans. Intell. Transp. Syst. 2021, 23, 1–10. [Google Scholar] [CrossRef]
- Martin, B.D.; Addona, V.; Wolfson, J.; Adomavicius, G.; Fan, Y. Methods for Real-Time Prediction of the Mode of Travel Using Smartphone-Based GPS and Accelerometer Data. Sensors 2017, 17, 2058. [Google Scholar] [CrossRef] [PubMed] [Green Version]
- Oubbati, O.S.; Atiquzzaman, M.; Baz, A.; Alhakami, H.; Ben-Othman, J. Dispatch of UAVs for Urban Vehicular Networks: A Deep Reinforcement Learning Approach. IEEE Trans. Veh. Technol. 2021, 70, 13174–13189. [Google Scholar] [CrossRef]
- Yang, Q.; Liu, Y.; Chen, T.; Tong, Y. Federated Machine Learning: Concept and Applications. ACM Trans. Intell. Syst. Technol. 2019, 10, 1–19. [Google Scholar] [CrossRef]
- Li, Y.; Guo, Y.; Alazab, M.; Chen, S.; Shen, C.; Yu, K. Joint Optimal Quantization and Aggregation of Federated Learning Scheme in VANETs. IEEE Trans. Intell. Transp. Syst. 2022, 23, 1–12. [Google Scholar] [CrossRef]
- Balkus, S.V.; Wang, H.; Cornet, B.D.; Mahabal, C.; Ngo, H.; Fang, H. A Survey of Collaborative Machine Learning Using 5G Vehicular Communications. IEEE Commun. Surv. Tutorials 2022, 24, 1280–1303. [Google Scholar] [CrossRef]
- Abreha, H.G.; Hayajneh, M.; Serhani, M.A. Federated Learning in Edge Computing: A Systematic Survey. Sensors 2022, 22, 450. [Google Scholar] [CrossRef]
- Cervantes-Villanueva, J.; Carrillo-Zapata, D.; Terroso-Saenz, F.; Valdes-Vela, M.; Skarmeta, A.F. Vehicle maneuver detection with accelerometer-based classification. Sensors 2016, 16, 1618. [Google Scholar] [CrossRef] [Green Version]
- Chen, S.; Luo, H.; Zhao, F.; Yuan, W.; Jiang, M. Transportation Mode Recognition Algorithm Based on Multiple Support Vector Machine Classifiers. In Proceedings of the Enterprise Systems (ES), 2017 5th International Conference on Enterprise Systems (ES), Beijing, China, 22–24 September 2017; pp. 253–259. [Google Scholar]
- Guerrero-Ibanez, J.A.; Zeadally, S.; Contreras-Castillo, J. Integration challenges of intelligent transportation systems with connected vehicle, cloud computing and Internet of things technologies. IEEE Wirel. Commun. 2015, 22, 122–128. [Google Scholar] [CrossRef]
- Antunes, E.d.O.; Caetano, M.F.; Marotta, M.A.; Araujo, A.; Bondan, L.; Meneguette, R.I.; Rocha Filho, G.P. Optimized solutions for deploying a militarized 4G/LTE network with maximum coverage and minimum interference. IEEE Trans. Netw. Serv. Manag. 2022, 19, 3. [Google Scholar] [CrossRef]
- Nirmal, P.; Disanayaka, I.; Haputhanthri, D.; Wijayasiri, A. Transportation Mode Detection Using Crowdsourced Smartphone Data. Conf. Open Innov. Assoc. FRUCT 2021, 341–349. [Google Scholar] [CrossRef]
- Talebkhah, M.; Sali, A.; Marjani, M.; Gordan, M.; Shaiful, J.H.; Rokhani, F.Z. IoT and Big Data Applications in Smart Cities: Recent Advances, Challenges and Critical Issues. IEEE Access 2021, 9, 55465–55484. [Google Scholar]
- Konečný, J.; McMahan, H.B.; Yu, F.X.; Suresh, A.T.; Bacon, D. Federated Learning : Strategies for improving communication efficiency. arXiv 2017, arXiv:1610.05492. [Google Scholar]
- McMahan, H.B.; Moore, E.; Ramage, D.; Arcas, B.A.Y. Federated Learning of Deep Networks using Model Averaging. arXiv 2016, arXiv:1602.05629. [Google Scholar]
| Publisher’s Note: MDPI stays neutral with regard to jurisdictional claims in published maps and institutional affiliations. |
© 2022 by the authors. Licensee MDPI, Basel, Switzerland. This article is an open access article distributed under the terms and conditions of the Creative Commons Attribution (CC BY) license (https://creativecommons.org/licenses/by/4.0/).


 ,
, 


