1. Introduction
Multi-stage hydraulic fracturing in a horizontal well successfully promotes the commercial development of shale gas. A shale gas reservoir is generally characterized by thin matrix pore, poor pore conductivity, high clay mineral contents, rich organic matter, high-salinity formation water, a large amount of soluble salts, developed bedding planes, considerable amounts of adsorbed gas, well-developed microcracks and nano-scale pores, which are quite different from a conventional natural gas reservoir [
1,
2,
3,
4]. In the process of hydraulic fracturing, a shale gas well has the characteristics of long total operation time, a large amount of fracturing fluid and low flowback efficiency. Taking a shale gas area in the Sichuan Basin as an example, the amount of fracturing fluid in a single well exceeds 2 × 10
4 m
3, but the fracturing fluid flowback efficiency is averagely lower than 50% [
5,
6,
7]. The low flowback efficiency of fracturing fluid in a shale gas well is caused by the complex pore structure and pore surface properties, as well as the complex fracture network formed by the hydraulic fracturing. A huge amount of fracturing fluid retained in the shale reservoir will definitely occupy the gas seepage space and affect the production of the gas well [
8,
9]. Therefore, evaluating the formation damage induced by the imbibition and flowback of fracturing fluid is of great significance for developing the scientific well shut-in and flowback plans.
The fracturing fluid enters the shale reservoir by Imbibition, and the distribution characteristics of the retained fracturing fluid after flowback and the effect of the retained fracturing fluid on the gas transport capacity are the essence of inducing reservoir damage. This problem is also a research hotspot in recent years. Relevant research progress mainly includes multiscale pore structure characteristics of shale, fracturing fluid distribution characteristics during the well shut-in period, and flowback production degree of retained fracturing fluid.
Compared with a conventional natural gas reservoir, due to the more obvious characteristic of multiscale structure of a shale reservoir, the gas transport exhibits multiscale transport behavior in shales [
10,
11,
12]. At present, low-pressure N
2 adsorption, nuclear magnetic resonance and high-pressure mercury injection capillary pressure (MICP) is generally used to directly obtain the pore structure parameters of shales. Meanwhile, scanning electron microscopy (SEM) is used to visualize the pore structure of shales [
13,
14]. A large number of experimental results show that the shale formation is not only well-bedded, but also rich in nano-scale pores in the shale matrix [
10,
15]. In general, a shale gas reservoir has a large number of micropores (<2 nm), mesopores (2–50 nm), and macropores (>50 nm). This feature makes the gas transport characteristics more specific and complicates the evaluation of formation damage caused by fracturing fluid retention.
The time effect could affect the distribution of fracturing fluid in a shale reservoir. The longer the fracturing fluid stays in the reservoir, the more fracturing fluid will imbibe into the smaller pores [
16]. At present, there are three main methods in the laboratory to characterize the distribution of water phase in shale pores: MRI machines, micro-CT scanners and tracer tracers. All three methods can study the distribution of fracturing fluids at different scales, and can also evaluate the pore connectivity and wettability differences of shale [
17,
18,
19,
20,
21,
22]. In addition, the core pore structure could be reconstructed by glass etching and 3D printing technology, then the fluid is displaced by a constant pressure and constant flow pump to simulate the fluid entering the porous medium. This process can visualize the fracturing fluid imbibition and flowback process, and study the microscopic seepage mechanism in the micron and nano pores of shale [
23,
24,
25,
26]. However, due to the developed nano-scale pores in a shale reservoir and the formation of organic clay complexes by organic matter and clay minerals, the existing technologies are still very difficult to reconstruct the multiscale pore structure of shale.
The production process of shale gas includes desorption, diffusion and seepage [
27]. If one of the three processes is changed, the production process of shale gas will definitely be affected. When the fracturing fluid is retained into the shale reservoir, the mechanical strength of the shale will be declined, and the rock can absorb water to create cracks to form new seepage channels [
28,
29]. After the fracturing fluid enters the nano-scale pores of the shale matrix, it will not only promote the desorption of adsorbed gas, but also form clusters in the pores under the action of hydrogen bonds between water molecules. Therefore, the influencing mechanism of fracturing fluid retained in a shale reservoir on the methane transport capacity of shale is very complicated. In addition, during the flowback and production process after the well shut-in, the distribution characteristics of the fracturing fluid retained in the reservoir will change dynamically. This change will lead to a more complex and unpredictable formation damage mechanism and degree of formation damage caused by the retained fracturing fluid [
30,
31,
32,
33]. For the formation damage caused by fracturing fluid, the traditional laboratory evaluation method usually adopts the spontaneous imbibition of fracturing fluid in the core without overburden pressure, and measures the imbibition amount of fracturing fluid [
34]. Next, the nitrogen flooding method is used to measure the core permeability under different flooding pressure difference and flooding time, and then the ability of the core to imbibe fracturing fluid and the degree of formation damage caused by fracturing fluid retention are obtained. However, the above experimental methods do not consider the actual geological and engineering conditions of shale gas. For example, the above experimental methods do not consider the in-situ effective stress of shale reservoirs and the effects of adsorbed methane on the imbibition and flowback processes of fracturing fluid. The above experimental methods also do not consider that the imbibition and flowback of fracturing fluid are two continuous processes, nor do they consider the influence of the gas flooding medium during the flowback process.
On the basis of considering the multiscale pore structure and multiscale gas transport mechanism in shales, this paper describes experiments to simulate the imbibition and flowback behavior of fracturing fluid in shale reservoirs under in-situ conditions including adsorbed methane as the experimental gas source and in-situ effective stress as the experimental confining pressure. Meanwhile, this paper describes experiments that shale sample particles are soaked in fracturing fluid to analyze the potential formation damage mechanisms through measuring the ion contents in the solution. The purpose of this paper is to determine the range of flowback differential pressure and the critical flowback differential pressure that are conducive to gas production by analyzing the formation damage degree and the corresponding influencing mechanism under different shut-in period and flowback process. The experimental results can reflect the formation damage caused by the retained fracturing fluid during the shut-in period and flowback process more accurately, and it is also of great significance for the economical and efficient exploitation of shale gas.
2. Materials and Methods
2.1. Characterization of Shale Samples
The experimental samples used in this paper are taken from the shale reservoir of the Longmaxi Formation in the Changning block of Sichuan Basin in China, which has been proved to have the economic development capacity. In the experiment, the mineral components of 64 shale samples are analyzed by X-ray diffractometer, and the results indicate that the main mineral types of shale samples are clay minerals and quartz. The results indicate that the types of clay minerals in the shale samples are illite, interstratified illite-smectite and chlorite (
Table 1). The content of clay minerals decreases, and the content of quartz increases with the increase of the burial depth of shale reservoir. The TOC of 50 shale samples is measured in the experiment. The results show that the average TOC content of shale samples is 2.98% (
Table 1). The shale in this area belongs to organic-rich shale. The basic physical properties of samples used in this study for fracturing fluid imbibition experiments are shown in
Table 2.
Through the naked eye observation of the core, it is found that the bedding planes are well developed and contains a large number of microcracks. Microcracks include penetrating cracks and non-penetrating cracks. The core samples are placed under reservoir conditions to measure the porosity and permeability. The experimental instrument is CMS-300 unconventional porosity and permeability analyzer (produced by Temco, Fremont, CA, USA). It is found that the porosity of the core samples ranged from 3–5%, and the permeability ranged from 0.10–2.20 mD. The experimental results show that there is no correlation between porosity and permeability, and the degree of development of microcracks is the main factor affecting the seepage capacity in shales. The experiment used argon ions to polish the surface of a shale sample, and then visualized the sample using a field emission scanning electron microscope (FESEM). The results show that the microcracks and nano-scale pores of the core samples are well developed. As shown in
Figure 1, the nano-scale organic pores exhibit obvious spherical shape, and the pore size of some organic pores can reach more than 1μm. The contact models between organic matter and inorganic minerals include point contact and surface contact. These two contact modes are also two important transport channels for methane in shale.
N
2 adsorption is an important method to quantitatively characterize the nanoscale pores of shale. Obtaining N
2 adsorption-desorption curves through experiments can obtain the pore morphology, the ratio of macropores (>50 nm), mesopores (2–50 nm) and micropores (<2 nm) in nano-pores, and parameters such as specific surface area of shales [
35]. The proportion of the pore diameter of each part in the shale determines the position of the imbibition fracturing fluid in the multiscale storage and seepage space of the shale, and the difficulty of the imbibition fracturing fluid flowback. If the shale pore size is smaller, the adsorption potential energy on the pore surface will be larger, which will affect the adsorption and desorption behavior of methane and water molecules in the shales. In this paper, seven shale samples are used for N
2 adsorption experiments. The results show that the specific surface area of shale samples ranges from 13.04 to 65.71 m
2/g, and the average specific surface area is 34.02 m
2/g. The total pore volume of the shale samples ranged from 0.03 to 0.13 cm
3/g, with an average total pore volume of 0.05 cm
3/g. The pore size of shale samples ranges from 4.2 to 7.7 nm, with an average pore size of 5.8 nm. The pore types of shale samples are mainly mesopores, which account for about 85% of the total pore volume of shale samples.
2.2. Experimental Method for Imbibition and Flowback of Shale Fracturing Fluid
In this paper, experiments are carried out to simulate the imbibition and flowback process of shale fracturing fluid considering in-situ effective stress and adsorbed methane. The schematic diagram of the experimental setup is shown in
Figure 2. The experimental conditions fully simulate the in-situ temperature and pressure of the shale gas reservoir. In addition, the core sample is saturated by methane before the experiment begins. In the process of experiment, methane is selected as the flowback displacement medium to simulate the real situation. The backpressure valves are set at the outlet and inlet ends of the core holder. The two backpressures are the simulated formation pore pressure and the bottom hole flow pressure during the flowback process, respectively. It is worth noting that the whole process of fracturing fluid imbibition and flowback is carried out continuously and the core sample is not moved during the experiment.
Therefore, the experiments in this paper consider the real situation of the imbibition and flowback process of fracturing fluid in shale gas reservoirs.
The experimental procedures are as follows:
(1) The shale sample is placed in a core holder, and the overburden pressure and temperature environment of the reservoir are simulated through the confining pressure pump and constant temperature system.
(2) The backpressure is set at the inlet and outlet ends of the core holder, and the backpressure value is equal to the simulated formation pore pressure. Then turn the core holder into a vacuum. Methane is injected into the core sample until the pore pressure reaches the same pressure as the gas in the backpressure valve and stabilize for a period of time.
(3) The core holder and the intermediate container filled with fracturing fluid are connected. The core holder and an intermediate container with a piston are connected, and the upper part of the piston of the intermediate container is the fracturing fluid. The initial pressure of the intermediate container is higher than the pore pressure in the core sample. The difference between the initial pressure of nitrogen and the pore pressure is the positive pressure difference. The positive pressure differential in the experiment simulates the difference between pumping pressure and formation pore pressure. Next, the imbibition process of fracturing fluid in the multiscale storage and seepage space of shale gas is simulated through a pressure decay method.
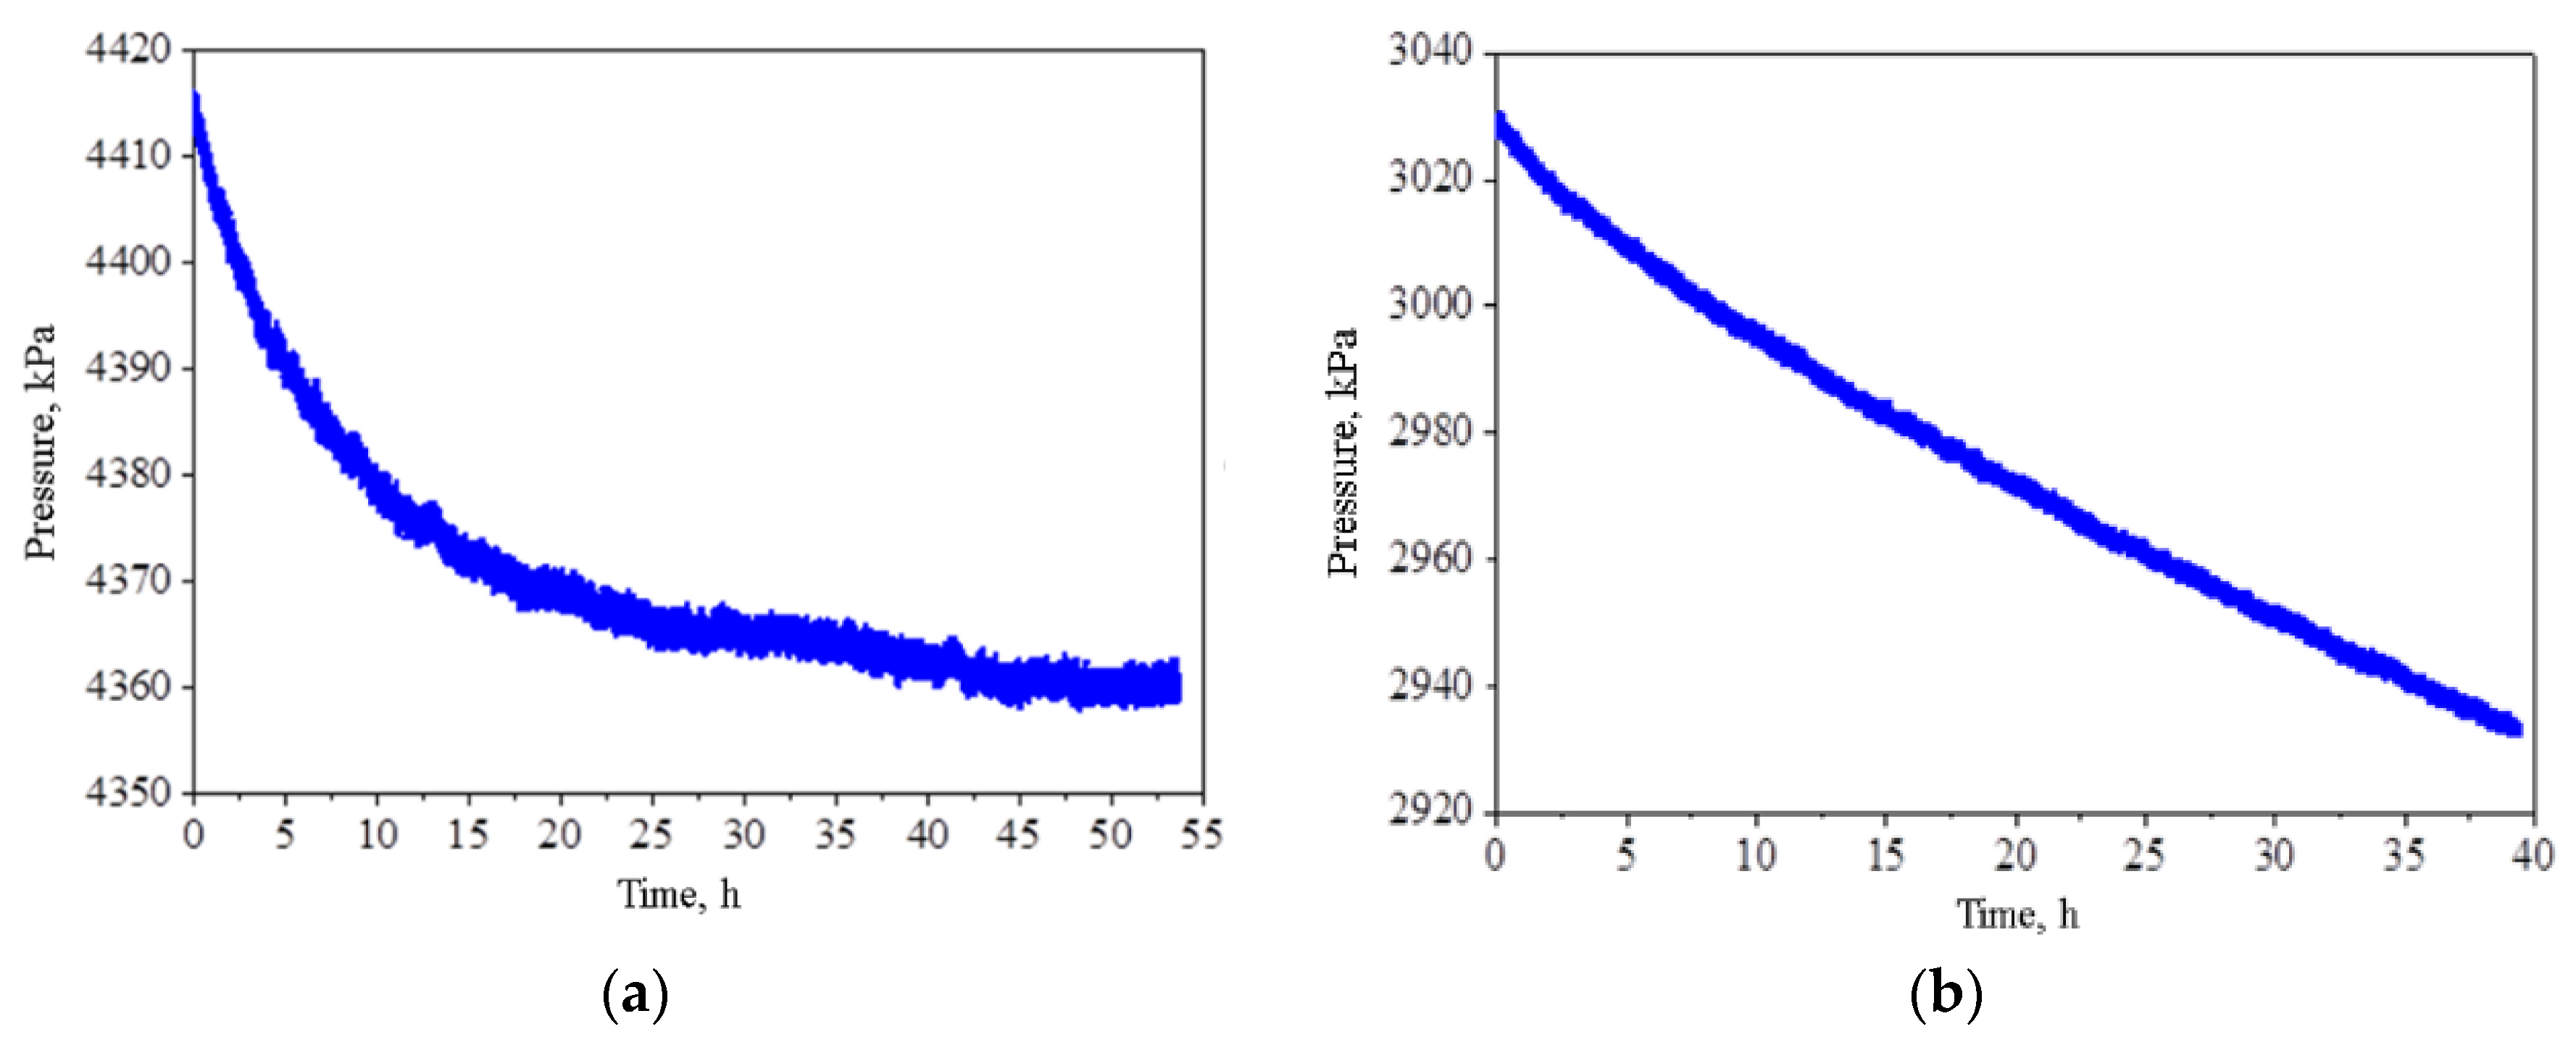
(4) The pressure change at the inlet end of the core is measured, the imbibition amount of the fracturing fluid can be monitored in real time to reflect the change of water content in the multiscale storage and seepage space of shale gas.
(5) After the fracturing fluid imbibition experiment, reverse displacement with methane is used to carry out the flowback experiment under the conditions of the flowback pressure difference of 0.3 MPa, 0.4 MPa, 0.6 MPa, 0.8 MPa, and 1.0 MPa. The backpressure is set during the flowback experiment to simulate the bottom hole flow pressure. The backpressure is set to simulate the real flowback situation on the one hand, and to eliminate the gas slippage effect and let more seepage channels participate in the seepage process on the other hand.
(6) In the experiment, the permeability of shale core samples is tested by the steady-state method. An electronic scale with a beaker is placed at the core outlet. The beaker contains CaCl
2 powder. The methane is dewatered in this way. When the number of the electronic scale is unchanged, the gas flow is measured. In addition, the permeability during the flowback process is calculated by the gas Darcy formula (Equation (1)).
where
Q is the flow rate (cm
3/min),
P0 is the standard atmospheric pressure (1 atm),
is the viscosity of fluid (Pa·s),
L is the length of the core sample (cm),
P1 is the inlet pressure (atm),
P2 is the outlet pressure (atm).
(7) After the flowback experiment, the shale permeability damage rate is calculated by Equation (2).
where
DK is the core permeability damage rate after fracturing fluid flowback (%),
K0 is the core permeability before fracturing fluid imbibition (mD),
K1 is the core permeability after fracturing fluid flowback (mD).
4. Influence of Shale Multiscale Structure on the Fracturing Fluid Flowback Behavior
Shale core samples after imbibition completion and flowback experiments are analyzed using NMR. After the cores are flowed back with different pressure differences, the heights of the double peaks decreased, indicating that part of the fracturing fluid imbibed by the shale is flowed back, and the NMR porosity decreased after flowback (
Figure 7). After flowback, more than 90% of fracturing fluid still remains in the shale, which also explains why shale gas wells show the low flowback efficiency. Retained fracturing fluid can block gas flow channels and cause aqueous phase trapping. In addition, the water-shale interaction will reduce the mechanical strength of the shale, which will cause the particles on the shale surface to fall off, and the particles will migrate under the air-water interface, which will block the gas channel and cause the permeability to decrease [
5,
9,
37,
38,
39].
Core N-52 has higher clay mineral content and higher degree of microfracture development. This situation leads to the formation of new cracks in N-52 due to the hydration and expansion of clay minerals during self-absorption, providing more and more complex gas flow space (
Figure 8). Therefore, after the first flowback experiment, the permeability of the N-52 core sample is already higher than the initial permeability, resulting in a negative permeability damage rate. For the core sample N-8, its initial permeability is very low, so the small pressure difference cannot carry out the water in the core. At the same time, the fracturing fluid may migrate to other microcracks and block the flow channels, resulting in further reduction of permeability. When the pressure difference increases to a certain value, the saturated water in the core N-8 is brought out of the core by the gas, and the change trend of the core permeability is the same as that of N-16, N-25, N-29 and N-38. The permeability of core sample N-8 shows that the permeability damage first increased, and then the change trend of the permeability of N-16, N-25, N-29, and N-38 is the same. For core sample N-67, its initial gas permeability is too low to measure its permeability after the flowback experiment, so the permeability damage rate of core sample N-67 is 100%.
The multiscale structure of shales could be reflected in the core properties as the initial permeability. By analyzing the initial permeability and fracturing fluid flowback results of the experimental samples, the following conclusions can be drawn. When the initial gas permeability of the core sample is less than 0.001 mD, the aqueous phase imbibed into the multiscale pore and cracks space of the shale cannot be flowed back out. A continuous seepage channel cannot be formed in the core sample, so the permeability damage rate is as high as 100%. When the initial gas permeability of the core sample is 0.001–0.01 mD, there is a critical flowback pressure difference (0.3–0.7 MPa) during the flowback process. When the flowback pressure difference is less than the critical flowback pressure difference, the water saturation inside the core sample decreases with the increase of the pressure difference. More and faster gas-water flow channels are created inside the core sample, resulting in a higher permeability of the core sample. When the flowback pressure difference is greater than the critical pressure difference, harmful behaviors such as particle migration occur inside the core sample, resulting in a decrease in the permeability of the core sample. With the further increase of the pressure difference, the permeability of the core sample is partially restored after the originally blocked channel part is opened. When the permeability of the core sample is greater than 0.01 mD, there is no critical flowback pressure difference. The permeability of the core samples increases with the flowback pressure differential during the flowback process. At the same time, the core samples created new cracks due to hydration during imbibition. The newly created cracks in the core sample provide more effective channels for gas-liquid flow, resulting in a negative permeability damage rate for the core sample.
In addition, this paper also describes experiments in which shale sample particles are soaked in distilled water. The experimental procedures are shown as follows:
(1) Seven shale samples with different depths in a shale gas well are selected for the experiment (No.1 to No.7). The shale is prepared into 6–10 mesh particles, dried at 65 °C, and weigh the mesh particles to keep that every particle sample has the same quality (sample mass 20 g).
(2) The shale sample is placed in a beaker containing 200 mL distilled water and heated in a water bath at 80 °C for 12 h, which could make sure all the soluble salt in the shale dissolved.
(3) The supernatant in the beaker is collected into another beaker and the ion contents in the beaker is analyzed by atomic absorption spectrophotometer and ion chromatograph. The cation content is measured by AA-7020 AAS spectrometer (produced by EWAI, Beijing, China). The anion content is measured using Metrohm-883 ion chromatograph (produced by Metrohm, Herisau, Switzerland).
Divalent ions such as Ba
2+, Ca
2+, Mg
2+ and Sr
2+ are detected in the immersion fluid after the shale sample particles are immersed in distilled water for a long time. The average contents of Ba
2+, Ca
2+, Mg
2+ and Sr
2+ in the granular soaking solution of 7 shale samples are 12.93 mg/L, 10.81 mg/L, 3.35 mg/L, and 0.65 mg/L. The content of HCO
3− in the immersion solution of core samples is 128.67 mg/L, and the content of SO
42− is 55.91 mg/L (
Table 4). The results indicate that there is permeability damage caused by the inorganic scale after the fracturing fluid enters the reservoir. At the same time, the flowback fluid is analyzed which comes from a shale gas well in Changning block, Sichuan Basin (No.8 of
Table 4). The fracturing fluids used in the experiments include 0.05% cleanup additive, 0.06% friction reducer, and 0.06% clay stabilizer and 0.3% KCL. The results of the ion test on the flowback fluid show that the contents of divalent ions such as Ba
2+, Ca
2+, Mg
2+ and Sr
2+ are 83.95 mg/L, 183 mg/L, 45 mg/L, and 55.65 mg/L, respectively. The anion content in the flowback liquid is mainly HCO
3−. There is no SO
42− ion in the flowback liquid, indicating that the SO
42− ion in the soluble salt can form inorganic scale precipitation with divalent cations. These deposits can further increase the shale formation damage during the imbibition and flowback of fracturing fluid.
5. Conclusions
The imbibition and flowback process of fracturing fluid in shales are investigated in laboratory by applying shale fracturing fluid imbibition and flowback experiments considering adsorbed methane and in-situ effective stress. In this work, the effects of shale multiscale storage and seepage space, methane adsorption, formation temperature, formation pressure, methane positive pressure difference and other factors on the imbibition and flowback of fracturing fluid are considered. The experimental results can more truly reflect the imbibition amount of fracturing fluid and the formation damage rate after flowback, and can also provide a reference for optimizing the shut-in time and developing a reasonable flowback plan for shale gas wells after fracturing.
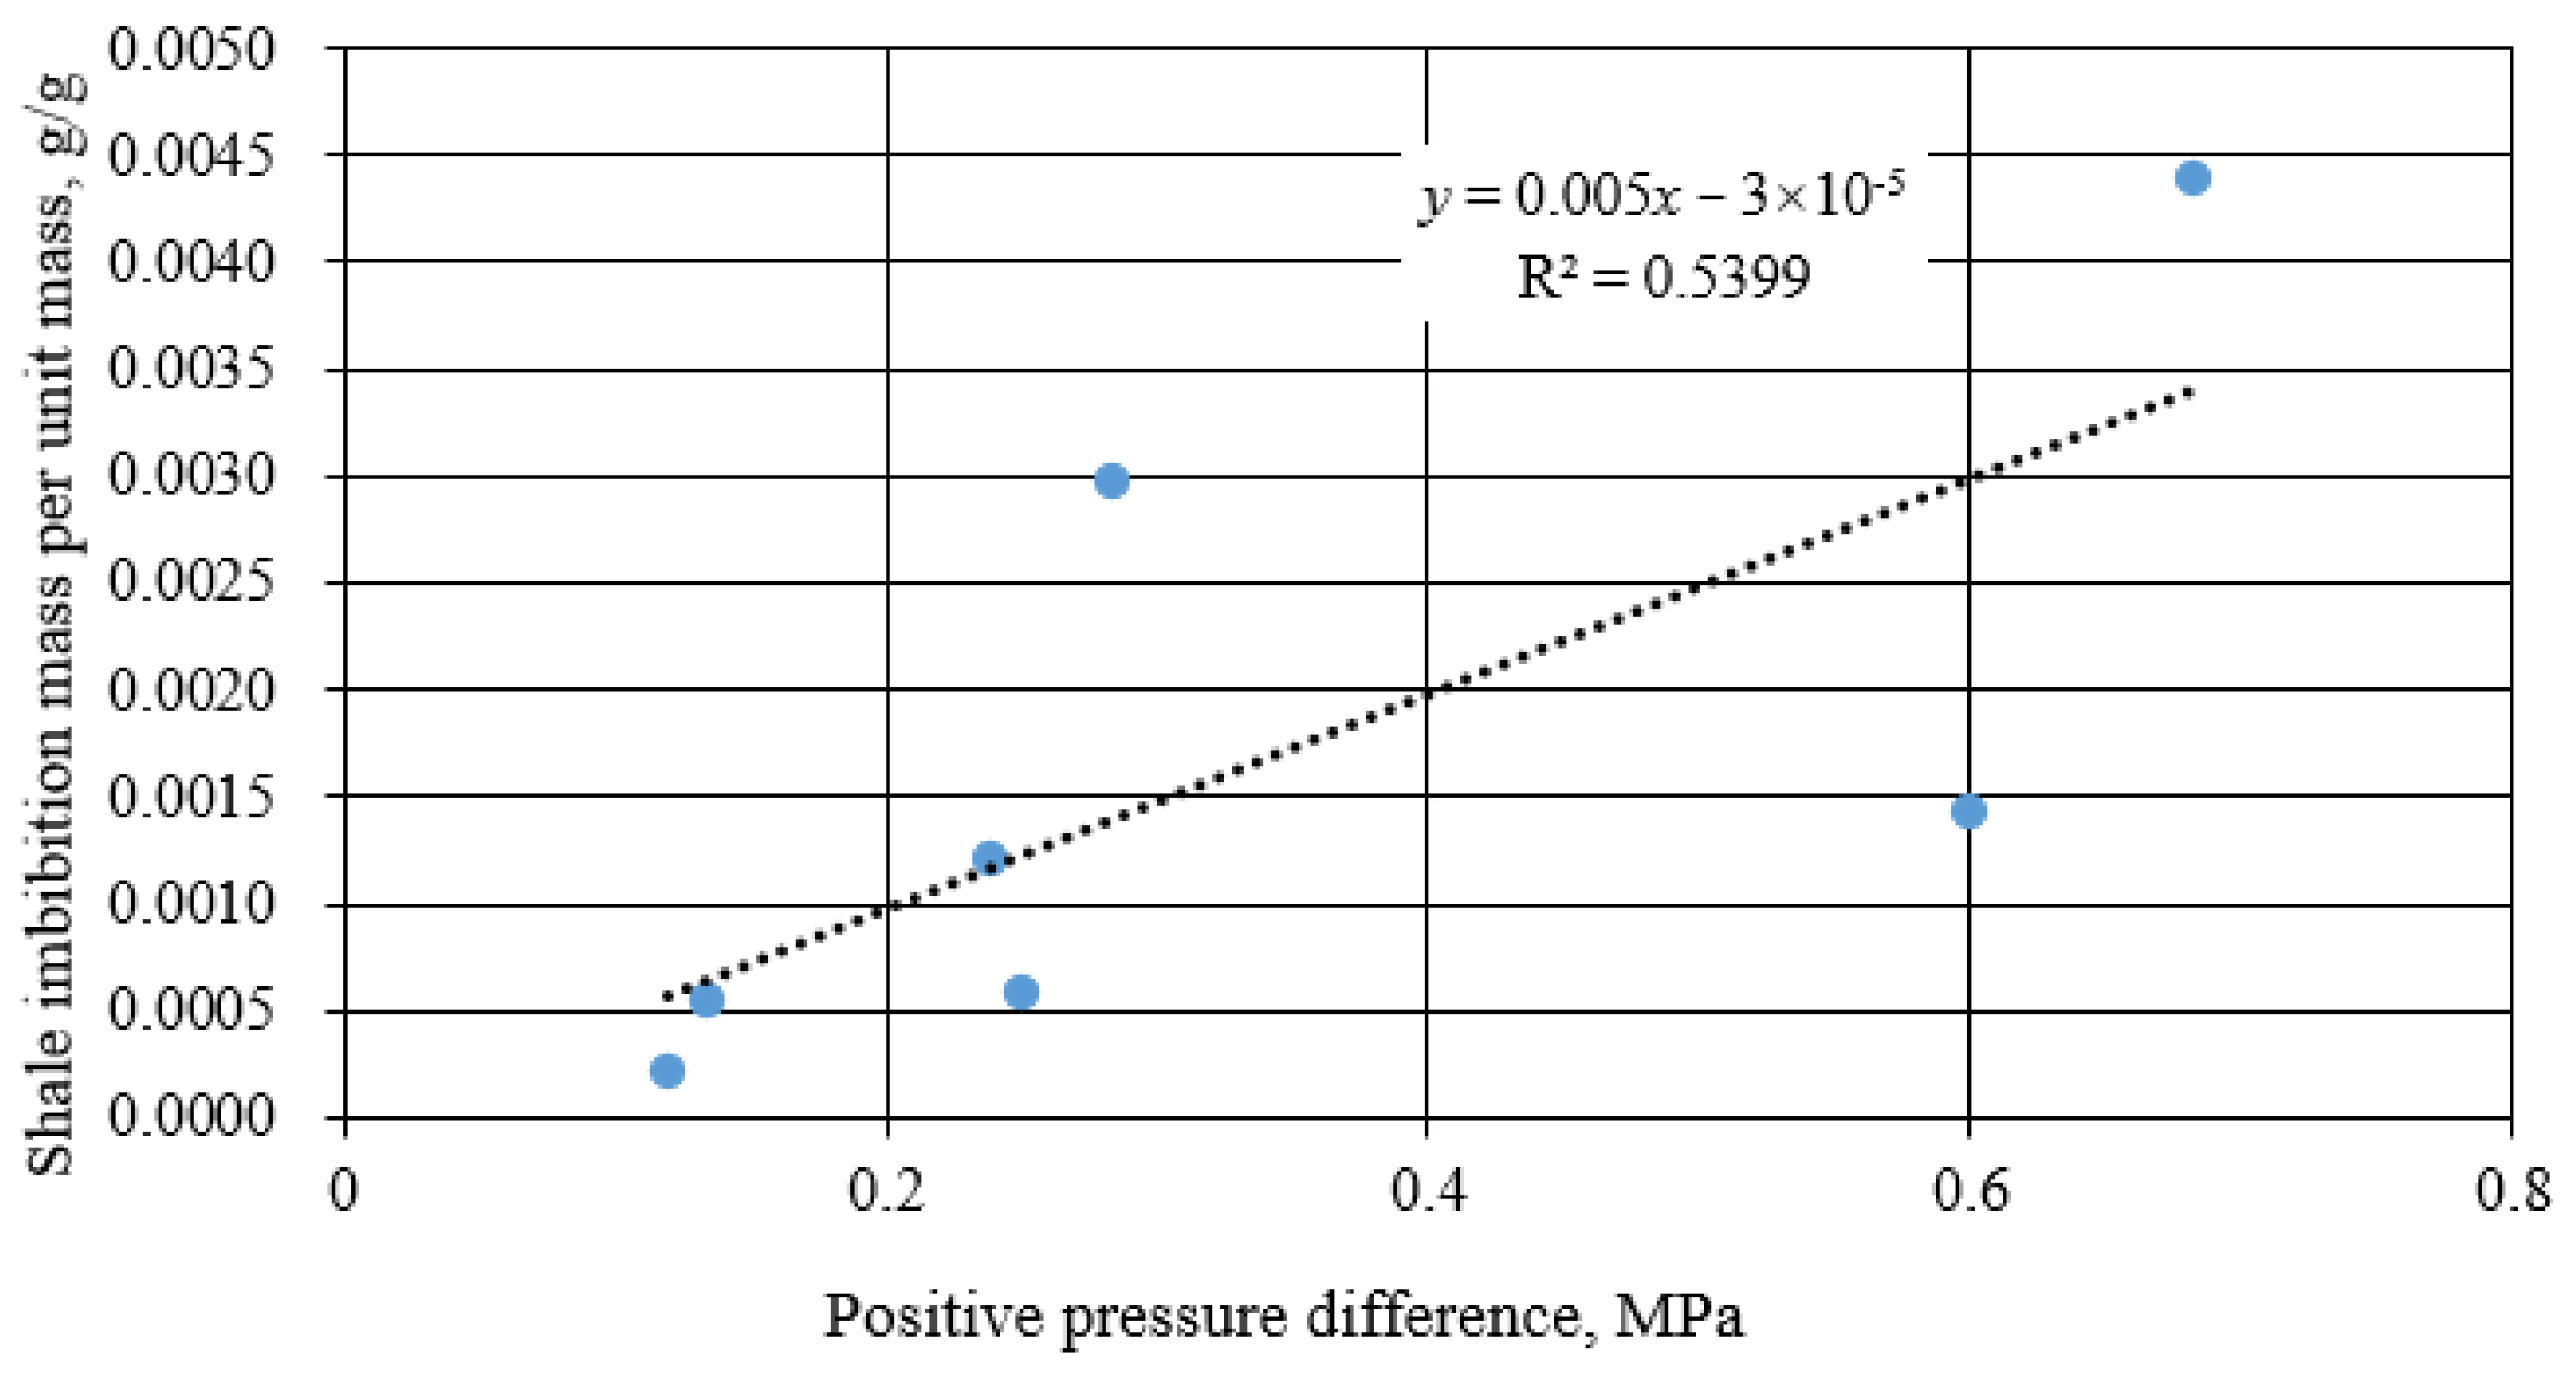
(1) The fracturing fluid imbibition mass range of unit shale mass is 0.00021–0.00439 g/g. The amount of fracturing fluid imbibition measured by the experimental results is far less than that without considering the confining pressure and adsorbed methane. The experimental results show that the in-situ conditions are the prerequisite for realistic simulation of fracturing fluid imbibition and flowback behavior.
(2) The aqueous phase imbibition of fracturing fluid is related to the positive pressure difference, and is also affected by other factors. With the increase of imbibition time, the amount of shale imbibed fracturing fluid increases rapidly at first, and then the growth rate slows down. The stage of rapid increase in imbibition mass is mainly due to the effect of imbibition of liquid in microcracks. When the liquid phase enters the nanoscale pores of shale, the imbibition rate becomes slower.
(3) The multiscale pore structure and pore surface properties of shales affect the flowback ability of fracturing fluids. With the increase of core densification, the recovery degree of core permeability after shut-in well flowback becomes smaller, that is to say, the core permeability damage rate increases. The critical flowback pressure difference of fracturing fluid is related to the initial permeability of shale. 0.01 mD and 0.001 mD are two critical initial permeability values for evaluating the permeability damage rate after shale fracturing fluid flowback.
(4) The experimental results are helpful to guide the development of fracturing fluid system with low formation damage and the formulation of a more scientific and reasonable well shut-in and flowback system. In the future, studies should focus on quantitative characterization of the methane displacement effect caused by fracturing fluid intrusion into shale formation. That would be more help to understand the influencing mechanism of fracturing fluid imbibition and flowback on the multi-scale transport of adsorbed gas in shale reservoir.

 ,
, 


