Article

Research on the Dust Diffusion and Pollution Behaviour of Dynamic Tunneling in Header Excavators Based on Dynamic Mesh Technology and Field Measurement

School of Safety and Emergency Management Engineering, Taiyuan University of Technology, Taiyuan 030024, China
*
Author to whom correspondence should be addressed.
Energies 2022, 15(23), 8945; https://doi.org/10.3390/en15238945
Submission received: 15 October 2022 / Revised: 21 November 2022 / Accepted: 23 November 2022 / Published: 26 November 2022

Abstract

:
In order to accurately characterize and evaluate dust particle diffusion in the dynamic tunneling process of a boring machine, this study considers the 31,116 main transport chute heaving face of the Lijiahao coal mine as a case study. A dynamic tunneling model is developed considering the real dynamic tunneling state of the header, to carry out an in-depth analysis of the spatial and temporal evolution of wind flow and dust dispersion in the tunnel under dynamic excavation. In addition, the results were compared against the calculations of a static standard excavation model of a conventional header. Employing CFD analysis accompanied by field measurements, it was highlighted that the dynamic tunneling of the header leads to an increase in the pressure difference and the turbulent kinetic energy at the working face. Moreover, an increase in the number of vortices was reported, and a higher concentration of dust spreads more quickly along the return wind side wall to the return flow area. On the other hand, the high concentration of dust under the standard tunneling model was found to accumulate a lot on the return wind side. Simultaneously, as the distance between the pressurized air outlet and the working face increases, the average wind speed in the vortex-type wind flow area at the front of the tunnel decreases. When t = 60 s, the return flow area expands to a space of 8 m~24 m from the head, and the dust accumulated above the header spreads to the back of the header to form a high concentration dust region of more than 500 mg/m³. It was shown that the range of high-concentration dust clouds in the breathing zone decreases compared to the results of the standard tunneling model. Moreover, the dust concentration in the breathing zone of the driver is significantly lower than that reported by the standard tunneling model. Based on the results of the field test, the average error between the simulated and measured data of the dynamic tunneling model was calculated to be around 6.46%, thus demonstrating the model’s capability in describing the real working conditions of the heave tunnel.

1. Introduction

Being the resource with the highest share of China’s energy supply, coal has made a huge contribution to the country’s industrial development and social progress. Due to the increasing automation and robotization of coal mining nowadays, the issues of dust pollution in underground tunnels have become more serious [1,2]. It was reported that if no dust reduction measures are taken, dust at the working face can be as high as 2–3 g/m3, which seriously reduces visibility and causes great pollution in the working environment [3,4,5,6]. This in turn leads to an increase in the rate of pneumoconiosis among miners, which has been increasing year after year, and thus seriously threatens the lives and health of workers onsite [7]. As highlighted in Figure 1, according to data published by the National Health and Wellness Commission, new pneumoconiosis cases accounted for up to 84.19% of the total occupational cases in 2020 [8,9].
The study of the spatial and temporal evolution of air flow and dust in the heaving tunnel, as well as the investigation of the theoretical basis for the regulation and control of the ventilation and dust removal, are necessary in order to effectively address the issue of dust pollution in the working environment, and the health risks of workers at the heaving face.
Currently, the dust dispersion pattern of header workings is mainly explored through field sampling, actual measurements, and experimental analysis [10,11]. However, due to the complex operating conditions and geological environment, many complex working locations cannot be measured, and thus comprehensive data cannot be obtained. It is also a complicated task to simulate the complex field conditions in the laboratory to obtain accurate dust dispersion patterns. Therefore, and due to the recent advancements in computer tools and software development, numerical simulation is regarded as a practical and feasible technique for simulating excavation face working conditions and assessing dust dispersion.
Furthermore, the use of numerical simulations and analysis can more easily predict and simulate the complex working conditions of the excavation face and visualize the dust dispersion. In this context, a large number of scholars conducted numerical simulations to study the ventilation and dust transport patterns of the roadways [12,13,14,15,16]. Wang [17] investigated the two-phase gas-solid flow theory using the CFD-DEM model in Fluent. The study examined the spatial and temporal dust pollution legislation and the dust cleaning technology of the tunnel head spray. The particle size distribution of the spray atomization at six different water pressures from 0.5 to 5 MPa was also studied. As a result, the optimal pressure and angle of the spray were determined. Moreover, field tests were conducted, and a dust reduction rate of up to 90% and a respiratory dust reduction rate of up to 85% were applied to reach a new level of dust control technology in the tunnel.
In a connected study, Cai et al. [14] compared the dust dispersion law under different extraction volumes and barrel heights, considering both long-pressure and short-pump ventilation conditions. It was found that when the pressure air volume remains constant, the dust dispersion distance decreases as the extraction volume increases. In addition, as the barrel height increases, the dust dispersion distance first decreases and then increases. The study also determined the extraction volume and barrel height with the best dust. Jiang et al. [18] studied the air flow and dust pollution patterns of pressurized ventilation with long pressure and short-extraction ventilation (dust extraction fan with header) under nine different dust sources by combining similarity tests and numerical simulations. Based on the investigation carried out, the removal efficiency was found to reach up to 93% when the dust extraction fan with the header was turned on, demonstrating that it could efficiently control dust pollution on the header face. In addition, Jiang analyzed the transport and settlement rules of dust particles on the working face under four different environmental parameters at altitude. As a result, the optimal diameter-axis air volume ratio and pressure-pumping ratio were highlighted under the combination of a dust removal fan and dust control of the attached wall duct at the high-altitude mine [19]. The remeshing dynamic mesh model is also used to analyze the dust mass concentration distribution and particle size distribution in the working area, when the cutting head is in different process positions.
Furthermore, Li [20] considered the principle of full-section cyclonic air curtain dust control and employed numerical simulations to study a method of dust removal by combining wall cyclonic ventilation with air curtain dust control. The study analyzed the effect of different widths and lengths of the wall air cylinder strips on the dust removal effect of the system. As a result, the optimal wall air cylinder strip parameters were determined. Moreover, the study compared the dust concentration before and after the opening of the air curtain with field measurements.
Hua et al. [21,22,23] employed the Fluent software to examine the dust removal effects of two ventilation strategies, long-pressure and short-pump ventilation and press-in ventilation, in the comprehensive excavation face of the rock tunnel. In the investigation, they used MATLAB programming to calculate the spatial and temporal evolution process of dust in the comprehensive excavation road. As a result, they developed a multi-radial cyclone wind control dust removal method to compare dust removal on the road under different multidirectional cyclone wind curtain generators with the distance from the digging head and axial pressure air volume. A more detailed study of multi-directional cyclonic air curtain dust control was also carried out. The dust reduction effect of six types of wind curtain generator positions and the lower rock tunnel were compared. Additionally, the best ventilation dust reduction parameters were determined. Using simulation software, Yin et al. [24] improved the press-in air curtain’s ability to control dust on the comprehensive excavation face by adjusting three ventilation parameters: the height of the air curtain at the bottom of the plate; the degree of the air curtain at the press of the closest coal wall; and the length of the air curtain from the working face.
In another study, Yang [25] studied the effects of different sides’ exit airflow dispersion angles α, angle β and the diameter-axial airflow ratio γ on the dust field. In the study, the gas-solid two-phase flow theory was employed to construct a finite element model of the dust dispersion, in addition to the reasonable control range of each control parameter under mixed ventilation. The authors then proposed a modular airflow diversion system and dust control technology to solve the problem of the unreasonable configuration of mixed ventilation airflow parameters in the tunnel. Moreover, Lu [11] simulated the tunneling process under cutter rotation based on the sliding mesh model (SMM) and the multiple reference frame (MRF) model in Fluent based on the dynamic rotation of the real cutter head. The study is considered one of the first investigations into the theory of an additional airflow field caused by the rotating cutter, revealing the impact of the cutter on dust dispersion in the tunnel under various rotation speeds.
The studies mentioned above provide a solid foundation for understanding dust transport laws at the heaving work face. However, the block of studies in the literature concentrates on the dust pollution mechanism when the header is kept relatively stationary with the working face and the wind barrel. On the other hand, the research on considering and evaluating the effect of the real movement speed of the header on the dust diffusion distribution law is still missing. In order to describe the most realistic dust diffusion phenomenon during the excavation process, the dynamic advancement of the header movement and the working face is a key technical aspect to be investigated. At the same time, during the actual operation of tunneling tunnel workers, the digging surface will keep advancing with the header under one shift operation time (about 8 h). However, the position of the wind pipe remains unchanged, i.e., the distance of the wind pipe from the header is in the process of becoming larger. With the dynamic progress of the header, the dust source also changes dynamically, and as the distance between the working face and the wind tunnel increases, the effect of the round-hole jet of the pressurized wind from the wind tunnel on the airflow of the header part of the header changes, therefore having an impact on dust movement during excavation.
Therefore, in this paper, the dust movement phenomenon under the condition of header excavation movement will be studied based on the dynamic mesh technology and the discrete phase particle tracking technology. In addition, the effect of changing the flow field caused by the header and the working face movement will be considered. Then, the dust dispersion characteristics at a certain header advancement speed will be evaluated and compared with the results of the traditional model of the header, the working face, and the duct relative static model. Based on the comparison, the differences and similarities between the vortex zone, the turbulent kinetic energy inside the tunnel, and the high dust concentration zone generated by the header dynamic advancement, are highlighted.

2. Mathematical and Physical Modeling

2.1. The Establishment of the Physical Model

2.1.1. Physical Model

The physical model of the heaving face is established in the SolidWorks software by considering a 1:1 equal scale, as shown in Figure 2. The 31,116 main transport chute heaving face of the Lijiahao coal mine of Baotou Energy is considered in this study as the research object. The cross section of the tunnel is rectangular, with the following dimensions: 45 m × 5.5 m × 3.8 m (length × width × height). The maximum absolute gas outflow at the header is 0.34 m3/min, which is considered a low gas mine. The pressed-in ventilation system is used to supply air to the working face. The wind pipe is located at a radius of 0.5 m on the left side of the direction of the header, at 0.25 m from the side wall of the tunnel, with the central axis at 2.9 m from the ground. The length of the header is 8 m, the width is 3 m, and the height is 2.2 m. The coordinates of the driver’s position are X = 0.5 m, Y = 1.5 m, and Z = 6 m, where the distance from the air outlet of the air duct in the Z direction is 5 m. This distance gradually becomes larger as the header digs forward. The frontmost coal wall of the model is the working surface and will continue to dig forward with the header and its surrounding fluid domain. So, the fluid domain behind the header working surface becomes larger. Furthermore, the computational domain is created by Boolean operations using SpaceClaim and then imported into ICEM to divide the mesh. The 3D model is depicted in Figure 2 with the X direction pointing from the pressurized air cylinder to the right wall of the tunnel; the Y direction pointing from the bottom of the tunnel to the top of the tunnel; and the Z direction pointing from the coal wall to the exit end of the tunnel.

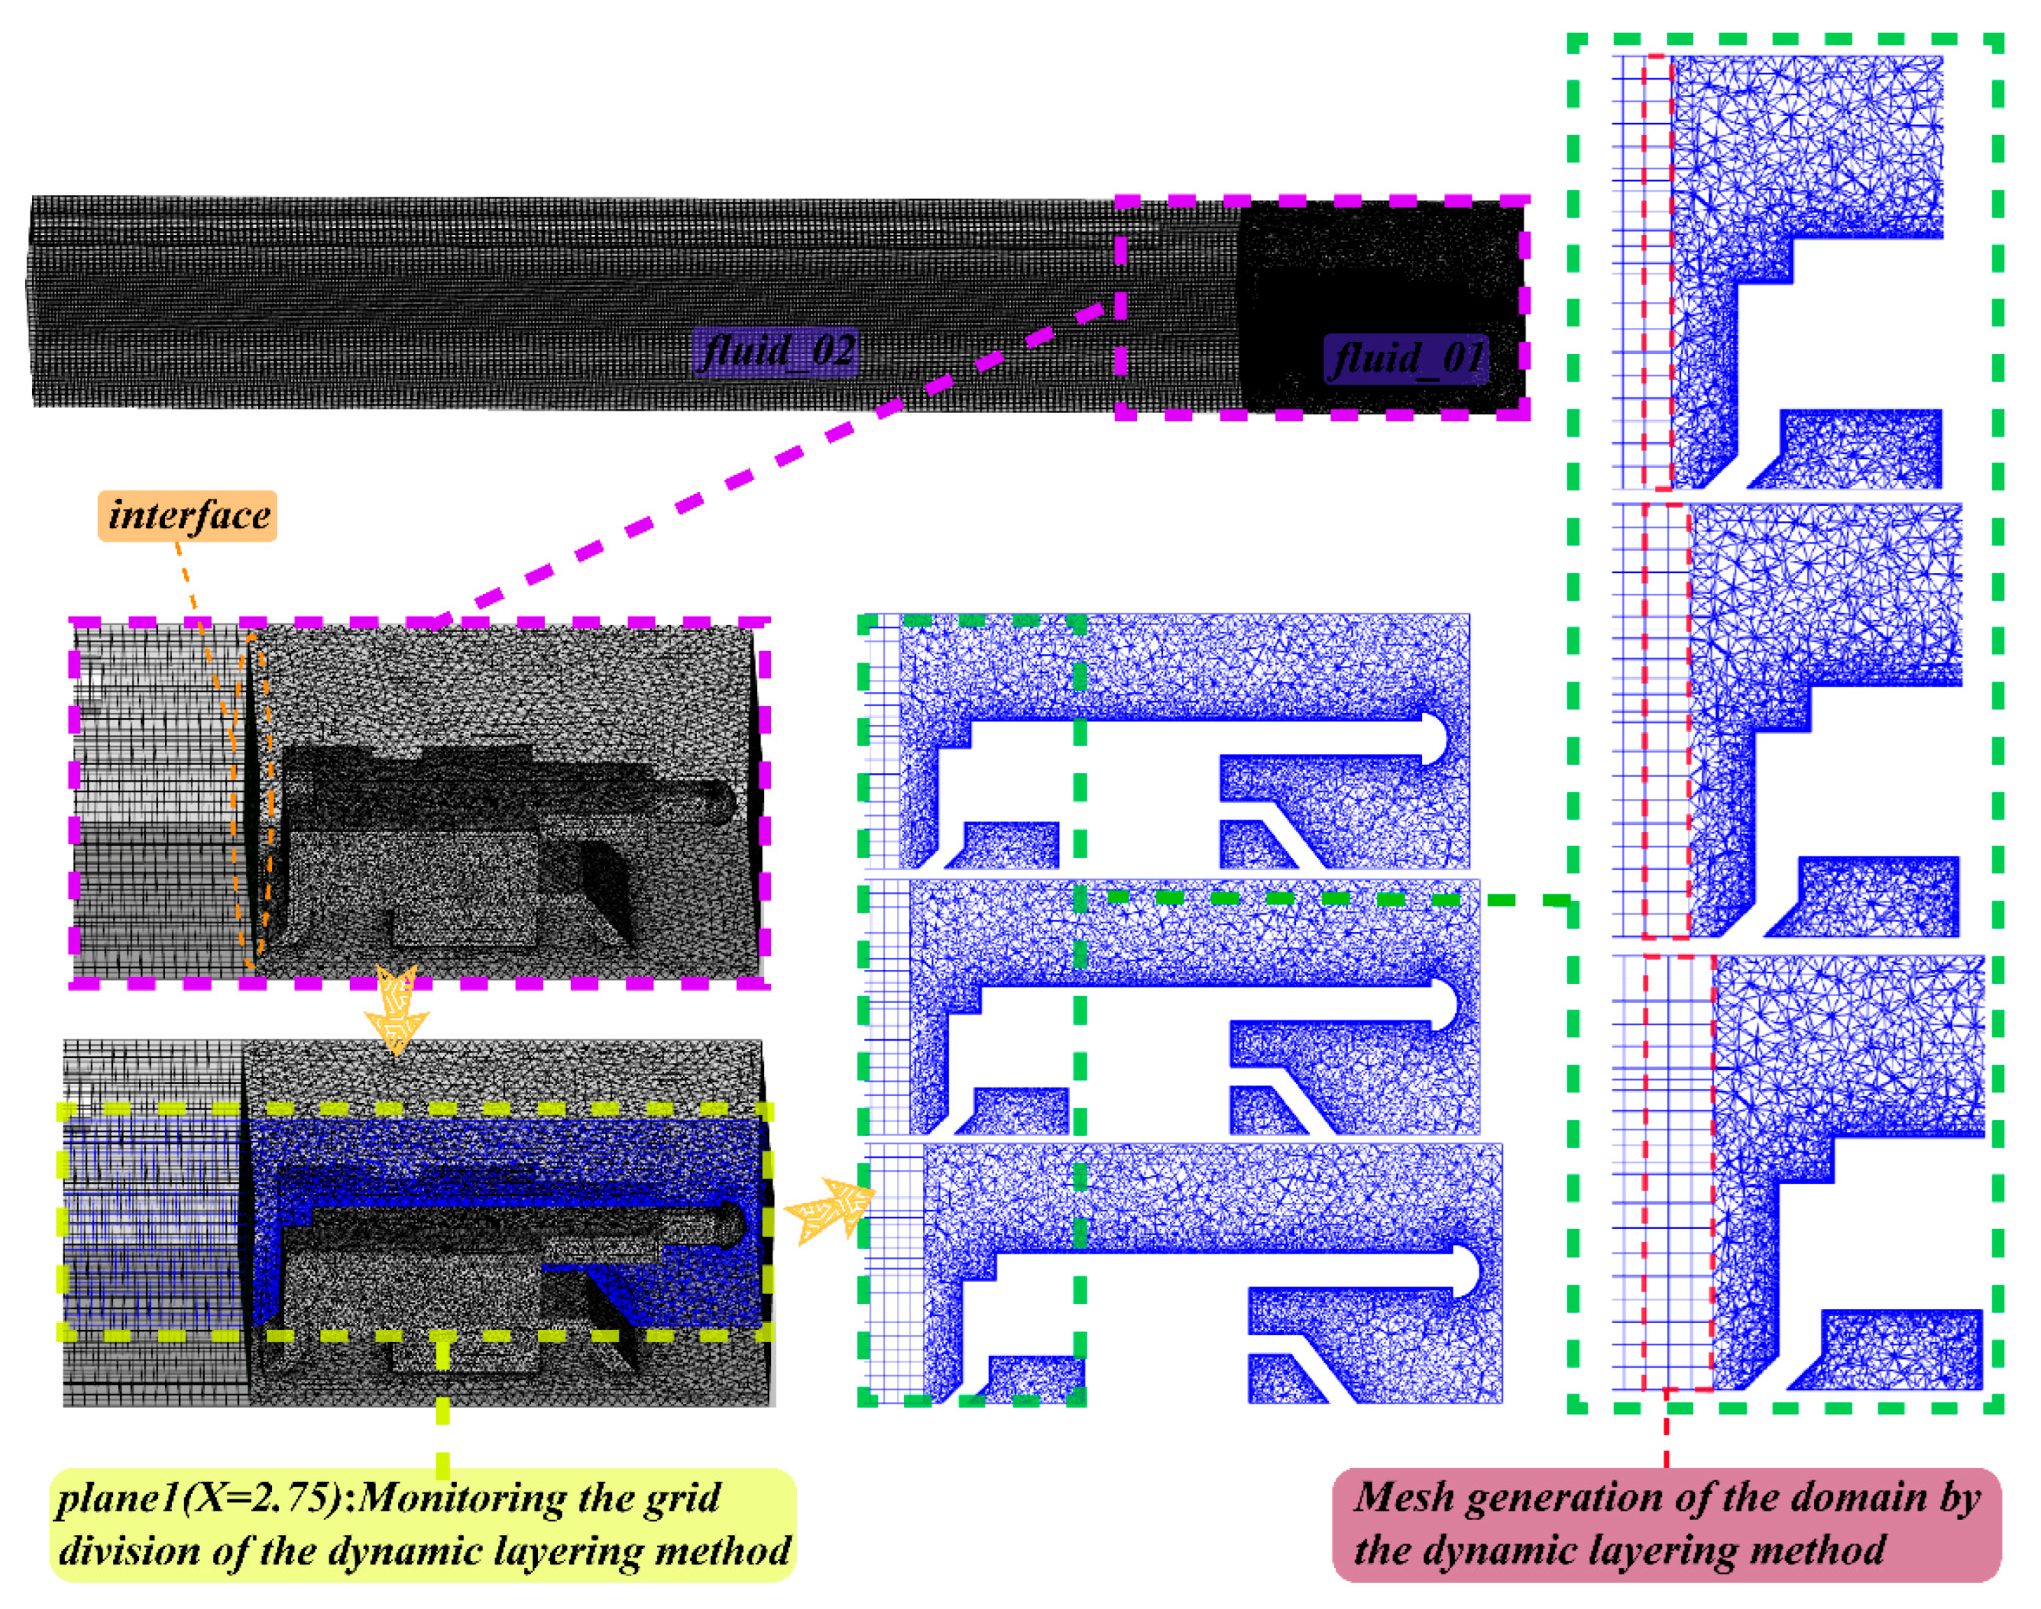
2.1.2. Mesh Independence Test

In numerical analysis, the quality of the mesh determines the computational efficiency of the model and the accuracy of the simulation results. Thus, a high-quality mesh is very important. Considering that the combination of the dynamic mesh model and the Discrete Phase Model (DPM) requires a large computational volume, a combination of a tetrahedral unstructured mesh and a hexahedral structured mesh is employed in this study for the meshing method. Nevertheless, the fluid domain is divided into two parts by ICEM partitioning, Fluid_01 and Fluid_02. The first 9 m of the heald tunnel is set as Fluid_01 and the remaining space of the heald tunnel is set as Fluid_02. For those two parts, a total of 552,308 hexahedral meshes are obtained by dividing them into blocks and setting the local mesh size to 0.1 m and 0.04 m, respectively. To ensure the quality of the mesh around the header under the rigid body movement of the dynamic mesh, the boundary layer of the header is optimized and encrypted using the inflation method to obtain a total of 1,043,923 tetrahedral meshes and 1,596,231 meshes for the header tunnel model, as shown in Figure 3.
When specifying the ratio of the cell volume to the side length, the mesh quality is a crucial parameter in evaluating the feasibility of the mesh. As shown in Figure 4, 99.8% of the mesh quality of the model is distributed between 0.52 and 1, with only 1580 meshes having a quality of 0.4–0.52. Meanwhile, the mesh quality report in the Fluent (18.0) solver shows that the orthogonal degree quality in the model is also greater than 0.4015, demonstrating that the generated meshes can complete the dynamic mesh model and DPM model with higher quality.
In addition, the greater the number of grids, the greater the degree of encryption, and the greater the computational accuracy when utilizing the same division method and the local encryption method for regions with large changes in physical values. However, when the number of grids increases above a certain critical range, the improvement in the computational accuracy is no longer significant and the consumption of computational resources is huge. Therefore, the grids cannot be encrypted indefinitely and it is necessary to determine a reasonable level for the number of grids, as highlighted in Figure 4. This work divides three grids quality degrees: low (Mesh I 964275), medium (Mesh II 1596231), and high (Mesh III 2167302) by ICEM.
Two monitoring lines were set up in the model: one in the back of the header with (X = 0 m, Y = 1.5 m, Z = 9 m) and (X = 5.5 m, Y = 1.5 m, Z = 9 m) as endpoints, and the other on the return side with (X = 5 m, Y = 1.5 m, Z = 0 m) and (X = 5 m, Y = 1.5 m, Z = 45 m) as endpoints. As shown in Figure 5, the wind speed of the three considered grids has a similar trend, and the average wind speed of the three mesh grids in the first monitoring line is 0.63, 0.57, and 0.55.
In the second monitoring line, the change trends of mesh grids I and III are basically the same, while mesh grid I shows a slight increasing trend in Z = 40 m~45 m and an opposite decreasing trend to the one followed by mesh grids II and III. Based on the results of the mesh independence test, the mesh number 1,596,231 was selected as the mesh model for the computational analysis in this article in order to guarantee the accuracy of the simulation findings and to conserve computational resources.

2.1.3. Setting of Boundary Conditions

In terms of the boundary conditions, the fundamental wind flow parameters were set in conjunction with the actual air circulation circumstance of the 31,116 synthesis tunnel, with a pressure air cylinder pressure air volume of 470 m3/min. In the investigation and analysis of the actual dust production at the heaving face, dust is released from the cut-off head with a mass flow rate of 0.01 kg/s.
Q m = k c v A
where   k is the scale factor, defined as the ratio of simulated to real concentration at the same coordinate position,   c is the dust concentration in kg/m3 ,   v is the velocity of wind flow in m/s and   A is the cross-sectional area of the roadway in m2.
In order to determine the DPM dust particle parameter settings in the later simulations and to analyze the particle size of the dust collected from the 31,116 excavation face of Lijiahao coal mine, this paper uses the existing laboratory instrument WKL-722 dust dispersion tester to test the extracted dust. The images of the dust particles sampled and the dust particle size distribution were observed under the electron microscope, as shown in Figure 6.
According to Table 1, it can be seen that the dust particle size of the digging working face is basically below 100 μm, and the dust between 5 and 100 μm only accounts for 25.1% of the total dust. The cumulative distribution of dust (perimeter equivalent particle size <5 μm) is 74.9%. Accordingly, the maximum particle size of 100 μm and the minimum particle size of 1 μm are set as the parameters of the numerical simulation dust source in this paper, and the Rosin-Rammler function is used. See Table 2, Table 3 and Table 4 for specific parameter settings.
The wall of Fluid_01 is defined as’ Deforming’ in order to keep the overall basin shape of the header and the working surface moving forward without deformation, and the Layering body mesh regeneration method based on constant height is used. To speed up mesh iteration, the default settings for the separation factor and the collapse factor are set to 0.6 and 0.4, respectively [26,27]. As shown in Figure 7, the process of Layering body mesh iteration for the header and the surrounding watershed can be seen based on the mesh variation of plane 1 at X = 2.75 m selected.

2.2. The Establishment of the Mathematical Model

The airflow in the underground heaving tunnel is dominated by the round-hole jet generated by the pressure and extraction cylinder, which belongs to the turbulent flow with a high Reynolds number. Therefore, to describe the continuous medium flow field and the diffusion of dust particles in more detail, the standard k-epsilon model (k-ε dual) is used.

2.2.1. The Motion Equation of Airflows

The equation model in the Euler coordinate system is used to describe the gas continuous phase diffusion law [28]. In order to simplify the model to optimize the calculation volume, the effect of temperature during the tunneling process of the integrated tunnel is ignored. Therefore, only the momentum equation and the continuity equation are solved, and the solution of the energy equation is not required. The Reynolds time-averaged Navier-Stokes equation is obtained by converting the flow variables into the sum of the average and pulsation components based on the effect of pulsation. Moreover, the indicator symbols in the stress tensor are introduced to rewrite the continuous phase diffusion law to facilitate computational analysis. The momentum equation is rewritten into the tensor indicator form of the time-averaged continuous equation and Reynolds equation [29,30], i.e., Equations (2) and (3).
ρ f t + x i ( ρ f u i ) = 0
t ( ρ f u i ) + x j ( ρ f u i u j ) = p x i + x j [ ( μ f + μ t ) ( u i x j + u j x i ) ]
where ρ f is density of the fluid, kg/m3; u is airflow speed, m/s; x is the coordinate of X, Y, Z direction, m; l ˙ is the tensor symbol, taken as 1, 2, 3; j is the tensor symbol, taken as 1, 2, 3; μ f is the laminar viscosity coefficient, Pa·s.
Nevertheless, the Navier-Stokes equations cannot accurately describe the details of turbulent motion in the tunnel due to the nonlinear analysis based on the current calculation conditions. These are based on the complex environment of the tunneling operation and the strong turbulence effect of the gas-phase flow field in the local area. Considering that dust is influenced by wind flow as well as the joint influence of roadheader, conveyor, and duct in the tunnel, the standard k-epsilon model is adopted in this study (model of k ε two-sided equation model). Such a model is widely used in research into coal mine ventilation engineering. The corresponding Equations (4) and (5) introduce both turbulent kinetic energy (k) and its turbulent dissipation rate ( ε ) of the transport equation [31,32].
( ρ f k ) t + ( ρ f k u i ) x i = x j [ ( μ f + u i σ k ) k x j ] ρ f ε + G k
( ρ f ε ) t + ( ρ f ε u i ) x i = x j [ ( μ f + u i σ ε ) ε x j ] C 2 ε ρ f ε 2 k + C 1 ε ε k G k
In Equation (4), the turbulent dissipation rate   ε is defined as:
ε = μ f ρ f ( u i x k ) ( u j x k )
In addition, the turbulent viscosity is expressed in terms of the turbulent energy k and the turbulent dissipation rate ε as a function of:
μ t = ρ f C μ k 2 ε
The turbulent Kinetic Energy k based on the average velocity gradient Generation G k :
G k = μ t { 2 [ ( u x ) 2 + ( v y ) 2 + ( w z ) 2 ] + ( u y + v x ) 2 + ( u z + w x ) 2 + ( v z + w y ) 2 }
The empirical constants   C 1 c = 1.44 and   C 2 c = 1.92 and the Prandtl numbers   C μ = 0.09, σ k = 1.00 and σ ε = 1.3, corresponding to the turbulent kinetic energy k and turbulent dissipation rate ε, were obtained based on the recommended values by Launder combined with subsequent experimental verification.

2.2.2. The Motion Equation of Dust Particles

The dust particle size generated by the roadheader during the tunneling process is small, as is the initial velocity given by the cutter head. The cutoff point in the coal wall is mainly affected by the random diffusion of the wind flow, which manifests itself as the discrete phase driven by the turbulent phase continuous flow field in the header tunnel [33,34]. Therefore, the DPM model using the Euler-Lagrange method can describe the diffusion trajectory of dust particles. Based on the weight balance of the dust particle mass point in the Lagrange coordinate system, the dust differential equations are obtained and given by Equations (9) and (10) [35].
m p d u p d t = F = F D   + F P   + F G   + F M + F S  
d u p d t = F D ( u f u p ) + g ( ρ p ρ f ) ρ p + F P   + F M + F S  
F D = m p u f u p τ r = m p 18 24 ρ f ρ p C D d p u f u p ( u f u p )
τ r = ρ p d p 2 18 μ f 24 C D R e
R e = ρ f d p u f u p μ f
C D = {       0.44 R e > 1000 24 + 3.6 R e 0.687 R e R e 1000
m p is the particle mass,   u f is the fluid phase velocity in m/s, u p   is the dust particle velocity in m/s, μ f is the molecular viscosity coefficient of the fluid, ρ p is the discrete phase particle density in kg/m3,   ρ f is the gas phase fluid density in kg/m3, d p is the particle diameter in m, and R e is the relative Reynolds number. As determined by the Reynolds number range in the turbulent flow region of the heaving workface, C D [17] is the drag coefficient. Based on the Reynolds number range in the turbulent zone of the header, the Reynolds number is calculated.
F P   = 1 6 π d p 3 P l
F G   = 1 6 π d p 3 ( ρ p ρ f ) g
F M = 1 8 π d p 3 ρ f ω   ( u f u p )
F S   = 1.61 d p 3 ρ f μ f ( u f u p ) d u p d y
u p = r w p = r × 2 π n 60
F D   is the dragging resistance force [36],   F P   is the force of the pressure gradient, P l is the pressure gradient along the flow direction,   F G   is the combined force of gravity and buoyancy, F M   is the Magnus force, F S   is the Saffman force,   r is the radius of the cutting head of the integrated roadway in m, w p is the angular velocity of the cutting head in m/s, and n is the speed of the cutting head in r/min. It is noted that the speed of the wind flow in the drilling head of the integrated roadway is much greater than the speed of the dust movement. In this regard, the force of the wind flow on the dust becomes a positive value, leading to the acceleration of the dust under the wind flow. With the focus being on the gravity and buoyancy of the dust particles, other parameters of lower orders of magnitude could be ignored, such as the drag. Ignoring forces of smaller magnitude such as the drag, Equation (10) (in the x-y direction) can be rewritten as [37]:
d u p x d t = ( u f x u p x ) τ r
d u p y d t = ( u f y u p y ) τ r + g
u P 0 = ρ g g d p 2 18 μ
Solving the differential equations above leads to:
u p x = u f x ( u f x u p x ) e t τ r
u p y = u f y ( u f y u p y ) e t τ r u P 0
The velocity expression is integrated over time to obtain the displacement of the dust in the x and y directions at time t as highlighted in Equations (25) and (26).
s p x = u f x t + τ r ( u f x u p x ) e t τ r
s p y = u f y t + τ r ( u f y u p y ) e t τ r + u P 0 t

2.2.3. Dynamic Mesh Model

Unlike the common static dust source diffusion simulation in the header face, in the real header tunnel motion excavation process, the header and the header cutter head are moving rigid bodies, and the position of the dust source is changing in real time. Thus, the static mathematical model is not capable of accurately simulating the actual tunneling working conditions of the underground header due to the process dynamics. Considering that, the use of a dynamic mesh model is a necessity for the real digging nonconstant flow field calculations.
The header’s rigid body motion, the coal wall’s boundary motion over time, and the process of the entire roadway as the header moves forward and the computational fluid domain enlarges over time may all be accurately described by the dynamic mesh model. The mesh variation in the non-constant computational watershed requires consideration of the time-varying terms of the conservation integral equation. In this regard, the general scalar control equation in the dynamic mesh model is modified based on the effect of the variation of the mesh coordinates on the control equation in the Eulerian coordinate system as highlighted in Equation (27) [37].
d d t V ρ f ϕ d V + V ρ f ϕ u u g d A = V Γ ϕ d A + V S ϕ d V
V is the control volume V as the boundary of motion, ρ f is the fluid density, and S ϕ is the scalar ϕ the source term of Γ the dissipation coefficient, u is the velocity of fluid motion, u g is the velocity of motion of the dynamic mesh. The time derivative is processed using first-order differences to obtain the differential equation (n and n + 1 denote the current time and the next time forward).
d d t V ρ ϕ d V = ( ρ ϕ V ) n + 1 ( ρ ϕ V ) n Δ t
In connection to the fluid domain I (Fluid-01) header and grid motion are rigid, so all of its grid cells maintain their original shape and volume [38], where the fluid domain II (Fluid-02) is the deformation region where the volume increases. As a result, in accordance with the conservation law, the time differentiation of the changing control volume is given by:
d V d t = V u g d A = j n f u g , j A J
u g , j A j = δ V j Δ t
n f is the number of outer surfaces of the control volume, A j is the number of j faces of the surface, V j is the face of the control volume j at the time step Δ t which is the volume swept through the volume and u g , j A j is the integral point of the control surface. The time derivatives are again processed using second-order differences to obtain (n − 1, n, and n + 1 denote the time at the previous moment, the current time, and the time at the next moment, respectively) the differential equation as:
d d t V ρ ϕ d V = 3 ( ρ ϕ V ) n + 1 4 ( ρ ϕ V ) n + ( ρ ϕ V ) n 1 2 Δ t
( u g , j A j ) n + 1 = 3 2 ( u g , j A j ) n 1 2 ( u g , j A j ) n 1 = 3 2 ( δ V j δ t ) n 1 2 ( δ V j δ t ) n 1
( δ V j δ t ) n and ( δ V j δ t ) n 1 [39] are the volume sweep of the control body surface at the current time and the next time instant, respectively. Considering the mesh in part of the domain as a whole motion, the same effect on the conservation equation is exhibited. There is no change in the control body mesh in fluid domain II by the top-layup method, so the control equation here can be simplified to:
V n + 1 = V n
d d t V ρ ϕ d V = ( ρ ϕ ) n + 1 ( ρ ϕ ) n V Δ t
j n f u g , j A j = 0

3. Analysis of the Airflow and Dust Simulation Results

The real wind flow-dust transport phenomenon in the underground header workface is a very complicated process. This study adopts two different models for comparison and analysis in order to better analyze the dust spatiotemporal evolution law during the dynamic tunneling of the header. The first group is the “dynamic tunneling model” (abbreviated as DTM) under the dynamic mesh model, and the other group is the “standard tunneling model “(abbreviated as STM) without considering dynamic mesh modelling. The analysis carried out is combined with the CFD-Post software to visualize the spatial and temporal progression of wind flow and dust pollution.

3.1. Distribution Characteristics of the Wind Flow Field

In order to more thoroughly compare and analyze the airflow transport in the excavation tunnel under the two considered models, five monitoring surfaces (1#~5#) are set up for each model. 1#~2# monitoring surfaces are in the working area of the roadheading machine, where 1# monitoring surface is in the location of the excavator cutting head and 2# monitoring surface is in the section where the driver is located. These two monitoring surfaces can highlight the complex vortex field in the working area of the excavator. In addition, 3# monitoring surface is located in the position of the wind cylinder exit, while 4# and 5# monitoring surfaces are placed on the back side of the wind cylinder exit position. The 4#~5# monitoring surfaces are pressed into the wind cylinder exit back side at a 5 m and 10 m position, respectively, as shown in Figure 8, Figure 9 and Figure 10, highlighting the wind flow traces and the cross-section vector diagram of the monitoring. As most of the airflow speed in the tunnel is less than 8 m/s, to better describe the situation of wind flow transport, the maximum display value of the rainbow column of wind speed is set to 8 m/s, where a wind speed greater than 8 m/s is displayed in red.
Figure 8 depicts the wind flow diffusion pattern inside the excavation tunnel under the dynamic excavation model. Based on the reported findings, the process can be highlighted by the following notes:
(1) A high-speed airflow of 8 m/s is pumped out from the pressurized air outlet and then flows at a high speed against the wall near the pressurized air cylinder of the roadway. The negative pressure formed by the pressurized air flow continuously increases the low-kinetic energy airflow around the pressurized air outlet. The high speed airflow moves towards the head of the header of the tunnel with decreasing kinetic energy, and the maximum wind speed decreases to 7.5 m/s and 6.2 m/s, respectively, when it passes the position of 6 m and 2 m from the working face. Moreover, it hits the rock wall of the heaving face at a faster speed, breaking the continuity of the airflow and drastically reducing the wind speed to 1.5 m/s~3 m/s.
(2) In the area 8 m from the heaving face, due to the blockage of the digging head, the high-speed pressurized airflow is divided. Part of the airflow is then subjected to a transverse velocity gradient towards the roadway’s +X wall, adhering to the roadway wall and flowing towards the roadway’s +Z direction. The rebounded airflow with low kinetic energy is sucked up by the pressure air outlet, which increases as the distance from the pressure air outlet decreases. The airflow will then form a lateral vortex in the jet field 0 m~1.8 m away from the roof of the tunnel. In the meantime, as the header digs forward (-Z direction), the vortex airflow field above the header will also shift in the -Z direction. This is accompanied by the higher kinetic energy airflow flowing at a maximum speed of 2.5 m/s against the wall of the roadway +Z direction towards the exit of the roadway. The other part of the airflow swoops down to the bottom of the tunnel in the Y direction and is influenced by the pressure difference at the pressurized air outlet to merge into the high-speed pressurized air flow, producing a large vertical vortex of kinetic energy.
(3) In the tunnel space at about 8 m~24 m from the head, the low kinetic energy airflow on the right side and above the header is sucked by the wind of the pressurized wind jet field and the vortex wind flow field along the roof of the tunnel (+Y direction) and flows below the pressurized wind cylinder (Y direction). At the same time, due to the pressure difference generated by the pressurized wind jet field, the lateral velocity gradient affects the transport in the -X direction to produce a clockwise vortex wind flow field at 13 m~24 m away from the digging head and back to the left side of the digging header. The driver of the roadheader is in the return flow path, so the driver is subject to both the vortex flow near the X side wall and the rear return flow. The wind flow with higher kinetic energy flows at a maximum speed of 2.0 m/s against the left side wall of the tunnel in the +Z direction.
(4) In the area 24 m~35 m from the working face, the wind flow attached to the left side of the roadway flows from the top plate to the back side of the pressure air outlet and continues along the pressure air cylinder +Z direction under the action of inertia. Thus, an arc-shaped airflow area is formed while the wind loss along the airflow gradually increases, and the wind speed gradually decreases. As shown in Figure 11, the speed range drops from 0.2 m/s~1.6 m/s at 23 m to 0.2 m/s~1.4 m/s at 27 m. In the area at 35 m~45 m, the influence of the pressurized wind jet field and the return flow area behind the header on the airflow gradually disappears. Then, the airflow gradually spreads to the whole tunnel space, forming a stable wind flow field with relatively small kinetic energy. The wind speed on the side of the tunnel near the pressurized wind cylinder is greater than that on the side of the pressurized wind cylinder. The mean wind speed is about 0.28 m/s, and it flows to the exit of the tunnel.
As highlighted in Figure 9 and Figure 10, the pressure range of the Z = 0.3 m section in the dynamic tunneling model is −0.38 Pa~16.9 Pa, and the pressure difference is 17.28 Pa, while the pressure range of the Z = 0.3 m section in the standard tunneling model is 1 Pa~14.8 Pa, and the pressure difference is 13.8 Pa. According to Bernoulli’s law, the expansion of the fluid domain near the header in the dynamic tunneling model leads to an increase in the pressure difference between the area near the working face and the high-speed pressurized wind jet compared to that reported by the standard tunneling model. This results in a higher wind speed near the head under the dynamic tunneling model compared to the case with the standard tunneling model. Combined with Figure 9 and Figure 10 it can be seen that the high-speed airflow with Z = 0.3 m cross-section greater than 4.1 m/s is widely distributed in the area from Y = 0.6 m to 3.8 m under the dynamic tunneling model, while the high-speed airflow with Z = 0.3 m cross-section greater than 4.1 m/s is only distributed in the area from Y = 0.5 m to 1.5 m under the standard tunneling model.
In order to further compare and analyze the airflow distribution along the Z-direction between the dynamic tunneling model and the standard tunneling model, Figure 11 describes the velocity distribution of the monitoring surfaces 1# to 5# under the two models considered. Based on the comparison, the following notes are made:
(1) The overall wind speed at the front of the tunnel is higher under the standard tunneling model, and the maximum airflow velocity difference between the two models is 1.4 m/s and 1.5 m/s at section 1# and section 2#, respectively.
(2) The relative high-speed airflow zone on the return side of the dynamic tunneling model is more widely distributed than that of the standard tunneling model, which is more conducive to dust diffusion at the rear of the tunnel.
(3) Considering the velocity cloud diagram of sections 2#~5#, as the header digs forward under the dynamic tunneling model, the distance between the header and the pressure air outlet increases, and the clockwise vortex wind flow field behind the header will continue to shift in the +Z direction. Therefore, the role of the driver is weakened by the backward return flow and the main right vortex effect. In this regard, the wind speed at the driver’s position at the 2# section is about 0.5 m/s lower than the standard tunneling model, which is essential for the analysis of the causes of dust accumulation at the driver’s position when compared with the real dynamic tunneling.
For a more comprehensive analysis of the dust dispersion and pollution near the tunneling machine in the integrated roadway, the turbulence kinetic energy (TKE) clouds in the breathing zone (Y = 1.5 m) in the first 8 m space of the roadway, and the graphs of TKE, change at the inlet side and the return side in the first 8 m space of the roadway, and are shown in Figure 12, considering the two models, STM and DTM.
The TKE on the right side of the header in the dynamic tunneling model ranges from 1.00 m2/s2 to 2.96 m2/s2, while the TKE on the right side of the standard tunneling model drops rapidly from a maximum value of 2.78 m2/s2 to 0.61 m2/s2 at 2 m from the working face and remains at about 0.2 m2/s2 from 5 m to 8 m. At the same time, compared with the standard tunneling model, the dynamic tunneling model has a 186% increase in the average TKE of 0.524 on the return wind side. In this regard, the higher turbulence kinetic energy indicates that the turbulence pulsation length is larger, allowing the turbulence vortex to develop faster. Thus, the dust at the digging head of the dynamic tunneling model spreads more quickly to the back of the header along the return side wall, compared to the case of the standard model [40].

3.2. Dust Transport and Dispersion Law

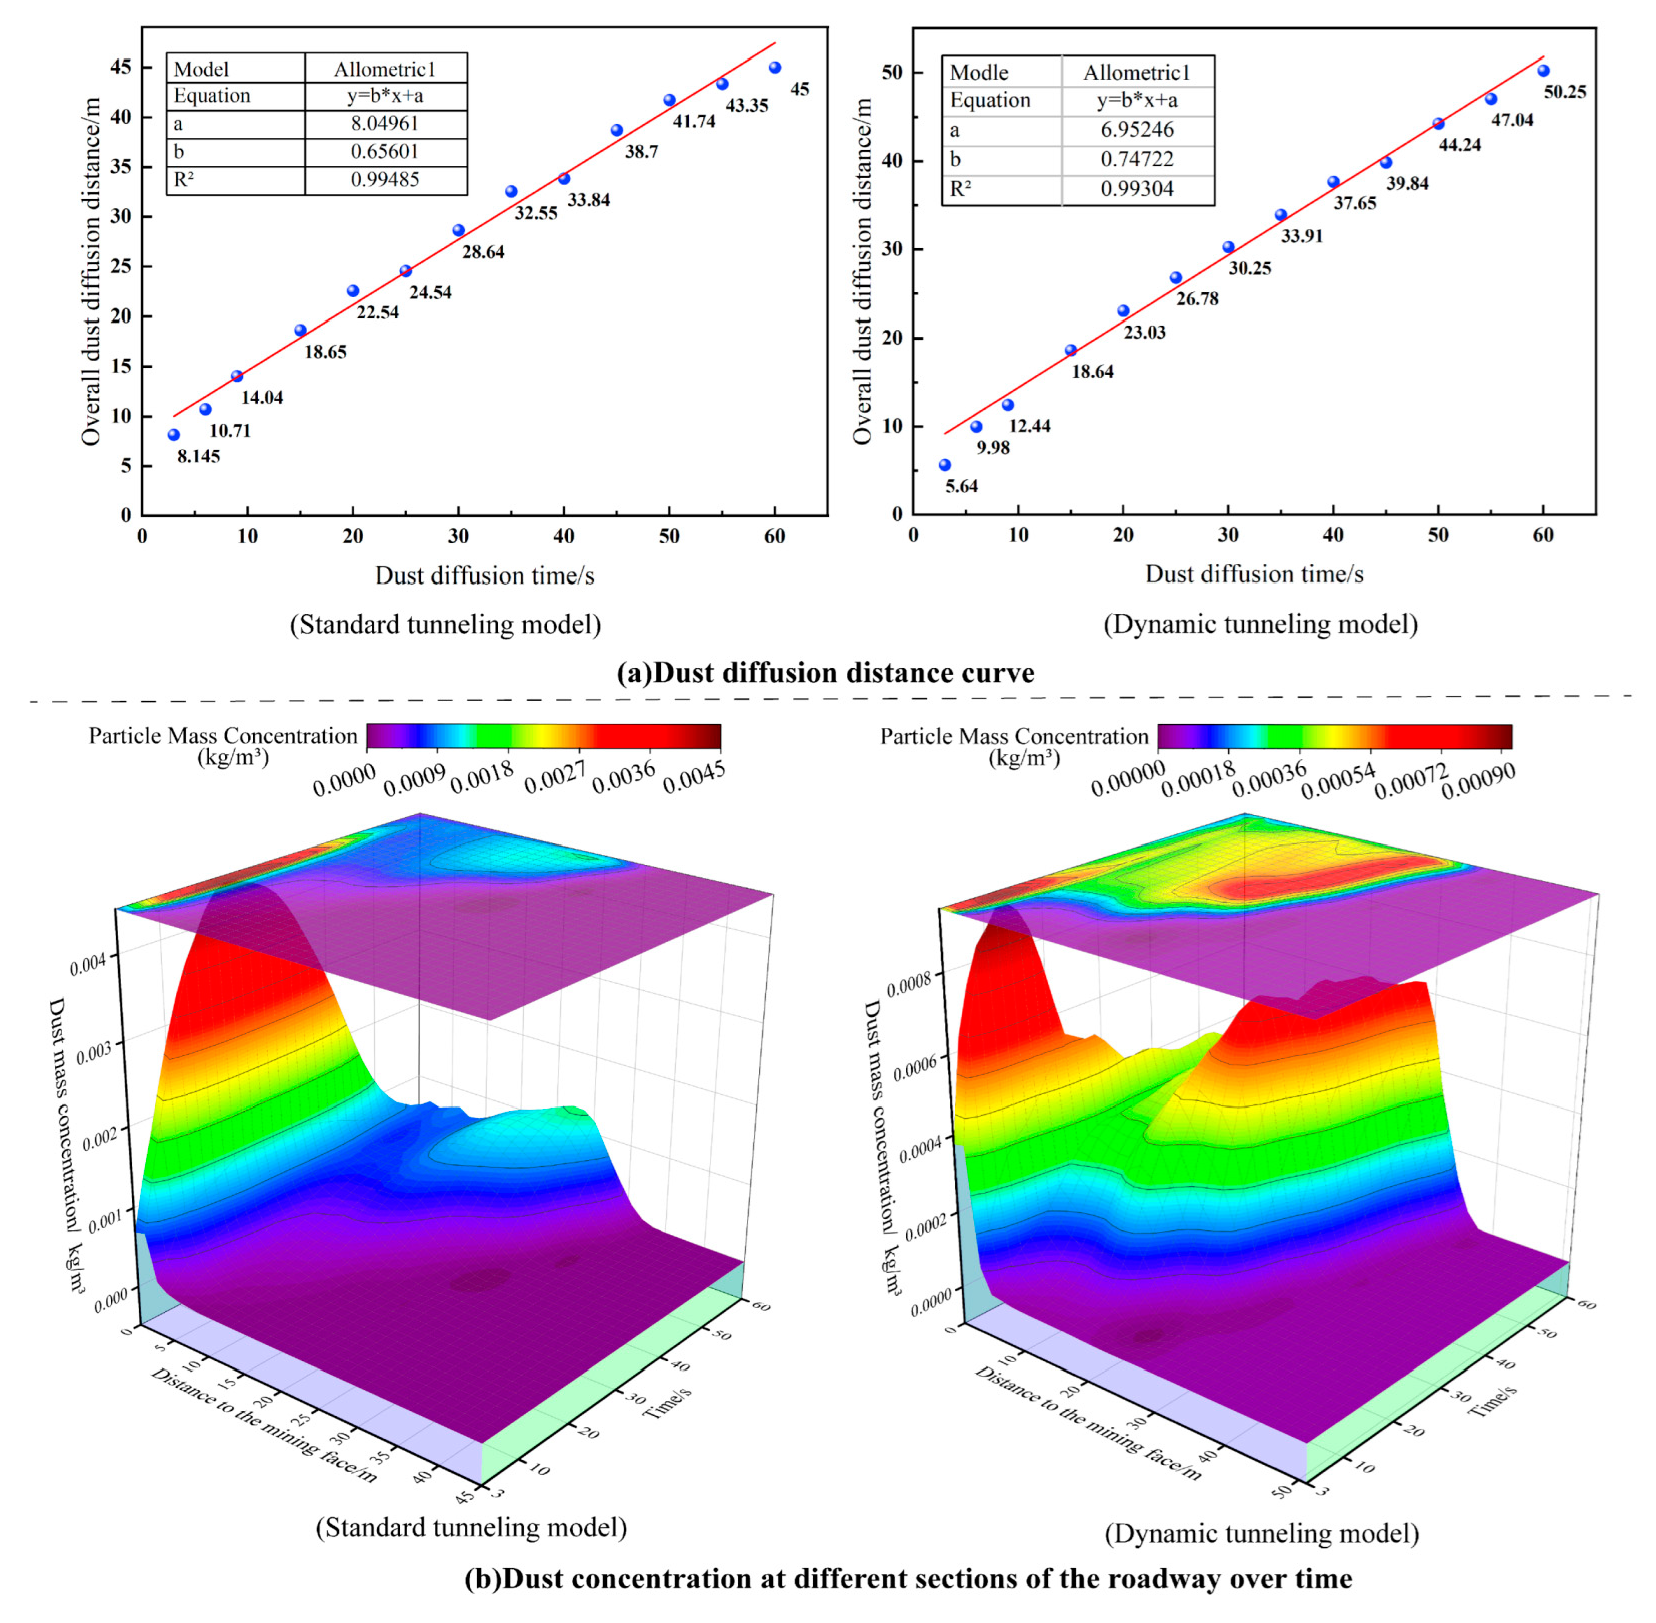
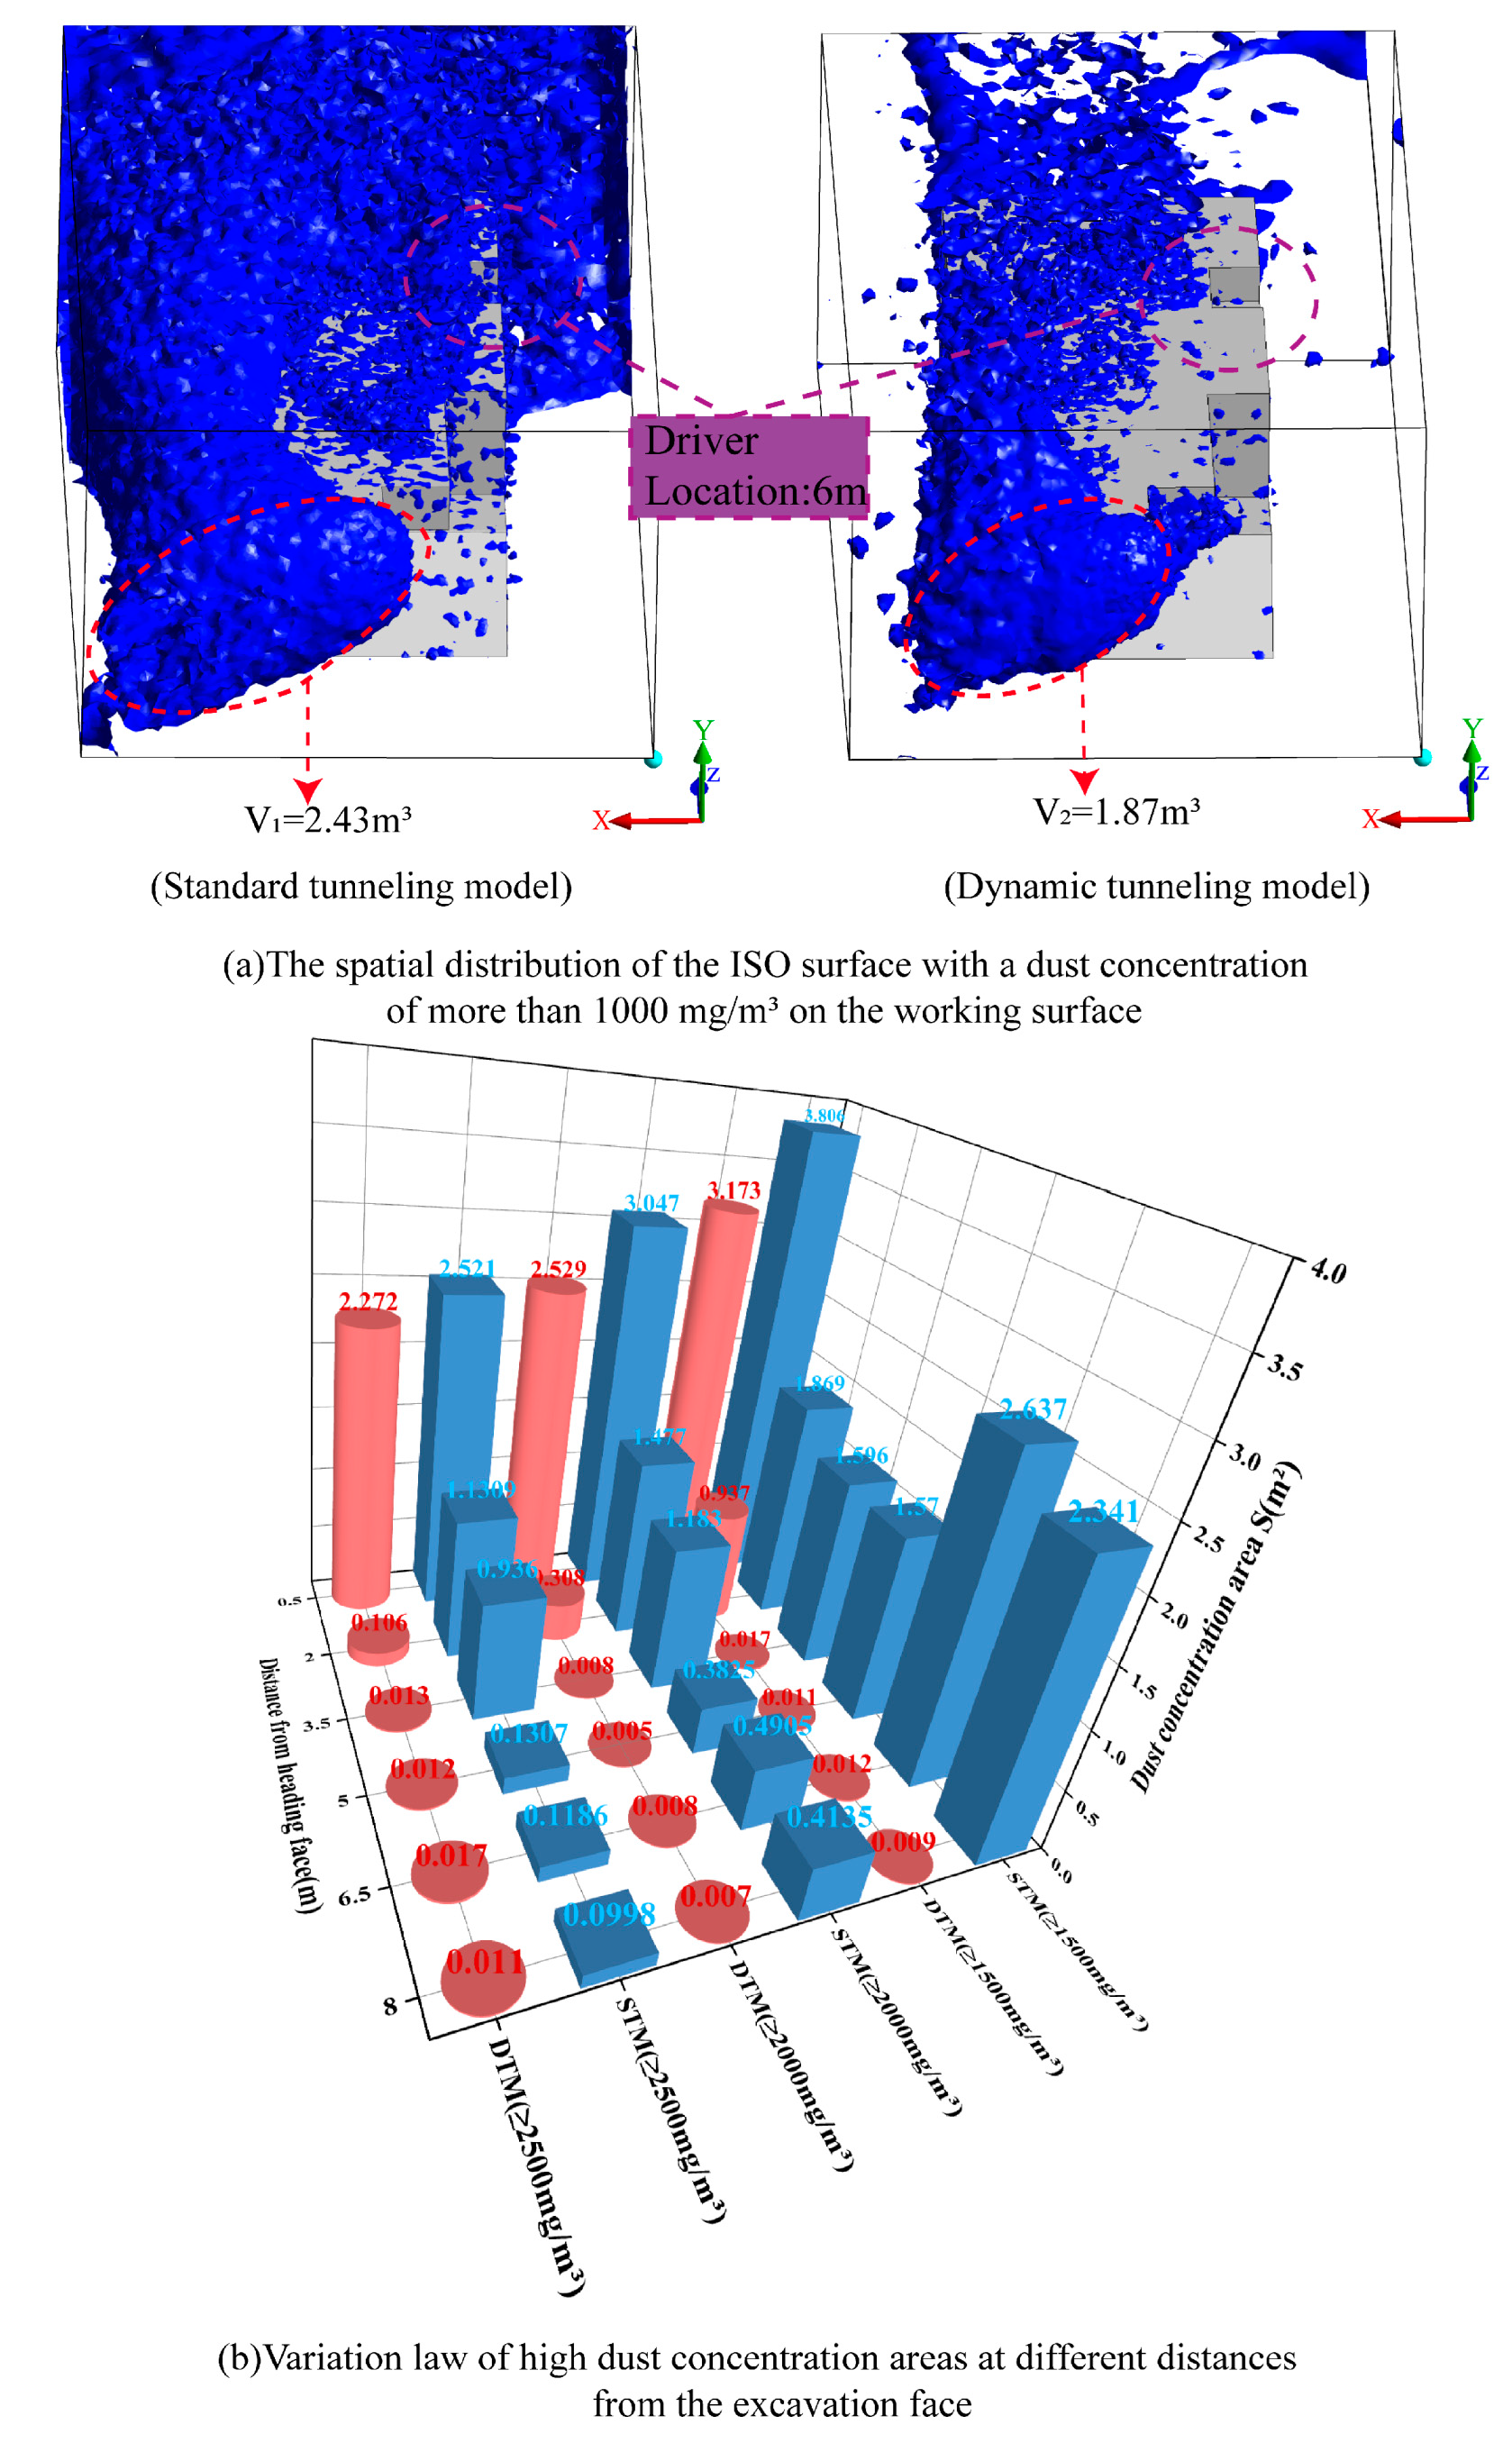
3.2.1. Dust Transport and Dispersion Characteristics of the Heaving Face

Considering the standard tunneling model, Figure 13 depicts the dust concentration and dispersion distance at various times. Based on the findings of the model implementation, the following notes can be made:
(1) A 1.5 m-diameter circle of dust with a high concentration of more than 1000 mg/m3 is found to form around the cutting head at t = 3 s. The majority of the dust is conveyed down the return side wall towards the back of the tunnel as a result of the high-speed pressurized air flow acting on the dust formed by the cutter head cutting coal rock. The right side of the header is only 1.2 m from the side wall surface of the roadway, resulting in an increase in the dust transport speed. Compared to the left side of the header, the right side of the dust passes through the header at a higher speed and continues to spread close to the right wall surface in the +Z direction at t = 15 s, when the dust has spread along the left side of the header to the vortex at the driver of the header. The lateral vortex wind flow field above the header causes a modest amount of dust to create a medium-concentration dust belt with an average concentration of roughly 500 mg/m3 at t = 60 s.
(2) The vortex wind flow field’s velocity interacts with the dust particles at the back side of the header in the return flow area, which is roughly 8–17 m away from the headstock at a time between 15 and 30 s. This leads to a reduction in the dust particles’ velocity in the Z direction and slows down diffusion in the return flow field. As a result, a significant amount of dust settles in the return flow area. Moreover, the middle of the back side of the header generates a zone of relatively low dust concentration at t = 60 s, as shown in Figure 13 It is shown that before 30 s, the high concentration dust in the 3 m area of the tunnel was still not fully spread to the middle of the tunnel. Due to the influence of the clockwise vortex wind flow field from 8 m to 14 m, and the negative pressure area of the pressure wind cylinder, dust with less kinetic energy on the return side is sucked into the rear side of the driver’s working area and below the pressure wind cylinder. In this regard, a dust belt with an average mass concentration higher than 600 mg/m3 is formed at T = 30 s~40 s. At time t = 50 s~60 s, the dust deposition on the lower side of the pressurized air cylinder intensifies to form a high-concentration dust gathering belt with an average mass concentration greater than 750 mg/m3.
(3) Around 17 m from the headway, the dust particles enter the stable wind flow field and begin to spread along the axial wind flow in the +Z direction at time t = 40 s. Once they have spread to 25 m, the dust particles then move faster toward the tunnel’s exit because the wind speed on the tunnel wall next to the pressurized wind cylinder is higher than the wind speed on the pressurized wind cylinder’s side. The fitted curve of the mathematical relationship between the distance of the dust diffusion and the time under the standard tunneling model is given by y = 0.65601x + 8.04961, with an R2 of 0.99516, where y is the dust concentration and x is the time.
On the other hand, Figure 14 highlights the dust concentration and dispersion distance at different times under the dynamic tunneling model. Based on the findings of the model implementation, the following notes can be made:
(1) According to the wind flow field analysis conducted, the overall average wind speed in the vortex area at the front of the tunnel under the dynamic tunneling model is lower than that of the standard tunneling model. Thus, it is noted that the diffusion of dust generated by the cutting head under the dynamic tunneling model is relatively slow. The dust particles released from the cutter head cutting coal and rock form a three-dimensional dust wrapping area with a diameter of about 2 m at the diffusion time t = 3 s. The highest dust concentration reported was around 34,930 mg/m³. However, as shown in Figure 13, the turbulent kinetic energy in the dynamic model is higher than that of the standard tunneling model because the pressure difference in the fluid domain near the header increases during the time between 3 s and 15 s. The turbulent kinetic energy on the right side of the header under the dynamic tunneling model is in the range of 1.01 m2/s2~2.93 m2/s2. As a result, the high concentration of dust in the first 8 m of the tunnel will not accumulate on the return side as in the standard tunneling model. However, the majority of the dust will spread more quickly along the return side wall to the back of the header. The remainder will be involved above the header and will implement the clockwise vortex wind flow field behind the header to form a high concentration dust area with an average concentration of over 500 mg/m3 at a time between 50 s and 60 s.
(2) Unlike the traditional tunneling model, the dynamic tunneling model predicts that the dust will quickly fill the whole tunnel when it spreads in the return region of 13 m to 24 m at t = 30 s to 40 s. At the same time, the dust accumulation in the driver’s work area under dynamic excavation is improved because the driver’s position is mainly affected by the vortex flow near the side of the pressure air cylinder. The influence of the rear return flow is greatly reduced. As exhibited in the standard excavation model, a dust accumulation zone with an average concentration higher than 750 mg/m3 is formed on the lower side of the pressure air cylinder at a time between 50 s and 60 s. As shown in Figure 15, the mathematical relationship obtained when fitting the data of the distance of diffusion of dust versus time in the dynamic tunneling model is given by y = 0.74722x + 6.95246, with an R2 of 0.99304, where y is the dust concentration and x is the time.

3.2.2. Respiratory Zone Dust Concentration Distribution

In order to further analyze the spatial dispersion of dust particles, a cloud map of the dust mass concentration is plotted in this work at the location of the breathing zone (Y = 1.5 m), considering miners as the study object.
Figure 16 dust mass concentration at the location of the breathing zone (Y = 1.5 m) under the standard tunneling model. Based on the findings, the following notes are highlighted:
(1) The dust particles have spread to about 6 m from the header driver after 3 s, with a concentration of around 125 mg/m3. At a time t = 30 s, the medium-concentration dust cloud of 250 mg/m3 to 500 mg/m3 is transported to the back side of the header driver under the influence of the reflux zone and accumulates in the driver area with a dust zone of high-concentration of 750 mg/m3 at 60 s.
(2) From the diffusion of dust particles at a time between 50 s and 60 s, it can be seen that the low-concentration dust cloud gradually moves to the exit of the tunnel. Thus, the medium-concentration dust cloud is distributed in the space of Z = 8 m~14 m at the back side of the header and the space of 23 m~30 m against the left side of the tunnel. On the other hand, the high-concentration dust cloud covers a large area of 14 m~30 m, with a proportion of more than 65%.
Figure 17 shows the distribution of the dust mass concentration at the location of the breathing zone (Y = 1.5 m) under the dynamic tunneling model. Based on the findings, the following notes are highlighted:
(1) At a time t = 15 s, the medium-low dust cloud of 125 mg/m3 moves to the driver’s position of the header, and at t = 60 s, the medium-concentration dust cloud of 250 mg/m3~500 mg/m3 accumulates at the driver’s position.
(2) As shown in Figure 12, the turbulent kinetic energy in the fluid domain near the header under dynamic tunneling conditions is higher than that of the standard tunneling model. So, the dust cloud of medium and high concentrations spreads faster under the dynamic tunneling model. In this regard, the medium-concentration dust cloud has spread to a space of 30 m~35 m at T a time t = 60 s. Compared to the standard tunneling model, the dust concentration on the return side of the dynamic tunneling model is greatly reduced, and the overall high-concentration dust area is greatly reduced and concentrated in the space of 25 m~30 m.
Figure 18 shows the spatial distribution of the ISO-surfaces on the excavation working face with dust concentrations above 1000 mg/m3 and the corresponding dust areas with dust concentrations above 1500 mg/m3, 2000 mg/m3, and 2500 mg/m3 from 0.5 to 8 m from the heaving face, respectively.
According to Figure 18a, in the standard tunneling model with a dust concentration of 1000 mg/m3, the ISO-surface of the dust particle distribution gradually expands from V1 = 2.43 m3 in the cutter head to the back of the tunnel and fills the tunnel at approximately 5 m. On the contrary, the ISO surface dust concentration of 1000 mg/m3 accumulates from V2 = 1.87 m3 at the cutter head and above the header, compared to the standard tunneling model. In the dynamic tunneling model, a large number of dust particles accumulate above the cutter head at V2 = 1.87 m3 and gradually dissipate as the cutter dynamically digs into, near the left and right walls of the tunnel.
Figure 18b shows that the dust area generated in the standard tunneling model is larger than that exhibited in the dynamic model. At a concentration of more than 1500 mg/m3, the maximum dust area in the standard tunneling model is around 1.869 m2 at 2 m from the working face, while the maximum dust area in the dynamic model is found to be reduced by 49.8% to 0.937 m2. At 6.5 m from the working face (driver’s position), the dust area drops sharply to only 0.012 m2, which is much smaller than the 2.637 m2 area exhibited in the standard tunneling model case. At this stage, the difference between the two models reaches its maximum. Due to the effect of the turbulent kinetic energy in the dynamic excavation flow field near the header, the area of high dust concentration under dynamic excavation is reduced, which promotes uniform distribution of dust in the roadway section and accelerates the diffusion of high-concentration dust clouds into a large area of medium-concentration dust clouds in the roadway [41,42].
The particle size distribution of dust particles on the 2# section was collected separately using Fluent. According to Figure 19, it can be seen that the dust particle size distribution trend of the excavation working face under the dynamic grid model is relatively convergent with that of the dust collected in the field in the previous paper. The dust particle size is basically below 100 μm. 62.8% of the total dust is between 5 and 100 μm. The cumulative distribution of dust (perimeter equivalent particle size <10 μm) was 65.9%. The fitted dust particle size distribution function is y = 0.02546x−0.90855.

4. Field Measurements

An experimental investigation was carried out at the Lijiahao coal mine 31,116 main transport chute header excavation face dust dispersion to validate and verify the precision of the numerical simulation results. Thus, on-site measurements were collected and then compared to the simulation predictions to confirm the accuracy of the simulation results, and to validate that the developed model characterize properly the process with good satisfaction. The conducted experimental setup is highlighted in Figure 20, showing the installation of the equipment and devices. Based on the distribution of personnel in the present tunnel, eight cross sections were selected in the pedestrian breathing position (Y = 1.5 m), at a distance of Z = 5 m, 10 m, 15 m, 20 m, 25 m, 30 m, 35 m, and 40 m from the working face. Each measurement section has two measurement points, (5.0 m, 1.5 m, Z) and (0.5 m, 1.5 m, Z). Moreover, the CCHZ-1000Q automatic dust analyzer is used to quantify the dust concentration at various measuring points. The measurements are conducted, ensuring that the tunnel’s dust concentration is in a stable state, and each point is sampled three times, once every 5 min, and the average value of the three samples is taken and recorded as an output.
Figure 21 presents the comparison between the simulation results of the two different tunneling models considered and the actual measured dust concentration in the same group of sites. It is shown that the dust concentration in the first four cross-sectional measurement readings, (5.0 m, 1.5 m, Z) and (0.5 m, 1.5 m, Z), with Z = 5 m, 10 m, 15 m, and 20 m, under the dynamic tunneling model is significantly lower than those reported by the standard tunneling model simulations. The maximum difference in the dust concentration between the measurements and the simulations is around 321 mg/m3. This difference is due to the action of the higher turbulent kinetic energy airflow field generated by the dynamic tunneling of the comprehensive excavator. This airflow field suppresses the high dust concentration area at the front of the tunnel and promotes the diffusion of the high concentration dust cloud in the tunnel to the exit side. On the inlet side of the breathing area after 30 m of the tunnel, the dust concentration of the dynamic tunneling model ranges from 78 mg/m3 to 461 mg/m3. On the other hand, the dynamic tunneling model has dust concentrations ranging from 69 mg/m3 to 289 mg/m3. Overall, the dust pollution is more serious than that reported by the standard tunneling model.
In addition, as shown in Figure 22, some of the numerical simulation results of the standard tunneling model show a significant deviation compared to the field measurement data. In this regard, the relative error between the dust concentration measured at each measurement point in the 31,116 main transport chute of the Lijiahao coal mine ranges between 16.22 % and 64.43 %. On the other hand, the numerical simulation results of dust transport characteristics employing the dynamic tunneling model are more accurate and can adequately characterize and replicate the field measurements with good precision and accuracy. This is due to the capability of the dynamic model in describing the actual real situation onsite. The relative error between the simulations of the dust concentration from the dynamic tunneling model and the measurements onsite is between 3.59 % and 9.82 %.

5. Conclusions

Using a combination of CFD simulations and field measurements, this study presented the first initiative in the simulation of dust dispersion and pollution processes during the dynamic tunneling operation of a real header combined with dynamic mesh technology and discrete-phase particle tracking technology. The results of the model were compared with a static model of a conventional header and with real measurements onsite. Based on the investigation carried out, the following conclusions are reported:
(1) The pressure difference between the front side of the roadway increases to 17.28 Pa and the turbulent kinetic energy increases as the header is dynamically dug forward compared to the static conditions. This leads to a higher vortex flow in the 8 m space of the roadway under the dynamic dug-in model. Additionally, the return flow area extends from 8 m–17 m in the standard dug-in model to a space of 8 m–24 m from the head. However, with the increase in the wind cylinder and working face under the dynamic tunneling model, the average wind speed in the vortex wind flow area at the front of the tunnel decreases compared with the standard tunneling model results. In this regard, the difference between the maximum speeds at 1# and 2# monitoring faces are 1.4 m/s and 1.5 m/s, respectively.
(2) In the dynamic tunneling model, a portion of the dust in the first 8 m of the tunnel is swept above the header and through the back of the header to form a high-concentration dust area with an average concentration of more than 500 mg/m³. It was shown that most of the high-concentration dust will spread more quickly along the return side wall to the return flow area in the case of the dynamic tunneling model compared to the standard model, where a large amount of dust accumulates on the return side. The dust diffusion state under the dynamic tunneling model was correlated by the following relationship: y = 0.74722x + 6.95246, with an R2 of 0.99304. On the other hand, the dust diffusion state under the standard tunneling model was found to satisfy the following relationship: y = 3.35796x0.63632, with R2 = 0.99516. In the two relationships, y is the dust concentration and x is the time.
(3) It was found that there were obvious differences in the distribution of high concentrations of dust in the breathing zone. In the standard tunneling case, the medium-concentration dust cloud is distributed in the space from Z = 8 m to 14 m on the back side of the header and the space from 23 m to 30 m on the left side of the roadway. On the other hand, the high-concentration dust cloud covers the space from 14 m to 30 m and the return wind side with a proportion of more than 65%. Moreover, the dust concentration at the driver accumulates at 750 mg/m3 at 60 s. It was found that the dynamic dust concentration on the return side of the tunneling model was greatly reduced, and the high-concentration dust cloud was greatly reduced in the space from 25 m to 30 m. Additionally, the dust concentration at the driver is reduced to a medium-concentration dust cloud of 250 mg/m3~500 mg/m3.
(4) The dynamic forward excavation of the head causes the expansion of the overall fluid domain of the working face to produce a larger negative pressure area compared to the standard excavation model. The resulting airflow field with greater turbulent kinetic energy promotes the uniformity of the dust distribution on the highway. This leads to a reduction in the high dust concentration area under dynamic excavation and a reduction of dust area of around 49.8%, more than 1500 mg/m3 under dynamic excavation at Z = 2 m.

Author Contributions

Conceptualization and methodology, X.C.; writing—original draft preparation, H.Z.; investigation, S.G.; resources, C.D.; software, G.M.; validation and data curation, W.L. and C.F. All authors have read and agreed to the published version of the manuscript.

Funding

This work is supported by the National Natural Science Foundation of China (Grant No. 52174195 and 51704145) and the Basic Research Programs of Shanxi Province of China (Grant No. 20210302123122), and also supported by Transformation of Scientific and Technological Achievements Programs of Higher Education Institutions in Shanxi (Grant No. 2020CG022).

Conflicts of Interest

The authors declare no conflict of interest.

References

  1. Guo, X.; Xiao, B.; Song, L. Emission Reduction and Energy-Intensity Enhancement: The Expected and Unexpected Consequences of China’s Coal Consumption Constraint Policy. J. Clean. Prod. 2020, 271, 122691. [Google Scholar] [CrossRef]
  2. Chen, X.; Gao, J.; Deng, C.; Ge, S.; Fan, C.; Zhang, W. Experimental Study on Chemical Structure and Wetting Influence of Imidazole Ionic Liquids on Coal. Fuel 2022, 330, 125545. [Google Scholar] [CrossRef]
  3. Geng, F.; Luo, G.; Zhou, F.; Zhao, P.; Ma, L.; Chai, H.; Zhang, T. Numerical Investigation of Dust Dispersion in a Coal Roadway with Hybrid Ventilation System. Powder Technol. 2017, 313, 260–271. [Google Scholar] [CrossRef]
  4. Guo, L.; Nie, W.; Yin, S.; Liu, Q.; Hua, Y.; Cheng, L.; Cai, X.; Xiu, Z.; Du, T. The Dust Diffusion Modeling and Determination of Optimal Airflow Rate for Removing the Dust Generated during Mine Tunneling. Build. Environ. 2020, 178, 106846. [Google Scholar] [CrossRef]
  5. Fan, C.; Qi, Q.; Chen, X.; Ge, S. Study on Induced Airflow Characteristic and Dust Particle Diffusion Law at Transshipment Point. Energy Sources Part A Recover. Util. Environ. Eff. 2020, 1–13. [Google Scholar] [CrossRef]
  6. Chen, X.; Mao, Y.; Fan, C.; Wu, Y.; Ge, S.; Ren, Y. Experimental Investigation on Filtration Characteristic with Different Filter Material of Bag Dust Collector for Dust Removal. Int. J. Coal Prep. Util. 2021, 1–16. [Google Scholar] [CrossRef]
  7. Nie, W.; Guo, C.; Zhang, S.; Peng, H.; Xu, C.; Ma, Q.; Yuan, M.; Zhou, W.; Guo, L.; Cheng, L. Optimization of Spraying Dust Reduction Technology of Continuous Miner Machine and the Dust Environment in a Tunnel, Based on Computational Fluid Dynamics (CFD) Technology. Powder Technol. 2022, 398, 117044. [Google Scholar] [CrossRef]
  8. Qi, X.-M.; Luo, Y.; Song, M.-Y.; Liu, Y.; Shu, T.; Liu, Y.; Pang, J.-L.; Wang, J.; Wang, C. Pneumoconiosis: Current Status and Future Prospects. Chin. Med. J. 2021, 134, 898–907. [Google Scholar] [CrossRef] [PubMed]
  9. Chen, X.; Ma, G.; Fan, C.; Ge, S. Research Progress of Coal Damage under Unsteady Load in China. Geofluids 2021, 2021, 5610391. [Google Scholar] [CrossRef]
  10. Yu, H.; Jin, Y.C.; Cheng, W.; Yang, X.; Peng, X.; Xie, Y. Multiscale Simulation of Atomization Process and Droplet Particles Diffusion of Pressure-Swirl Nozzle. Powder Technol. 2021, 379, 127–143. [Google Scholar] [CrossRef]
  11. Lu, X.; Wang, C.; Shen, C.; Wang, M.; Xing, Y. Verisimilar Research on the Dust Movement in the Underground Tunneling at the Roadheader Cutterhead Dynamic Rotation. Energy 2022, 238, 121978. [Google Scholar] [CrossRef]
  12. Xie, Z.; Xiao, Y.; Jiang, C.; Ren, Z.; Li, X.; Yu, K. Numerical Research on Airflow-Dust Migration Behavior and Optimal Forced Air Duct Installation Position in a Subway Tunnel during Drilling Operation. Powder Technol. 2021, 388, 176–191. [Google Scholar] [CrossRef]
  13. Wang, H.; Sa, Z.; Cheng, W.; Zhang, R.; Yang, S. Effects of Forced-Air Volume and Suction Region on the Migration and Dust Suppression of Air Curtain during Fully Mechanized Tunneling Process. Process Saf. Environ. Prot. 2021, 145, 222–235. [Google Scholar] [CrossRef]
  14. Cai, X.; Nie, W.; Yin, S.; Liu, Q.; Hua, Y.; Guo, L.; Cheng, L.; Ma, Q. An Assessment of the Dust Suppression Performance of a Hybrid Ventilation System during the Tunnel Excavation Process: Numerical Simulation. Process Saf. Environ. Prot. 2021, 152, 304–317. [Google Scholar] [CrossRef]
  15. Cheng, W.; Yu, H.; Zhou, G.; Nie, W. The Diffusion and Pollution Mechanisms of Airborne Dusts in Fully-Mechanized Excavation Face at Mesoscopic Scale Based on CFD-DEM. Process Saf. Environ. Prot. 2016, 104, 240–253. [Google Scholar] [CrossRef]
  16. Yu, H.; Cheng, W.; Wu, L.; Wang, H.; Xie, Y. Mechanisms of Dust Diffuse Pollution under Forced-Exhaust Ventilation in Fully-Mechanized Excavation Faces by CFD-DEM. Powder Technol. 2017, 317, 31–47. [Google Scholar] [CrossRef]
  17. Wang, Y.; Jiang, Z.; Zhang, F.; Lu, Y.; Bao, Y. Study on Dust Diffusion Characteristics of Continuous Dust Sources and Spray Dust Control Technology in Fully Mechanized Working Face. Powder Technol. 2022, 396, 718–730. [Google Scholar] [CrossRef]
  18. Jiang, W.; Xu, X.; Wen, Z.; Wei, L. Applying the Similarity Theory to Model Dust Dispersion during Coal-Mine Tunneling. Process Saf. Environ. Prot. 2021, 148, 415–427. [Google Scholar] [CrossRef]
  19. Jiang, Z.A.; Yang, B.; Zhang, G.L.; Zeng, F.B.; Wang, Y.P. Analysis of Dust Pollution Effect of Cutting Dust and Ventilation Control Parameters at the Digging Face in Plateau Mines. J. China Coal Soc. 2021, 46, 2146–2157. [Google Scholar]
  20. Li, Y.; Wang, P.; Liu, R.; Jiang, Y.; Han, H. Determination of the Optimal Axial-to-Radial Flow Ratio of the Wall-Mounted Swirling Ventilation in Fully Mechanized Excavation Face. Powder Technol. 2020, 360, 890–910. [Google Scholar] [CrossRef]
  21. Hua, Y.; Nie, W.; Liu, Q.; Yin, S.; Peng, H. Effect of Wind Curtain on Dust Extraction in Rock Tunnel Working Face: CFD and Field Measurement Analysis. Energy 2020, 197, 117214. [Google Scholar] [CrossRef]
  22. Hua, Y.; Nie, W.; Cai, P.; Liu, Y.; Peng, H.; Liu, Q. Pattern Characterization Concerning Spatial and Temporal Evolution of Dust Pollution Associated with Two Typical Ventilation Methods at Fully Mechanized Excavation Faces in Rock Tunnels. Powder Technol. 2018, 334, 117–131. [Google Scholar] [CrossRef]
  23. Hua, Y.; Nie, W.; Liu, Q.; Peng, H.; Wei, W.; Cai, P. The Development and Application of a Novel Multi-Radial-Vortex-Based Ventilation System for Dust Removal in a Fully Mechanized Tunnelling Face. Tunn. Undergr. Space Technol. 2020, 98, 103253. [Google Scholar] [CrossRef]
  24. Yin, S.; Nie, W.; Guo, L.; Liu, Q.; Hua, Y.; Cai, X.; Cheng, L.; Yang, B.; Zhou, W. CFfD Simulations of Air Curtain Dust Removal Effect by Ventilation Parameters during Tunneling. Adv. Powder Technol. 2020, 31, 2456–2468. [Google Scholar] [CrossRef]
  25. Yang, X.; Yu, H.; Wang, Y.; Cheng, W.; Hou, C.; Ye, Y. Study on the Modularized Airflow-Diverging System and Dust-Control Technology in the Fully Mechanized Heading Face. Powder Technol. 2022, 402, 117325. [Google Scholar] [CrossRef]
  26. Chang, P.; Xu, G.; Huang, J. Numerical Study on DPM Dispersion and Distribution in an Underground Development Face Based on Dynamic Mesh. Int. J. Min. Sci. Technol. 2020, 30, 471–475. [Google Scholar] [CrossRef]
  27. Zhou, H.; Zhong, K.; Jia, H.; Kang, Y. Analysis of the Effects of Dynamic Mesh Update Method on Simulating Indoor Airflow Induced by Moving Objects. Build. Environ. 2022, 212, 108782. [Google Scholar] [CrossRef]
  28. Nazif, H.R.; Tabrizi, H.B. Development of Boundary Transfer Method in Simulation of Gas–Solid Turbulent Flow of a Riser. Appl. Math. Model. 2013, 37, 2445–2459. [Google Scholar] [CrossRef]
  29. Barman, P.C. Introduction to Computational Fluid Dynamics. Int. J. Inf. Sci. Comput. 2016, 3, 117–120. [Google Scholar] [CrossRef]
  30. Wang, F.-J. Computational Fluid Dynamics Analysis–CFD Software Principle and Application; Tsinghua University Press: Beijing, China, 2004. [Google Scholar]
  31. Launder, B.E. DB Spalding Mathematical Models of Turbulence; Academy Press: London, UK, 1972. [Google Scholar]
  32. Fan, C.; Qi, Q.; Chen, X.; Ge, S. Study on the Characteristics of Induced Airflow and Particle Dispersion Based on the Multivariate Two-Factor Model. PLoS ONE 2022, 17, e0263740. [Google Scholar] [CrossRef]
  33. Xu, G.; Luxbacher, K.D.; Ragab, S.; Xu, J.; Ding, X. Computational Fluid Dynamics Applied to Mining Engineering: A Review. Int. J. Min. Reclam. Environ. 2017, 31, 251–275. [Google Scholar] [CrossRef]
  34. Stewart, H.B.; Wendroff, B. Two-Phase Flow: Models and Methods. J. Comput. Phys. 1984, 56, 363–409. [Google Scholar] [CrossRef]
  35. Zhang, L.; Zhou, G.; Ma, Y.; Jing, B.; Sun, B.; Han, F.; He, M.; Chen, X. Numerical Analysis on Spatial Distribution for Concentration and Particle Size of Particulate Pollutants in Dust Environment at Fully Mechanized Coal Mining Face. Powder Technol. 2021, 383, 143–158. [Google Scholar] [CrossRef]
  36. Hu, S.; Liao, Q.; Feng, G.; Huang, Y.; Shao, H.; Fan, Y.; Ye, Y. Numerical Study of Gas-Solid Two-Phase Flow around Road-Header Drivers in a Fully Mechanized Excavation Face. Powder Technol. 2019, 344, 959–969. [Google Scholar] [CrossRef]
  37. Matsson, J.E. An Introduction to ANSYS Fluent 2021; SDC Publications: Mission, KS, USA, 2021; ISBN 1630574627. [Google Scholar]
  38. Liu, X.; Qian, J.; Wang, E.; Zhang, Z. Study of Integrated Vortex Ventilation and Dust Removal System in Mechanized Excavation Face. Proc. Inst. Mech. Eng. Part E J. Process Mech. Eng. 2021, 235, 42–51. [Google Scholar] [CrossRef]
  39. UDF Manual. Ansys Fluent 12.0. In Theory Guid; Researchgate: Berlin, Germany, 2009. [Google Scholar]
  40. Duan, J.; Zhou, G.; Yang, Y.; Jing, B.; Hu, S. CFD Numerical Simulation on Diffusion and Distribution of Diesel Exhaust Particulates in Coal Mine Heading Face. Adv. Powder Technol. 2021, 32, 3660–3671. [Google Scholar] [CrossRef]
  41. Zhang, X.; Pan, Y. Preparation, Properties and Application of Gel Materials for Coal Gangue Control. Energies 2022, 15, 557. [Google Scholar] [CrossRef]
  42. Cao, J.; Xie, C.; Hou, Z. Ecological Evaluation of Heavy Metal Pollution in the Soil of Pb-Zn Mines. Ecotoxicology 2022, 31, 259–270. [Google Scholar] [CrossRef]
Figure 1. New vocational disease cases in China in 2020.
Energies 15 08945 g001
Figure 2. Physical model.
Energies 15 08945 g002
Figure 3. Mesh model.
Energies 15 08945 g003
Figure 4. Variation of mesh quality with mesh numbers.
Energies 15 08945 g004
Figure 5. Mesh independence test.
Energies 15 08945 g005
Figure 6. Dust particle size distribution.
Energies 15 08945 g006
Figure 7. Dynamic mesh model grid generation.
Energies 15 08945 g007
Figure 8. Analysis of airflow field and cross-sectional vector at the heaving face (dynamic tunneling model).
Energies 15 08945 g008
Figure 9. Pressure nephogram in Z = 0.3 m section under dynamic and stationary conditions.
Energies 15 08945 g009
Figure 10. Velocity cloud map under dynamic and static conditions of Z = 0.3 m section.
Energies 15 08945 g010
Figure 11. The speed cloud map at 1#~5# monitoring surface under the dynamic and stationary condition.
Energies 15 08945 g011
Figure 12. Distribution of TKE in airflow.
Energies 15 08945 g012
Figure 13. Dust distribution in tunneling at different diffusion times (Standard tunneling model).
Energies 15 08945 g013
Figure 14. Dust distribution in tunneling at different diffusion times (Dynamic tunneling model).
Energies 15 08945 g014
Figure 15. Analysis of dust diffusion in fully mechanized excavation.
Energies 15 08945 g015
Figure 16. Simulation results of dust diffusion in the 1.5 m breathing zone (standard tunneling model).
Energies 15 08945 g016
Figure 17. Simulation results of dust diffusion in the 1.5 m breathing zone (dynamic tunneling model).
Energies 15 08945 g017
Figure 18. Variation rule of high dust concentration area in fully mechanized excavation face.
Energies 15 08945 g018
Figure 19. Particle size distribution of dust particles.
Energies 15 08945 g019
Figure 20. Dust concentration field measurement chart (take model of dynamic tunneling as an example).
Energies 15 08945 g020
Figure 21. Comparison of the simulation results at several measuring points with the measured dust concentration.
Energies 15 08945 g021
Figure 22. Relative errors of dust under different conditions.
Energies 15 08945 g022
Table 1. Particle size distribution analysis results.
Circumference Equivalent Particle Size (μm)Cumulative Percentage/%
1.3801.060
5.50074.900
10.03089.250
15.11092.830
21.90094.080
48.25098.710
97.645100.000
Table 2. Boundary conditions.
ProjectsSolving ParametersParameter Setting
ModelSolver TypePressure based
Viscous ModelStandard k ε model
Pressure-Velocity CouplingSIMPLEC
Convergence Criterion10−3
Inlet Boundary Typevelocity-inlet
Velocity TypeAbsolute
Near-wall TreatmentStandard Wall Functions
Velocity Magnitude10 m/s
Gradient DiscretizationLeast Square Cell Based
FormulationImplicit
Outlet Boundary TypePressure outlet
Spatial DiscretizationSecond Order Upwind
Boundary conditionsVelocity Magnitude10 m/s
Density1.225 kg/m3
Hydraulic Diameter10 m/s
Turbulent Intensity3.07%
Wall Shear ConditionNo Slip
Viscosity1.81 × 10−5 kg/m·s
Stochastic TrackingDiscrete random walk model
Table 3. Discrete phase parameter setting.
ProjectsSolving ParametersParameter Setting
Discrete phase parameter settingDiameter distributionRosin-rammler
Min. Diameter1 × 10−6 m
Max. Diameter1 × 10−4 m
Mean Diameter5 × 10−6 m
flow rate0.01 kg/s
Injection TypeSurface
MaterialCoal-hv
Time Scale Constant0.15
Velocity magnitude1.2 m/s
Stochastic TrackingDiscrete random walk model
Table 4. Dynamic grid parameter setting.
ProjectsSolving ParametersParameter Setting
Dynamic grid parameter settingBody grid regeneration methodLayering
Control parameters for the paving method
Separation factor
Constant Height
Separation factor0.6
Collapse factor0.4
Velocity magnitude of the dynamic grid0.1 m/s
Publisher’s Note: MDPI stays neutral with regard to jurisdictional claims in published maps and institutional affiliations.

