Article

Heat Transfer Intensification in a Heat Exchanger by Means of Twisted Tapes in Rib and Sawtooth Forms

by
Pasu Poonpakdee
1,
Boonsong Samutpraphut
2,
Chinaruk Thianpong
1,
Suriya Chokphoemphun
3,
Smith Eiamsa-ard
2,4,*,
Naoki Maruyama
5,6 and
Masafumi Hirota
5
1
School of Engineering, King Mongkut’s Institute of Technology Ladkrabang, Bangkok 10520, Thailand
2
Department of Mechanical Engineering, Mahanakorn University of Technology, Bangkok 10530, Thailand
3
Department of Mechanical Engineering, Faculty of Industry and Technology, Rajamangala University of Technology Isan Sakonnakhon Campus, Sakonnakhon 47160, Thailand
4
Division of System Engineering, Graduate School of Engineering, Mie University, Tsu 514-8507, Mie, Japan
5
Division of Mechanical Engineering, Graduate School of Engineering, Mie University, Tsu 514-8507, Mie, Japan
6
Engineering Innovation Unit, Graduate School of Regional Innovation Studies, Mie University, Tsu 514-8507, Mie, Japan
*
Author to whom correspondence should be addressed.
Energies 2022, 15(23), 8855; https://doi.org/10.3390/en15238855
Submission received: 21 October 2022 / Revised: 18 November 2022 / Accepted: 18 November 2022 / Published: 23 November 2022
(This article belongs to the Special Issue New Challenges in Heat Transfer Enhancement)

Abstract

:
This experimental study aimed to intensify the aerothermal performance index (API) in a round tube heat exchanger employing twisted tapes in rib and sawtooth forms (TTRSs) as swirl/vortex flow generators. The TTRSs have a constant twist ratio of 3.0, a constant rib pitch ratio (p/e) of 1.0, and six different sawtooth angles (α = 20°, 30°, 40°, 50°, 60°, and 70°). Experiments were carried out in an open flow using air as the working fluid for Reynolds numbers between 6000 and 20,000 in the current study, which was conducted in a heated tube under conditions of uniform wall heat flux. A typical twisted tape (TT) was also tested for comparison. The experimental results suggest that TTRSs yield Nusselt numbers ranging from 1.42 to 2.10 times of those of a plain tube. TTRSs with larger sawtooth angles (α) offer superior heat transfer. The TTRSs with α = 20°, 30°, 40°, 50°, 60°, and 70° respectively, enhance average Nusselt numbers by 158%, 162%, 166%, 172%, 180%, and 187% with average friction factors of 3.51, 3.55, 3.60, 3.67, 3.75 and 3.82 times higher than a plain tube. Additionally, TTRSs with sawtooth angles (α) of 20°, 30°, 40°, 50°, 60°, and 70° offer APIs in the ranges of 0.99 to 1.19, 1.01 to 1.21, 1.03 to 1.26, 1.05 to 1.31, 1.07 to 1.42, and 1.09 to 1.48, respectively, which are higher than those of the typical twisted tape (TT) by around 5%, 7%, 11%, 16%, 25%, and 31%, respectively. This demonstrates that twisted tapes in rib and sawtooth form (TTRSs), with appropriate geometries, give a promising trade-off between enhanced heat transfer and an increased friction loss penalty.

Graphical Abstract

1. Introduction

Energy savings are an important issue due to resource depletion. It is challenging to find solutions for applications that reduce energy consumption. One approach is using techniques to improve heat transfer in thermal systems. In general, there are two ways of improving heat transfer, active and passive approaches. Passive approaches show an advantage over active methods since they do not require external power [1,2]. These techniques include various ways to increase flow turbulence, especially for working fluids in the gaseous state, in which the heat transfer coefficient is relatively low. A simple passive technique is introducing swirling flow into a bulk flow and modifying the velocity and thermal boundary layers using swirl generator/turbulator devices, especially twisted tapes [3,4,5,6,7]. The application of twisted tapes always results in an energy trade-off. The desired augmented heat transfer rate is counterbalanced by an undesirably increased pressure drop [8,9,10,11,12,13]. In addition, turbulators are also presented in the forms of extended surfaces, for example, louvered and wavy fins [14,15], serrated fins [16,17], star-shaped fins [18], and perforated fins [19,20].
Several twisted tape designs have been proposed to enhance heat transfer with a reasonable pressure drop increase to improve thermal performance [21,22,23,24,25,26,27]. Wijayanta et al. [21] numerically studied single-phase flow inside an enhanced tube equipped with square-cut twisted tapes at various twist ratios (y/W) of 2.7, 4.5, and 6.5 for the Reynolds number range of 8000 to 18,000, with water as the working fluid. A square-cut twisted tape with y/W = 2.7 yielded the highest heat transfer, friction factor, and thermal performance factor. The maximum thermal performance factor offered by the modified twisted tapes was as high as 1.23, which was greater than that of a typical twisted tape (1.18). Ahmad et al. [22] utilized twisted tapes with increasing and decreasing pitch ratios in SiC/water and Al2O3/water nanofluid flows. They observed that using twisted tapes with increasing pitch ratios better enhanced swirling flow with smaller pressure losses than ones with decreasing pitch ratios, especially near the outlet region. The influence of clockwise and counter-clockwise twisted tape inserts on the thermal performance of a modified photovoltaic thermal system was reported by Kalateh et al. [23]. The modified system with twisted tapes had a higher overall efficiency of 13.6% than the typical one in terms of exergy. Additionally, the overall energy efficiency of the photovoltaic thermal system, using clockwise and counter-clockwise twisted tapes, increased by 7.37 and 68.97%, respectively, compared to that of the conventional photovoltaic thermal system and PV unit. Dagdevir and Ozceyhan [24] employed conventional, perforated, and dimpled twisted tapes in the flow of ethylene glycol (EG) and water (W) mixtures at Reynolds numbers ranging from 5217 to 22,754. The tests encompassed volumetric EG to W ratios of 0:100, 20:80, and 40:60. The twisted tapes with a 5.88 twist ratio were dimpled and perforated with pitch ratios of 0.25, 0.5, and 1.0. Among the applied twisted tapes, the dimpled twisted tapes showed the best performance, reaching maximum thermal performance values of 1.42, 1.17, and 1.05 at volumetric EG to W ratios of 0:100, 20:80, and 40:60, respectively. Zhang et al. [25] investigated the pressure losses and nanoparticle deposition characteristics in ducts containing multiple twisted tapes (MTT) having various twist ratios. Their results showed that nanoparticle deposition increased with a decreasing twist ratio and an increasing number of twisted tapes. The effects of Reynolds numbers (4000–11,000), twist ratios (3.0 and 7.0), nanoparticle sizes (5–100 nm), number of tapes (1, 2, and 4), and partitioning methods were investigated. Experimental results revealed that the friction factor varied from 1.4 to 3.2. Additionally, twisted tapes with smaller twist ratios introduced higher particle deposition velocities and flow resistances than those with greater twist ratios. Dagdevir and Ozceyhan [26] investigated the thermal performance and conducted a second law analysis of a heat exchanger with rod-inserted straight and rod-inserted twisted tapes using a water/CuO nanofluid as the working fluid. The pitch ratios of the rods on the tapes were 10, 20, and 40. Despite the better thermal performance of the tube containing rod-inserted twisted tapes, there was no significant difference in second law efficiency since the rod-inserted twisted tape caused greater friction losses. The use of rod-inserted twisted tapes with a pitch ratio of 40 and a nanofluid with a mass fraction of 2.0% at Reynolds number 6572 was reported to have the highest thermal performance factor, 1.38, and the best second law efficiency, 0.44. Dandoutiya and Kumar [27] examined the performance of a double-pipe heat exchanger equipped with W-cut twisted tapes at depth-to-width ratios ranging from 0.2 to 0.6. Increased cut depth considerably improved thermal performance. By increasing the depth of the cut, the thermal performance factor rose. In a helical tube, Xie et al. [28] investigated the effects of employing twisted tapes on the heat transfer rate, friction factor, and entropy formation at Reynolds numbers between 6000 and 32,000. Their results indicated that the heat transfer rate increased by up to 66% in comparison to the smooth helical tube. Additionally, it was discovered that the utilization of twisted tapes had a greater effect on the creation of frictional entropy than it had on the generation of thermal entropy. Soltani et al. [29] compared the heat transfer performance of typical, continuous, continuous winglet, and discontinuous louvered twisted tapes in dimpled and non-dimpled forms for Reynolds numbers ranging from 5000 to 9500. A maximum thermal performance factor of 1.24 was obtained by the application of a dimpled louvered twisted tape at a Reynolds number of 5300. Maithani et al. [30] evaluated the thermal performance of a heat exchanger tube fitted with winglet twisted tapes having various twist ratios (y/w), winglet pitch ratios (pw/lt), winglet height ratios (hw/bw), and Reynolds numbers ranging from 3000 to 21,000. A maximum thermal performance as high as 1.58 was achieved.
The literature suggests that heat transfer, friction loss, and thermal performance are significantly influenced by the form and geometry of twisted tapes, as illustrated in Figure 1. The shapes of the twisted tapes have been modified from previously published works to increase flow mixing near the tube wall [21,26,27,29,30,31] and turbulence at the tape core [22,23,24,25]. To the best of our knowledge, this is the first study that proposes designs of modified twisted tapes in rib and sawtooth forms (TTRSs). The expected phenomena caused by the TTRSs are (1) sawtooth-induced turbulence near the tube wall, rib-induced turbulence near the core tube, and (2) swirling/vortex flows created by the twist tapes. Both phenomena promote turbulence and fluid mixing and improve heat transfer. The major goals of this research are to assess the heat transfer intensification, pressure losses, and API caused by twisted tapes in rib and sawtooth form (TTRSs) with six sawtooth angles (α), 20°, 30°, 40°, 50°, 60°, and 70° at a constant rib pitch ratio (p/e) of 1.0. The same entrance conditions were used for all tests, and the Reynolds number varied between 6000 and 20,000 based on the tube diameter. Additionally, three correlations (Nu, f, and API) were developed to relate Reynolds numbers and geometric parameters of twisted tapes in rib and sawtooth form (TTRSs).

2. Details of Twisted Tapes in Rib and Sawtooth Forms

Newly designed twisted tapes were fabricated in rib and sawtooth form (TTRSs), with continuous ribs at the middle tape and sawtooth forms along both sides of the tapes. Figure 2 shows twisted tapes in rib and sawtooth form (TTRSs). Each twisted tape in this form (TTRSs) was fabricated from a thin, straight aluminum sheet that was 0.8 mm thick, 61 mm (w) wide, and 2000 mm (L) long. Then, the tape was twisted at a constant twist length of 183 mm (y/w) = 3.0). Finally, the edges of the tapes were cut to form sawtooth surfaces. Twisted tapes in rib and sawtooth form were fabricated with six different sawtooth angles (α = 20°, 30°, 40°, 50°, 60°, and 70°). Each of these twisted tapes was inserted into a test section of a tube so that turbulence and heat transfer augmentation occurred along the length of the tube.

3. Experimental Setup

An open-loop experimental setup employed in the current work is depicted in Figure 3. Air temperature and humidity measurements were all under control in the laboratory. The loop in this system included a heating tube, thermocouples, RTDs, an orifice meter to monitor entrance flow rate, a differential digital pressure gauge, a 2.2 kW blower, a 3-phase inverter, a multi-meter, a data logger, a power controller, and a hot wire anemometer. To minimize upstream and downstream disturbances, upstream and downstream calm sections with lengths of 2000 mm and 1000 mm were used. The length of the calm and test sections combined was 4.6 m. The test section was made of a copper tube that was 1.5 mm thick and 1.6 m long. The inside and outside diameters are 62 and 65 mm, respectively. The length of the entry section is 40 times that of the tube diameter (40 D) to create a hydrodynamically developed flow at the test tube’s entrance. Experimentally, air was fed along twisted tapes in rib and sawtooth form (TTRSs). A steady density of heat flux 600 W/m2 was maintained along the whole length of the outer tube wall using a Variac transformer to regulate the electrical output and keep the current under 3 amps. Using small heater wires helped in facilitating a heat flux condition. Monitoring sensors were installed along the length of the heated tube, including resistance temperature detectors, type T thermocouples, a differential digital pressure gauge, and a hot wire anemometer. To measure the local wall temperature (Tw) along the testing test section, 17 T-type thermocouple beads were tapped (placed in V-grooves on the tube wall) at 17 axial positions at 52 mm intervals. Two T-type thermocouples were placed at each station. Thermal glue was used to bind one thermocouple to the top surface and the other to the bottom surface. To monitor the air temperatures, four resistance temperature detectors (s) were mounted in the entrance and mixing sections. To collect data at one-minute intervals, all RTDs and T-type thermocouples were linked to a data acquisition system and data logger. Boiling water and ice were utilized to calibrate each T-type thermocouple and RTD. By meticulously insulating it with sufficient Bakelite sealant, the heating tube was thermally insulated to reduce heat losses to the surroundings. Additionally, extra Bakelite sealant was applied around the entry and exit flanges. Airflow was controlled so that the difference in air temperature between the heating entrance and exit was between 3 °C and 5 °C. Experimental data were acquired at five different air flow rates, which coincided with Reynolds numbers (Re) of 4000, 8000, 12,000, 16,000, and 20,000. A three-phase inverter and an orifice meter were used to control the airflow and Reynolds numbers (Re). All data were collected under steady-state conditions. A set of steady-state criteria were established to achieve data repeatability. According to Bošnjaković et al. [32], the requirements for a steady state are an inlet temperature change and heat flux deviation during measurement that do not exceed 0.5 °C and 5%, respectively. These specifications are validated through statistical analysis of measured data. If the results did not meet the specifications, the measurements were repeated.
After attaining a steady state for at least 25 min, experimental data (pressure loss, bulk fluid temperature, and surface temperature) were recorded. Reynolds numbers, Nusselt numbers, friction factors, and the aerothermal performance indices (API) were computed using MATLAB software after all the data had been analyzed. The uncertainties of the experimental data were identified based on [33]. The maximum uncertainties of non-dimensional parameters are ±5.2% for the Reynolds number, ±8.1% for the Nusselt number, and ±7.9% for friction. The results are summarized in Table 1.

4. Data Reduction

In the experiments, heat transfer to the air working fluid (Qa) at a steady state is assumed to be equivalent to the convective heat transfer rate (Qconv) as [5,8]:
Q a = Q conv
where
Q a = m ˙ C p , a ( T out T in )
Q conv = h A ( T ˜ w T b )
where
T b = ( T out + T in ) / 2
in is inlet position and out is outlet positions, and
T ˜ w = T w / 17
where Tw is a local wall temperature between the entrance and exit. Seventeen stations are utilized to estimate the average wall temperature. The mean Nusselt number, Nu, and the average heat transfer coefficient, h, are computed as follows [5,8]:
h = m ˙ c a ( T out T in ) / A ( T ˜ w T b )
Nu = hD/k
Local mean bulk temperatures of the fluid were evaluated from T bx = T bi + q ˙ π D L x / m ˙ c a while mean heat transfer coefficients were calculated from h x = q ˙ / ( T wx T bx ) , where q ˙ is a density of heat flux.
The Re and f formulations [5,8] are
Re = UD/ν
f = Δ P L D ρ U 2 2  
All thermo-physical characteristics of a fluid were estimated based on the bulk air temperatures that were evaluated from Equation (4).
The Nusselt number and friction factor data uncertainty can be expressed as follows [18].
Nusselt Number:
Δ N u N u = 1 N u h N u Δ h 2 + D N u Δ D 2 + k N u Δ k 2 0.5 = Δ h h 2 + Δ D D 2 0.5
where h = q T w T b
Δ h h = 1 h h q Δ q 2 + h T w Δ T w 2 + h T b Δ T b 2 0.5 = Δ q q 2 + Δ T w T w T b 2 + Δ T b T w T b 2 0.5
where
q = 0.5 π D L h V 2 / R + m ˙ C p T bo T bi
Friction Factor:
Δ f f = 1 f f Δ P Δ Δ P 2 + f L Δ L 2 + f D Δ D 2 + f R e Δ R e 2 0.5 = Δ Δ P Δ P 2 + Δ L L 2 + 3 Δ D D 2 + 2 Δ R e R e 2 0.5  
where
Δ Δ P Δ P = Δ h h   and   Δ R e R e = Δ m ˙ m ˙ 2 + Δ D D 2 0.5

5. Confirmatory Data of a Plain Tube

The experimental setup and measurements are verified by comparing the present Nusselt number and friction factor findings to established Gnielinski and Blasius correlations for plain tubes [34]. Figure 4a,b show a comparison of the experimental results with the Nusselt numbers and friction factors obtained from the standard correlations. In general, the present results exhibit good agreement with the correlations. Deviations of the experimental friction factor from the Blasius correlation are within ±7.3%, and those of the Nusselt number from the Gnielinski correlation are within ±13.6%. This data accuracy is acceptable for the purposes of the current work. Therefore, the experimental setup was subjected to further investigation. Several Nusselt number and friction factor correlations for the fully developed turbulent flow regime were reported in previous works. The most important ones are listed below:
Gnielinski’s correlation for turbulent flow in tubes for 3000 ≤ Re ≤ 5 × 10⁶ and 0.5 ≤ Pr ≤ 2000 is
N u = f / 8 R e 1000 P r 1 + 12.7 f / 8 0.5 P r 0.66 1
where f is the Darcy friction factor
The Blasius equation for turbulent flow in tubes for 3000 ≤ Re ≤ 5 × 10⁴ is
f = 0.316Re−0.25

6. Results and Discussion

6.1. Heat Transfer Results

Heat transfer intensification by twisted tapes in a rib and sawtooth form (TTRSs) is reported in this section. The results of the TTRSs having six different sawtooth angles (α), 20°, 30°, 40°, 50°, 60°, and 70° under turbulent flows are displayed in Figure 5a,b. The results are plotted for comparison for axial flow (plain tube). Due to the induction of highly swirling and turbulent flows, it is evident that the use of TTRSs has a considerable impact on heat transfer at all Reynolds numbers. As a result of higher turbulence intensity, Nusselt numbers (or heat transfer rates) generally tend to increase with the Reynolds number in all TTRSs. However, Nu/Nup rises as the Reynolds number falls because a thicker thermal boundary layer is generated at lower Reynolds numbers. This renders the effect of the disruption caused by the augmenting device to become greater at larger Reynolds numbers. Applying TTRSs results in higher Nusselt numbers compared to those of a plain tube. The improved Nusselt numbers over the plain tube are between 142 and 210% greater for Reynolds numbers between 6000 and 20,000. Under similar operating conditions, TTRSs having large sawtooth angles (α) give greater heat transfer owing to higher turbulence. The Nusselt number increases are estimated to be roughly 158%, 162%, 166%, 172%, 180%, and 187%, using TTRSs with α = 20°, 30°, 40°, 50°, 60°, and 70°, respectively. In other words, the TTRSs with a sawtooth angle of 70° yield higher Nusselt numbers than the ones with α = 20°, 30°, 40°, 50°, and 60° by around 1.18, 1.15, 1.12, 1.08, and 1.04 times, respectively. Heat transfer enhancement can be caused by better mixing of the fluid between the core and the tube surface, as well as turbulent flow fluctuation that results in the formation of swirl flow and turbulence along the TTRSs.

6.2. Friction Factor Results

The variation of the friction factor (f) with Re for fluid flows inside tubes with TTRS inserts is displayed in Figure 6a,b. These figures also illustrate the effects of sawtooth angles (α) of 20°, 30°, 40°, 50°, 60°, and 70° on the friction factor (f). The friction factors caused TTRSs with various sawtooth angles (α) are demonstrated as a function of the Reynolds number in Figure 6a,b. For comparison, the results for axial flow (plain tube) are also plotted. In general, the application of TTRSs results in significantly higher friction factors compared to those of the plain tube. This is the result of the fluid dynamic pressure dissipation generated by swirl flow and extremely high viscosity losses close to the tube wall. Due to fluid acceleration at the entry to the heating test section, friction factors (f) in all cases decrease as Reynolds numbers (Re) rise. With increasing inertial forces to balance out viscous forces, the friction factors decrease. With decreasing sawtooth angles (α), the friction factors increase owing to higher flow resistance. In the same way as heat transfer, a TTRS with a larger sawtooth angle causes a greater friction factor. The friction factors caused by TTRS devices with sawtooth angles (α) of 20°, 30°, 40°, 50°, 60°, and 70° are, respectively, 3.51, 3.55, 3.60, 3.67, 3.75, and 3.82 times that of a plain tube alone. As compared to the TTRS with α = 70°, the ones with α = 20°, 30°, 40°, 50°, and 60° yielded 9%, 8%, 6%, 4%, and 2% lower friction factors, respectively.

6.3. Aerothermal Performance Results

TTRSs cause both desired higher heat transfer and undesired higher friction losses. Both outcomes are considered to evaluate the practicality of using these devices, which directly impact operational costs. The evaluations are performed by comparing heat transfer coefficients at equivalent pumping power, using a plain tube as the reference. At the same pumping power [35] for a plain tube (p) and a tube with twisted tape (t),
( V ˙ Δ P ) p = ( V ˙ Δ P )
The following can be provided as the link between the friction factor and the Reynolds number [35];
(f Re3)p = (f Re3)
then
Rep = Re(f/fp)1/3
The power consumption per unit mass of fluid can be utilized to evaluate the aerothermal performance index (API) as a first design guideline before choosing a technique. Under the same pumping power, the dimensionless heat transfer parameter (Nu) and friction loss (f) of the tube with TTRSs, along with the plain tube alone, can be written in terms of an aerothermal performance index (API) as
API = h/hp|pp = Nu/Nup|pp = Nu/Nup(fp/f)1/3
Generally, the application of heat transfer enhancement devices simultaneously increases both heat transfer and friction losses. The aerothermal performance index (API) offers an overall evaluation that considers both increased heat transfer rate and increased friction loss. An API value larger than unity signifies the potential of heat transfer-enhancing devices for a comprehensive energy-saving strategy. A plot of the aerothermal performance index (API) against the Reynolds number is shown in Figure 7. The aerothermal performance index (API) tends to increase with decreasing Reynolds numbers and increasing sawtooth angles (α). The findings imply that TTRSs can be used to save energy at low Reynolds numbers (Re). Higher pressure drops result in lower API values (an undesired effect) at greater Reynolds numbers. The results suggest that the use TTRSs with larger sawtooth angles at lower Reynolds numbers is more practical for energy savings. TTRSs with sawtooth angles (α) of 20°, 30°, 40°, 50°, 60°, and 70° yield API values of 0.99 to 1.19, 1.01 to 1.21, 1.03 to 1.26, 1.05 to 1.31, 1.07 to 1.42, and 1.09 to 1.48, respectively. Compared to the conventional twisted tapes (TTs), TTRSs with sawtooth angles (α) of 20°, 30°, 40°, 50°, 60°, and 70° offer greater API values by around 5%, 7%, 11%, 16%, 25%, and 31%, respectively.

6.4. Empirical Correlations

Using multiple regression, all correlations were developed based on experimental results. The resultant empirical correlations of Nusselt number (Nu), friction factor (f), and API (Equations (16)–(18)) are applicable for Reynolds numbers (Re) ranging from 6000 to 20,000. The empirical correlations for the Nusselt number, friction factor, and aerothermal performance index developed from experimental results of TTRSs for all sawtooth angles (α) are shown as follows.
Nu = 0.049Re0.762Pr0.4(tan(α/90))0.098
f = 11.178Re−0.492(tan(α/90))0.075
API = 4.392Re−0.136(tan(α/90))0.073
Comparisons between the experimental data and the predictions are illustrated in Figure 8a–c. These figures show that the predictions are adequately accurate. Deviation of predicted Nusselt numbers, friction factors, and aerothermal performance indices from the experimental data are within ±11%, ±8%, and ±10%, respectively.

7. Benchmarking

The API results under identical pumping power conditions of the current TTRS at α = 70° are benchmarked with the earlier modified twisted tapes, including a segmented twisted tape [13] at L/p = 0.5 and Re = 10,000, square-cut twisted tape [21] at y/W = 2.7 and Re = 8000, rod-inserted twisted tape [26] at L/p = 40 and Re = 5000, and a W-cut twisted tape [27] at b = 6 mm and Re = 5300. The benchmarking is depicted in Figure 9. The maximum aerothermal performance index (API) in each work is presented as follows. The API of the modified twisted tapes of the current study, in a rib and sawtooth form, is 1.48 at Re = 6000. That of a segmented twisted tape [13] is 1.02 at Re = 10,000, and the API of a square-cut twisted tape [21] is 1.29 at Re = 8000. A rod-inserted twisted tape [26] showed an API of 1.38 at Re = 5000, while that of a W-cut twisted tape [27] was 1.50 for Re = 5300. At low Reynolds numbers, the API of the TTRS is comparable to that of the W-cut twisted tape [27] and higher than those of the other twisted tapes [13,21,26]. However, at high Reynolds numbers, API values of the TTRS are greater than only segmented twisted tape [13] and lower than those of the others. The results suggest that the use of TTRSs is a feasible strategy for energy savings at low Reynolds numbers.

8. Conclusions

The effects of twisted tapes in rib and sawtooth form (TTRSs) with sawtooth angles (α) of 20°, 30°, 40°, 50°, 60°, and 70° on improved heat transfer rate, pressure loss, and aerothermal performance index (API) are reported. The major findings are as follows.
The TTRSs-generated swirl and turbulence promotes fluid mixing over the wall. This results from the viscous sublayer being disturbed, which greatly improves heat transfer and balances out the increased pressure loss penalty.
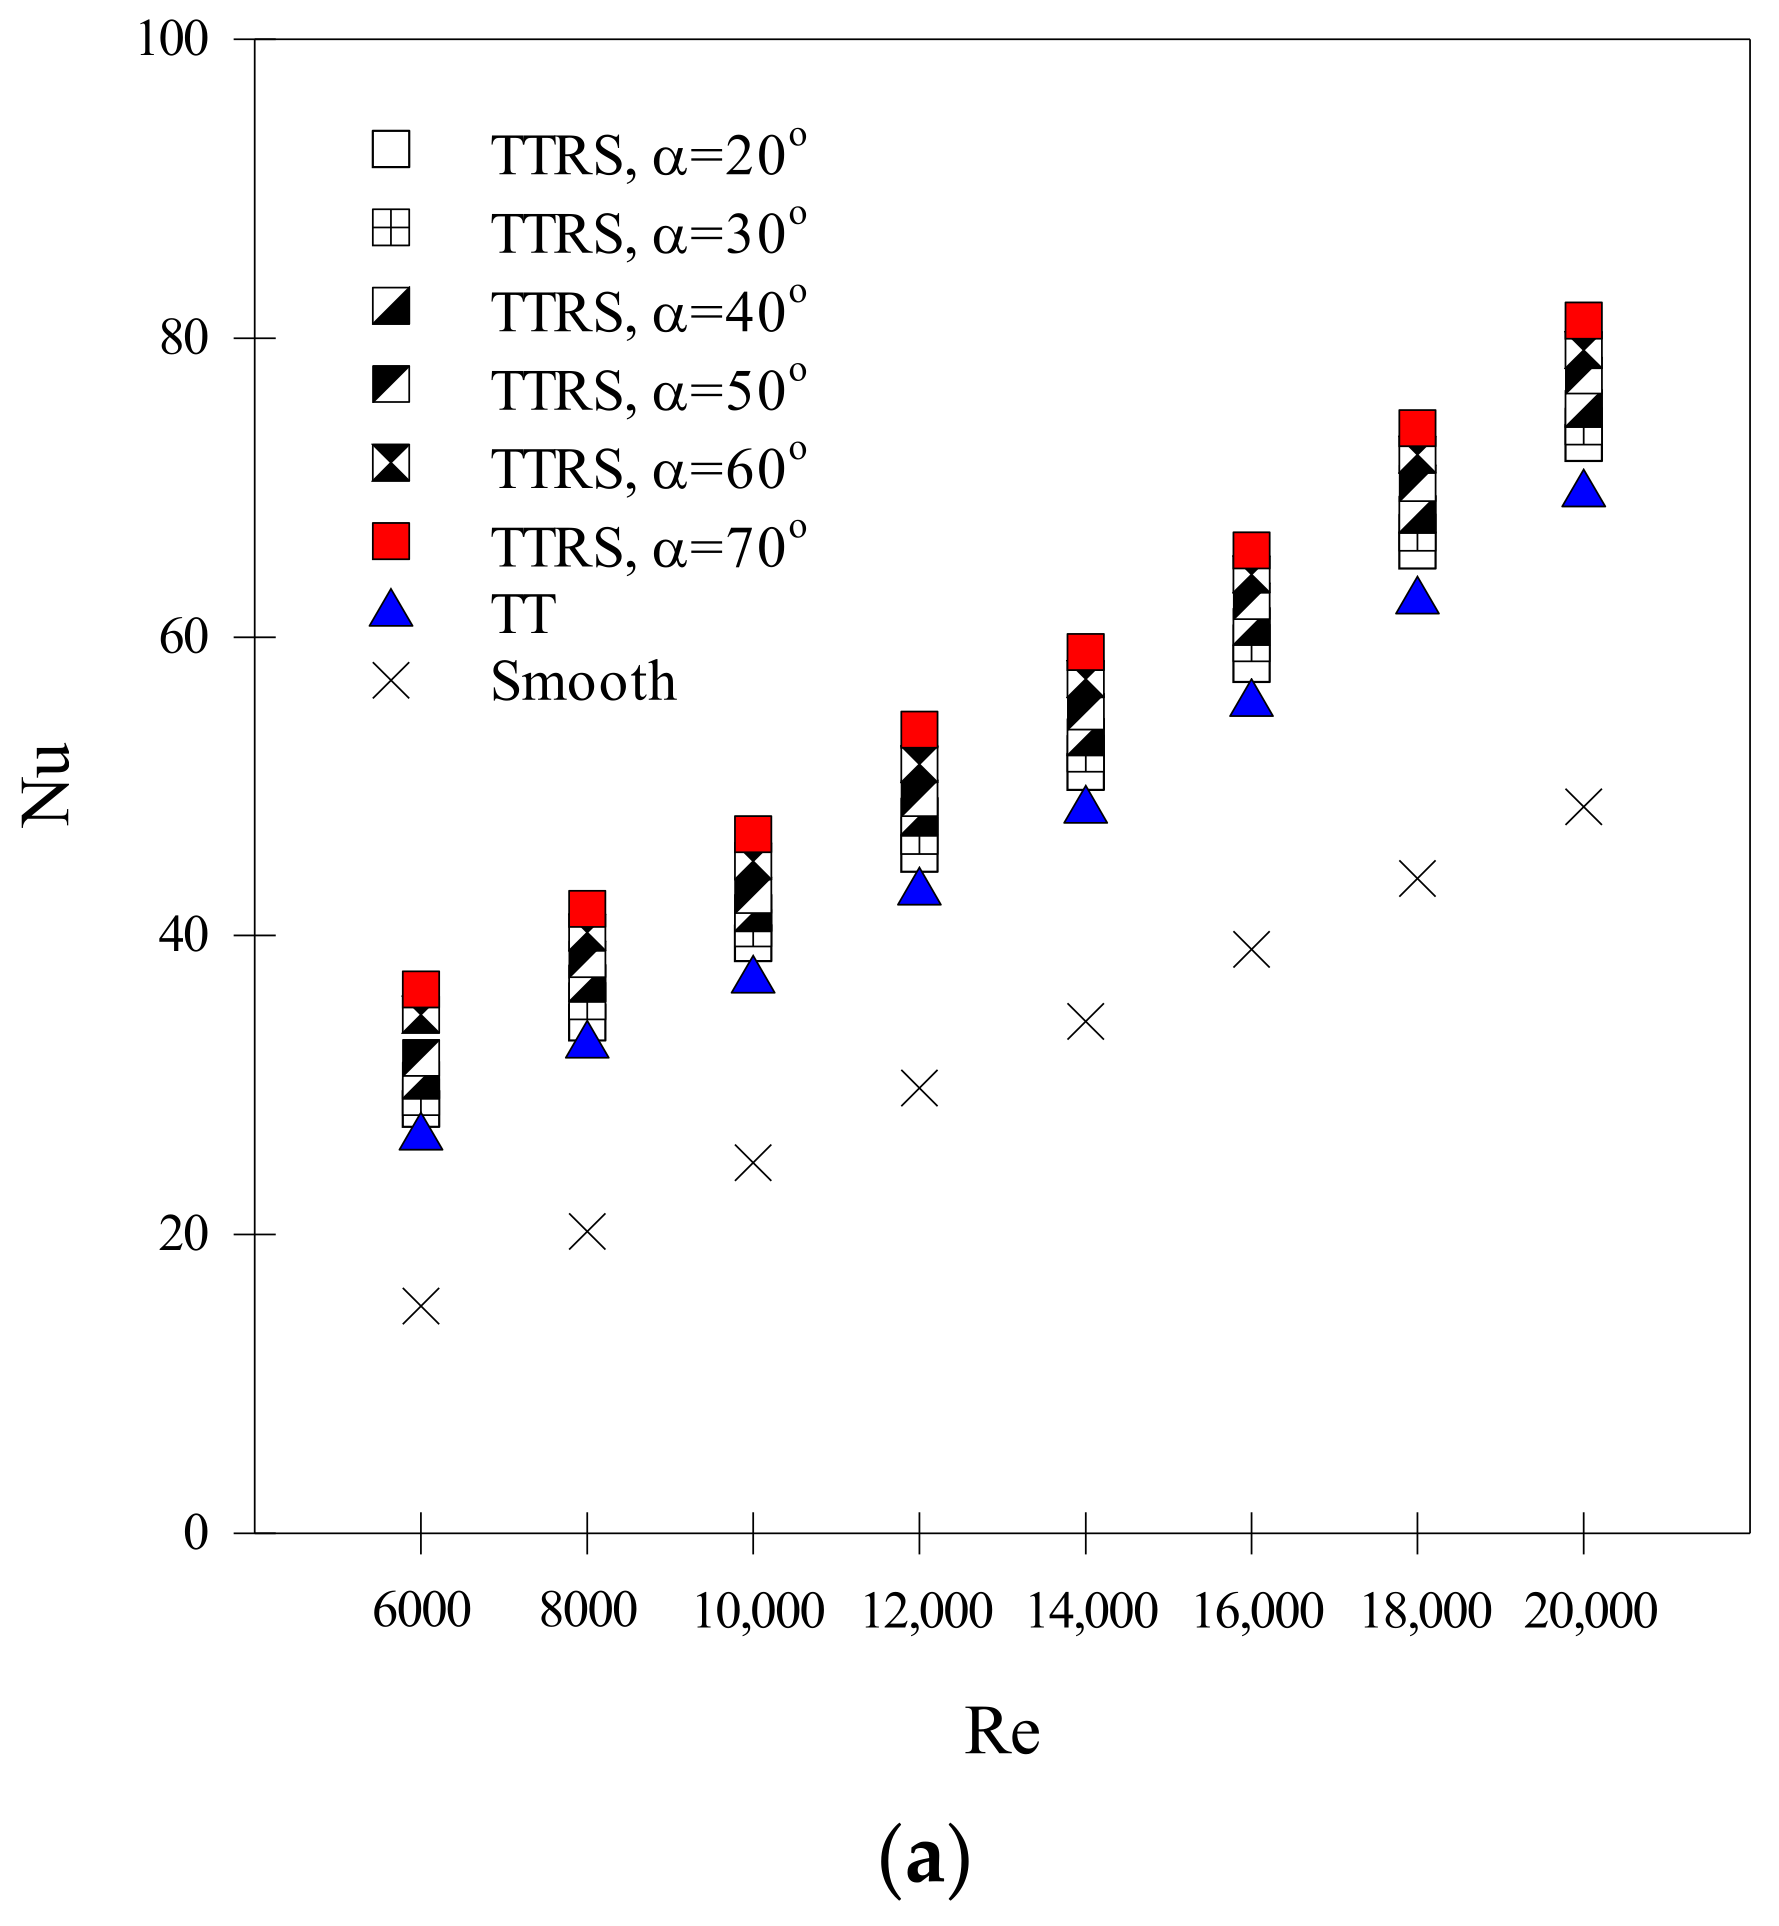
Twisted tapes in rib and sawtooth form (TTRSs) increase the Nusselt number with a reasonable friction loss penalty. The Nusselt number increases with the sawtooth angle and Re. For a heat exchanger tube with TTRSs installed while α = 20°, 30°, 40°, 50°, 60°, and 70°, the average Nusselt numbers increases are estimated to be 158%, 162%, 166%, 172%, 180%, and 187%, respectively. It is also found that the TTRSs with α = 70° outperform those with α = 20°, 30°, 40°, 50°, and 60° by approximately 1.18, 1.15, 1.12, 1.08, and 1.04 times, respectively.
The friction factors caused by TTRS devices with sawtooth angles (α) of 20°, 30°, 40°, 50°, 60°, and 70° are 3.51, 3.55, 3.60, 3.67, 3.75, and 3.82 times greater than those caused by a plain tube alone.
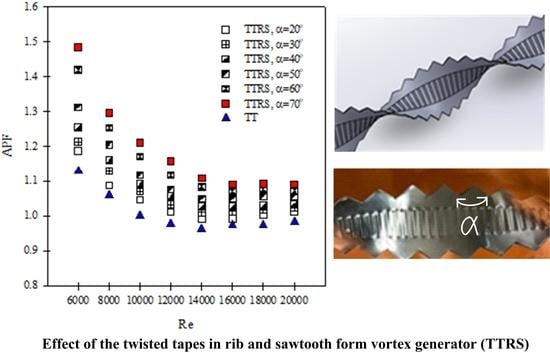
The maximum aerothermal performance index (API) was found at α = 70° owing to the dominant effect of increased heat transfer. It is more practical to use TTRSs with larger sawtooth angles at lower Reynolds numbers for energy savings. API values range from 0.99 to 1.19, 1.01 to 1.21, 1.03 to 1.26, 1.05 to 1.31, 1.07 to 1.42, and 1.09 to 1.48 for TTRSs with sawtooth angles (α) of 20°, 30°, 40°, 50°, 60°, and 70°, respectively.
Applying twisted tapes in rib and sawtooth form (TTRSs) with appropriate geometries at low Reynolds numbers results in a promising trade-off between enhanced heat transfer and an increased friction loss penalty resulting in a higher API.

Author Contributions

Conceptualization, M.H.; Methodology, C.T.; Formal analysis, S.C.; Methodology, Data curation, B.S.; Writing—original draft, P.P. and B.S.; Conceptualization, Writing—review & editing, S.E.-a. and N.M. All authors have read and agreed to the published version of the manuscript.

Funding

The Research on An Integrated Technology for Sustainable Development in the Agricultural Industry by King Mongkut’s Institute of Technology Ladkrabang (KMITL) has received funding support from the NSRF (FRB650028/0258).

Conflicts of Interest

The authors declare no conflict of interest.

Nomenclature

Aheat transfer area, m2
caspecific heat of air, J/kg·K
Dinner diameter of test tube, m
ffriction factor
haverage heat transfer coefficient, W/m2·K
kthermal conductivity of fluid, W/m·K
Llength of the test tube, m
m ˙ mass flow rate, kg/s
NuNusselt number
Δ P pressure drop, Pa
PrPrandtl number
Q a heat transfer rate of air, W
Q conv convective heat transfer rate of air, W
ReReynolds number
T ˜ average temperature, K
Ttemperature, K
Uaverage velocity of air flow, m/s
V ˙ volumetric flow rate, m3/s
Greek symbols
ρ fluid density, kg/m3
ν kinematic viscosity, m2/s
Subscripts
aair
bbulk
ininlet position
outoutlet position
wwall
psmooth tube
Abbreviations
APIaerothermal performance index
TTtypical twisted tape
TTRStwisted tape in a rib and sawtooth form

References

  1. Bergles, A.E. Techniques to augment heat transfer. In Handbook of Heat Transfer Applications; Rosenhow, W.M., Ed.; McGraw-Hill: New York, NY, USA, 1985. [Google Scholar]
  2. Marner, W.J.; Bergles, A.E.; Chenoweth, J.M. On the presentation of performance data for enhanced tubes used in shell-and tube heat exchangers. ASME J. Heat Mass Trans. 1983, 105, 358–365. [Google Scholar] [CrossRef]
  3. Altun, A.H.; Nacak, H.; Canli, E. Effects of trapezoidal and twisted trapezoidal tapes on turbulent heat transfer in tubes. Appl. Therm. Eng. 2022, 211, 118386. [Google Scholar] [CrossRef]
  4. Wongcharee, K.; Changcharoen, W.; Eiamsa-ard, S. Numerical investigation of flow friction and heat transfer in a channel with various shaped ribs mounted on two opposite ribbed walls. Int. J. Chem. React. 2011, 9, A26. [Google Scholar] [CrossRef]
  5. Eiamsa-ard, S.; Koolnapadol, N.; Promvonge, P. Heat transfer behavior in a square duct with tandem wire coil element insert. Chin. J. Chem. Eng. 2012, 20, 863–869. [Google Scholar]
  6. Li, W.; Yu, Z. Heat exchangers for cooling supercritical carbon dioxide and heat transfer enhancement: A review and assessment. Energy Rep. 2021, 7, 4085–4105. [Google Scholar] [CrossRef]
  7. Acır, A.; Ata, İ. A study of heat transfer enhancement in a new solar air heater having circular type turbulators. J. Energy Inst. 2016, 89, 606–616. [Google Scholar] [CrossRef]
  8. Nanan, K.; Thianpong, C.; Pimsarn, M.; Chuwattanakul, V.; Eiamsa-Ard, S. Flow and thermal mechanisms in a heat exchanger tube inserted with twisted cross-baffle turbulators. Appl. Therm. Eng. 2017, 114, 130–147. [Google Scholar] [CrossRef]
  9. Harish, H.; Manjunath, K. Heat and fluid flow behaviors in a laminar tube flow with circular protruded twisted tape inserts. Case Stud. Therm. Eng. 2022, 32, 101880. [Google Scholar]
  10. Mashayekhi, R.; Eisapour, A.H.; Eisapour, M.; Talebizadehsardari, P.; Rahbari, A. Hydrothermal performance of twisted elliptical tube equipped with twisted tape insert. Int. J. Therm. Sci. 2022, 172, 107233. [Google Scholar] [CrossRef]
  11. Ajarostaghi, M.; Soheil, S.; Zaboli, M.; Javadi, H.; Badenes, B.; Urchueguia, J.F. A review of recent passive heat transfer enhancement methods. Energies 2022, 15, 986. [Google Scholar] [CrossRef]
  12. Kaood, A.; Fadodun, O.G. Numerical investigation of turbulent entropy production rate in conical tubes fitted with a twisted-tape insert. Int. Commun. Heat Mass Transf. 2022, 139, 106520. [Google Scholar] [CrossRef]
  13. Gan, L.; Yang, C.; Zhang, J.; Zong, H.; Xu, B.; Qian, J. Internal flow analysis of a heat transfer enhanced tube with a segmented twisted tape insert. Energies 2020, 13, 207. [Google Scholar]
  14. Zheng, F.; Liu, S.; Lin, Z.; Nugud, J.; Wang, L.; Chang, L.; Wang, L. Experimental study on heat transfer performances of flat tube bank fin heat exchanger using four different fin patterns. ASME J. Heat Transfer. 2018, 140, 041801. [Google Scholar] [CrossRef]
  15. Okbaz, A.; Pınarbaşı, A.; Olcay, A.B. Experimental investigation of effect of different tube row-numbers, fin pitches and operating conditions on thermal and hydraulic performances of louvered and wavy finned heat exchangers. Int. J. Therm. Sci. 2020, 151, 106256. [Google Scholar] [CrossRef]
  16. Rajesh Babu, C.; Kumar, P.; Roy, S.; Kanungo, D. CFD analysis of an economizer for heat transfer enhancement using serrated finned tube equipped with variable fin segments. Mater. Today Proc. 2021, 45, 222–230. [Google Scholar] [CrossRef]
  17. Zhou, H.; Liu, D.; Sheng, Q.; Hu, M.; Cheng, Y.; Cen, K. Research on gas side performance of staggered fin-tube bundles with different serrated fin geometries. Int. J. Heat Mass Transf. 2020, 152, 119509. [Google Scholar] [CrossRef]
  18. Bošnjaković, M.; Čikić, A.; Muhič, S.; Stojkov, M. Development of a new type of finned heat exchanger. Tehnički vjesnik/Tech. Gaz. 2017, 24, 1785–1796. [Google Scholar]
  19. Liu, X.; Yu, J.; Yan, G. An experimental study on the air side heat transfer performance of the perforated fin-tube heat exchangers under the frosting conditions. Appl. Therm. Eng. 2020, 166, 114634. [Google Scholar] [CrossRef]
  20. Bošnjaković, M.; Muhič, S. Numerical analysis of tube heat exchanger with perforated star-shaped fins. Fluids 2020, 5, 242. [Google Scholar] [CrossRef]
  21. Wijayanta, A.T.; Pranowo, P.; Mirmanto, M.; Kristiawan, B.; Aziz, M. Internal flow in an enhanced tube having square-cut twisted tape insert. Energies 2019, 12, 306. [Google Scholar] [CrossRef] [Green Version]
  22. Ahmad, S.; Abdullah, S.; Sopian, K. Numerical and experimental analysis of the thermal performances of SiC/water and Al2O3/water nanofluid inside a circular tube with constant-increased-PR twisted tape. Energies 2020, 13, 2095. [Google Scholar] [CrossRef]
  23. Kalateh, M.R.; Kianifar, A.; Sardarabadi, M. Energy, exergy, and entropy generation analyses of a water-based photovoltaic thermal system, equipped with clockwise counter-clockwise twisted tapes: An indoor experimental study. Appl. Therm. Eng. 2022, 215, 118906. [Google Scholar] [CrossRef]
  24. Dagdevir, T.; Ozceyhan, V. An experimental study on heat transfer enhancement and flow characteristics of a tube with plain, perforated and dimpled twisted tape inserts. Int. J. Therm. Sci. 2021, 159, 106564. [Google Scholar] [CrossRef]
  25. Zhang, H.; Nunayon, S.S.; Alvin, X.J.; Lai, C.K. Pressure drop and nanoparticle deposition characteristics for multiple twisted tape inserts with partitions in turbulent duct flows. Int. J. Heat Mass Transf. 2022, 193, 121474. [Google Scholar] [CrossRef]
  26. Dagdevir, T.; Ozceyhan, V. A comprehensive second law analysis for a heat exchanger tube equipped with the rod inserted straight and twisted tape and using water/CuO nanofluid. Int. J. Therm. Sci. 2022, 181, 107765. [Google Scholar] [CrossRef]
  27. Dandoutiya, B.K.; Kumar, A. W-cut twisted tape’s effect on the thermal performance of a double pipe heat exchanger: A numerical study. Case Stud. Therm. Eng. 2022, 34, 102031. [Google Scholar] [CrossRef]
  28. Xie, C.; Mansir, I.B.; Mahariq, I.; Singh, P.K.; Arsalanloo, A.; Shahzad, R.M.; Jarad, F. Performance boost of a helical heat absorber by utilization of twisted tape turbulator, an experimental investigation. Case Stud. Therm. Eng. 2022, 36, 102240. [Google Scholar] [CrossRef]
  29. Soltani, M.M.; Gorji-Bandpy, M.; Vaisi, A.; Moosavi, R. Heat transfer augmentation in a double-pipe heat exchanger with dimpled twisted tape inserts: An experimental study. Heat Mass Transf. 2022, 58, 1591–1606. [Google Scholar] [CrossRef]
  30. Maithani, R.; Kumar, B.; Sharma, S.; Kumar, S.; Kumar, A. Effect of a unique winglet twisted tape insert on thermal and hydraulic properties of tubular heat exchanger. Exp. Heat Transf. 2022, 35, 1077–1098. [Google Scholar] [CrossRef]
  31. Muneeshwaran, M.; Wen, L.H.; Wang, C.C. Investigation of fouling mitigation using stationary and rotating twisted tapes. Appl. Therm. Eng. 2022, 214, 118896. [Google Scholar] [CrossRef]
  32. Bošnjaković, M.; Muhič, S.; Čikić, A. Experimental testing of the heat exchanger with star-shaped fins. Int. J. Heat Mass Transf. 2019, 149, 119190. [Google Scholar] [CrossRef]
  33. Kline, S.J.; McClintock, F.A. Describing Uncertainties in Single Sample Experiments. Mech. Eng. 1953, 75, 3–8. [Google Scholar]
  34. Bergman, T.L.; Lavine, A.S.; Incropera, F.P.; Dewitt, P.D. Fundamentals of Heat and Mass Transfer, 7th ed.; John Wiley & Sons: Hoboken, NJ, USA, 2011. [Google Scholar]
  35. Webb, R.L.; Kim, N.H. Principles of Enhanced Heat Transfer, 2nd ed.; Taylor & Francis: New York, NY, USA, 2005. [Google Scholar]
Figure 1. The modified twisted tapes for enhancing the heat transfer in heat exchanger tubes in relevant works. (a) square-cut twisted tape [21]. (b) constant-increased-PR twisted tape [22]. (c) clockwise counter-clockwise twisted tape [23]. (d) perforated and dimpled twisted tape [24]. (e) multiple twisted tapes [25]. (f) W-cut twisted tape [27]. (g) rod-inserted twisted tape [26].
Energies 15 08855 g001aEnergies 15 08855 g001b
Figure 2. Images of twisted tapes in rib and sawtooth form (TTRS) with α = 20°, 30°, 40°, 50°, 60°, and 70°.
Energies 15 08855 g002aEnergies 15 08855 g002b
Figure 3. Experimental apparatus.
Energies 15 08855 g003
Figure 4. Test for validating a plain tube. (a) Nu, (b) f.
Energies 15 08855 g004
Figure 5. Effect of the twisted tapes in rib and sawtooth form vortex generator (TTRS) at varying sawtooth angles (α) on heat transfer enhancement. (a) Nu, (b) Nu/Nup.
Energies 15 08855 g005aEnergies 15 08855 g005b
Figure 6. Effect of the twisted tapes in rib and sawtooth form vortex generator (TTRS) at varying sawtooth angles (α) on the friction factor. (a) f (b) f/fp.
Energies 15 08855 g006
Figure 7. Effect of the twisted tapes in rib and sawtooth form vortex generator (TTRS) at varying sawtooth angles (α) on the aerothermal performance index.
Energies 15 08855 g007
Figure 8. Comparison of experimental and predicted (a) Nu, (b) f, and (c) API.
Energies 15 08855 g008aEnergies 15 08855 g008b
Figure 9. Benchmarking of API results.
Energies 15 08855 g009
Table 1. The uncertainties in the current experimental data.
InstrumentDevice Accuracy
Resistance temperature detector (RTD)±0.001 Ω at 0 °C
−130 to +95 °C ±0.05 °C
Hot wire anemometer±0.015 m/s, range: 0–50 m/s
resolution: 0.01 m/s
Digital differential pressure gauge±3.2% for 250 Pa
Maximum error in experimental parameters
ParameterMaximum uncertainty error (%)
Reynolds number (Re)±5.2
Nusselt number (Nu)±8.1
Friction factor (f)±7.9
Aerothermal performance index±4.18
Publisher’s Note: MDPI stays neutral with regard to jurisdictional claims in published maps and institutional affiliations.

