Article

Optimization of the Selected Parameters of Single-Family House Components with the Estimation of Their Contribution to Energy Saving

Faculty of Civil Engineering and Environmental Sciences, Bialystok University of Technology, Wiejska Street 45E, 15-351 Bialystok, Poland
*
Author to whom correspondence should be addressed.
Energies 2022, 15(23), 8810; https://doi.org/10.3390/en15238810
Submission received: 29 September 2022 / Revised: 18 November 2022 / Accepted: 20 November 2022 / Published: 22 November 2022

Abstract

:
Knowledge of the influence of factors determining energy consumption in buildings is very important for the possibility of effective energy saving. This article describes the results of an original study on the analysis of the annual energy demand for heating (QH;nd), cooling (QC;nd), and annual usable energy demand (QH/C;nd = QH;nd + QC;nd) assumed as objective functions of a designed single-family building, which can be classified as a typical representative of currently built houses in Poland. It was assumed that the object of study was located in the climatic conditions of north-eastern Poland. The study takes into consideration three groups of selected parameters: architectural/spatial, structural, and physical properties of windows. The research was carried out in a single-family building, as energy consumption in residential buildings accounts for a significant part of the total energy consumption in buildings. In the group of architectural/spatial parameters, the height of rooms in the building (h) and the window area change coefficient (k) were taken into consideration. The design parameters pertained to the solutions of building components: the density of the material of the inner layer of the external walls (ρ1), the density of the material of internal walls (ρ2), and the thickness of internal walls (d). In the third group of parameters, the heat transfer coefficient of the glazing (Ug) and the total solar transmittance of the glazing (g) were considered. Deterministic mathematical models of these dependencies were developed on the basis of the results of a computational experiment, obtained by performing a simulation with the use of the DesignBuilder software, based on the EnergyPlus computational engine. The models allowed the authors to estimate the degree and nature of the influence of the examined factors on the building’s energy demand. As a result of the optimization of parameters according to the energy criterion, the contribution of each of the three groups of parameters to energy saving was determined. Deterministic numerical optimization using MATLAB was applied. It turned out that the factors from the first group played the most important role in energy savings (40.0%), and the factors from the third group contributed slightly less (25.7%). The contribution of the characteristics from the second group was 4.2% of the total value of energy saving. This information can be useful to scientists, as well as engineers and policymakers, in making correct decisions when designing new residential buildings.

1. Introduction

Sustainable development of our planet highly depends on energy consumption. It is estimated that, in 2020, energy consumption for the construction and operation of buildings amounted to 36% of global energy demand and decreased by 2% compared to 2015 [1]. At the same time, emissions related to this sector fell from 38% by as much as 10% [1]. This was influenced by both the efforts made by individual countries to decarbonize the building sector and improve its energy efficiency, and the reduced energy demand due to the COVID-19 pandemic. Following the recovery of economies from the pandemic, 2021 saw the expected renewed increase in emissions, albeit mitigated by further decarbonization of the energy sector [2]. Progress in improving the energy efficiency of buildings since 2010 has contributed to the increase in energy consumption being decoupled from the increase in floor space in the buildings sector. Final energy consumption in buildings increased in this period at an average annual rate of 1%, lagging behind the average 2% increase in usable floor space [2], resulting from, inter alia, a growing world population. In order to protect against the deterioration of the environment and the threatening lack of energy supplies (especially today), the necessity to strive to achieve the emission neutrality of building resources by 2050 [3] is of particular importance. To achieve this goal, all new buildings and 20% of the existing building stock should have net zero emissions by 2030 [4]. In this light, it is extremely important to know the impact of factors that determine the energy consumption of buildings, especially newly designed ones, which should be designed according to almost zero-energy standard (nZEB) in all European Union countries starting 31 December 2020 [5].
One can distinguish three main groups of factors that influence energy consumption, including building characteristics (structural and material solutions), equipment and technologies, and user behavior. The first group includes the following:
-
Shaping the external form of the building, adapted to the climate and the possibility of obtaining available solar energy, including the ratio of the window area to the wall area, the building’s shape factor, or the layout of the rooms;
-
Location of the building, its orientation, and urban conditions (determining the location of the building in relation to the cardinal directions and shading from the surrounding buildings, elements of small architecture, and greenery);
-
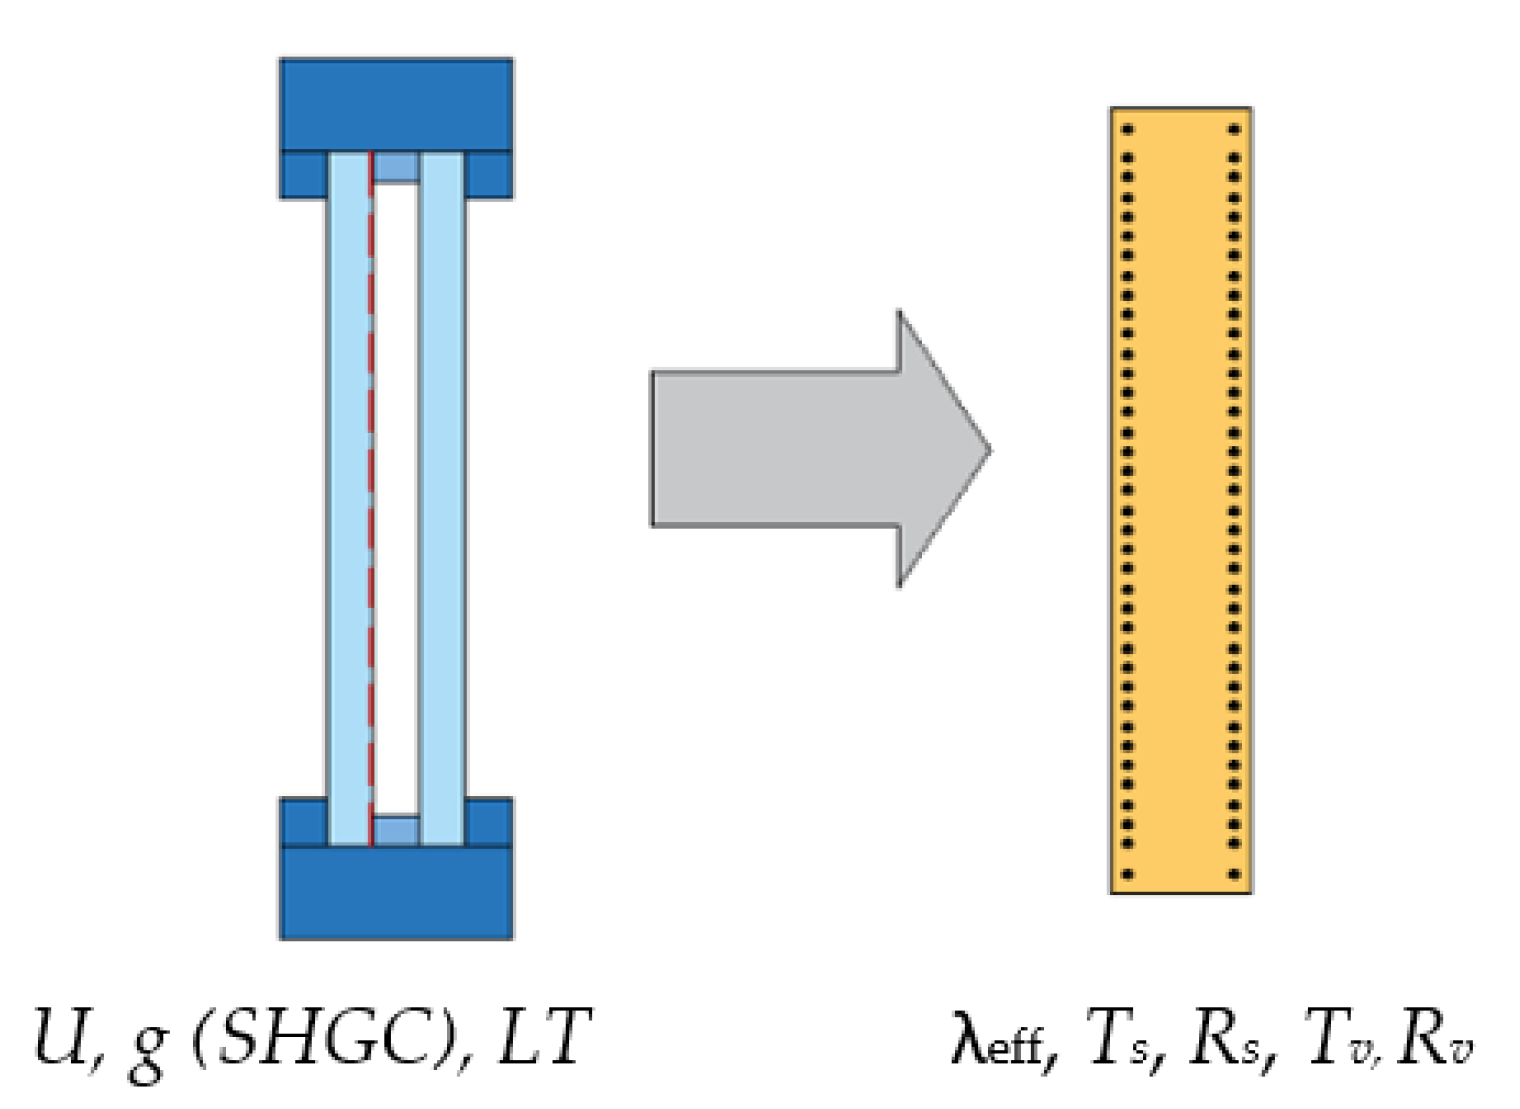
Construction of partitions, including material solutions (insulation parameters, accumulation capacity, and variable parameters of solar energy transmittance of transparent partitions).
The second group includes HVCA system solutions (type and parameters of the ventilation, heating and hot water system, the possibility of their regulation and intelligent energy and building management, and heat sources), as well as internal equipment. The third group concerns the way of using the building related to its purpose/type, usage schedules, and the habits and behavior of individual people.
How the aforementioned factors influence energy demand has long been the subject of interest of many researchers. Among the factors, one can distinguish those that cannot be changed or improved after the building is completed; hence, they should be well thought out and planned at the design stage. They include most of the factors from the first group mentioned above, including the geometric shape of the building or the height of the story. The influence of the shape of the building on energy demand has been analyzed in the literature on the basis of various compactness indicators [6,7,8,9,10]. It was noticed that the relationship between the values of simple indicators, which do not take into account the size of the building’s surface that is exposed to sunlight, and the simulated heat loads of buildings is significant [6,10]. However, simple numeric indicators of compactness (which make use of the relation between the volume of a built form and its surface area) are not suitable for the predictive assessment of the risk of overheating [6]. Therefore, an important factor from the point of view of energy demand and strongly related to the possibility of obtaining solar radiation energy, is the size of the glazing used (the ratio of the area of windows to walls), as well as the orientation. Physical parameters of windows (heat transfer coefficient and solar radiation energy transmittance) are also important [11]. The physical parameters of windows can be improved quite easily by replacing them at the stage of use [12,13]. Furthermore, the size of the glazing of the building walls can be adjusted after the building is erected, although this is a high-cost project and not always easily feasible. Goja [14] investigated the optimal ratio of windows to walls in various European climates in an office building characterized by the best available technologies for construction and material solutions. Obrecht et al. [15] determined the influence of orientation on the optimal glazing size for passive houses in various European climates. Another factor that is difficult (but not impossible) to change at the operational stage is the material from which the walls of the building are made. The discussion on whether the heat capacity of masonry materials is important was undertaken, inter alia, by Szymanski [16]. He pointed out that, when deciding to build a house, one should pay attention not only to the accumulation and heat capacity of traditional masonry materials, but also to other parameters such as thermal insulation [11]. There have also been many studies evaluating several factors together. A previous study [17] presented the optimization of the shape and functional structure of buildings and the use of heat sources in large apartment blocks. Pacheo et al. [18] analyzed six design criteria: building orientation, shape, partition system, passive heating and cooling mechanisms, shading, and glazing. They found that the main factors influencing the final energy demand of a residential building are its shape, orientation, and the ratio of the building’s external surface area to its volume. They also emphasized that the benefits of an energy-efficient construction design should be assessed throughout the building’s life cycle, as a more energy-efficient building design does not necessarily coincide with more economic or environmentally friendly designs. For this reason, recently there has been an emphasis on the evaluation of projects throughout their life cycle [19]. The developing BIMt (building information modeling) technology can also meet these multithreaded considerations [20,21]. Multicriteria methods [22] or self-organizing maps [23] are also used; however, there are difficulties with the availability of such tools for designers and investors, especially of single-family houses. Therefore, conducting analyses that provide information on the impact of basic decisions important for the user at the initial design stage, in the current conditions of the requirements for buildings in particular climatic conditions, is important and useful.
After analyzing the above-described literature data on the possible impact of the parameters of building elements and solutions on the annual energy demand for heating/cooling through their contribution to heat transfer in partitions and destabilization of the heat capacity of building elements and thermal inertia of the heated space, it was found justified to analyze the simultaneous influence of several factors, assuming the current requirements and construction solutions.
The aim of the study was to analyze the impact of seven selected design parameters on the annual energy demand for heating QH;nd, cooling QC;nd, and annual usable energy demand QH/C;nd = QH;nd + QC;nd of a designed single-family building, which can be classified as a typical representative of currently built houses in Poland. It was assumed that the object of study was located in the climatic conditions of northeastern Poland (Bialystok) The selected parameters were divided into three groups:
-
Architectural and spatial, regarding the dimensions of rooms and windows (the height of rooms in the building h, and the window area changes coefficient k),
-
Structural, concerning the solutions of the building components (the density of the material of the inner layer of the external walls ρ1, the density of the material of internal walls ρ2, and the thickness of the internal walls d),
-
Physical properties of windows (the heat transfer coefficient of the glazing Ug and the total solar transmittance of the glazing g).
On the basis of the results of the computational experiment, obtained by simulation with the use of DesignBuilder software, based on the EnergyPlus engine, it was planned to develop deterministic mathematical models of these dependencies and to estimate the degree and nature of the influence of the examined factors on the selected functions Y1, Y2, and Y3. The parameters were also optimized according to the energy criterion and the contribution of each of the three groups of parameters to energy saving was determined.
The research carried out in this article consisted of the following steps: for the selected seven factors influencing the building’s energy demand for heating and cooling, the levels of variability of their values were determined, based on the current, commonly used solutions and design guidelines in Poland. The next stage was deterministic mathematical modeling, based on a symmetrical three-level plan, for which the results of calculating the energy demand of a selected typical single-family house were used. After analyzing the influence of the selected factors on the energy demand for heating and cooling, they were optimized with the numerical method (using MATLAB), based on the energy criterion.

2. Materials and Methods

2.1. Characteristics of the Tested Building

The study was conducted on a single-family, single-family, one-story building without a basement, with an attic, with a simple shape, reminiscent of the traditional style. It should be classified as a typical representative of currently built houses in Poland [24,25]. The usable area of the building is 150.11 m2 and the cubic volume is approximately 690 m3. In the plan, the building has the shape of a rectangle with dimensions 9.54 m × 11.04 m. The building is designed using a traditional brick technology, with a gable roof covered with ceramic tiles. The main façade is oriented toward the north. The diagram of the building under study is shown in Figure 1. The walls of the building are made of aerated concrete and polystyrene. The roof is insulated with mineral wool with plasterboards on the attic side. The floor on the ground consists of the following layers: concrete base on a gravel bed, roofing felt, polystyrene with a thickness of 10 cm, PE foil, and floor layers on a concrete base. PVC external doors were used. Detailed solutions used in the building are presented in Figure 1e. The wooden windows frames are insulated (U = 0.80 W/(m2·K)) and installed in a layer of thermal insulation of walls (Figure 1f). The ventilation is natural. The building uses a natural gas boiler, panel heaters placed under the windows with thermostatic valves, central and local regulation, and pipes with good insulation in heated rooms.
Schematic drawings of individual stories and elevations (Figure 1) were used to create the geometric model of the building. Figure 2 shows a building model made with DesignBuilder (version 6.1.7.007) developed by Design Builder Software in Stroud, Gloucestershire, UK [26].

2.2. A Method for Calculating the Annual Heating/Cooling Energy Demand

The DesignBuilder program was used to simulate the energy demand for heating and cooling the building according to the hourly method, which uses the EnergyPlus engine and enables a very user-friendly input of building data for calculations (Figure 3) and user-friendly processing of calculation results.
The building analyzed in the article was divided into 11 zones (six on the ground floor and five in the attic), as shown in Figure 4.
The DesignBuilder program used in the article has been validated in many studies [29,30,31,32,33,34]. In the context of validating the results of the simulation of annual energy consumption, a very low error rate was obtained: 1.6% [29] or 3.17% [34].
The Solution Manager of the EnergyPlus program performs the heat balance of the building zone based on the heat and mass exchange model [35], which can be described by Equation (1).
Q ˙ s y s = 1 N s l Q i ˙ + 1 N s u r f a c e h i A i ( T s i T z ) + 1 N z o n e s m i ˙ C p ( T z i T z ) + m ˙ i n f C p ( T T z ) C z d T z d t ˙ ,
where 1 N s l Q i ˙ is the sum of the convective internal loads, Nl is the number of internal loads, 1 N s u r f a c e h i A i ( T s i T z ) is the convective heat transfer from the zone surfaces, Ns is the number of zone surfaces, hi is the convective heat transfer coefficient, Ai is the area of the zone surface, Tsi is the zone surface temperature, T z is the air temperature in the zone,   1 N z o n e s m i ˙ C p ( T z i T z ) is the heat transfer due to interzone air mixing, Nz is the number of zones, m ˙ i is the interzone mass flow, Cp is the zone air specific heat, Tzi is the adjacent zone temperature, m ˙ i n f C p ( T T z ) is the heat transfer due to infiltration of outside air (including ventilation exchange), m ˙ i n f is the mass flow by infiltration, T is the ambient temperature, C z d T z d t is the energy stored in zone air (time derivative), t is the time, and C z is the zone heat capacity, determined using Equation (2).
C z = ρ a i r · C p · C T ,
where ρair is the zone air density, CT is the sensible heat capacity multiplier, and Q ˙ s y s (QH/C,nd) is the air system output (convective heat gains from the heating system).
The system energy supplied to zone Qsys, to cover the heating or cooling loads, is calculated from the difference between the enthalpy of the supply air and the enthalpy of the air leaving the zone, as shown in Equation (3).
Q ˙ s y s = m ˙ s y s C p ( T s T z ) ˙ ,
where m ˙ s y s is the mass flow associated with the heating system, and Ts is the inlet air temperature.
To calculate the convective component of the zone load for each surrounding surface (walls, floor, roof, etc.), a detailed energy balance was made on the inner and outer surfaces of each partition, and the transient heat conduction in the material between the surfaces was solved using the heat conduction function (CTF), as materials with constant properties and constant values of their parameters were considered in the building. This solution gives the indoor and outdoor temperatures and heat fluxes that must be known to calculate the convection component to the zone load for each zone surface. For a single-layer partition, shown in Figure 5, with two internal nodes and convection on both sides, the resulting finite difference equations are presented in Equations (4)–(7).
C d T 1 d t = h · A · ( T 0 T 1 ) + T 2 T 1 R ,
C d T 2 d t = h · A · ( T i T 2 ) + T 1 T 2 R ,
q i = h · ( T i T 2 ) ,
q o = h · ( T 1 T 0 ) ,
where C is the heat capacity, determined using Equation (8).
C = ρ · c · d · A 2 ,
where ρ is the density of the material of the layer, c is the specific heat capacity of the material of the layer, d is the thickness of the layer, A is the area of the surface exposed to the environmental temperatures, h is the convective heat transfer coefficient, and R is the thermal resistance, calculated using Equation (9).
R = d λ · A .
The CTF conduction transfer function method is used to solve the transient conduction problem for each surface. The result of this method is a time series of weighting factors which, when multiplied by the previous surface and flux temperatures and the current internal and external surface temperatures, give the current inside and outside heat flux. This method can be easily applied to multilayer structures for which analytical solutions are not available. To the calculations, the article introduces individual materials with four parameters that are interesting for the calculation of the conductivity transfer function: thickness, conductivity, density, and specific heat. In the case of these materials, each layer in the structure is divided into nodes in the program, and, in the case of multilayer structures, the nodes are also placed at the junction of two layers (these interface nodes consist of half of the first layer node and half of the second layer node).
For the surface of the partition, a balance is created (Equation (10)) that considers the heat flux exchanged not only via convection (qconv) and the heat flux conducted through the partition (qλ), but also via short- and long-wave radiation.
q c o n v q λ + q s o l + q i r = 0 ,
where qsol is the direct and diffuse solar radiation absorbed by the surface (short wave radiation), and qir is the long-wave radiation exchanged with the environment (Earth and sky for the outer surface or other partitions, equipment, and heat sources for the inner surface).
Solar heat gain through transparent partitions is determined in EnergyPlus taking into account direct, diffuse, and solar radiation reflected from the ground, while the anisotropic model of the sky is used to calculate the intensity of scattered radiation on the external surfaces of the building.
In the EnergyPlus program, in the window simulation algorithm, the transmission capacity and thermal insulation can be calculated on the basis of the entered spectral characteristics of the glazing, gas properties in inter-pane spaces, window arrangement and size, etc. An alternative model (simple window model) can also be used, which enables the introduction of simplified indicators window efficiency in the form of the SHGC (g) and the Ug value of the glazing and optionally the light transmission coefficients [36]. This is the approach used in this article because usually only Ug and g information can be obtained from window manufacturers at the building design stage, and more detailed data are not available. These simple indices introduced into the EnergyPlus program are then converted into an equivalent single-layer window (Figure 6), as the program cannot use simple window indicators to model the effect of windows on energy demand [36].
After generating the layer properties, the layer-by-layer model is used for further calculations. The properties of the equivalent layer are determined using the step-by-step method outlined by Arasteh et al. [37]. At the beginning, the resistance of the glass itself Rl,w is determined (w denotes without the coefficients of the films (coatings)) using Equation (11).
R l , w = 1 U R i , w R o , w ,
where Ri,w is the resistance of the interior film coefficient under winter conditions, U-related, calculated from the appropriate correlation depending on the Ug value of the glass [37], and Ro,w is the resistance of the outside film coefficient under winter conditions, U-related, computed from the appropriate correlation [37].
Then, the thickness of the equivalent layer (thickness) is determined from the dependence in Equation (12), in the case when the reciprocal of the resistance of the glass itself is not greater than 7 W/(m2·K), and then the effective thermal conductivity of the equivalent layer, λeff, is determined using Equation (13):
T h i c k n e s s = 0.05914 0.00714 R l , w .
λ e f f = T h i c k n e s s R l , w .
The solar radiation transmittance of the layer, Tsol, is then determined from the dependence in Equation (14), if Uvalue < 3.4 W/(m2·K) and SHGC > 0.15.
T s o l = 0.085775 · S H G C 2 + 0.963954 · S H G C 0.084945 .
This value is used to determine the reflection coefficients of solar and visible radiation in the layer, as well as their transmittance, on the basis of the formulas determined by Arasteh et al. [37].
The article additionally introduces the k factor (reducing and then increasing the base area of the window Ai,ok by about 20%) in Equation (15).
A i ,   o k ,   v a r = A i ,   o k · k .

2.3. Mathematical Modeling of the Annual Energy Demand for Heating and Cooling the Selected Building

In order to ensure the usefulness of the developed models, as well as their practicality and effectiveness, short models should be developed, using the most important factors that describe the examined process or property. The factors included in the model should be assumed as controllable, unambiguous, noncontradictory, and mutually independent [38].
According to the aim of the study, the annual energy demand for heating (QH;nd), that for cooling (QC;nd), and the total annual usable energy demand (QH/C;nd = QH;nd + QC;nd) were assumed as the objective functions (Y1, Y2, and Y3, respectively). It was decided to investigate the impact on these functions of seven design parameters influencing the thermal balance of the building, namely, the height of the rooms in the building h (factor X1), window area changes coefficient k (factor X2), density of the material of the inner layer of the external walls ρ1 (factor X3), density of the material of internal walls ρ2 (factor X4), thickness of the internal walls d (factor X5), heat transfer coefficient of glazing Ug (factor X6), and total solar transmittance of glazing g (factor X7). The selected factors were classified into threee groups of parameters:
-
Architectural and spatial parameters: factors X1 and X2,
-
Structural parameters: factors X3, X4, and X5,
-
Physical properties of windows: factors X6 and X7.
The choice of factors was related to the goal set by the authors to determine the possible effects of their impact on reducing the annual energy demand by transferring heat in partitions and destabilizing the heat capacity of building elements and the thermal inertia of the heated space (the selected factors influence the internal heat capacity of the building). Factors X6 and X7 characterize the physical properties of windows. However, these parameters interact with the remaining group of factors, because they directly affect heat losses and heat gains from solar radiation. According to the authors’ assumptions, using the optimal values of these parameters can ensure the greatest reduction in the annual energy demand for heating/cooling in a building.
It was assumed that the dependencies Y1,2,3 = f (X1,X2,X3,X4,X5,X6,X7) could be described by a second degree polynomial. A seven-factor active computational experiment was carried out according to the second-degree plan (Table 1) to obtain a database for modeling and to describe the sought relationships. In active experiments, factors should take on specific values that are constant in each trial. These experiments are carried out according to optimal plans, the quality of which is confirmed by criteria calculated using computer techniques. A limited number of data points are needed to obtain information about the object in these cases. A total of 12 seven-factor plans were analyzed in this paper at the plan selection stage. A three-tier plan with 40 trials and a high D criterion (e(D) = 0.910) were used [39].
The annual energy demand for heating/cooling the selected building was determined for the climatic conditions of Bialystok [40].
When selecting the range of variability of factors, the properties, and the purpose of available materials, construction elements and building solutions commonly used in single-family housing, local traditions, and the requirements for thermal insulation of building elements and architectural and spatial assumptions were taken into account [41]. For factor X1 (i.e., the height of rooms in the building h), three levels were adopted: 2.7 m (−1), 3.0 m (0), and 3.3 m (+1). The values of factor X2 (i.e., the window area changes coefficient k) were adopted at the levels 0.8 (−1), 1.0 (0), and 1.2 (+1). The values of factor X3 (i.e., the density of the material of the inner layer of the external walls ρ1) at individual levels were adopted as 800 kg/m3 (−1), 1200 kg/m3 (0), and 1600 kg/m3 (+1), while the values of factor X4 (i.e., density of the material of internal walls ρ2) were 1500 kg/m3 (−1), 1800 kg/m3 (0), and 2100 kg/m3 (+1). For factor X5 (i.e., the thickness of the internal walls d), the following values were assumed: 0.12 m (−1), 0.18 m (0), and 0.24 m (+1). The factor X6 (the heat transfer coefficient of the window glazing Ug) was assumed at the levels 0.4 W/(m2·K) (−1), 0.6 W/(m2·K) (0), and 0.8 W/(m2·K) (+1), while factor X7 (concerning the total solar transmittance of the glazing g) was assumed at the levels 0.5 (−1), 0.6 (0), and 0.7 (+1).
The abovementioned natural values of factors 1, 2, 3, 4, 5, 6, and 7 and their corresponding standard values X1, X2, X3, X4, X5, X6, and X7 are presented in Table 1. The transition from the natural value i to the normalized (coded) Xi is expressed as follows:
Xi = [2i − (imax + imin)]/(imaximin),
where i, imax, and imin are the current, maximum, and minimum natural values of the i-th factor, respectively.
The remaining input data necessary to simulate the energy demand of the analyzed building, according to Equation (1), which was assumed at a constant level, are listed below. Table 2 presents the structure of external partitions, which was selected in such a way as to meet the current requirements for newly constructed buildings in Poland [41].
In the case of the roof and the ceiling under the unheated attic, the heat transfer coefficient turned out to be 2% lower than the maximum permissible value [41]; in the case of external walls, it was 16% lower, and, in the case of the floor on the ground, it was 19% lower.
Linear heat transfer coefficients of thermal bridges, modeled using the THERM 6.3 program [42], were as follows: roof–wall and wall–floor connection on the ground Ψ = 0.05 W/(m∙K); corners of external walls Ψ = −0.05 W/(m∙K); wall–window connection Ψ = 0.025 W/(m∙K). The building has natural ventilation, which is typical for the majority of currently built single-family houses in Poland. The air exchange rate was determined at 0.5 ac/h.

3. Development of Mathematical Models of the Studied Dependencies

3.1. Results of Energy Simulations and Development of Mathematical Models

The results of simulation calculations of the energy demand for heating and cooling the building in 40 analyzed samples (according to Table 1), performed with the use of the hourly method using the DesignBuilder program with the EnergyPlus engine, are presented in Table 3.
On the basis of the results of simulation calculations (Table 3) performed using the least squares method [43], the models in Equations (17)–(19) were developed in the form of dependency regression equations Yi = f(X1, X2, X3, X4, X5, X6, X7).
- Annual energy demand for heating the selected building QH;nd:
Ŷ1 = 7378.41 + 479.74X1 − 191.08X2 + 12.60X3 − 26.08X4 − 44.68X5 + 415.06X6 − 395.00X7 − 31.92X1X2
42.41X1X3 + 32.81X1X4 − 39.29X1X5 + 32.50X1X6 − 31.54X1X7 − 8.07X2X3 + 12.41X2X4 − 18.03X2X5 + 99.18X2X6
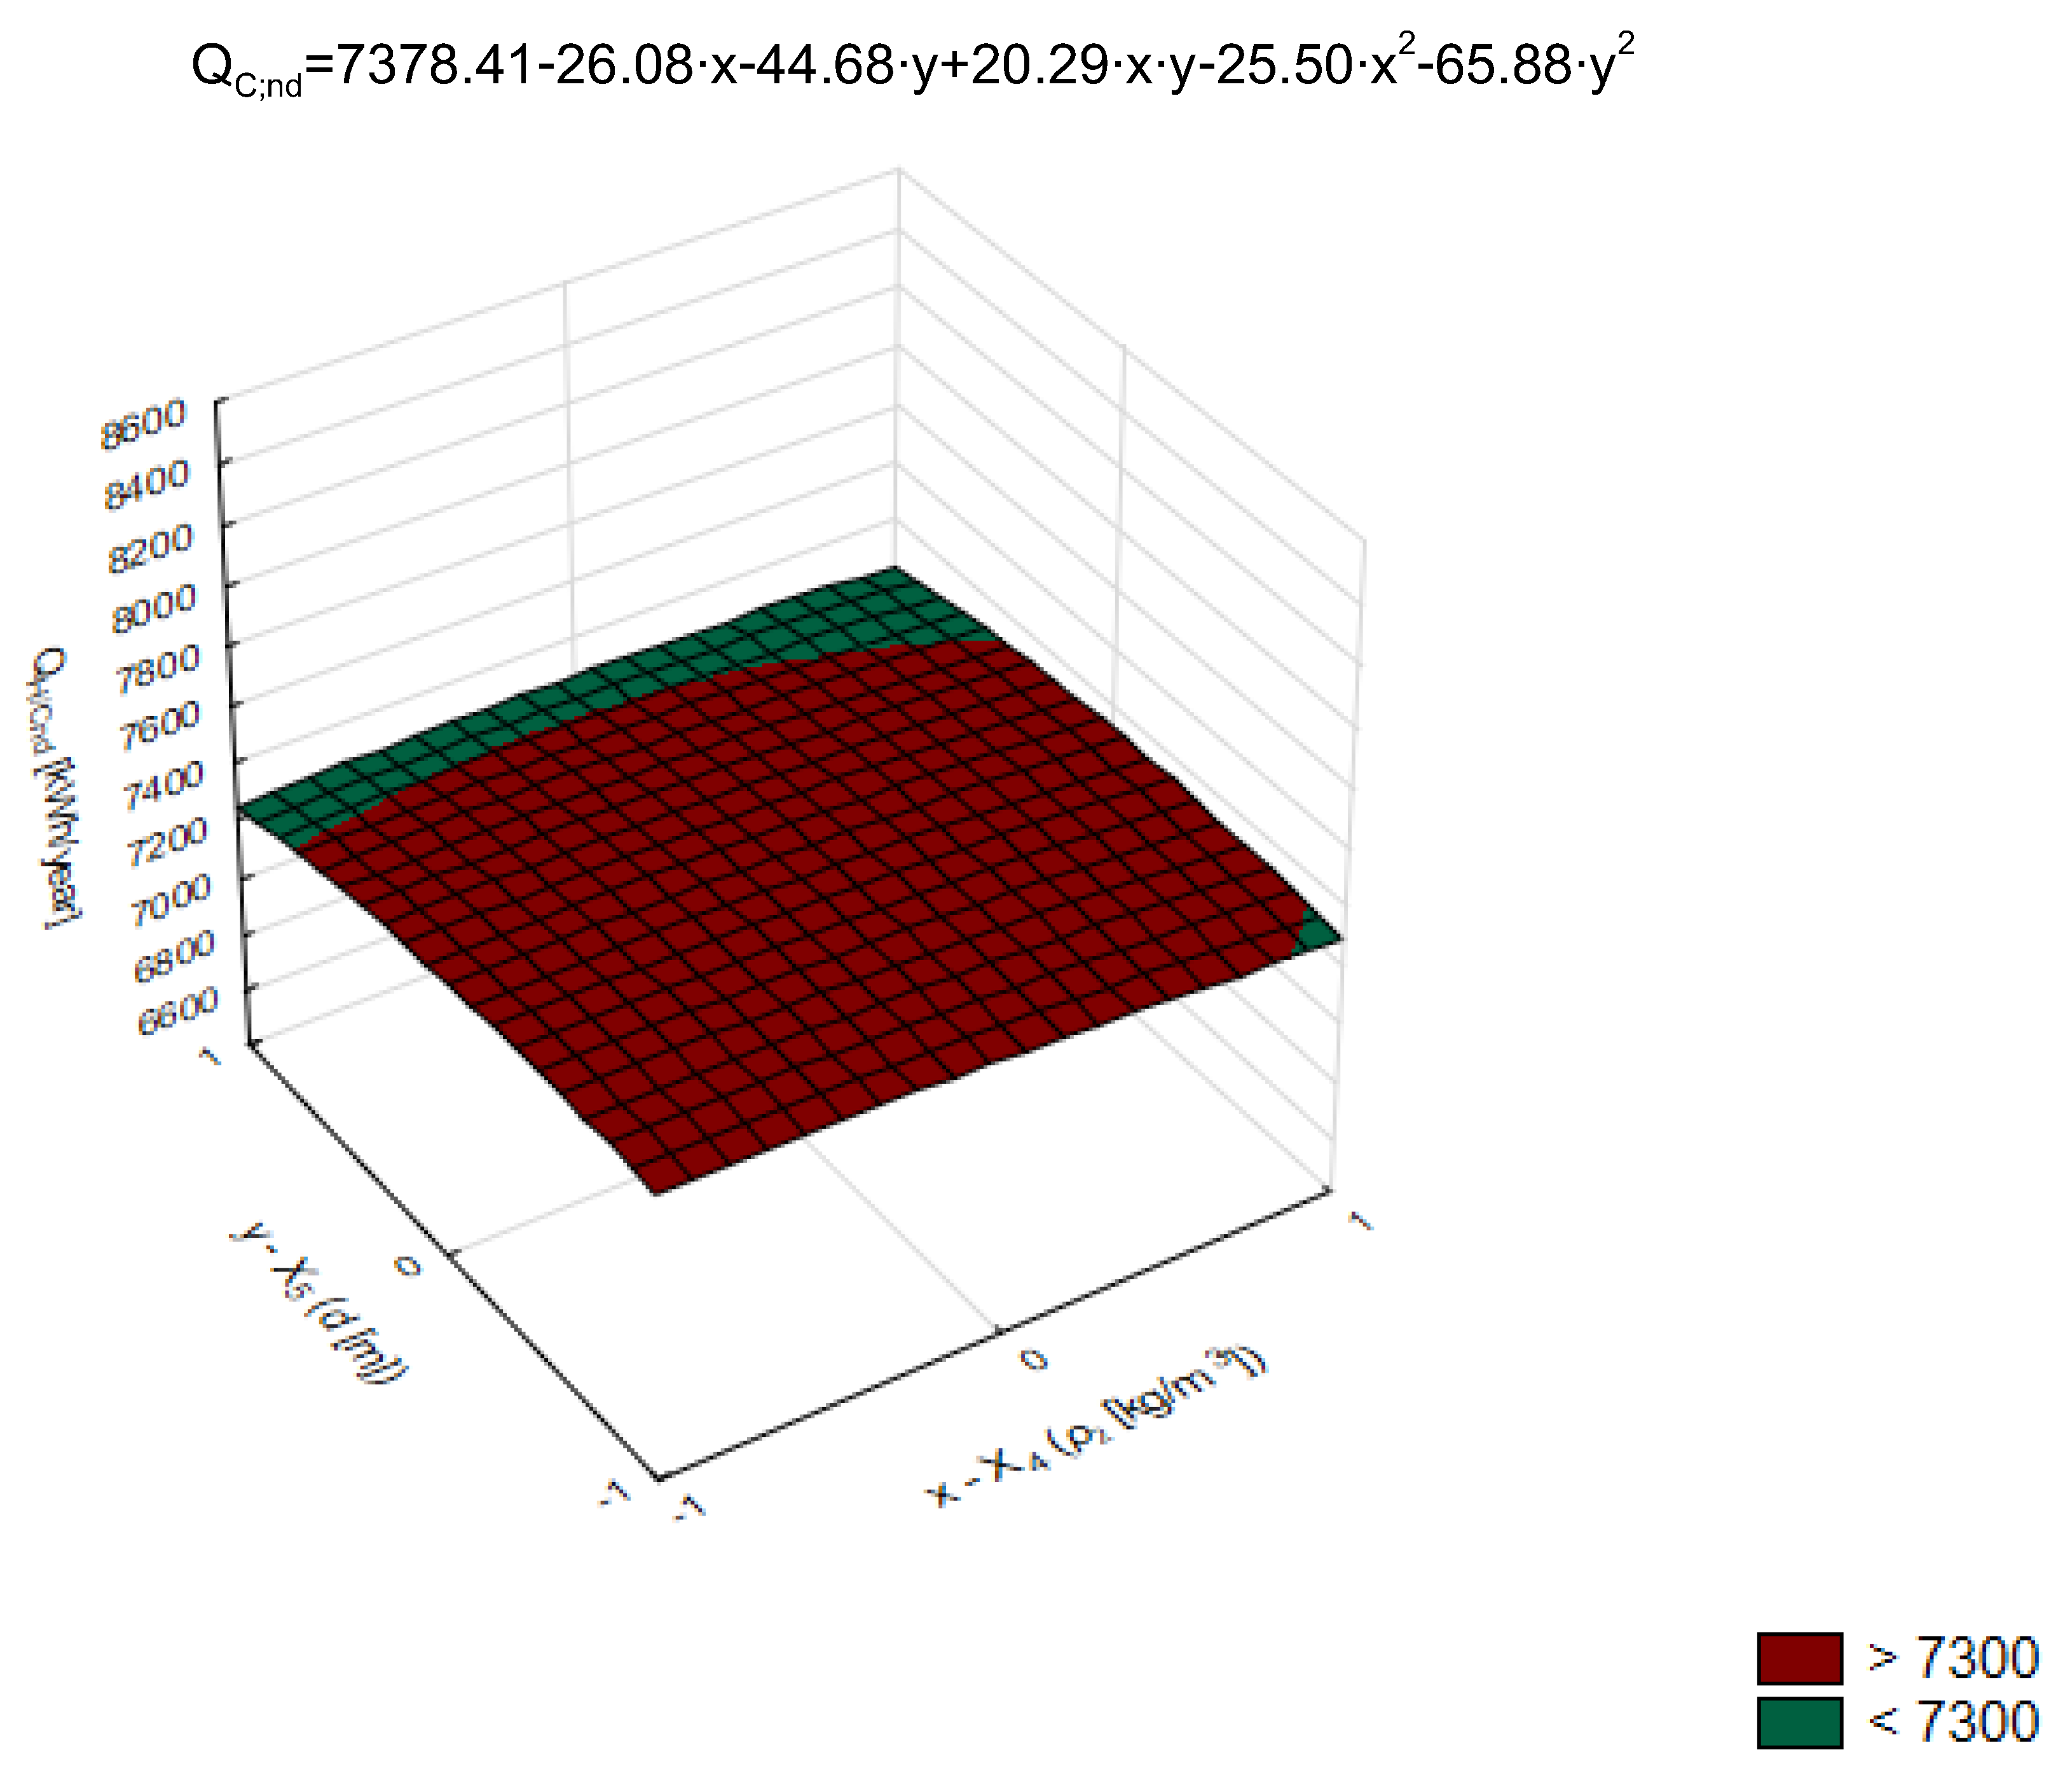
− 64.73X2X7 + 9.99X3X4 − 21.59X3X5 + 28.55X3X6 − 26.76X3X7 + 20.29X4X5 − 29.35X4X6 + 29.30X4X7 +
15.43X5X6 − 12.28X5X7 + 3.89X6X7 + 36.51X12 + 350.82X22 − 57.62X32 − 25.50X42 − 65.88X52 + 5.71X62 + 17.92X72;
- Annual energy demand for cooling the selected building QC;nd:
Ŷ2 = 971.50 − 106.68X1 + 605.20X2 − 40.15X3 − 5.47X4 − 27.43X5 − 96.32X6 + 649.45X7 + 3.41X1X2 + 44.63X1X3
39.48X1X4 + 28.62X1X5 − 31.43X1X6 − 13.30X1X7 + 5.45X2X3 − 12.75X2X4 + 32.00X2X5 − 76.64X2X6 +
297.48X2X7 − 19.13X3X4 + 25.01X3X5 − 27.56X3X6 + 20.49X3X7 − 29.98X4X5 + 27.88X4X6 − 32.45X4X7
18.73X5X6 + 8.37X5X7 − 45.25X6X7 − 50.04X12 + 58.16X22 + 39.31X32 + 28.88X42 + 76.86X52 − 5.85X62 + 101.29X72.
- Annual energy demand for heating and cooling combined QH/C;nd:
Ŷ3 = 8349.91 + 373.06X1 + 414.12X2 − 27.55X3 − 31.55X4 − 72.01X5 + 318.74X6 + 254.46X7 − 28.51X1X2 +
2.22X1X3 − 6.67X1X4 − 10.67X1X5 + 1.08X1X6 − 44.84X1X7 − 2.62X2X3 − 0.34X2X4 + 13.96X2X5 + 22.54X2X6 +
232.75X2X7 − 9.14X3X4 + 3.41X3X5 + 0.98X3X6 − 6.27X3X7 − 9.69X4X5 − 1.47X4X6 − 3.14X4X7 − 3.30X5X6
3.91X5X7 − 41.36X6X7 − 13.53X12 + 408.98X22 − 18.31X32 + 3.38X42 + 10.98X52 − 0.15X62 + 119.21X72.
When testing the adequacy of the models, it was taken into account that deterministic models are characterized by a mutually unambiguous agreement between the external impact and the response to this impact. For this reason, only one experiment was performed at each point in the plan. Fiszer’s criterion was used for testing, which shows how many times the dispersion in relation to the regression equation is reduced compared to the spread in relation to the mean [43]:
F = S y 2 ( f 1 ) S r 2 ( f 2 ) ,
where S2y is the variance of the mean, S2r is the residual variance, f1, f2 are thedegrees of freedom (f1 = (N − 1) = 40 − 1 = 39; f2 = (NNb) = 40 − 36 = 4), N is the number of calculations performed, and Nb is the number of coefficients in the regression equation.
The regression equation describes the results of the calculations adequately if the value of F is greater than the tabular value of Ft at the significance level p and degrees of freedom f1 and f2. As shown by the calculations, F1 = 618,251.2316/16,525.3812 = 37.4122, F2 = 874,640.0843/22,338.3800 = 39.1541, F3 = 537,174.8276/451.8052 = 1188.9523, and tabular value Ft = F 0.05; 39; 4 = 5.725 [43].
Thus, the values of F1, F2, and F3 exceed Ft many times, which means that the models are adequate and useful for further analysis. Their high quality is also confirmed by the coefficients of determination R2(1) = 0.9973, R2(2) = 0.9974, and R2(3) = 0.9999.

3.2. Analysis of the Studied Dependencies and the Interpretation of Results

The influence of the studied factors on the course of annual energy demand for heating/cooling (QH;nd—function Y1; QC;nd—function Y2; QH/C;nd—function Y3) was analyzed using the mathematical models in Equations (17)–(19).
In order to ensure better clarity, the results are discussed on natural variables. It should also be noted that the word combinations “beneficial effect” or “beneficial factor” mean that, with the change of the factor from the lower to the upper level, the value of the annual energy demand for heating/cooling QH/C;nd decreases. Conversely, the effect or a factor is “negative” when QH/C;nd increases.
By analyzing the developed models in Equations (17)–(19), it was found that, in the Gp center of a multivariate space, which is characterized by coordinates corresponding to the average level of factors, namely, h (X1) = 3.0 m, k (X2) = 1, ρ1 (X3) = 1200 kg/m3, ρ2 (X4) = 1800 kg/m3, d (X5) = 0.18 m, Ug (X6) = 0.6 W/(m2·K), and g (X7) = 0.6, the amount of annual energy demand for heating/cooling the building in question for selected climatic conditions is as follows: QH;nd = 7378.41 kWh/year and QC;nd = 971.50 kWh/year; the annual usable energy demand is QH/C;nd = 8349.91 kWh/year.
As can be seen from the presented results, in the climatic conditions of Bialystok for the selected building, the annual energy demand for heating QH;nd is 7.6 times greater than the energy demand for cooling QC;nd and constitutes about 88% of the total annual demand for utility energy.
Using the Gp point as a reference point, the influence of individual factors on the annual heating energy demand was then estimated QH;nd. It turned out the factors k (X2), ρ2 (X4), d (X5), and g (X7) have “beneficial effects” and reduce QH;nd. The effects of their influence when changing from the lower to the upper level are −4.8%, −0.7%, −1.2%, and −10.1%, respectively. The highest “beneficial effect” was obtained from the total solar energy transmission of the glazing g. It is related to the heat exchange process in the windows. A higher solar transmittance of the glazing results in greater overall heat gain from solar radiation and a correspondingly lower energy requirement for heating. The total impact of the remaining factors k (X2), ρ2 (X4), and d (X5), which are related to the thermal capacity of the building, is only −6.7%, which is less than the effect of factor g (X7).
It turned out that three factors h (X1), ρ1 (X3), and Ug (X6) have a “negative effect” and increase the amount of QH;nd. When changing their values from the lower to the upper level, the effects of their influence are +13.8%, +0.4%, and +11.6%, respectively. This means that the influence of the material density of the inner layer of external walls ρ1 on the annual energy demand for heating turned out to be minimal and almost insignificant, while the increase in the height of the story in the building h (X1) and the heat transfer coefficient of the window glazing Ug increase the value of QH;nd to the greatest extent. The determined effects are consistent with the general principles of heat flow through the building envelope.
Annual energy demand for cooling QC;nd was analyzed using the model in Equation (18). It was established that the factors h (X1), ρ1 (X3), ρ2 (X4), d (X5), and Ug (X6) have a “beneficial effect” in reducing the QC;nd. The effects of their influence when changing from the lower to the upper level are −20.8%, −7.7%, −1.1%, −5.1%, and −18.1%, respectively. The highest “beneficial effect” was obtained from the height of the rooms in the building h and the heat transfer coefficient of the window glazing Ug. Much lower effects in reducing QC;nd are shown by the factors ρ1 (X3), ρ2 (X4), and d (X5), influencing the heat capacity of the building.
The influence of the remaining factors k (X2) and g (X7) on the QC;nd value is “negative”. When changing their values from the lower to the upper level, the effects of their influence are +285.1% and +306.8%, respectively. A strong increase in the value of QC;nd due to the window area changes coefficient k and the solar energy transmittance of the glazing g corresponds to the heat exchange process in the windows. A larger window area and solar energy transmittance of the glazing result in a greater total heat gain from solar radiation and, accordingly, a higher energy demand for cooling.
The annual usable energy demand QH/C;nd was analyzed using the model in Equation (19). The analysis of the total annual energy demand showed that factors ρ1 (X3), ρ2 (X4), and d (X5) have a very small “beneficial effect” and reduce the QH/C;nd. The effects of their influence when changing their values from the lower to the upper level are −0.7%, −0.8%, and −1.7%, respectively. The influence of the remaining factors h (X1), k (X2), Ug (X6), and g (X7) on the value of QH/C;nd turned out to be stronger and “negative”. When changing their values from the lower to the upper level, the effects of their influence are +9.4%, +10.0%, +8.0%, and +6.2%, respectively. As the model in Equation (19) was obtained by summing the models in Equations (17) and (18), its substantive interpretation did not give unexpected conclusions. It should be noted that the power of the influence of each of the window parameters exceeded the influence of capacitive factors that characterize the design of the building elements by almost 10 times.
The nature of the influence of the analyzed factors is illustrated in Figure 7, Figure 8, Figure 9, Figure 10, Figure 11, Figure 12, Figure 13, Figure 14 and Figure 15. Figure 7, Figure 8 and Figure 9 shows the dependences of QHnd (Figure 7), QCnd (Figure 8), and QH/Cnd (Figure 9) on the factors from the first group of parameters—architectural and spatial: X1—the height of rooms in the building h and X2—the window area changes coefficient k. Figure 10, Figure 11 and Figure 12 show the dependences of QHnd (Figure 10), QCnd (Figure 11), and QH/Cnd (Figure 12) on the two most important factors from the second group of parameters, i.e., design, concerning solutions of building elements: X4—density of material of internal wall ρ2 and X5—thickness of internal walls d. Figure 13, Figure 14 and Figure 15 show the dependences of QHnd (Figure 13), QCnd (Figure 14), and QH/Cnd (Figure 15) on the factors from the third group of parameters, i.e., physical, regarding window solutions: X6—glazing heat transfer coefficient Ug and X7—the total solar energy transmissions of the glazing g.

4. Optimization of the Studied Dependencies According to the Energy Criterion

After analyzing the influence of the researched factors on the annual demand for heating and cooling energy, the optimization procedure of the developed function was performed according to the energy criterion. The iterative (numerical) method of searching the adequate area was used, consisting of searching the entire area under study with an appropriate sampling step of individual input factors. During optimization, the values of parameters that ensure extreme annual energy demand for heating QH;nd, energy for cooling QC;nd, and annual demand for useful energy QH/Cnd were determined.
For the model in Equation (17) describing the energy demand for heating during the heating period, the optimal parameter values ensuring the minimum of the tested function QH;nd(min) (Y1min) = 5881.78 kWh/year, turned out to be at the levels h (X1) = 2.70 m, k (X2) = 1.1, ρ1 (X3) = 1600 kg/m3, ρ2 (X4) = 1500 kg/m3, d (X5) = 0.24 m, Ug (X6) = 0.40 W/(m2·K), and g (X7) = 0.70. However, the maximum value of QH;nd(max) (Y1max) = 9255.16 kWh/year ensured the parameters at the levels h (X1) = 3.3 m, k (X2) = 0.8, ρ1 (X3) = 1320 kg/m3, ρ2 (X4) = 1500 kg/m3, d (X5) = 0.15 m, Ug (X6) = 0.80 W/((m2·K), and g (X7) = 0.50.
For the model in Equation (18), describing the energy demand for cooling in the summer period, the optimal parameter values ensuring the minimum of the tested function QC;nd(min) (Y2min) = 7.02 kWh/year, turned out to be at the levels h (X1) = 3.30 m, k (X2) = 0.8, ρ1 (X3) = 1392 kg/m3, ρ2 (X4) = 1752 kg/m3, d (X5) = 0.20 m, Ug (X6) = 0.80 W/(m2K), and g (X7) = 0.5. However, the maximum value of the function QC;nd(max) (Y2max) = 3241.98 kWh/year ensured the parameters ay the levels h (X1) = 3.08 m, k (X2) = 1.2, ρ1 (X3) = 1600 kg/m3, ρ2 (X4) = 1500 kg/m3, d (X5) = 0.24 m, Ug (X6) = 0.40 W/(m2·K), and g (X7) = 0.70.
Comparing the optimization results of the models in Equations (17) and (18), it can be concluded that energy savings for heating and cooling provide opposite values of the considered factors, as can be observed from the pairs h (2.7–3.3), k (1.1–0.8), ρ1 (1600–1392), d (0.24–0.20), Ug (0.80–0.40), and g (0.50–0.70). The ρ2 factor alone provides the minimum energy for heating at level 1500 kg/m3 and for cooling at the level 1752 kg/m3.
Since the data on the optimal values of the tested parameters on an annual basis are of greatest practical importance, the model in Equation (19) also optimized the parameters ensuring the minimum annual energy demand, according to the energy criterion. Optimal parameter values ensuring the minimum of the tested function QH/C;nd(min) (Y3min) = 7281.78 kWh/year, turned out to be at the levels h (X1) =2.70 m, k (X2) = 0.95, ρ1 (X3) = 1600 kg/m3, ρ2 (X4) = 2100 kg/m3, d (X5) = 0.24 m, Ug (X6) = 0.40 W/(m2·K), and g (X7) = 0.5. However, the maximum value of the function QH/C;nd(max) (Y2max) = 10,500.56 kWh/year was provided by the factors at the levels h (X1) = 3.30 m, k (X2) = 1.2, ρ1 (X3) = 900 kg/m3, ρ2 (X4) = 1500 kg/m3, d (X5) = 0.12 m, Ug (X6) = 0.80 W/(m2·K), g (X7) = 0.70.
As can be seen from the optimization results, the minimum annual demand for usable energy can be achieved with similar values of most factors that ensured the minimum energy demand for heating during the heating period, as can be observed from the pairs h (2.7–2.7), k (0.95–1.1), ρ1 (1600–1600), d (0.24–0.20), and Ug (0.40–0.40). Only two factors ensure the considered minima at extreme values: factor ρ2 (2100–1500) and factor g (0.5–0.70). This is due to the large share of energy demand for heating in the total annual usable energy demand.
After the optimization procedure of the tested function in Equation (19) was performed, the range of extreme values of energy demand was determined ΔQH/C;nd as follows:
ΔQH/C;nd = QH/C;nd maxQH/C;nd min = 10,500.56 − 7281.78 = 3218.78 kWh/year.
Range ΔQH/C;nd, as the total amount of energy saved, shows great potential in the proper selection of building parameters in terms of energy saving. The range value is almost 44% different from the minimum value QH/C;nd(min) (Y3min). However, this value was achieved by changing the levels of all seven parameters of the building. However, it is important to determine the effects or contribution of individual parameters and selected groups of parameters.
Using the model in Equation (19) and substituting the appropriate values of single factors for the function extremes (Table 4), it was possible to determine the contributions of these parameters. At the same time, the values of one factor were successively substituted in the model in Equation (19), assuming that the other ones took values at average levels. It turned out that, after reducing the height of the rooms in the building h from 3.30 to 2.70 m, 386,59 kWh/year can be reduced in the building, which is 12.0% of the total amount of usable energy (ΔQH/C;nd) that can be saved (Table 4).
Furthermore, the reduction in the window area changes coefficient k from 1.2 to 0.95 allows saving 901.07 kWh/year in the building (Table 4), i.e., as much as 28.0% of the total energy that can be saved.
On the other hand, increasing the density of material of the inner layer of external walls ρ1 from 900 to 1600 kg/m3 and the density of the material of internal walls ρ2 from 1500 to 2100 kg/m3 allows saving 45.86 and 28.17 kWh/year, respectively (Table 4), i.e., 1.4% and 0.9% for each of these parameters. A small contribution to energy saving of 61.03 kWh/year or 1.9% also gives an increase in the thickness of the internal walls d from 0.12 to 0.24 m.
Window parameters make a great contribution to saving energy. Reducing the heat transfer coefficient of the window glazing Ug from 0.80 to 0.40 W/(m2·k) and the total solar transmittance g from 0.70 to 0.50 allows reducing the energy demand by 318.89 and 508.92 kWh/year (Table 4), corresponding to 9.9% and 15.8% of the total energy saving.
The performed estimation of the contribution of individual factors also allows analyzing the shares of the selected groups of parameters. As can be seen in Table 4, the most important role in energy saving is played by the architectural and spatial factors related to the dimensions of rooms and windows. The contribution of two factors from this group is 1287.66 kWh/year, i.e., 40.0% of the total amount of energy that can be saved. Factors from the group of physical parameters relating to window solutions showed a slightly smaller contribution. The share of these two factors is 827.81 kWh/year, which is 25.7% of the total amount of energy that can be saved.
An incomparably lower contribution was shown by factors from the group of construction parameters related to the solutions of building elements. The share of these three factors is 135.06 kWh/year, i.e., 4.2% of the total amount of energy that can be saved.
This means that an effective way to search for energy savings in buildings is to define reserves in the parameters of the architectural and spatial group, relating to the dimensions of rooms and windows, and the group of physical parameters, relating to window solutions. Proper selection of the values of those four parameters in the conducted study allows achieving energy savings of over 65.7% in relation to the total amount of energy that can be saved as a result of the implementation of the considered solutions.
After analyzing the share of individual parameters and selected groups of parameters in energy saving, the assumed goal of this study was achieved.

5. Conclusions

On the basis of the results of the calculation experiment for the climatic conditions of north-eastern Poland (city Bialystok), three deterministic mathematical models of the dependence of the annual energy demand for heating QH,nd (function Y1), energy demand for cooling QC,nd (function Y2), and annual usable energy demand QH/C;nd (function Y3) of a traditional single-family residential building from seven factors were developed. The following factors were considered: the height of rooms in the building h (factor X1); the window area changes coefficient k (factor X2); the density of material of the inner layer of the external walls ρ1 (factor X3); the density of material of internal wall ρ2 (factor X4); the thickness of internal walls d (factor X5); the heat transfer coefficient of the glazing Ug (factor X6); the total solar transmittance of the glazing g (factor X7). On the obtained models, the degree and nature of the influence of factors were analyzed and, thanks to the optimization of the tested parameters according to the energy criterion, the contribution of the tested parameters to energy saving was estimated. The selected factor levels were consistent with the Polish conditions.
  • It was established that, for the model of energy demand for heating, when changing from the lower to the upper level of factors k (X2), ρ2 (X4), d (X5), and g (X7), the value of heat demand for heating QH,nd decreases by −4.8%, −0.7%, −1.2%, and −10.1%, respectively. With a similar change in the value of the factors h (X1), ρ1 (X3), and Ug (X6), the amount QH,nd increases by +13.8%, +0.4%, and +11.6%. On the other hand, the energy demand for cooling QC,nd when increasing the value of factors h (X1), ρ1 (X3), ρ2 (X4), d (X5), and Ug (X6) decreases by about −20.8%, −7.7%, −1.1%, −5.1%, and −18.1%, respectively, but increases with the increase in the value of the factors k (X2) and g (X7) by +285.1% and + 306.8%, respectively.
  • After the numerical optimization procedure was performed, it was found that, for the model of annual usable energy demand for heating and cooling the selected building, the optimal parameter values ensuring the minimum of the tested QH/C;nd(min) (Y3min) = 7281.78 kWh/year are h (X1) = 2.70 m, k ((X2) = 0.95, ρ1 (X3) = 1600 kg/m3, ρ2 (X4) = 2100 kg/m3, d (X5) = 0.24 m, Ug (X6) = 0.40 W/(m2K), and g (X7) = 0.5. The parameter values were also obtained, ensuring the maximum of the tested QH/C;nd(min) (Y3min). Using the range of extreme energy demand values ΔQH/C;nd, which was about 44% of QH/C;nd(min), a great potential was found in the appropriate selection of the examined building parameters in terms of energy saving.
  • According to the total amount of energy that can be reduced ΔQH/C;nd as a result of the analyzed improvements, the contribution of individual parameters and selected groups of parameters to energy saving was estimated. It was found that the most important role in saving energy is played by architectural and spatial factors related to the height of rooms and the dimensions of windows. The contribution of the two factors from this group in the analyzed building amounted to 1287.66 kWh/year, i.e., 40.0%. Factors from the group of physical parameters related to window solutions showed a slightly smaller contribution. The share of these two factors amounted to 827.81 kWh/year, i.e., 25.7%. Proper selection of the values of these four parameters in the conducted study allowed for a reduction of over 65.7% in the total amount of energy that could be saved.
  • An incomparably lower contribution to energy saving was shown by factors from the group of construction parameters related to building component solutions. The share of these three factors in the analyzed building amounted to only 135.06 kWh/year or 4.2% of the total amount of energy that could be saved.
  • This means that the use of reserves inherent in the parameters of the architectural and spatial group, relating to the height of rooms and window dimensions, and the group of physical parameters, relating to window solutions, is an effective way of saving energy in buildings.
In further scientific research, the authors plan to confirm the developed dependencies in other groups of buildings and analyze other construction and material solutions. In view of the current global energy crisis, the search for ways to save energy is crucial. Because it is possible to erect small single-family buildings in Poland without a building permit, knowledge about the impact of design parameters on the energy demand of a building is very important for engineers and policymakers in making correct decisions.

Author Contributions

Conceptualization, W.J. and B.S.; methodology, W.J. and B.S.; software, B.S.; validation, W.J.; formal analysis, W.J.; investigation, W.J.; resources, B.S.; writing—original draft preparation, W.J. and B.S.; writing—review and editing, B.S.; visualization, B.S.; project administration, W.J. All authors read and agreed to the published version of the manuscript.

Funding

This work was performed within the framework of grants of the Bialystok University of Technology (WZ/WB-IIL/3/2022) and financed by the Ministry of Science and Higher Education of the Republic of Poland.

Data Availability Statement

Not applicable.

Conflicts of Interest

The authors declare no conflict of interest.

References

  1. United Nations Environment Programme. 2021 Global Status Report for Buildings and Construction. Towards a Zero-Emission, Efficient and Resilient Buildings and Construction Sector; Nairobi, Kenya, 2021. Available online: https://www.unep.org/resources/report/2021-global-status-report-buildings-and-construction (accessed on 12 April 2022).
  2. Tracking Buildings 2021—Tracking Report IEA–November 2021. Available online: https://www.iea.org/reports/global-energy-review-2020 (accessed on 12 April 2022).
  3. European Commission. A Clean Planet for All. A European Strategic Long-Term Vision for a Prosperous, Modern, Competitive and Climate Neutral Economy. 2018. Available online: https://eur-lex.europa.eu/legal-content/EN/TXT/PDF/?uri=CELEX:52018DC0773&from=EN (accessed on 29 December 2021).
  4. Global Climate Action. United Nations Climate Change. Marrakech Partnership. Climate Action Pathway. Energy. Vision and Summary. 2021. Available online: https://unfccc.int/climate-action/marrakech-partnership/reporting-tracking/pathways/energy-climate-action-pathway#eq-1 (accessed on 12 April 2022).
  5. Directive 2010/31/EU of The European Parliament and of the Council of 19 May 2010 on the Energy Performance of Buildings. Available online: https://eur-lex.europa.eu/legal-content/PL/ALL/?uri=CELEX%3A32010L0031 (accessed on 12 April 2022).
  6. Pessenlehner, W.; Mahdavi, A. Building morphology, transparence, and energy performance. In Proceedings of the 8th International IBPSA Conference, Eindhoven, The Netherlands, 11–14 August 2003; pp. 1025–1032. [Google Scholar]
  7. McKeen, P.; Fung, A.S. The effect of building aspect ratio on energy efficiency: A case study for multi-unit residentialbBuildings in Canada. Buildings 2014, 4, 336–354. [Google Scholar] [CrossRef] [Green Version]
  8. Rodrigues, E.; Amaral, A.R.; Gaspar, A.R.; Gomes, A. How reliable are geometry-based building indices as thermal performance indicators? Energy Convers. Manag. 2015, 101, 561–578. [Google Scholar] [CrossRef]
  9. Parasonis, J.; Keizikas, A.; Endriukaitytė, A.; Kalibatienė, D. Architectural solutions to increase the energy efficiency of buildings. J. Civ. Eng. Manag. 2012, 18, 71–80. [Google Scholar] [CrossRef]
  10. Koźniewski, E.; Sadowska, B.; Banaszak, K. Geometric aspects of assessing the anticipated energy demand of a designed single-family house. Energies 2022, 15, 3308. [Google Scholar] [CrossRef]
  11. Jezierski, W.; Sadowska, B.; Pawłowski, K. Impact of changes in the required thermaliInsulation of building envelope on energy demand, heating costs, emissions, and temperature in buildings. Energies 2021, 14, 56. [Google Scholar] [CrossRef]
  12. Pan, D.; Chan, M.; Xia, L.; Xu, X.; Deng, S. Performance evaluation of a novel bed-based task/ambient conditioning (TAC) system. Energy Build. 2012, 44, 54–62. [Google Scholar] [CrossRef]
  13. Zinzi, M.; Agnoli, S.; Battistini, G.; Bernabini, G. Deep energy retrofit of the T. M. Plauto School in Italy—A five years experience. Energy Build. 2016, 126, 239–251. [Google Scholar] [CrossRef]
  14. Goia, F. Search for the optimal window-to-wall ratio in office buildings in different European climates and the implications on total energy saving potential. Sol. Energy 2016, 132, 467–492. [Google Scholar] [CrossRef]
  15. Obrecht, T.; Vesn, M.P.; Leskovar, Ž. Influence of the orientation on the optimal glazing size for passive houses in different European climates (for non-cardinal directions). Sol. Energy 2019, 189, 15–25. [Google Scholar] [CrossRef]
  16. Szymański, P. Czy pojemność cieplna materiałów murowych jest naprawdę ważna? Mater. Bud. 2012, 3, 72–74. [Google Scholar]
  17. Jedrzejuk, H.; Marks, W. Optimization of shape and functional structure of buildings as well as heat source utilisation. Partial. Probl. Solution. Build. Environ. 2002, 37, 1037–1043. [Google Scholar] [CrossRef]
  18. Pacheco, R.; Ordonez, J.; Martinez, G. Energy efficient design of building: A review. Renew. Sustain. Energy Rev. 2012, 16, 3559–3573. [Google Scholar] [CrossRef]
  19. Adamczyk, J.; Dylewski, R. Changes in heat transfer coefficients in Poland and their impact on energy demand—An environmental and economic assessment. Renew. Sustain. Energy Rev. 2017, 78, 530–538. [Google Scholar] [CrossRef]
  20. Cao, Y.; Kamaruzzaman, S.N.; Aziz, N.M. Building Information Modeling (BIM) Capabilities in the Operation and Maintenance Phase of Green Buildings: A Systematic Review. Buildings 2022, 12, 830. [Google Scholar] [CrossRef]
  21. Asl, M.R.; Zarrinmehr, S.; Bergin, M.; Yan, W. BPOpt: A framework for BIM-based performance optimization. Energy Build. 2015, 108, 401–412. [Google Scholar] [CrossRef] [Green Version]
  22. Bruen, M. Uptake and Dissemination of Multi-Criteria Decision Support Methods in Civil Engineering—Lessons from the Literature. Appl. Sci. 2021, 11, 2940. [Google Scholar] [CrossRef]
  23. Cebrat, K.; Nowak, Ł. Revealing the relationships between the energy parameters of single-family buildings with the use of Self-Organizing Maps. Energy Build. 2018, 178, 61–70. [Google Scholar] [CrossRef]
  24. Main Office of Building Control. Construction Market in Poland in 2021. Warsaw, Poland. 2018. Available online: https://www.gunb.gov.pl/aktualnosc/ruch-budowlany-w-2021-roku (accessed on 20 May 2022).
  25. Statistics Poland. Occupied Buildings. National Census of Population and Housing 2021 in Poland. In Report on Preliminary Results; Central Statistical Office: Warsaw, Poland, 2022; p. 53. [Google Scholar]
  26. Software Informer Home Page. DesignBuilder Software-Private Limited Company No. 04514127; DESIGNBUILDER SOFTWARE LIMITED; Stroud House: Stroud, UK; Available online: https://designbuilder.co.uk/download/previous-versions (accessed on 1 April 2021).
  27. Garg, V.; Mathur, J.; Bhatia, A. Building Energy Simulation: A Workbook Using Designbuilder, 2nd ed.; Taylor & Francis Group: Abingdon, UK, 2020. [Google Scholar] [CrossRef]
  28. Al-Rukaibawi, L.S.; Szalay, Z.; Károlyi, G. Numerical simulation of the effect of bamboo composite building envelope on summer overheating problem. Case Stud. Therm. Eng. 2021, 28, 101516. [Google Scholar] [CrossRef]
  29. Fathalian, A.; Kargarsharifabad, H. Actual validation of energy simulation and investigation of energy management strategies (Case Study: An office building in Semnan, Iran). Case Stud. Therm. Eng. 2018, 12, 510–516. [Google Scholar] [CrossRef]
  30. Ismail, A.M.; Abo Elela, M.M.; Ahmed, E.B. Calibration of Design Builder program. J. Am. Sci. 2015, 11, 96–102. [Google Scholar]
  31. Baharvand, M.; Ahmad, M.H.B.; Safikhani, T.; Majid, R.B.A. Design Builder verification and validation for indoor natural Ventilation. J. Basic Appl. Sci. Res. 2013, 3, 182–189. [Google Scholar]
  32. Raji, B.; Tenpierik, M.; Bokel, R.; van den Dobbelsteen, A. Natural summer ventilation strategies for energy-saving in high-rise buildings: A case study in The Netherlands. Int. J. Vent. 2019, 19, 25–48. [Google Scholar] [CrossRef]
  33. Roshan, G.; Arab, M.; Klimenko, V. Modeling the impact of climate change on energy consumption and carbon dioxide emissions of buildings in Iran. J. Environ. Health Sci. Eng. 2019, 17, 889–906. [Google Scholar] [CrossRef] [PubMed]
  34. Al-Sakkaf, A.; Mohammed Abdelkader, E.; Mahmoud, S.; Bagchi, A. Studying Energy Performance and Thermal Comfort Conditions in Heritage Buildings: A Case Study of Murabba Palace. Sustainability 2021, 13, 12250. [Google Scholar] [CrossRef]
  35. U.S. Department of Energy. EnergyPlus™ Version 9.3.0 Documentation. Engineering Reference. Build: baff08990c. 2020. Available online: https://www.google.com/url?sa=t&rct=j&q=&esrc=s& source=web&cd=&ved=2ahUKEwi_5aqBpbftAhUllosKHQCPDR0QFjAAegQIBRAC&url=https%3A%2F%2Fenergyplus.net%2Fsites%2Fall%2Fmodules%2Fcustom%2Fnrel_custom%2Fpdfs%2Fpdfs_v9.3.0%2FEngineeringReference.pdf&usg=AOvVaw1drV7NwKPCki4unAIb0UZ6 (accessed on 1 April 2022).
  36. Engineering Reference–EnergyPlus–Simple Window Model. Bigladder Software. Available online: https://bigladdersoftware.com/epx/docs/8-9/engineering-reference/window-calculation-module.html (accessed on 12 April 2022).
  37. Arasteh, D.; Kohler, C.; Griffith, B. Modeling Windows in Energy Plus with Simple Performance Indices; Report LBNL-2804E; Lawrence Berkeley National Laboratory: Berkeley, CA, USA, 2009. [Google Scholar]
  38. Gutenbaum, J. Mathematical Modeling of Systems; EXIT: Warsaw, Poland, 2003. [Google Scholar]
  39. Korzyński, M. Methodology of the Experiment. Planning, Implementation, and Statistical Analysis of the Results of Technological Experiments; WNT: Warsaw, Poland, 2006. [Google Scholar]
  40. EnergyPlus—Weather Data by Location. Available online: https://energyplus.net/weather-location/europe_wmo_region_6/POL//POL_Bialystok.122950_IMGW (accessed on 1 April 2022).
  41. Polish Ministry of Transport, Construction and Maritime Economy. Regulation of the Minister of Transport, Construction and Maritime Economy of 5 July 2013 on the Technical Conditions that Buildings and Their Location Should Satisfy; Polish Ministry of Transport; Construction and Maritime Economy: Warsaw, Poland, 2015.
  42. Software Informer Home Page. Available online: https://therm.software.informer.com/ (accessed on 1 April 2021).
  43. Durakovic, B. Design of Experiments Application, Concepts, Examples: State of the Art. Period. Eng. Nat. Sci. 2017, 5, 421–439. [Google Scholar] [CrossRef]
Figure 1. Schematic drawings of the single-family building under examination: (a) front elevation; (b) vertical section; (c) ground floor plan; (d) plan of the usable attic; (e) connection of the wall with the floor slab and the wall with the roof; (f) installation the window in wall (own elaboration).
Energies 15 08810 g001aEnergies 15 08810 g001b
Figure 2. Visualization of the tested single-family house made in the DesignBuilder software (own elaboration).
Energies 15 08810 g002
Figure 3. Block diagram of calculations performed in DesignBuilder (own elaboration based on [27,28]), where Ai is the area of individual partitions, h is the height of the story in the building, d is the thickness of the partition layer, λ is the conduction coefficient, ρ is the material density, c is the specific heat of materials, Ug is the heat transfer coefficient of glazing, and g is the total solar transmittance.
Energies 15 08810 g003
Figure 4. Model of division of the analyzed building into zones: (a) on the ground floor; (b) in the attic (own elaboration).
Energies 15 08810 g004
Figure 5. Two-node model of a single-layer partition for dynamic simulations (own elaboration based on [35]).
Energies 15 08810 g005
Figure 6. Simplification of whole window properties into simple layer properties in the EnergyPlus (own elaboration based on [36]), where λeff is the effective conductivity of the glazing system, Ts is the solar transmittance of the glazing system, at normal incidence, Rs is the lateral side solar reflectance, at normal incidence, Tv is the visible reflectance, at normal incidence, and Rv is the lateral side visible reflectance, at normal incidence.
Energies 15 08810 g006
Figure 7. Dependence of QH;nd on factors from the first group of parameters, i.e., architectural and spatial: X1—the height of rooms in the building h and X2—the window area changes coefficient k.
Energies 15 08810 g007
Figure 8. Dependence of QCnd on factors from the first group of parameters, i.e., architectural and spatial: X1—the height of rooms in the building h and X2—the window area changes coefficient k.
Energies 15 08810 g008
Figure 9. Dependence of QH/Cnd on factors from the first group of parameters, i.e., architectural and spatial: X1—the height of rooms in the building h and X2—the window area changes coefficient k.
Energies 15 08810 g009
Figure 10. Dependence of QHnd on two most important factors from the second group of parameters, i.e., structural, concerning the solutions of building elements: X4—density of material of internal wall ρ2 and X5—thickness of internal walls d.
Energies 15 08810 g010
Figure 11. Dependence of QCnd on two most important factors from the second group of parameters, i.e., structural, concerning the solutions of building elements: X4—density of material of internal wall ρ2 and X5—thickness of internal walls d.
Energies 15 08810 g011
Figure 12. Dependence of QH/Cnd on two most important factors from the second group of parameters, i.e., structural, concerning the solutions of building elements: X4—density of material of internal wall ρ2 and X5—thickness of internal walls d.
Energies 15 08810 g012
Figure 13. Dependence of QHnd on the factors from the third group of parameters, i.e., physical, regarding window solutions: X6—the heat transfer coefficient of the glazing Ug and X7—the total transmittance of solar radiation energy of the glazing g.
Energies 15 08810 g013
Figure 14. Dependence of QCnd on the factors from the third group of parameters, i.e., physical, regarding window solutions: X6—the heat transfer coefficient of the glazing Ug and X7—the total transmittance of solar radiation energy of the glazing g.
Energies 15 08810 g014
Figure 15. Dependence of QH,Cnd on the factors from the third group of parameters, i.e., physical, regarding window solutions: X6—the heat transfer coefficient of the glazing Ug and X7—the total transmittance of solar radiation energy of the glazing g.
Energies 15 08810 g015
Table 1. Design of a computational experiment for seven variables for N = 40 trials, where h, k, ρ1, ρ2, d, Ug, and g are natural factors, while X1, X2, X3, X4, X5, X6, and X7 are coded factors.
NoX1
h, (m)
X2
k, (-)
X3
ρ1, (kg/m3)
X4
ρ2, (kg/m3)
X5
d, (m)
X6
Ug, (W/(m2∙K))
X7
g, (-)
11−11−1111
3.30.8160015000.240.80.7
211−1−1111
3.31.280015000.240.80.7
311111−11
3.31.2160021000.240.40.7
4−111−11−11
2.71.2160015000.240.40.7
5−1−111−1−11
2.70.8160021000.120.40.7
6111−111−1
3.31.2160015000.240.80.5
71−111−11−1
3.30.8160021000.120.80.5
8−1−1−11−11−1
2.70.880021000.120.80.7
91−1111−1−1
3.30.8160021000.240.40.5
101−11−1−1−10
3.30.8160015000.120.40.6
11011−1−111
3.01.2160015000.120.80.7
120−1−1−11−11
3.00.880015000.240.40.7
1301−11−1−11
3.01.280021000.120.40.7
14−1−10−1−1−1−1
2.70.8120015000.120.40.5
1510−11−111
3.31.080021000.120.80.7
16−10−111−11
2.71.080021000.240.40.7
17−101111−1
2.71.0160021000.240.80.5
1810−1−11−1−1
3.31.080015000.240.40.5
191111−1−1−1
3.31.2160021000.120.40.5
20−1101−111
2.71.2120021000.120.80.7
21110−1−1−11
3.31.2120015000.120.40.7
22−1−1−10−1−11
2.70.880018000.120.40.7
231−1−1011−1
3.30.880018000.240.80.5
241−1−10−11−1
3.30.880018000.120.80.5
25−11−101−1−1
2.71.280018000.240.40.5
26−1−111111
2.70.8160021000.240.80.7
271−1−1−1−111
3.30.880015000.120.80.7
28−11−1−101−1
2.71.280015000.180.80.5
29−1−1−110−1−1
2.70.880021000.180.40.5
3011−1110−1
3.31.280021000.240.60.5
31−1−1−1−110−1
2.70.880015000.240.60.5
32−1−11−1−10−1
2.70.8160015000.120.60.5
33−1−11−1−110
2.70.8160015000.120.80.6
341−1−11−1−10
3.30.880021000.120.40.6
35−11−1−1−1−10
2.71.280015000.120.40.6
360000000
3.01.0120018000.180.60.6
371−1−1−1−10−1
3.30.880015000.120.60.5
381111011
3.31.2160021000.180.80.7
390−1−11111
3.00.880021000.240.80.7
40−10−1−1111
2.71.080015000.240.80.7
Table 2. Thermal properties of the building envelope materials and the heat transfer coefficient obtained in the analyzed building (U) and required in Poland (Umax).
Building EnvelopeMateriald
(m)
λ
(W/m·K)
U
(W/(m2∙K))
Umax
(W/(m2∙K))
External wallsPolystyrene EPS0.200.040.1680.20
Aerated concrete0.240.24
Roof/ceiling
under unheated
roof space
Clay tile—roofing0.011.000.1460.15
Mineral wool0.240.038
Plasterboard0.0250.25
Floor on the groundFloor screed0.050.410.240.30
EPS (expanded polystyrene)0.150.04
Cast concrete0.101.13
Table 3. Results of the simulation of the QH,nd, QC,nd, and QH/C;nd in individual variants determined according to the design of the computational experiment.
NoQH;nd
Y1i
QC;nd
Y2i
QH/C;nd
Y3i
(kWh/Year)
18221.73779.519001.24
27892.732456.7810,349.51
36796.662800.139596.79
45954.373162.099116.46
56750.791130.827881.61
68859.63658.999518.62
79107.77147.519255.28
87456.52979.478435.99
98225.61170.528396.13
108034.49484.678519.16
117578.432548.7410,127.17
127109.091081.448190.53
136547.813026.919574.72
147446.82286.067732.88
157887.271529.589416.85
165995.752072.758068.50
177609.67413.288022.95
187715.65501.658217.30
197930.15878.528808.67
207119.332696.979816.30
216983.452884.629868.07
226776.081188.507964.58
238970.36158.259128.61
249129.45182.109311.55
256894.841105.878000.71
267302.33916.258218.58
278392.11842.589234.69
287989.28808.198797.47
297362.30272.307634.60
308338.33765.099103.42
317685.59247.687933.27
327800.76234.718035.47
337792.40491.048283.44
348046.21504.708550.91
356568.571972.888541.45
367362.52989.928352.44
378778.52211.698990.21
387928.262364.0010,292.26
397780.59858.208638.79
406844.991788.808633.79
Table 4. Optimal values of the parameters of the selected building with optimization in relation to the energy criterion.
NoEnergy Need
(kWh/year)
h (X1)
(m)
k (X2)
(-)
ρ1 (X3)
(kg/m3)
ρ2 (X4)
(kg/m3)
d (X5)
(m)
Ug (X6)
(W/(m2∙K))
g (X7)
(-)
1QH/C;nd max = 10,500.563.30 (+1)1.2 (+1)900 (−0.75)1500 (−1)0.12 (−1)0.80 (+1)0.70 (+1)
8709.449173.018415.278384.848432.908668.508723.58
2QH/C;nd min = 7281.782.70 (−1)0.95 (−0.25)1600 (+1)2100 (+1)0.24 (+1)0.40 (−1)0.50 (−1)
8322.858271.948369.418356.678371.878349.618214.66
3ΔQH/C;nd = 3218.78386.59901.0745.8628.1761.03318.89508.92
(12.0%)(28.0%)(1.4%)(0.9%)(1.9%)(9.9%)(15.8%)
4ΔXi−0.60−0.25+700+600+0.12−0.40−0.20
Publisher’s Note: MDPI stays neutral with regard to jurisdictional claims in published maps and institutional affiliations.

