Article

Does New Digital Infrastructure Promote the Transformation of the Energy Structure? The Perspective of China’s Energy Industry Chain

1
School of Economics & Management, Nanjing Tech University, Nanjing 211816, China
2
Business School, Shandong Normal University, Jinan 250358, China
3
Institute of Food and Strategic Reserves, Nanjing University of Finance and Economics, Nanjing 210023, China
4
School of Economics and Management, Zhejiang University of Science and Technology, Hangzhou 310023, China
5
School of International Economics and Trade, Nanjing University of Finance & Economics, Nanjing 210023, China
*
Author to whom correspondence should be addressed.
Energies 2022, 15(23), 8784; https://doi.org/10.3390/en15238784
Submission received: 26 October 2022 / Revised: 12 November 2022 / Accepted: 13 November 2022 / Published: 22 November 2022

Abstract

:
In the context of carbon neutrality, the development of new digital infrastructure (NDI) and the improvement of digital capabilities are essential, in order to speed up the transformation of the energy structure. Based on the balanced panel data of 30 provinces in China from 2008 to 2019, we empirically analyzed the impact of NDI on the structural transformation of energy in China and its mechanisms of action. The results demonstrated that (1) NDI had a positive impact on China’s energy transition, and the empirical results were robust. (2) The mediating effect showed that NDI had a positive impact on the transformation of energy structure, through improving green total factor productivity and green finance. (3) The heterogeneity analysis indicated that NDI made a more significant contribution to the transformation of the energy structure in regions with lower pollution levels and in those with energy cooperation policies. This study provides a policy reference for Chinese energy transition from the perspective of the digital economy.

1. Introduction

To avoid the worst effects of climate change and to accelerate sustainable economic development, the world needs to phase out the use of non-clean energy sources [1]. The International Energy Agency (IEA) reported that global energy consumption increased by 50–75% between 1985 and 2020. Although the use of clean energy is increasing year by year, the proportion of fossil energy in primary energy consumption has been around 80% for nearly a century [2,3]. This high proportion of fossil fuel consumption is a barrier to the sustainable development of the global economy. The main driver of the current transition differs from the previous three, in that it is no longer the economic efficiency of new energy sources, but the response to climate change [4]. Resource depletion, the rising costs of non-clean energy sources, and technological innovation will further accelerate the energy transition process, making it imperative that the energy transition forms an important part of sustainable economic development [5,6,7].
As another important driving force to promote economic development and optimize economic structure, information and communications technology (ICT) has been widely recognized by scholars [8,9,10]. However, the new digital infrastructure (NDI) that supports cutting-edge ICT is a relatively neglected area of research. New digital infrastructure refers to the digital-based infrastructure formed by the new generation of information technologies, mainly including 5G, artificial intelligence, and the industrial Internet, and Internet of Things, which provide services that trigger fundamental changes in production patterns and economic structures [8,10]. The rate of change in the way NDI is supplied and the demand for digitally connected services in the last decade has been staggering. NDI has become a necessary factor of production for consumers to participate in advanced modern societies [11]. The services provided by NDI penetrate into the production and operation models of enterprises, improve the efficiency of industrial resource allocation, and optimize the regional industrial structure, as well as providing new ideas for solving the problem of energy transition [12,13,14].
The existing studies have concentrated on the relationship between the services provided by NDI and the energy transition, and the results are highly variable. Some scholars argue that the transformation of the energy structure with the services provided by NDI can accelerate the energy structure transition. Chung (2018) [15] suggested that the new energy systems with digital infrastructure services can accelerate the transformation of regional energy structure. Tang et al. (2013) [16] found that NDI helps to cultivate the green technology innovation capacity of firms and improves corporate governance. Other scholars have argued that it is uncertain the services provided by NDI contribute to the transformation of regional energy structure. Lange et al. (2020) [17] indicated that information and communication technologies increase global non-clean energy consumption by expanding energy demand. Shabani and Shahnazi (2019) [18] stated that the relationship between NDI services and energy consumption is not linear. The emergence of contradictory research conclusions is mainly related to the use of single indicators of NDI, the inconsistent construction standards of indicators, and a lack of heterogeneity in analysis. In addition, a large number of studies have found that both NDI and energy transition are related to green development, but few literature reports have explored whether there is a green development-related path between the two.
Based on provincial panel data in China, we focused on the impact of NDI on the energy transition, and explored the mechanisms and heterogeneity from a green development perspective. In fact, with the development of the digital economy, the new digital infrastructure is different from traditional infrastructure, which will have an important impact on regional green development. Therefore, it is necessary to identify the impact of new digital infrastructure on energy structure transformation. Our innovations include the following: (1) Previous studies examined the economic or environmental effects of traditional infrastructure, while ignoring the environmental effects of NDI, especially its impact on the energy structure. (2) We not only investigated the transmission mechanism of the impact of NDI on energy structure, but also investigated its heterogeneity in different regions, in order to investigate the impact of NDI on energy structure more comprehensively. (3) Under the dual backgrounds of the digital economy and carbon peak and carbon neutrality, it is of great practical significance to explore the impact of NDI on energy structure. These conclusions provide a theoretical basis for scientifically formulating new targeted digital basic energy service facilities.
The rest of the paper is organized as follows: Section 2 presents a mechanical analysis and the research hypotheses. Section 3 describes the data and empirical methodology. Section 4 discusses the empirical results. Section 5 summarizes the conclusions and policy implications.

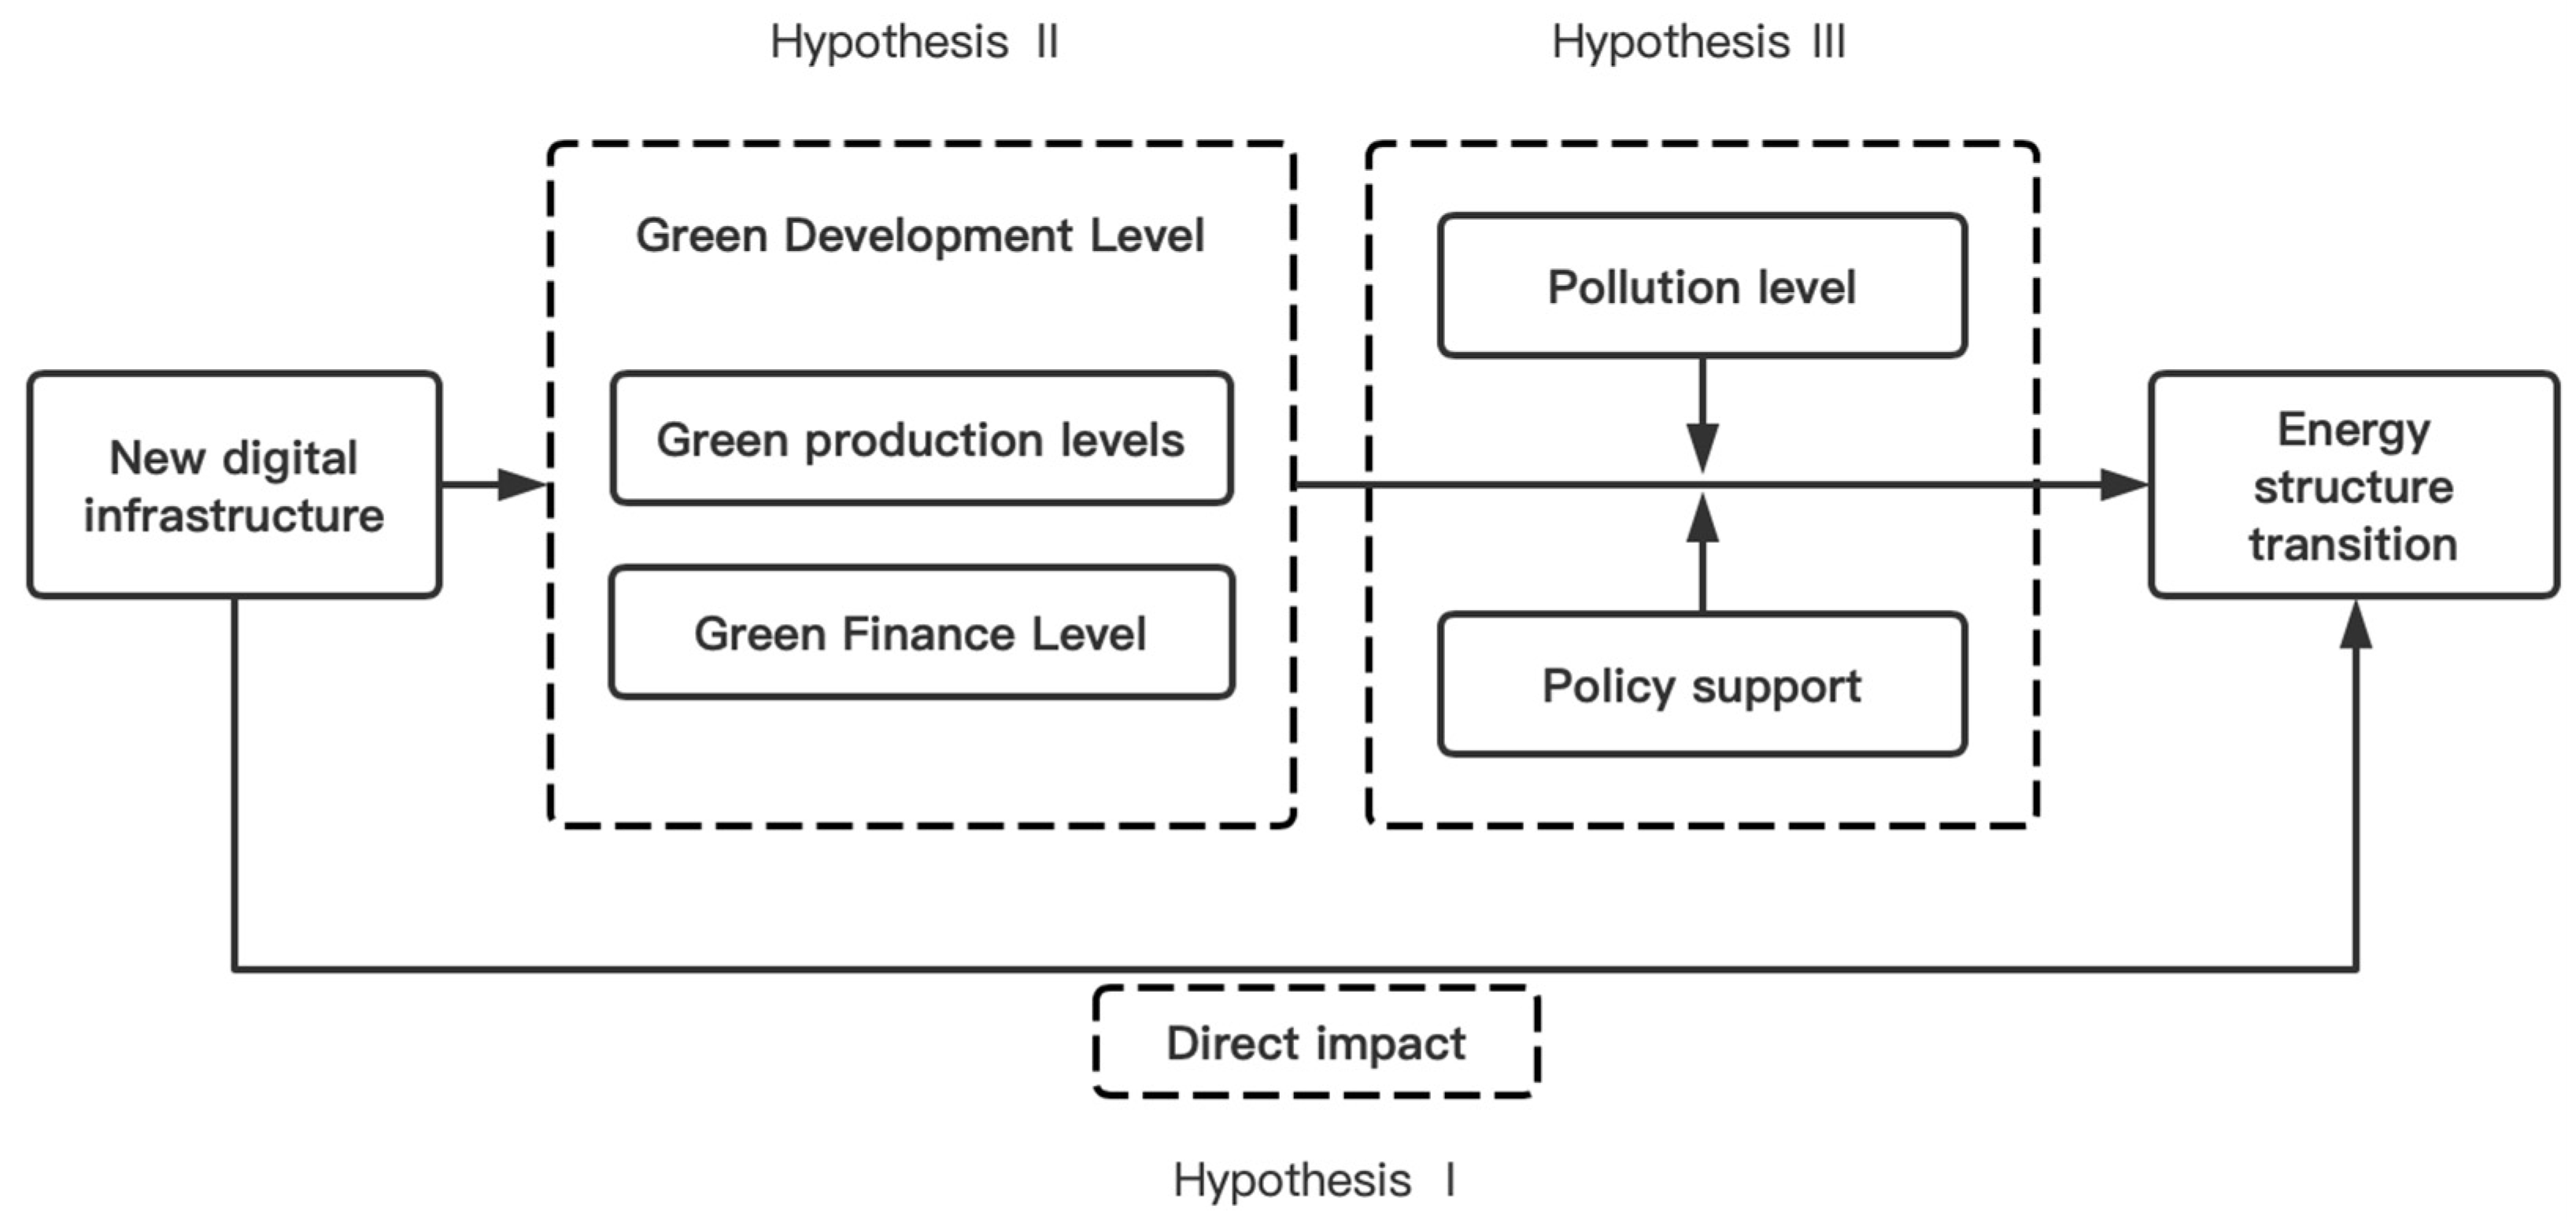
2. Mechanism Analysis and Research Hypothesis

2.1. The Direct Effects

The efficient resource allocation advantages of NDI help to optimize energy allocation. ICT has a profound impact on energy management because it lowers costs and keeps systems up-to-date [19,20]. Cloud computing and big data analysis help to improve the efficiency of energy production, and wireless networks allow for timely optimization of energy allocation structures through online platforms [13]. The substitution and optimization effects of ICT on energy consumption contribute to the “computerization” of the production sector [21]. The above-mentioned optimization components, which rely on NDI, are more focused on the production and management of energy, optimizing the way energy is consumed by eliminating outdated capacities [22]. Efficient resource allocation is conducive to the transformation of regional energy structure. In view of the absolute advantages of varieties of energy and the comparative advantages of energy industries, the existing energy system requires a more timely and rapid energy allocation mechanism. For example, transmission network managers in Belgium are helping the network absorb more intermittent renewable energy by sharing computer platforms [23]. NDI provides a reliable technological path for building “smart cities” and promoting the coordination of low-carbon energy [24]. The market is also an important way to allocate resources. A sound market mechanism and flexible market design can both facilitate the energy transition. NDI increases the flexibility and timeliness of energy markets, thereby addressing some of the technical barriers faced in the development of regional energy structure transitions [25]. The high penetration of NDI can influence and even change group consumer behavior [13]. NDI changes the original method of information transmission and accelerates the transformation of the low-carbon behavior of energy consumers. For example, consumers can choose low-carbon technology application products and respond to their local government’s call for low-carbon policies, and they can increase their awareness of green energy consumption [26]. Thongmak and Mathupayas (2016) [27] argued that effective dissemination of information helps consumers understand the current environmental situation and increases environmental empathy and environmental knowledge, thereby influencing their ecological consumption behavior. Existing empirical results also suggest that the development of ICT has contributed to renewable energy consumption. Moyer and Hughes (2012) [28] found that advances in communication technologies are generally positively associated with increased energy intensity and renewable energy generation. Zheng and Wang (2021) [13] found that a 1% increase in the level of mobile communication technology was associated with a 1.1% increase in renewable energy consumption in the short term and a 0.2% increase in the long term.
Based on the above analysis, the following hypothesis is proposed in this paper:
Hypothesis I: 
NDI has a significant positive impact on the transformation of the regional energy structure.

2.2. Indirect Impact

2.2.1. Green Production Level

NDI increases the green total factor productivity (GTFP) of a region. In terms of accelerating information flows, NDI facilitates the development of information technology, while the convergence of industrialization and modern technology contributes to the iteration and updating of green production technologies, making regional industrial production greener and more sustainable [6]. Yan et al. (2018) [29] demonstrated through empirical tests that trade in communication technologies can bridge the gap between developing economies. In terms of changing traditional production methods, Haftu (2019) [30] suggested the positive role of infrastructure in greening total factor productivity. Digital information technology can help build a more diverse labor supply, with human capital as a supporting condition; thus making labor demands adapt to green production methods. The diffusion of NDI services helps to spread the effects of green production, which in turn forces other firms in the same industry to improve their own GTFP.
The increase in level of green production has promoted the transformation of the energy structure. In terms of substitution effects, the energy transition is the substitution of one energy source for another in certain industries or sectors [31]. The improvement of the level of green production represents an improvement of renewable energy efficiency, and existing research also recognized the positive effect of green energy utilization technology on energy structure transformation in production activities [32]. In terms of the transformation of consumption, improved green production methods are a form of energy consumption efficiency improvement, and a sustainable energy structure built through green production promotes the development of green energy consumption preferences among consumers [33]. Quantitative changes in the level of green production are driving qualitative changes in energy transformation.

2.2.2. Green Finance Level

NDI promotes the development of regional green finance. At present, there is a lack of communication about the information mechanisms, in the development of green finance. NDI can distribute the environmental, social, and governance (ESG) information of enterprises to the public and increase the level of green financial support of high-quality enterprises. At the same time, enterprises will also conduct green reputation risk management, to ensure the financial support for their own green projects. The spillover effects of digital infrastructure further improve the green financial environment within the industry [34]. Not only that, but NDI can also help solve the problems of green finance regulation. Qing (2019) [35] suggested that the Indonesian government could make use of NDI to make up for the deficiencies of green information governance. Big data technologies provided by NDI can help commercial banks reduce unnecessary loan losses by optimizing energy-saving funds and green investment systems [36].
The development of green finance has promoted regional energy transformation. In terms of the function of cultivating dynamic energy, the development of green finance can help fill the huge investment gap in sustainable energy transition, provide sufficient funds for green technology innovation activities, and enhance the positive impact of innovation in renewable energy consumption [37,38]. In terms of the function of guiding resource allocation, green finance can guide social capital flow to green industries, improve the industrial structure, and promote the transformation of society, from a high-carbon economy, to a low-carbon economy [39]. Navarro (2019) [40] conducted a study on the feasibility of green finance, arguing that retail investors, producers, and financial institutions can promote the regional energy transition without compromising the interests of consumers, by creating green financial products.
Based on the above analysis, the following hypothesis is proposed in this paper:
Hypothesis II: 
NDI further promotes regional energy structure transformation by enhancing GTFP and developing green finance.

2.3. Heterogeneity Analysis

2.3.1. The Effect of NDI on Energy Structure Transformation Is Related to the Degree of Regional Pollution

In regions with different pollution levels, the role of NDI in the transformation of energy structure may be different, mainly due to environmental regulations and resource endowment [41,42]. Economic development is accompanied by high environmental costs and huge resource consumption, and green development has become the world consensus, which means that various regions need to reduce the environmental cost of economic development and maintain a balance between economic development and the ecological environment [43]. NDI provides equipment for ICT, social media, mobile technologies, and information networks, all of which contribute to information-based environmental governance [44]. Environmental regulation further affects the proportion of renewable energy used, through “compliance cost effects” and “innovation offset effects” [16,45,46]. Therefore, we speculate that NDI can improve the level of regional environmental supervision, thereby reducing regional pollution. The transformation of the energy structure is one of the manifestations of the improvement of regional pollution. Natural resource endowments will also affect regional energy transformation plans. The industrial structure being formed by relying on the regional natural resource endowment has led to the heterogeneity of air pollution among provinces. The degree of pollution of regions rich in non-renewable resources is higher, and the energy transformation is more difficult [47,48,49]. Not only that, regional economic conditions also strongly influence the energy transition plans of local governments, and economic factors affect the transition from fossil fuels or non-clean energy, to renewable or clean energy [50]. The coverage rate of NDI in economically developed regions is high, and the phenomenon of the resource curse is common in regions with high natural resource endowments [51,52]. Therefore, it is speculated that in regions with abundant natural resources, the positive effect of NDI on the energy transition is weak.

2.3.2. The Effect of NDI on Energy Structure Transformation Is Related to Regional Energy Cooperation Policies (ECP)

ECP can help strengthen the positive role of NDI in the transformation of regional energy structures. In terms of the content of the ECP, the ECP conforms to the latest energy production trends and improves the existing energy structure through multilateral cooperation [53,54]. For energy structure transformation, the energy production cooperation, energy investment cooperation, and energy infrastructure connection content in the ECP provide a larger development platform for NDI [6,55]. In terms of the drivers of ECP, there are two main charagories of ECP implementation region: First, the region has sufficient demand to reduce the dependence on non-renewable energy. Second, the region has relatively good energy cooperation conditions. These two conditions are conducive to the transformation of the energy structure [56]. Economic, environmental, and political factors help drive the success of energy cooperation [57]. Therefore, policymakers will delineate ECP areas with reference to the driving factors of energy cooperation success, which reflects the economic, environmental, and political differences between areas covered by ECP and non-covered areas. According to the previous analysis, the differentiated effect of NDI on the transformation of the energy structure can be explained. In summary, the mechanism diagram of this paper is shown in Figure 1.
Based on the above analysis, the following hypothesis is proposed in this paper:
Hypothesis III: 
From the perspective of heterogeneity, in areas with low levels of environmental pollution and under energy cooperation policies (ECP), the positive effect is more obvious.

3. Method

3.1. Model

To verify the impact of NDI on energy transition, we chose an OLS model with multi-dimensional panel fixed effects to mitigate the bias of results, by controlling for multi-dimensional individual effects. We address the problem of missing variables with individuals and time, by controlling for the individual effects and annual effects of provinces.
This paper constructs the following model:
energy it = β 0 + β 1 infra it + γ control it + λ i + μ t + ε it
where energy it is the energy consumption structure of province i in year t, infra it is the NDI of province i in year t, and controlit is the set of control variables, specifically government self-sufficiency ( suf it ), level of environmental regulation ( er it ), level of urbanization ( urban it ) and its squared term ( urban it 2 ), economic development level ( pgdp it ), and level of education ( egdp it ). λ i is the province fixed effect, μ t is the time fixed effect, and ε it are random errors.

3.2. Variables

3.2.1. Explained Variable: Energy Structure (energyit)

Referring to the method of Adebayo et al. (2021) [58], the ratio of coal consumption to total energy consumption is used to measure the energy structure of each province. Coal consumption and total energy consumption were converted into standard coal, with reference to the China Energy Statistical Yearbook. The conversion coefficients of major energy categories are shown in Table 1.

3.2.2. Explanatory Variables: NDI (infrait)

Referring to the practice of Zhao (2022) [59], a four-dimensional index system of long-distance optical cable lines, mobile phone switch capacity, industrial robot installation, and the number of Internet access ports is used, and the entropy weight method is selected, to determine the weight of each index, and, finally, the new digital number is calculated. Infrastructure metrics:

3.2.3. Control Variables

(1)
Government self-sufficiency rate (sufit). Fiscal self-sufficiency is a significant criterion for judging whether the development of a regional government is healthy. Local governments can use public finance to solve the problem of social and economic inequality, so as to promote the low-carbon transformation of the region [60]. Saygin et al. (2015) [61] suggested that a government can push the transformation of the energy structure in a region by providing guiding policies to develop technological innovation in renewable energy. Referring to the practice of Yan et al. (2022) [62], we adopt the ratio of the revenue in the general budget of the local government to the expenditure in the general budget of the local government to represent the government’s self-sufficiency rate.
(2)
The intensity of environmental regulation (erit). When the government implements a series of environmental regulation policies, polluters will predict increase in the intensity of environmental regulation in the future, so as to strengthen their current utilization of such energy, or force enterprises to adopt clean energy and advanced energy-saving and emission-reduction technologies, by improving industry standards [63]. Referring to the practice of Peng et al. (2020) [64], we select the comprehensive utilization rate of solid waste, to measure the intensity of environmental regulation in each province.
(3)
The level of urbanization (urbanit). At a particular stage in economic development, the increase of energy consumption follows an “inverted U” curve with rising urbanization levels, which leads to population clustering, changes in energy consumption patterns, and technological innovation. These changes push the structure of energy consumption toward optimization. Referring to Liu et al. (2022) [65], this article uses the proportion of urban population to characterize the urbanization level of a region and introduces a squared term of the urbanization level (urbanit2), to ensure the adequacy of urbanization level in explaining the energy consumption structure.
(4)
The level of economic development (pgdpit). Taghizadeh and Rasoulinezhad (2020) [66] stated that there is a positive correlation between economic development and regional energy transition. We refer to the practice of Acheampong et al. (2021) [67], which used the logarithm of gross domestic product (GDP) per capital to measure the level of regional economic development.
(5)
Educational level (egdpit). Level of education may influence the environmental awareness of residents, which in turn affects their acceptance and support for the energy transition Tang et al. (2013) [16] also believed that educational level also played a certain role in the process of energy structure optimization. We reference Li et al. (2022) [68] and uses the share of local fiscal expenditure on education in regional GDP to measure the level of education. To sum up, the specific variable description is shown in Table 2.

3.3. Data Description

This paper takes the data of 30 provinces, autonomous regions, and municipalities in China (excluding Hong Kong, Macao, Taiwan, and Tibet) as the research object. The time span of the data is from 2008 to 2019. The variable data in this article were mainly obtained from the “China Energy Statistical Yearbook”, “China Statistical Yearbook”, “China Industrial Statistical Yearbook”, “China Urban Statistical Yearbook”, “China Industrial Economic Statistical Yearbook”, “China Environmental Statistical Yearbook”, and “China Insurance Yearbook and Statistical Yearbooks of various provinces”. Industrial robot data were obtained from the International Federation of Robotics. Table 3 shows a descriptive statistical analysis of the above variables.
Figure 2 and Figure 3 plot the average level of China’s energy consumption structure and NDI from 2008 to 2019. Specifically, the proportion of coal consumption in the central and western regions is relatively high, while the proportion of coal consumption in the eastern region is relatively low. The level of NDI in the central and western regions is generally low, and that in the eastern regions is generally high. Regions with a high level of NDI are characterized by a developed economy, the concentration of scientific and technological talent, and a low endowment of non-clean energy resources. Regions with a high proportion of coal energy consumption have the characteristics of an underdeveloped economy, large loss of scientific and technological talents, and high endowment of non-clean energy resources.

4. Results

4.1. Benchmarking

We used a linear regression model to test the direct impact of NDI. Table 4 shows the direct impact of NDI on the energy transition. Columns (1) and (2) do not include control variables, while columns (3) and (4) include control variables. Columns (1) and (3) fixed the year, while columns (2) and (4) fixed the year and province. From the results in column (4) of Table 4, the impact of NDI on the energy structure remained significant at 1% and was negative. The impact coefficient was −0.234, which indicates that NDI is conducive to transformation of the energy structure.
To ensure the robustness of the regression results, we used a replacement regression method for the test. We used the SYS-GMM model to estimate the impact of NDI on the regional energy transition. The p-value of AR(1) in Table 4 is less than 0.05, and the p-value of AR(2) is greater than 0.1, which means that the hypothesis that the remaining terms have first-order auto-correlation was accepted, and the hypothesis that the remaining terms have second-order auto-correlation was rejected. The p-value of the Sargan test was greater than 0.05, which confirmed the validity of the instrumental variables. The above results indicate that the choice of variables was valid and that the model is appropriate. Table 4 shows the regression results of the SYS-GMM model. The results show that infra had a significant negative impact on energy, which indicates that NDI had a catalytic effect on regional energy transition.
In addition, considering the endogenous of the article, we used the instrumental variable to test the model. Referring to Oughton (2021) [69], we used Internet broadband access ports (intacc) as an instrumental variable for NDI, which was primarily obtained from the National Bureau of Statistics of China. The number of Internet broadband access ports reflects the penetration rate of NDI, so we chose the number of Internet broadband access ports as an instrumental variable for NDI. Internet broadband access ports do not directly influence the transformation of the regional energy structure, and NDI is needed to provide some support, so the number of Internet broadband access ports as an instrumental variable satisfies the exclusivity requirement. According to column (3) of Table 5, the instrumental variable passed the F test, which means that the increased Internet broadband access ports improved the regional energy structure, which is consistent with the results in Table 4, demonstrating the reliability of the empirical results.

4.2. Mechanism Inspection

Referring to the method of Shen et al. (2021) [70], this paper uses a mediation effect model to study the impact mechanism of NDI on energy transition.
gtfp it = α 1 infra it + γ control it + λ i + μ t + ε it
energy it = α 2 infra it + α 3 gtfp it + γ control it + λ i + μ t + ε it
gfin it = α 4 infra it + γ control it + λ i + μ t + ε it
energy it = α 5 infra it + α 6 gfin it + γ control it + λ i + μ t + ε it
Formulas (2) and (3) verify the mediation effect of GTFP (gtfp), and the effect value of the mediation effect in the total effect is ( α 1 α 3 ) / β 1 ; Formulas (4) and (5) verify the mediation effect of green finance index (gfin), where the effect value of the mediator effect over the total effect is ( α 4 α 6 ) / β 1 .
Columns (1) and (2) of Table 6 use GTFP as an intermediary variable, column (1) shows that infra had a significant positive impact on GTFP, which means that NDI improved the GTFP. Column (2) shows that both infra and GTFP were negatively correlated with energy, which means that NDI not only directly contributed to the transformation of the energy structure, but also improved the energy structure by promoting green production. Therefore, GTFP plays an intermediary role in the transformation of energy structure and NDI. The mediating effect accounted for 23.1% of the effective value of the total effect.
Columns (3) and (4) of the model results in Table 5 use the green finance index as an intermediary variable. Column (3) shows that infra had a significant positive effect on gfin, implying that NDI increased the level of green finance. Column (4) shows that both infra and gfin were significantly negatively related to energy, indicating that green finance played a significant intermediary role in the energy structure transition, with the intermediary effect accounting for approximately 10.7% of the total effect. This result implies that NDI improved the regional energy structure by increasing the penetration of green finance. This finding is similar to the conclusion of Wang et al. (2021) [71] that green finance development contributes to the shift from conventional to renewable energy consumption.

4.3. Heterogeneity Analysis

In fact, Figure 2 demonstrates that the level of NDI varies by region. Differences in their energy endowments and environmental monitoring lead to differences in the energy structure across countries. As a result, the impact of NDI on the transformation of the energy structure may vary by region.

4.3.1. The Impact of NDI on the Energy Transition in Provinces with Different Pollution Levels

Table 7 shows the impact of NDI on the energy transition in regions with various levels of pollution. Columns (1) and (2) are the comprehensive pollution scores calculated using the entropy weighting method, Columns (3) and (4) are the comprehensive pollution scores calculated using the principal component method. Specifically, the inhibitory effect of infra on energy passes the test for less polluted areas (pollution index below the median). In less polluted areas, NDI promoted the regional energy structure transformation. For areas with high pollution levels, the effect of infra on energy did not pass the test. NDI had a greater impact on the energy transition in regions with a lower pollution level. The penetration of NDI could help reduce the dependence on regional resource endowments, improve the ability of environmental supervision, and promote the transformation of the energy structure.
There are two possible reasons why NDI promoted the energy transition in less polluted provinces. The first reason is the resource endowments of the regions. Areas with low pollution levels are usually not rich in resource endowments of non-clean energy, and their industrial development is less dependent on such energy sources. NDI has a high penetration, which provides a stronger impetus for low-carbon energy transformation in low-pollution areas [72]. The second reason is the pollution regulation in the region. Environmental supervision policies are regarded as one of the important ways to reduce environmental pollution. The tighter the monitoring of pollution, the lower the level of environmental pollution [73]. Therefore, when the local government pays attention to environmental pollution, NDI has a more significant effect on improving the government’s pollution supervision ability.

4.3.2. The Impact of NDI on Energy Transition in Energy Cooperation Regions

Table 8 shows the impact of NDI on regional energy transformation under the ECP. We selected the “Belt and Road” policy as the representative of ECP [74,75,76,77]. Specifically, in the policy implementation areas of energy cooperation, the effect of infra on energy passed the 1% significance test. The results indicate that NDI had a greater impact on the energy transition in areas with the implementation of an energy cooperation policy. In contrast, in non-energy policy implementation areas, the effect of infra on energy did not pass the significance test. This result suggests that the impact of NDI on the energy transition in the non-energy cooperation policy implementation areas was not significant. The empirical tests found that NDI had a greater impact on the energy transition in energy cooperation policy regions, while the impact was not significant in non-energy cooperation policy regions. The reasons for this may be related to geographical location, and the government needs to consider geographical location and regional trade networks of China’s trading partners when selecting provinces to implement the One Belt, One Road policy. Therefore, in regions with existing trade bases, the information supervision, information sharing, and information exchange services provided by NDI enhanced the efficiency and stability of energy cooperation, thereby accelerating the pace of regional energy transformation.

5. Discussion

In the following, we present the main results of the effects mentioned above, pointing out the impact of NDI on energy structure transition. In Section 4, we test the hypotheses presented in this paper using empirical models and analyze the empirical results, the findings of which are summarized in Table 9. This paper discusses the effect, transmission mechanism, and conditions of NDI on energy structure transformation. The research showed that NDI had a significant promotional effect on energy structure transformation, and GTFP and green finance played an important role. In fact, China’s energy industry chain is characterized by many links and long chains. NDI will help improve the high-end link capacity of the industrial, chain as well as the autonomy and controllability, so as to improve the functioning and replace the traditional energy system; accelerate the construction of a clean, low-carbon, safe, and efficient energy system; and facilitate the construction of a modern energy system. In addition, green finance and GTFP will accelerate the transformation of China’s energy structure. Green finance provides long-term and low-cost financial support for the transformation of energy structure. Improving GTFP is the core of improving energy efficiency and promoting the transformation of energy structure. The conclusion of this paper shows that, in the context of carbon peaking and carbon neutrality, it is necessary to give full play to the importance of NDI in promoting the transformation of China’s energy structure.

6. Conclusions and Policy Implications

Under the “dual carbon” goal, the rapid development of NDI construction has a profound impact on regional energy transformation. Based on provincial panel data in China, this paper explored the impact of NDI on regional energy structure and its mechanisms of action, from the perspective of green production and green finance. The main findings were as follows: NDI has a direct and significant impact on regional energy transition, and NDI facilitates regional energy transition. NDI not only directly affects the energy transformation of regions, but also has an indirect impact on regional energy transformation through GTFP and green financial. The intermediary effect of GTFP was 23.1%, and the intermediary effect of green finance was 10.7%. This conclusion provides a clearer explanation for the potential green mechanism of NDI and energy transition, and provides new ideas for improving regional energy structure. NDI has different impacts on pollution levels and energy transition policies in different regions. NDI has a significant positive effect on the energy transition in areas with low pollution levels or ECP, while it does not have a significant effect on the energy transition in areas with high pollution levels or without ECP policies. This means that the impact of NDI on energy transition is prominent in regions where the resource endowment is not abundant and the environmental supervision awareness is strong. These findings respond to, and expand on, the current debate on the relationship between NDI and the energy transition.
Based on the above findings, we can make the following policy recommendations:
(1)
The government should pay attention to the construction of NDI and give full play to the positive role of NDI in regional energy transformation. Specifically, it should follow the trend under the “dual carbon” goal; the rapid development of NDI has a profound impact on energy transformation. In addition, from the perspective of managerial implications, on the one hand, enterprises can enhance their green technology innovation ability by increasing R&D investment, such as promoting the technological innovation of renewable energy, including water energy, wind energy, solar energy, and tidal energy, so as to realize the transformation and upgrading of energy structure. On the other hand, the government needs to explore the mechanisms and practice of carbon reduction, with the demand side as the driving force to improve energy efficiency, and enhance the internal driving force of energy structure transformation.
(2)
Governments should implement targeted energy transition strategies using the impact of NDI on energy transition. First of all, it is necessary to develop GTFP in industry, promote the updating and integration of modern technology and green production technology, and increase the utilization of renewable energy. In addition, we need to develop the level of regional green finance through NDI, compensate for the lack of green financial regulation, raise the efficiency of green investment, and provide new talent for regional energy transition.
(3)
According to their level of new digital technology facilities and energy base, different regions should implement targeted energy policies. Specifically, areas with low pollution levels should strengthen the construction of NDI, give full play to its advantages, upgrade their own pollution supervision systems, and provide a model for optimizing their energy structure. Areas with high pollution levels should eliminate their excessive dependence on non-clean energy resources as soon as possible, raise awareness of pollution control, and actively introduce advanced technologies of renewable energy, so as to optimize the regional industrial energy structure. In addition, it is important to continue international energy cooperation, to learn from the successful experiences of cooperation, to introduce advanced renewable energy application technologies, to optimize the inter-provincial energy cooperation system, and to improve inter-provincial energy distribution, so as to achieve a “win–win” effect of economic growth and energy transition.
This article still has some limitations. Firstly, this article constructed a system of evaluation indicators for NDI by combining existing research and data availability. However, the current representations of NDI have not yet been unified, so the system of indicators for NDI still needs improvement. Secondly, this paper chose mediating mechanisms related to green development, but we did not explore other potential influencing mechanisms. Due to the availability of data, it is very hard to enumerate all potential mechanisms, which will be the focus of future research and needs to be further explored.

Author Contributions

Conceptualization, L.F.; methodology, L.F.; formal analysis, Q.M., L.F. and J.Z.; investigation, L.F.; data curation, Q.M., L.F. and J.Z.; writing—original draft preparation, L.F.; Y.Z. and M.J. writing—review and editing, Q.M., L.F. and J.Z.; project administration, L.F.; experiments, Y.Z. and M.J. All authors have read and agreed to the published version of the manuscript.

Funding

This research received no external funding.

Data Availability Statement

Not applicable.

Conflicts of Interest

The authors declare no conflict of interest.

References

  1. Sharma, V.; Greig, C.; Lant, P. What is stopping India’s rapid decarbonisation? Examining social factors, speed, and institutions in Odisha. Energy Res. Soc. Sci. 2021, 78, 102117. [Google Scholar] [CrossRef]
  2. Wei, C. CO2 marginal abatement cost and determinants-An empirical analysis of sample cities in China. China Econ. 2015, 10, 102. [Google Scholar] [CrossRef]
  3. Ahmad, T.; Zhang, D. A critical review of comparative global historical energy consumption and future demand: The story told so far. Energy Rep. 2020, 6, 1973–1991. [Google Scholar] [CrossRef]
  4. Henderson, J.; Mitrova, T. Implications of the global energy transition on Russia. In The Geopolitics of the Global Energy Transition; Springer: Cham, Swithland, 2020; pp. 93–114. [Google Scholar] [CrossRef]
  5. Solomon, B.D.; Krishna, K. The coming sustainable energy transition: History, strategies, and outlook. Energy Policy 2011, 39, 7422–7431. [Google Scholar] [CrossRef]
  6. Chandra, S.; Shirish, A.; Srivastava, S.C. Theorizing technological spatial intrusion for ICT enabled employee innovation: The mediating role of perceived usefulness. Technol. Forecast. Soc. Chang. 2020, 161, 120320. [Google Scholar] [CrossRef]
  7. Yang, H.; Liu, F.; Zhang, L. GIP Evaluation and Path Improvement of Technological SMEs Based on Digital Information Technology. Mob. Inf. Syst. 2022, 2022, 1574267. [Google Scholar] [CrossRef]
  8. Nguyen, T.T.; Pham, T.A.T.; Tram, H.T.X. Role of information and communication technologies and innovation in driving carbon emissions and economic growth in selected G-20 countries. J. Environ. Manag. 2020, 261, 110162. [Google Scholar] [CrossRef]
  9. Alhassan, M.D.; Adam, I.O. The effects of digital inclusion and ICT access on the quality of life: A global perspective. Technol. Soc. 2021, 64, 101511. [Google Scholar] [CrossRef]
  10. Sun, H.; Kim, G. The composite impact of ICT industry on lowering carbon intensity: From the perspective of regional heterogeneity. Technol. Soc. 2021, 66, 101661. [Google Scholar] [CrossRef]
  11. Oughton, E.; Tyler, P.; Alderson, D. Who’s Superconnected and Who’s Not? Investment in the UK’s Information and Communication Technologies (ICT) Infrastructure. Infrastruct. Complex. 2015, 2, 6. [Google Scholar] [CrossRef] [Green Version]
  12. Galvin, R. The ICT/electronics question: Structural change and the rebound effect. Ecol. Econ. 2015, 120, 23–31. [Google Scholar] [CrossRef]
  13. Zheng, J.; Wang, X. Can mobile information communication technologies (ICTs) promote the development of renewables?-evidence from seven countries. Energy Policy 2021, 149, 112041. [Google Scholar] [CrossRef]
  14. Kallal, R.; Haddaji, A.; Ftiti, Z. ICT diffusion and economic growth: Evidence from the sectorial analysis of a periphery country. Technol. Forecast. Soc. Chang. 2021, 162, 120403. [Google Scholar] [CrossRef]
  15. Chung, H. ICT investment-specific technological change and productivity growth in Korea: Comparison of 1996–2005 and 2006–2015. Telecommun. Policy 2018, 42, 78–90. [Google Scholar] [CrossRef]
  16. Tang, C.F.; Tan, E.C. Exploring the nexus of electricity consumption, economic growth, energy prices and technology innovation in Malaysia. Appl. Energy 2013, 104, 297–305. [Google Scholar] [CrossRef]
  17. Lange, S.; Pohl, J.; Santarius, T. Digitalization and energy consumption. Does ICT reduce energy demand? Ecol. Econ. 2020, 176, 106760. [Google Scholar] [CrossRef]
  18. Shabani, Z.D.; Shahnazi, R. Energy consumption, carbon dioxide emissions, information and communications technology, and gross domestic product in Iranian economic sectors: A panel causality analysis. Energy 2019, 169, 1064–1078. [Google Scholar] [CrossRef]
  19. Mourshed, M.; Robert, S.; Ranalli, A.; Messervey, T.; Reforgiato, D.; Contreau, R.; Becue, A.; Quinn, K.; Rezgui, Y.; Lennard, Z. Smart Grid Futures: Perspectives on the Integration of Energy and ICT Services. Energy Procedia 2015, 75, 1132–1137. [Google Scholar] [CrossRef]
  20. Bris, M.; Pawlak, J.; Polak, J.W. How is ICT use linked to household transport expenditure? A cross-national macro analysis of the influence of home broadband access. J. Transp. Geogr. 2017, 60, 231–242. [Google Scholar] [CrossRef]
  21. Hilty, L.M. Information Technology and Sustainability; Books on Demand: Nordstedt, Germany, 2008. [Google Scholar] [CrossRef]
  22. Ishida, H. The effect of ICT development on economic growth and energy consumption in Japan. Telemat. Inform. 2015, 32, 79–88. [Google Scholar] [CrossRef]
  23. International Renewable Energy Association. Future of Wind: Deployment, Investment, Technology, Grid Integration and Socio-economic Aspects; International Renewable Energy Agency: Abu Dhabi, United Arab Emirates, 2019. [Google Scholar]
  24. O’Dwyer, E.; Pan, I.; Acha, S.; Gibbons, S.; Shah, N. Modelling and evaluation of multi-vector energy networks in smart cities. In Proceedings of the International Conference on Smart Infrastructure and Construction 2019 (ICSIC) Driving data-informed decision-making, Cambridge, UK, 8–10 July 2019; ICE Publishing: London, UK, 2019; pp. 161–168. [Google Scholar] [CrossRef] [Green Version]
  25. Duch-Brown, N.; Rossetti, F. Digital platforms across the European regional energy markets. Energy Policy 2020, 144, 111612. [Google Scholar] [CrossRef]
  26. Korkmaz, P.; Gardumi, F.; Avgerinopoulos, G.; Blesl, M.; Fahl, U. A comparison of three transformation pathways towards a sustainable European society—An integrated analysis from an energy system perspective. Energy Strat. Rev. 2020, 28, 100461. [Google Scholar] [CrossRef]
  27. Thongmak, M. Youths’ Green Information and Communications Technology Acceptance and Implications for the Innovation Decision Process. Electron. Green J. 2016, 1. [Google Scholar] [CrossRef]
  28. Moyer, J.D.; Hughes, B.B. ICTs: Do they contribute to increased carbon emissions? Technol. Forecast. Soc. Chang. 2012, 79, 919–931. [Google Scholar] [CrossRef]
  29. Yan, Z.; Shi, R.; Yang, Z. ICT Development and Sustainable Energy Consumption: A Perspective of Energy Productivity. Sustainability 2018, 10, 2568. [Google Scholar] [CrossRef] [Green Version]
  30. Haftu, G.G. Information communications technology and economic growth in Sub-Saharan Africa: A panel data approach. Telecommun. Policy 2019, 43, 88–99. [Google Scholar] [CrossRef]
  31. Johnstone, N.; Haščič, I.; Popp, D. Renewable energy policies and technological innovation: Evidence based on patent counts. Environ. Resour. Econ. 2010, 45, 133–155. [Google Scholar] [CrossRef] [Green Version]
  32. Østergaard, P.A.; Duic, N.; Noorollahi, Y.; Kalogirou, S.A. Recent advances in renewable energy technology for the energy transition. Renew. Energy 2021, 179, 877–884. [Google Scholar] [CrossRef]
  33. Motz, A. Consumer acceptance of the energy transition in Switzerland: The role of attitudes explained through a hybrid discrete choice model. Energy Policy 2021, 151, 112152. [Google Scholar] [CrossRef]
  34. Yang, X. FinTech in Promoting the Development of Green Finance in China against the Background of Big Data and Artificial Intelligence. In Proceedings of the 2020 4th International Seminar on Education Innovation and Economic Management (SEIEM), Penang, Malaysia, 23–24 May 2020; Francis Academic Press: London, UK, 2020. [Google Scholar] [CrossRef]
  35. Qing, H.G. Green information technology government regulation components: Improving Indonesia green information technology. J. Theor. Appl. Inf. Technol. 2019, 97, 4467–4477. [Google Scholar]
  36. Zhao, Y.; Ke, J.; Ni, C.C.; McNeil, M.; Khanna, N.Z.; Zhou, N.; Fridley, D.; Li, Q. A comparative study of energy consumption and efficiency of Japanese and Chinese manufacturing industry. Energy Policy 2014, 70, 45–56. [Google Scholar] [CrossRef]
  37. United Nations Environment Programme (UNEP). Adaptation Gap Report 2020-Executive Summary; United Nations Environment Programme: Nairobi, Kenya, 2021. [Google Scholar]
  38. O’Mahony, M.; Vecchi, M. Quantifying the Impact of ICT Capital on Output Growth: A Heterogeneous Dynamic Panel Approach. Economica 2005, 72, 615–633. [Google Scholar] [CrossRef]
  39. Li, W.; Fan, J.; Zhao, J. Has green finance facilitated China’s low-carbon economic transition? Environ. Sci. Pollut. Res. 2022, 29, 57502–57515. [Google Scholar] [CrossRef] [PubMed]
  40. Navarro, M.P.; Catalão-Lopes, M. A structured financial product applied to renewable energies. Green Financ. 2019, 1, 82–93. [Google Scholar] [CrossRef]
  41. Huang, J.; Xia, J. Regional Competition, Heterogeneous Factors and Pollution Intensity in China: A Spatial Econometric Analysis. Sustainability 2016, 8, 171. [Google Scholar] [CrossRef] [Green Version]
  42. Dong, F.; Yu, B.; Zhang, J. What Contributes to Regional Disparities of Energy Consumption in China? Evidence from Quantile Regression-Shapley Decomposition Approach. Sustainability 2018, 10, 1806. [Google Scholar] [CrossRef] [Green Version]
  43. Hu, A.G. Innovating Green Development in China; Springer: Berlin/Heidelberg, Germany, 2012. [Google Scholar]
  44. Soma, K.; Termeer, C.J.; Opdam, P. Informational governance—A systematic literature review of governance for sustainability in the Information Age. Environ. Sci. Policy 2016, 56, 89–99. [Google Scholar] [CrossRef]
  45. Zhang, H. The green paradox puzzle: Interpretation from the perspective of local government competition. J. Financ. Econ-Nomics 2014, 40, 114–127. [Google Scholar]
  46. Galloway, E.; Johnson, E.P. Teaching an old dog new tricks: Firm learning from environmental regulation. Energy Econ. 2016, 59, 1–10. [Google Scholar] [CrossRef]
  47. Zheng, Y.; Peng, J.; Xiao, J.; Su, P.; Li, S. Industrial structure transformation and provincial heterogeneity characteristics evolution of air pollution: Evidence of a threshold effect from China. Atmos. Pollut. Res. 2020, 11, 598–609. [Google Scholar] [CrossRef]
  48. Huang, S.-Z. The effect of natural resources and economic factors on energy transition: New evidence from China. Resour. Policy 2022, 76, 102620. [Google Scholar] [CrossRef]
  49. Lu, H.; Peng, J.; Lu, X. Do Factor Market Distortions and Carbon Dioxide Emissions Distort Energy Industry Chain Technical Efficiency? A Heterogeneous Stochastic Frontier Analysis. Energies 2022, 15, 6154. [Google Scholar] [CrossRef]
  50. Xiang, H.; Ch, P.; Nawaz, M.A.; Chupradit, S.; Fatima, A.; Sadiq, M. Integration and economic viability of fueling the future with green hydrogen: An integration of its determinants from renewable economics. Int. J. Hydrog. Energy 2021, 46, 38145–38162. [Google Scholar] [CrossRef]
  51. Mohammed, I.; Lenshie, N.E. Political Economy of Resource Curse and Dialectics of Crude Oil Dependency in Nigeria. Int. Bus. Manag. 2017, 14, 33–44. [Google Scholar] [CrossRef]
  52. Teklemariam, M.H.; Kwon, Y. Reducing internet demand-side gap improves digital inclusion in low-income coun-tries:-analysis that is more comprehensive. In Proceedings of the 22nd ITS Biennial Conference, Seoul 2018. Beyond the Boundaries: Challenges for Business, Policy and Society, Seoul, Korea, 24–27 June 2018; International Telecommunications Society (ITS): Calgary, AB, Canada, 2018. [Google Scholar]
  53. Daly, H.E. Toward some operational principles of sustainable development. Ecol. Econ. 1990, 2, 97–102. [Google Scholar] [CrossRef]
  54. Wu, Y.; Wang, J.; Ji, S.; Song, Z. Renewable energy investment risk assessment for nations along China’s Belt & Road Initiative: An ANP-cloud model method. Energy 2020, 190, 116381. [Google Scholar] [CrossRef]
  55. Naz, L.; Ali, A.; Fatima, A. International competitiveness and ex-ante treatment effects of CPEC on household welfare in Pakistan. Int. J. Dev. Issues 2018, 17, 168–186. [Google Scholar] [CrossRef]
  56. Sun, X. Non-energy factors and their influences in energy cooperation between China and Middle East countries. Arab. World Stud. 2022, 4, 21–39. [Google Scholar]
  57. Caldés, N.; del Río, P.; Lechón, Y.; Gerbeti, A. Renewable Energy Cooperation in Europe: What Next? Drivers and Barriers to the Use of Cooperation Mechanisms. Energies 2018, 12, 70. [Google Scholar] [CrossRef]
  58. Adebayo, T.S.; Awosusi, A.A.; Bekun, F.V.; Altuntaş, M. Coal energy consumption beat renewable energy consumption in South Africa: Developing policy framework for sustainable development. Renew. Energy 2021, 175, 1012–1024. [Google Scholar] [CrossRef]
  59. Zhao, X. Research on the effect of technological innovation of NDI. Stat. Res. 2022, 39, 80–92. [Google Scholar]
  60. Hadfield, P.; Cook, N. Financing the Low-Carbon City: Can Local Government Leverage Public Finance to Facilitate Equitable Decarbonisation? Urban Policy Res. 2019, 37, 13–29. [Google Scholar] [CrossRef]
  61. Saygin, D.; Kempener, R.; Wagner, N.; Ayuso, M.; Gielen, D. The Implications for Renewable Energy Innovation of Doubling the Share of Renewables in the Global Energy Mix between 2010 and 2030. Energies 2015, 8, 5828–5865. [Google Scholar] [CrossRef]
  62. Yan, Y.; Liu, T.; Wang, N.; Yao, S. Urban sprawl and fiscal stress: Evidence from urbanizing China. Cities 2022, 126, 103699. [Google Scholar] [CrossRef]
  63. Sinn, H.-W. Public policies against global warming: A supply side approach. Int. Tax Public Financ. 2008, 15, 360–394. [Google Scholar] [CrossRef]
  64. Peng, B.; Chen, H.; Elahi, E.; Wei, G. Study on the spatial differentiation of environmental governance performance of Yangtze river urban agglomeration in Jiangsu province of China. Land Use Policy 2020, 99, 105063. [Google Scholar] [CrossRef]
  65. Liu, J.; Xuan, K.; Xie, N.; Zhang, J.; Wang, X.; Yu, Z.; Wang, W. Effects of urbanisation on regional water consumption in China. J. Hydrol. 2022, 609, 127721. [Google Scholar] [CrossRef]
  66. Taghizadeh-Hesary, F.; Rasoulinezhad, E. Analyzing Energy Transition Patterns in Asia: Evidence From Countries With Different Income Levels. Front. Energy Res. 2020, 8, 162. [Google Scholar] [CrossRef]
  67. Acheampong, A.O.; Boateng, E.; Amponsah, M.; Dzator, J. Revisiting the economic growth–energy consumption nexus: Does globalization matter? Energy Econ. 2021, 102, 105472. [Google Scholar] [CrossRef]
  68. Li, F.; Shang, Y.; Xue, Z. The impact of foreign direct investment on my country’s green development: Based on data verification of 260 prefecture-level cities in China. Econ. Issues 2022, 19, 12183. [Google Scholar] [CrossRef]
  69. Oughton, E. Policy options for digital infrastructure strategies: A simulation model for broadband universal service in Africa. arXiv 2021, arXiv:2102.03561. [Google Scholar] [CrossRef]
  70. Shen, F.; Liu, B.; Luo, F.; Wu, C.; Chen, H.; Wei, W. The effect of economic growth target constraints on green technology innovation. J. Environ. Manag. 2021, 292, 112765. [Google Scholar] [CrossRef] [PubMed]
  71. Wang, H.; Jiang, L.; Duan, H.; Wang, Y.; Jiang, Y.; Lin, X. The Impact of Green Finance Development on China’s Energy Structure Optimization. Discret. Dyn. Nat. Soc. 2021, 2021, 2633021. [Google Scholar] [CrossRef]
  72. Xu, Q.; Zhong, M.; Li, X. How does digitalization affect energy? International evidence. Energy Econ. 2022, 107, 105879. [Google Scholar] [CrossRef]
  73. Du, W.; Li, M. Assessing the impact of environmental regulation on pollution abatement and collaborative emissions reduction: Micro-evidence from Chinese industrial enterprises. Environ. Impact Assess. Rev. 2020, 82, 106382. [Google Scholar] [CrossRef]
  74. Zhao, J. The Belt and Road Energy Cooperation. In Reshaping the Economic Cooperation Pattern of the Belt and Road Initiative; Palgrave Macmillan: Singapore, 2021; pp. 151–169. [Google Scholar]
  75. Hu, Y.; Li, Y.; Sun, J.; Zhu, Y.; Chai, J.; Liu, B. Towards green economy: Environmental performance of belt and road initiative in China. Environ. Sci. Pollut. Res. 2022. [Google Scholar] [CrossRef]
  76. Xu, H.; Cui, Q.; Sofield, T.; Li, F.M.S. Attaining harmony: Understanding the relationship between ecotourism and protected areas in China. J. Sustain. Tour. 2014, 22, 1131–1150. [Google Scholar] [CrossRef]
  77. Zhang, K.Q.; Chen, H.H.; Tang, L.Z.; Qiao, S. Green Finance, Innovation and the Energy-Environment-Climate Nexus. Front. Environ. Sci. 2022, 10, 602. [Google Scholar] [CrossRef]
Figure 1. The impact mechanism of the NDI on energy structure transition.
Energies 15 08784 g001
Figure 2. Distribution of energy consumption structure (2008–2019).
Energies 15 08784 g002
Figure 3. Distribution of new digital infrastructure (2008–2019).
Energies 15 08784 g003
Table 1. Reduction coefficients of major energy categories in the energy industry chain.
Energy CategoryReduction FactorEnergy CategoryReduction Factor
Raw coal0.7143Gasoline1.4714
Washed coal0.9000Diesel1.4571
Coal products0.5286Kerosene1.4714
Coke0.9714Fuel oil1.4286
Coke oven gas5.7140Liquefied petroleum gas1.7143
Natural gas13.3000Electricity1.2290
Liquefied natural gas1.7572Thermal0.0341
Crude oil1.4286Others1.000
Table 2. Variable definitions.
Variable ClassificationVariableDefinition
Explained variableEnergy structureProportion of energy consumed by coal compared to total energy consumed
Explanatory variableInfraNew digital infrastructure
Control variablesSufLocal government revenue to expenditure ratio
ErComprehensive utilization rate of solid waste
UrbanLevel of urbanization
Urban2Square of the level of urbanization
PgdpLogarithm of GDP per capital
EgdpEducation expenditure as a percentage of GDP
Intermediate variablesGtfpGreen total factor productivity
GfinGreen finance index
Table 3. Descriptive statistics of variables.
VarNMeanStdMinQ25Q50Q75Max
energy3600.4140.1520.0120.3120.4380.5190.724
infra3600.1940.1470.0120.0880.1500.2510.941
suf3600.5380.1940.1890.4000.4870.7060.960
er3600.6650.1910.2540.5110.6440.8340.998
urban3600.5590.1310.2910.4690.5430.6160.942
pgdp3601.6290.4190.6801.3521.5941.8702.860
egdp3600.0400.0150.0190.0290.0370.0480.112
Table 4. Direct impact of NDI on energy structure transition.
(1)(2)(3)(4)
VariablesEnergyEnergyEnergyEnergy
infra−0.126 *−0.179 ***−0.118 *−0.196 ***
(−1.67)(−4.27)(−1.72)(−4.47)
suf −0.183 ***−0.064
(−3.66)(−1.26)
er −0.075 *−0.047 *
(−1.87)(−1.67)
urban −1.119 ***−0.538 *
(−3.26)(−1.90)
urban2 0.689 ***0.257
(2.62)(1.08)
pgdp −0.206 ***−0.102 **
(-4.71)(−2.43)
egdp −5.312 ***−0.702
(−8.77)(−1.13)
Constant0.439 ***0.449 ***1.533 ***0.929 ***
(26.61)(53.57)(11.98)(9.55)
Year Fixed EffectYesYesYesYes
Province Fixed EffectNoYesNoYes
Observations360360360360
R-squared0.1150.9430.5780.948
Notes: ***, **, and * represent the significance levels of 1%, 5%, and 10%, respectively, with the same below.
Table 5. Robustness test of NDI for regional energy transition.
(1)(2)(3)
SYS-GMMSYS-GMMIV
VariablesEnergyEnergyEnergy
L.energy0.946 ***0.905 ***
(45.87)(30.68)
infra−0.042 ***−0.051 **−0.166 ***
(−2.98)(-2.38)(−2.96)
suf −0.032−0.067
(−1.64)(−1.02)
er −0.007−0.003
(−0.38)(−0.09)
urban 0.056−0.713 *
(0.32)(−1.74)
urban2 −0.0200.362
(−0.15)(1.06)
pgdp -0.013−0.106 **
(−1.01)(−2.00)
egdp −0.417 *−0.041
(−1.91)(−0.06)
Constant0.018 *0.074
(1.68)(1.28)
Year Fixed EffectYesYesYes
Province Fixed EffectYesYesYes
Observations330330270
Number of Province3030
Ar1 (p value)00
Ar2 (p value)0.9050.751
Sargan (p value)0.2880.227
KPLM 191.2
CDWaldF 545.9
Note: The standard errors in brackets, ***, **, *, indicate significant at 1%, 5% and 10% respectively, the same below.
Table 6. Mechanism test.
(1)(2)(3)(4)
VariablesGtfpEnergyGfinEnergy
gtfp −0.024 **
(−2.42)
gfin −0.390 ***
(−4.12)
infra1.886 ***−0.169 ***0.054 **−0.175 ***
(5.85)(−2.99)(2.10)(−4.07)
suf0.276−0.0540.037−0.050
(0.88)(−1.04)(1.24)(−1.00)
er0.617 ***−0.0330.044 ***−0.030
(3.46)(−1.09)(2.65)(−1.08)
urban−15.396 ***−0.793 **−1.480 ***−1.116 ***
(−8.34)(−2.33)(−8.94)(−3.60)
urban212.815 ***0.512 *0.663 ***0.516 **
(8.31)(1.80)(4.79)(2.15)
pgdp1.184 ***−0.0640.093 ***−0.066
(4.32)(−1.37)(3.78)(−1.57)
egdp2.431−0.7240.530−0.495
(0.64)(−1.15)(1.46)(−0.81)
Constant3.036 ***0.943 ***0.546 ***1.142 ***
(4.84)(8.75)(9.63)(10.57)
Year Fixed EffectYesYesYesYes
Province Fixed EffectYesYesYesYes
Observations330330360360
R-squared0.9440.9500.9610.950
Notes: ***, **, and * represent the significance levels of 1%, 5%, and 10%, respectively, with the same below.
Table 7. The impact of NDI on energy transition in provinces with different pollution levels.
(1)(2)(3)(4)
VariablesPoent ≤ MedPoent > MedPopri ≤ MedPopri > Med
infra−0.538 ***−0.090−0.552 ***−0.100
(−6.08)(−1.28)(−6.10)(−1.52)
suf0.016−0.082−0.028−0.091
(0.20)(−1.29)(−0.35)(−1.44)
er−0.181 ***0.093 **−0.160 ***0.056
(−4.98)(2.17)(-4.31)(1.35)
urban0.357−1.879 ***0.109−1.921 ***
(0.85)(-3.07)(0.27)(−4.03)
urban2−0.2011.605 ***−0.1231.574 ***
(−0.64)(2.82)(-0.41)(3.48)
pgdp−0.130 ***−0.000−0.221 ***0.014
(−2.87)(−0.00)(−3.84)(0.24)
egdp−1.487 **−0.483−1.475 **−0.701
(−2.22)(−0.33)(−2.14)(−0.55)
Constant0.666 ***1.013 ***0.979 ***1.060 ***
(5.34)(6.97)(6.37)(7.41)
Year Fixed EffectYesYesYesYes
Province Fixed EffectYesYesYesYes
Observations180178179180
R-squared0.9600.9490.9590.955
Notes: *** and ** represent the significance levels of 1%, 5%, and 10%, respectively, with the same below.
Table 8. Impact of NDI on energy transition in regions with or without in energy cooperation.
(1)(2)(3)(4)
VariablesRoad = 0Road = 1Road = 0Road = 1
infra0.006−0.156 ***0.024−0.220 ***
(0.08)(−3.23)(0.33)(−4.01)
suf −0.0460.020
(−0.67)(0.29)
er 0.092 **−0.092 ***
(1.99)(-2.77)
urban 0.004−1.170 **
(0.01)(−2.36)
urban2 0.3500.846 *
(1.29)(1.87)
pgdp −0.014−0.048
(−0.21)(−0.90)
egdp 0.811−0.545
(0.63)(−0.83)
Constant0.448 ***0.416 ***0.277 *0.952 ***
(29.78)(45.93)(1.88)(6.39)
Year Fixed EffectYesYesYesYes
Province Fixed EffectYesYesYesYes
Observations156204156204
R-squared0.9540.9500.9580.957
Notes: ***, **, and * represent the significance levels of 1%, 5%, and 10%, respectively.
Table 9. Summary of results: three impacts of NDI on energy transition.
Empirical Main FindingsExplanation
Effect I: Direct effectNDI has a significant positive impact on the transformation of regional energy structure.① NDI optimizes energy management systems and improves energy allocation efficiency.
② NDI increases the flexibility and timeliness of the energy market.
③ NDI enhances awareness of green energy consumption and accelerates the shift in low-carbon consumer behavior.
Effect II: Intermediary effectsNDI contributes to the transformation of regional energy structure by increasing GTFP.① NDI facilitates the diffusion of green production technologies into industry, thereby increasing the efficiency of renewable energy use.
② NDI builds a diverse labor supply system, to meet the labor demands of green energy production methods.
③ NDI speeds up the flow of information and pushes companies toward green production, by creating a preference for green energy consumption.
NDI promotes the transformation of regional energy structure through the development of green finance.① NDI improves green information communication mechanisms, increases green financial support for quality companies, and fills the investment gap in the energy transition.
② NDI can optimize green investment systems and guide social capital into regional energy transition.
Effect III: Moderating effectsThe positive effect of NDI on the transformation of the energy structure is evident in areas with low levels of environmental pollution.① In areas of strong environmental governance awareness, NDI enhances environmental regulation and influences the transformation of the energy structure through the “cost of compliance effect” and “innovation offset effect”.
② The positive effect of NDI on the energy transition is undermined by a high level of industrial energy structure dependence in areas with a large resource endowment in non-renewable energy sources and by the underdevelopment of regional economies.
The positive effect of NDI on the transformation of the energy structure is evident in regions adopting the Energy Cooperation Policy (ECP).① ECP regions generally have strong energy transition aspirations, raising the positive role of NDI for the energy transition.
② The geographical advantages and industrial needs of the regions involved in the ECP provide favorable conditions for energy cooperation and strengthen the positive role of NDI.
Publisher’s Note: MDPI stays neutral with regard to jurisdictional claims in published maps and institutional affiliations.

