Article

Consequence of Blowby Flow and Idling Time on Oil Consumption and Particulate Emissions in Gasoline Engine

Ecole Centrale de Nantes, LHEEA Laboratory (ECN/CNRS), 44321 Nantes, France
*
Author to whom correspondence should be addressed.
Energies 2022, 15(22), 8772; https://doi.org/10.3390/en15228772
Submission received: 13 October 2022 / Revised: 31 October 2022 / Accepted: 18 November 2022 / Published: 21 November 2022
(This article belongs to the Special Issue NOx, PM and CO2 Emission Reduction in Fuel Combustion Processes)

Abstract

:
Pollutant emission standards and, in particular, those concerning particles from an internal combustion engine (ICE) are becoming increasingly restrictive. Thus, it is important to determine the main factors related to the production of particulate matter. In this article, the phenomenon of oil sweeping by the blowby gases between the rings/piston/cylinder is investigated. First, a blowby gas simulation model based on experimental results from a Turbocharged Gasoline Direct Injection (TGDI) is developed. From this model, it is possible to characterise the amount of oil swept by the blowby gases. This depends on the endgap position of both the compression and sealing rings. It also depends on the intensity of the blowby flow rate, which is highest at low rpm and high load. At 1500 rpm and full load, this flowrate exceeds 25 mg.cycle−1. From this result, it is possible to quantify the amount of oil swept by these gases as a function of the endgap position. For θ r i n g s = 180 ° ,   the quantity of oil swept rises to 20 µg.cycle−1 while for θ r i n g s = 30 ° , this decreases to 6 µg.cycle−1. The oil concentration of the blowby gas has a direct impact on the particulate emissions because the oil concentration of the backflow gas is inversely proportional to the blowby gas flowrate. As the backflow gases return to the cylinder, the oil oxidises and produces particles. Therefore, it is essential to control the oil concentration of the backflow gases. In addition, the simulation model shows the blowby flowrate becomes negative and decreases to −3.4 mg. cycle−1 in idle conditions. The amount of oil swept by the blowby is no longer directed towards the oil pan, but towards the piston crown. This phenomenon of oil storage of the piston crown in idle condition is proportional to the duration of the idle time. In order to confirm these results, experimental tests are carried out on a TGDI engine. It appears that when the idling time changes from 0 s to 7 s between two strictly identical accelerations, the level of particulate emissions is multiplied by 1.3. When the idling time changes from 0 s to 22 s between two strictly identical accelerations, the level of particulate emissions is multiplied by 3. These results confirm the mechanism of oil storage at idle highlighted by the simulation model.

1. Introduction

Human activities have an impact on the environment by producing large quantities of greenhouse gases and polluting emissions. In the field of transport, the main pollutants linked to internal combustion engines are CO, NOx, unburnt hydrocarbons, and particles. The size of these particles can be less than a few tens of nanometers and therefore they can penetrate the bronchial tubes, reach the pulmonary alveoli, and have adverse effects on human health. It is therefore necessary to reduce particulate emissions from an internal combustion engine. In Europe, the Euro 6d regulation limits these emissions to 6.1011 particles by km and 4.5 mg of particles by km with the Worldwide Harmonized Light Vehicle Test Procedure cycle (WLTP) [1], for particles larger than 23 nm. The particle formation is a complex mechanism. It consists of a solid part composed of carbon and hydrogen containing a soluble organic fraction such as unburnt hydrocarbons, oxygenated derivatives or polyclinic aromatic hydrocarbons (PAH), or containing non-organic elements, such as mineral derivatives or metallic residues [2]. A particle arises from the collision between two PAH of pyrene (C16H10). This is called nucleation [3,4,5,6,7,8]. For internal combustion engines, the main factor generating particulate matter is the high-temperature combustion or pyrolysis of unburnt fuel [9]. Particle fluctuation at steady-state regimes was observed by Thawko, et al., [10] on a gasoline engine and by Swanson, et al., [11] on a diesel engine. Berthome, et al., [12,13] found variations in particulate emissions from a TGDI engine up to 80% on strictly identical transients. Amirante, et al., [14] found that the predicted soot particles mass was lower than experimental values and they suggested that other sources than fuel combustion should be considered, such as oil consumption. The main source of particulate emissions after unburnt fuel is oil consumption [15,16,17,18]. This consumption has several origins, such as the expulsion of oil through the piston rings into the combustion chamber, the evaporation of the oil film, and the transport of oil through the valve guides or via the blowby gases [19,20,21,22]. During a transient, Berthome, et al., [12,20] determined that 57% of the particulate emissions from an ICE were related to the variation of richness, while 31% were related to blowby, and 12% to backflow.
Blowby gases formation:
Blowby and backflow gases therefore have a very significant impact on particulate emissions. For example, an TGDI without blowby gases reintroduced at the intake emits 1.5 times less particle emissions than the same engine in normal configuration [20]. These gases, resulting from combustion, pass through the labyrinths of the cylinder/piston, ring, and grooves to the oil pan. These hot gases absorb oil droplets as they pass through the cylinder. Most engines use an oil sump. This means that the oil falls back into the crankcase by gravity after lubricating the components such as the crankshaft bearings, camshafts, valves, turbocharger, etc. A pump immersed in this housing sucks the oil and delivers it to the components to be lubricated after passing through the oil filter. With this oil falling by gravity, as well as the spray lubrication of the cylinder walls and moving parts, an oil mist is created which is partially absorbed by the hot gases of the blowby. If nothing is done, the pressure in the lower crankcase increases and can lead to problems with sealing, lubrication, etc. It is therefore necessary to evacuate these gases for the proper functioning of the engine. Since the introduction of anti-pollution standards, these gases are no longer released into the atmosphere but are reinjected at the intake. The oil in these gases must be removed before re-introducing them into the intake manifold [23].
The blowby oil sweep phenomenon:
Min, et al., [24] found that the blowby gases had the particularity of sweeping the oil stored between the compression and sealing rings of a piston. The position of the first two rings, characterized by the position of the “endgap”, influences the flow rate and oil concentration of the blowby gases [24,25,26,27]. Thirouard, et al., [28] deduce that the amount of oil returned to the oil pan ( Q o i l ) depends on the blowby flow rate ( Q b l o w b y ) and the position of the “endgap” of these rings ( θ r i n g s ), cf., Equations (1) and (2).
Q o i l = Q b l o w b y 1 2 π μ a i r μ o i l · 3   K 1 K 2   2 π θ r i n g s 1 e K 2 θ r i n g s C 1 2 π θ r i n g s + θ r i n g s 1 e K 2 2 π θ r i n g s C 1 θ r i n g s ,
with
C 1 = Q b l o w b y μ a i r μ o i l · 3   2 π ( h a i r ) 2 R l a n d
where Rland is the clearance between piston radius and cylinder radius, K1 and K2 constants are mainly related to the engine speed, and hair is the clearance between the piston and the cylinder.
A ring is a split elastic ring made mainly of steel. This endgap is necessary to counteract thermal deformations that cause a ring dilatation. Depending on the chemical properties of the ring, this cutting clearance is more or less important. When the endgaps of the compression and sealing rings are opposite each other at 180°, the blowby gases sweep over the entire inter-ring area, see Figure 1a. This means that a maximum amount of oil stored in this zone is redirected to the oil pan. This phenomenon is called “blow-down effect”.
The gases, reintroduced into the cylinder during the next cycle, and which will pass through this zone again in the other way via the backflow phenomenon, will be lightly charged with oil and, consequently, the associated level of particles will be limited. On the other hand, if the endgap positions are close, for example, 0°, the area swept by the gases will be very limited and there will be a lot of oil left in this area, see Figure 1b. The backflow gases will then recharge with oil and redirect it to the cylinder, resulting in a higher particle level in the next cycle. Nakashima, et al., [29] and Agarwal, et al., [30] measured very significant variations in oil flow as a function of endgap position, up to 400% depending on the piston design.
Rings dynamic behaviour:
The ring dynamic behaviour is a complex mechanism. A piston ring rises and falls in its groove several times per cycle. This is due to the different forces it undergoes. Tian, et al., [31] determined that the position of the ring depended on the gas pressure upstream and downstream of the ring, inertial forces, frictional forces, the pressure distribution on the side of the ring, and the contact surface of the ring on the cylinder. However, under special engine conditions, that is to say under heavy load and for high rotational speed, the first two rings can sometimes move radially inwards of the piston grooves and allow unburned gases to pass directly into the oil pan via the scraper ring [32]. Tian [33] and Chen [34] showed that this dynamic behaviour, called radial collapse, is very sensitive to the pressure above the ring and to the tilt angle of the ring. When the ring collapses, it generates more blow-by. Tian [31] demonstrated that it can be limited via the shape of the rings. Rabuté and Tian [35] found out that blow-by is sensitive to the choice of ring materials. Wroblewski and Koszalka [36] measured the influence of various anti-wear coatings on frictional losses on the rings. Wroblewski and Iskra [37] demonstrated that the asymmetrical shape of the rings impacts the amount of oil scraped into the combustion chamber during the compression and exhaust stroke. Zarenbin, et al., [38] studied the impact of piston ring mobility on the blow-by gas and determined that the movements of the rings in the grooves noticeably affect the gas escape into the crankcase. Turnbull, et al., [39] showed that the power losses due to gas leakage can be more important than frictional losses.
There are various singularities in the dynamics of the rings, such as axial flutter and radial flutter, but the one that most impacts the blowby phenomenon is rotational movement. The rotation of the rings is due to two phenomena: micro-scratches in the cylinder, and piston oscillations. In fact, the rings do not move back and forth in a radial direction, but by reversing them in the cylinder bore, the piston changes its support from one cylinder wall to the other if it is on the thrust or anti-thrust side. This occurs both at Top Dead Center (TDC) of the piston and at Bottom Dead Center (BDC). This results in a radial displacement of the ring in its groove. This leads to the rotation of the ring in relation to the cross pass and the honing structure. Schneider, et al., [40] and Min, et al., [24] measured ring rotation of up to 10 rpm. This depends on the load and engine speeds [41]. Thirouard, et al., [26] studied the impact of the position of the rings and the amount of oil in the space between the first two rings (Land 2). It appears that when the rings are free to rotate, the amount of oil is very unstable, whereas it remains constant when they are locked in rotation.
Blowby gas simulation:
In order to better characterise the quantity of oil swept by the blowby gases and its impact on particle emissions, it appears necessary to create a simulation model of these gases. The novelty of this article is that it is possible to quantify the amount of oil swept by these gases from a simulation model and as a function of the position of the piston rings and the engine operating points. The first part of this paper is devoted to the calibration and analysis of the simulation model based on experimental tests, while the second part refers to the analysis of a particular engine operating point that is idling.

2. Materials and Method

2.1 Description of Engine Bench

The tests were carried out on a three-cylinder spark-ignition engine. It is a turbocharged direct-injection engine. Its characteristics are specified in Table 1. It was braked by a dynamic HORIBA HT 250 bench managed by a SPARC control unit. The engine was instrumented with type K temperature sensors, 0–3 bar static pressure sensors, two Kistler type 4049B dynamic pressure sensors for the intake and the exhaust (frequency = 60 kHz), one HBM type 40 torquemeter (frequency = 10 kHz), three AVL type ZI33 in-cylinder pressure sensors (frequency = 150 kHz), and one ETAS ES430 air-fuel ratio sensor (frequency = 2 kHz).
The INCA Software (version 7.1.10/3) controlled the engine ECU.
All the sensors were connected to a National Instrument fast acquisition box. The STARS software from HORIBA made it possible to automatically control the dynamic bench, and it could create different cycles. The PR-L804 fan from Dynair cooled the engine radiator, and the Fumex FB110 fan cooled the intake heat exchanger. Both fans were controlled by STARS software, which modified their rotation speeds according to the speed of the vehicle during a cycle. This equipment created test conditions close to the real ones. The pollutant emissions CO and HC were measured with a 3200 CAPELEC device, the NOx emission with an ECM NOxCANt sensor, and particle emission with a Pegasor Particle Sensor (PPS). The setup is shown in Figure 2.

3. Blowby Simulation in Steady State

3.1. Building a Blowby Simulation Model

As a first step, it is necessary to model the blowby gases of the engine described in Table 1. In this way, the Gamma Technology simulation software, GT-suite 2021, which has a “RingPack” module (specially created to model piston/cylinder/ring friction and to model the pressures and flows of gases circulating through the rings and piston grooves) was used. Only a single cylinder simulation model was created. Indeed, the objective was to create a simulation model of the phenomenon of oil scavenging by the blow-by gases according to the value of the final gap of the first two rings of one of the cylinders of the engine used. This single cylinder has all the technical characteristics of the engine used, such as the cylinder and piston diameters, the length of the connecting rod, the depth, height, and location of the piston grooves and the rings. Some of these characteristics are shown in Table 1. The input parameters required for this model were the temperature and pressure inside the cylinder during a cycle, see Figure 3. The latter was derived from experimental tests, while the temperature was approximated by the extensive literature on the subject. Indeed, temperature is a key factor, as it determines the proportion of an object that expands according to its physical properties and, in particular, its coefficient of expansion. Piston, ring and cylinder wall temperatures are proportional to the specific power developed by the engine and therefore depend on the engine load and speed [42]. On a single-cylinder diesel engine at 25% load and a speed of 3600 rpm, Abril, et al., [43] measured a compression ring temperature close to 200 °C during the combustion and expansion phases. On a single-cylinder, spark-ignition engine at 75% load and 3500 rpm, Thiel, et al., [42] determined that the temperature of the compression ring could reach 210 °C during these same phases. Husberg, et al., [44] found piston crown temperature variations of up to 75 °C between 25% and 50% load on a single-cylinder diesel engine. Taking all these elements into account, a coefficient of thermal expansion of the compression ring equal to 1 × 10⁻⁵ K−1 with a maximum temperature of 250 °C at 6000 rpm in full load is assumed. The temperature of the compression ring changes linearly with the engine speed.
Model calibration:
The model calibration was based on experimental tests perform by a car manufacturer development department. These tests were carried out under full load and steady state on an engine strictly identical to the one used, see Table 1. The blowby rate was measured with an AVL 442 blowby meter. This device determines a flowrate from the measurement of a pressure difference generated by the blowby gases through a change in cross-section in the blowby gas intake duct. The results are displayed by the device in l.min−1 for a pressure of 1000 mbar and a temperature of 25 °C [45], see Table 2.
Study of the position of the compression ring under full load
Considering only the axial motion of the ring and applying the fundamental principle of dynamics, the equation is:
m d 2 h   d t 2     =   F p + F i + F f r + F o i l + F a
where m is the ring mass. The oil film pressure forces (Foil) and adhesion forces (Fa) are not significant compared to the intensity of the forces pressure forces (Fp), inertial forces (Fi), and friction forces (Ffr) [46]. The position of the ring in the piston groove (h) is therefore summarised by the variation of the forces shown in Figure 4. At low rotational speeds, i.e., between 1500 rpm and 3500 rpm, the pressure forces, Fp, are greater than the inertial forces, Fi, and therefore the compression ring remains in a low position in the piston groove throughout the cycle. From 4000 rpm, the inertial forces take advantage over the pressure forces Fp, which makes the ring move in its groove.
When the cylinder pressure is lower than the crankcase pressure, the ring may move in its groove. This is the case at 1000 rpm, since the pressure in the cylinder is lower than the atmospheric pressure when the exhaust gases are removed.
Study of the position of the sealing ring under full load
The same analysis can be made on this ring and, given the lower pressures involved, it moves axially at each cycle and whatever the rotation speed.
Simplification of the calibration
Usually, the endgap value of the sealing ring is much higher than that of the compression ring. In this case, it is twice as large (0.4 mm versus 0.2 mm). As a result, the blowby gas flow is mainly related to the position of the compression ring (Ring 1). Between 1500 rpm and 3500 rpm, the compression ring stays fixed on its base. In this speed range, the only possible path for the blowby gases is through the endgap of the compression ring. Therefore, the calibration was focused on this speed range and then extended to the entire engine speed range.
Analysis at 2000 rpm and full load
Figure 5 shows the simulation results at 2000 rpm and full load. The pressures between the rings are visible in the upper and middle graphs. The pressure above the compression ring (Land 1) is identical to the pressure in the cylinder. Its maximum is 77 bars at 400° CA.
The maximum pressure between the compression and sealing rings (Land 2) is 29 bars. The pressure between the oil seal and scraper rings (Land 3) varies between 1025 mbar and 1045 mbar, while the pressure in the crankcase was stabilised at 1025 mbar. From this data and the inertial effects due to the speed of the piston displacement, it is possible to characterise the axial evolution of the compression and sealing rings, which is visible on the lower graph of Figure 5. As expected, the compression ring stays fixed on the lower part of the groove during the whole cycle, while the sealing ring is in the upper position of its groove during the end of the exhaust gas expulsion stroke and during the whole intake stroke. Outside this range, it stays in contact with the lower part of its groove. The evolution of the blowby flowrate can be seen in Figure 6. This one becomes significant from the end of the compression stroke to the end of the expansion stroke. A maximum was reached as 40° after TDC and amounted to 1.45 g.s−1. Finally, the cumulative blowby flowrate for one cycle reached 20.26 mg.cycle−1. This result is very close to the experimental tests where the cumulative blowby flowrate for this same operating point was measured at 19.90 mg.cycle−1 (cf., Table 2). This simulation model allows us to better understand the ring dynamics and to estimate the evolution of the pressures that prevail in this ring/piston/cylinder area. Above all, thanks to the characterisation of the blowby flowrate over a complete cycle, it is possible to determine which engine strokes are preponderant in the phenomenon of oil sweeping towards the oil pan.
Simulation over the entire engine load
From this model, and by adding different engine operating points performed on the engine bench, it is possible to draw a complete map of the blowby flowrate as a function of engine speed and engine load.
The result is shown in Figure 7. It is very clear that the flowrate is higher than 18 mg.cycle−1 in a restricted area, i.e., at low speed and high load. Conversely, outside this zone, the flow rate remains below 12 mg.cycle−1.

3.2. Analysis of Oil Flow Carried by Blowby Gases

From these results and Equation (1), it is possible to determine the amount of oil swept by the blowby gases as a function of the position of the rings. To do this, it is necessary to estimate the amount of oil present in the Land 2. This quantity of oil depends on two factors: the first is the thickness of the oil film deposited by the ring, which varies by a few micrometers [47]. The second is the oil that is pumped out of the piston grooves and back into this area. This quantity of oil depends on the engine load and inertial effects, e.g., the rotation speed. As an example, Thirouard [48] measured an oil film height of up to 40 µm at 3500 rpm and half load on a single cylinder spark ignition engine and 20 µm at 2800 rpm and low load on a single cylinder diesel engine. In order to quantify the results, it is necessary to suppose an oil film height. The characteristics of the engine used are close to a diesel engine, therefore the assumption of an oil film of 20 µm will be retained. Figure 8 shows the amount of oil swept by the blowby gases at 1500 rpm for two endgap positions with an assumed oil film height of 20 µm. When the endgaps of the first two rings are opposite, i.e., at 180° (cf Figure 1a), the amount of oil swept by the blowby gases is maximum and can reach 20 µg.cycle−1.
Whereas if the endgaps are close, i.e., only 30° apart (cf., Figure 1b), the maximum amount of oil swept by the blowby gases can be at best 6 µg.cycle−1 for the same blowby flowrate. The same calculation can be made for each rotation speed, assuming an oil film height. It is therefore very clear that the oil concentration of the blowby gases is directly related to the position of the endgap and not only to its flowrate. The more oil is swept by the blowby gases, the less oil is returned to the cylinder via the backflow gases. This variable phenomenon linked to the rotation of the rings is difficult to predict and is the reason for the variations in particle emissions linked to the oxidation of the oil on strictly identical tests [49].

3.3. Influence of Blowby on Particulate Emissions at Idle

At no load, i.e., when decelerating or idling, the pressure inside the cylinder is very low. The maximum pressure varies between 4 bars and 10 bars. Therefore, the blowby flowrate is very low and the oil sweeping phenomenon described by Thirouard, et al., [26] (Equation (1)) is minimal. In Figure 9, the pressures between rings and the ring positions evolving at idle speed over a complete cycle are shown from the simulation. The upper graph represents the evolution of the pressures above the compression ring and below. The evolution of the pressures between the oil seal and oil scraper rings visible in the middle graph is approximately equal to the pressure in the oil pan, i.e., equal to 0.98 bar. Compared to the graph in Figure 5 at 2000 rpm and full load, the difference is very significant. The maximum pressure reaches 8 bars for Land 1 and 3.5 bars for Land 2. The lower graph shows the evolution of the axial position of the first two rings in relation to their respective lower grooves. During the intake stroke and most of the compression stroke, the compression ring (Ring 1) stays on the upper axial part of its groove. At the end of compression and expansion strokes, the ring stays on the lower part of its groove. Then, at the end of expansion stroke and at the beginning of the expulsion of the exhaust gases, the ring oscillates axially to come into contact with the upper part of the groove and finally returns into contact with the lower part of the groove at around 540° CA and until the end of the cycle. The sealing ring (Ring 2) evolves with the same trend as the compression ring with an additional oscillation between 680° CA and 720° CA.
From above, it appears that the blowby flowrate seen in Figure 10 is very low and reaches its maximum of 0.28 g.s−1 at 320° CA and then stabilises at around 0.18 g.s−1 during the remainder of the compression stroke and the beginning of the piston expansion. During the expulsion of the exhaust gases, the blowby flowrate is close to 0. Then, due to the low pressure inside the cylinder during the intake stroke, the flowrate is negative and stabilises at around −0.15 g.s−1. During this period, gases from the oil pan are redirected to the cylinder.
In the end, the amount of blowby gas that passes through the piston to the crankcase is zero since this accumulation is negative and amounts to −3.4 mg.cycle−1. This means that the phenomenon is reversed and that the gases from the oil pan could be directed towards the cylinder.
The oil sweeping effect is non-existent and the direction of the blowby flowrate tends to retain and push the oil stored in Lands 1 and 2 back into the cylinder. In addition, the compression and sealing rings oscillate two to three times per cycle within their respective grooves, and this creates a phenomenon of pumping and expulsion of the oil from the scraper ring to the crown of the piston via the sealing and compression rings. This phenomenon, described in particular by Thirouard [48] and Yilmaz, et al., [50] is significant at idle or low load.
Previous simulation results have shown that idling is conducive to an accumulation of oil at the piston crown. During rapid acceleration, the sudden increase in pressure and temperature in the cylinder will cause some of this oil to burn off, while some will be returned to the crankcase via the blowby phenomenon. The duration of the idling time between accelerations could have an impact on the amount of oil stored in the piston crown and consequently on oil consumption and particulate emissions. It is therefore important to study the impact of the duration of the idle time between two accelerations in order to check whether this accumulation phenomenon revealed by our simulation model is real. This is the subject of the following section.

4. Influence of Idling Time between Two Accelerations on Particulate Emissions

4.1. Setup

The tests were carried out on the engine mounted on a Horiba bench described in Section 2.1. With this bench, it was possible to create some transients. In order to be close to the real conditions of the “stop and start” system, an acceleration from idle to 2000 rpm and 60 Nm in 5 s was selected. To reach this point, it was necessary to keep the accelerator pedal pressed at 100% for about 2 s (part a, on the lower graph in Figure 11). Then, the engine stayed at 2000 rpm and 60 Nm during 15 s (part b) before slowing down (part c) and coming back in idle position (part d).
Three configurations were tested. For case 1, there was no idling time between two accelerations. The engine slowed down to 750 rpm before accelerating for a new transient. Case 2 consisted of an idling time of 7 s between two accelerations, while case 3 consisted of an idling time of 22 s. The test conditions are presented in the Table 3 below.
Figure 12 shows the evolution of engine speed, effective dynamic torque, in-cylinder pressure, and intake manifold pressure, depending on the position of the accelerator pedal during this transient.
The signal “accelerator position” represents practically the position of the engine throttle, which means that it is in the fully open position for about 2 s before reaching the requested point. In Figure 12 bottom right, the dynamic effective torque during this transient is presented. The significant variations at the start are consequences of the important variations of the in-cylinder pressures between the cylinders. For example, for one cylinder, the in-cylinder pressure may be 25 bars while it may still be 6 bars for another cylinder (which is the idle in-cylinder pressure). This difference will generate a significant variation of the engine torque.
Berthome, et al., [13] exposed that particulate emissions vary greatly from test to test despite mastering both engine and bench parameters. It is, therefore, necessary to accumulate data and to proceed with a statistician approach to get a trend out, and thus evaluate the impact of the idling time between two transients. To obtain as much data as possible, 100 accelerations (strictly identical from the point of view of the control and test conditions) are carried out successively after reaching thermal stability and respecting a time of idling between each test for each configuration. The demonstration of the similarity of these transients is not the subject of this article and has already been validated in a previous article by Berthome, et al., [13,20].

4.2. Particles Measuring Device

The particle measurement device used in this study was a “Pegasor Particles Sensor” called a PPS, see Figure 2. The sample was not diluted, and this device measured the current carried out by the particles. For that, the PPS uses the corona effect to ionize particles: a corona discharge occurs when an electric current carried by a high voltage passes through two electrodes separated by a neutral gas (air).
This electric arc creates positive ions that propagate towards the molecules of air. This is called the ionization phenomenon. Then the ionized air mixes with the exhaust gases containing particles. These particles absorb the positive ions. The mixture is thus composed of free ions and ionized particles. An electric trap captures the free ions by maintaining a positive voltage on its surface. This has the effect of pushing the positive ions towards the external surface of the trap in order to discharge them. If the trapping voltage increases, then the lighter ionized particles are absorbed by the trap. It is possible to choose a sample of particles according to their size thanks to the choice of the trapping voltage. It can vary from 0 V to 1000 V according to the manufacturer data [51]. A trapping voltage of 400 V was used to measure particles with a size above or equal to 23 nm. This trapping voltage was selected because it corresponds to the minimum size required by the regulatory standards [1]. This technology is very reactive because it performs measurements at the frequency of 100 Hz. However, it is necessary to make the assumption of mean diameter, standard deviation, and fractal dimension in order to determine the number and the mass flow rate of the particles [52,53]. As particle emissions are higher during the transient phases, this study is performed in such an operating mode. However, it is not possible to know precisely the mean diameter of the particles, since it varies depending on the engine load and rotation speed.
Therefore, in this article, a simple comparison of the current measured by the PPS was made, because it is proportional to the particles emitted by the engine. This solution was chosen because the acquisition frequency of the PPS is high and allows the measurement of particle emissions during transients. Since a comparison will be made between the three cases, a relative measurement is sufficient.

4.3. Test Results and Analysis

Figure 13 shows the evolution of the average current carried by the particles of 100 strictly identical transients and for each case. The blue dash dotted-line curve represents the position of the accelerator pedal. At idle, the level of particulate emissions generated by the engine is very low and amounts to about 1 pA. Then, during acceleration, the current level rises sharply. In fact, to obtain rapid acceleration, it is necessary to increase the equivalence ratio to counteract friction and especially inertial effects. These rapid variations of equivalence ratio generate many particles reaching a maximum around 2.2 s. Then, from 2.5 s, the acceleration slows down, which favours stoichiometric conditions and therefore generates fewer particles, and the current measured by the PPS decreases. Cases one and two have almost the same trends. The current peak reached 112 pA for case 1 and 149 pA for case 2. However, case 3 is more important, and the current peak reached around 415 pA.
The sum of current averaged for 100 transients ( Integ I ¯ )   for the three cases are shown below, in Table 4. The percentage standard deviation (σ) is calculated from the standard deviation of Integ I ¯ of 100 transients divided by the mean. For case 1, i.e., without an idling phase, but only a deceleration phase between two transients (see part c Figure 11), the sum of the current averaged per 100 transients is 105 pA. For case 2, with an idling phase of 7 s between two transients, the sum of the current averaged per 100 transients is 133 pA, an increase of about 126% compared to case 1. For case 3, with an idling phase of 22 s between two transients, the sum of the current averaged per 100 transients is 329 pA, an increase of about 313% compared to case 1. The deviations between the three cases are very large even though the transients are strictly identical (cf part 4-2). Since it is always the same transients, the deviations in richness between each test remain very small and are not the cause of these differences. The only fluctuating phenomenon is the idling time between each acceleration. Consequently, it is the absence of oil sweeping by the blowby gases and its duration that leads to an accumulation of oil towards the crown of the piston. This oil is then projected towards the cylinder and is oxidised during strong acceleration, causing a peak in particle emissions. Therefore, the oil accumulation on the piston crown is proportional to the idling time between two accelerations. These experimental tests confirm the results put forward by the blowby simulation model.

5. Conclusions

The creation of a blowby simulation model based on a TGDI engine made it possible to characterise the quantity of oil swept by these gases. This was performed at different engine operating points and as a function of the endgap position of both the compression and the sealing rings. Under full load at 2000 rpm, the quantity of oil swept can be as high as 20 µg. cycle−1. At idle speed, the sweeping intensity is close to zero and there is a phenomenon of oil storage on the piston crown. The experimental results confirmed this observation and showed that the quantity of oil stored on the piston crown depended on the idling time. For example, the evolution of the idling time from 7 s to 22 s between two strictly identical accelerations generated three times more particles. The new Euro 7 standard should limit particulate emissions to 3 mg.km−1 and 6 × 10¹¹ particles.km−1 on a WLTP cycle for particles >10 nm, instead of 23 nm previously. As there are eight idling stages with a total duration of approximately 224 s in a WLTP cycle, this phenomenon must be taken into account. At present, it is not possible to differentiate the oil pumping mechanism by the piston rings from the oil sweeping mechanism by the blowby gases at idle. A future study on a single-cylinder spark ignition engine will characterise the impact of each mechanism.

Author Contributions

Conceptualization, V.B. and D.C.; formal analysis, V.B.; investigation, V.B.; methodology, V.B.; project administration, V.B., D.C. and J.-F.H.; resources, D.C. and J.-F.H.; software, V.B.; supervision, V.B., D.C. and J.-F.H.; validation, V.B., D.C. and J.-F.H.; visualization, V.B., D.C. and J.-F.H.; writing—original draft, V.B.; writing—review and editing, V.B., D.C. and J.-F.H. All authors have read and agreed to the published version of the manuscript.

Funding

This research received no external funding.

Data Availability Statement

Not applicable.

Conflicts of Interest

The authors declare no conflict of interest.

Nomenclature

mKgRing mass
hmVariation of axial ring position in the groove
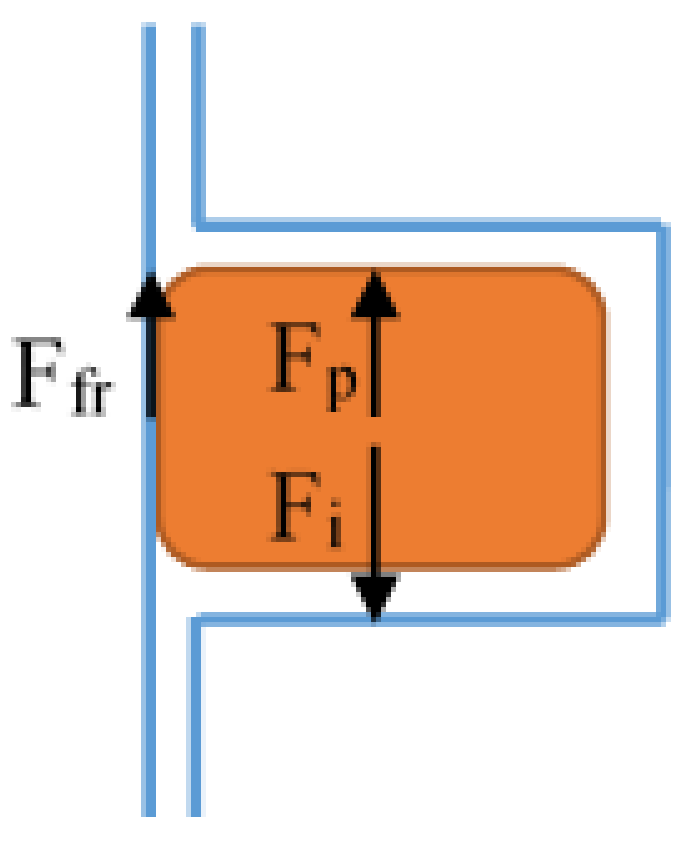
FpNPressure forces
FiNInertial forces
FfrNFriction forces
FoilNOil film pressure forces
FaNAdhesion forces
Q b l o w b y m3.cycle−1Blowby flow
μ a i r Pa.sDynamic viscosity of air
μ o i l Pa.sDynamic viscosity of oil
θ r i n g s °Angle formed between the endgap of the first two rings
R l a n d mClearance between piston radius and cylinder radius
hairmClearance between piston and cylinder
K 1   and K 2   -Constants mainly related to the engine speed
WLTP-Worldwide Harmonized Light Vehicle Test Procedure
PAH-Polycyclic Aromatic Hydrocarbon
TGDI-Turbocharged Gasoline Direct Injection
PPS-Pegasor Particles Sensor
TDC-Top Dead Center
BDC-Bottom Dead Center
ICE-Internal Combustion Engine
Land 1-Space between the piston top and the first ring
Land 2-Space between the first two rings
Land 3-Space between the second and third ring
Integ I   ¯ pA 1 n 1 n I d I , avec n = test number
σ -Standard deviation

References

  1. Commission Européenne. Règlement (UE) n°459/2012. J. Off. Union Eur. 2012, 2012, 16–24. [Google Scholar]
  2. Barbussse, S.; Plassat, G. Les Particules de Combustion Automobile et Leurs Dispositifs D’élimination. 2005. Available online: http://scholar.google.com/scholar?hl=en&btnG=Search&q=intitle:Les+particules+de+combustion+automobile+et+leurs+dispositifs+d??limination#0 (accessed on 5 October 2021).
  3. Marchal, C. Modélisation de la Formation et de L’oxydation des Suies Dans un Moteur Automobile. Ph.D. Thesis, Université d’Orléans, Orléans, France, 2008. [Google Scholar]
  4. Law, M.E.; Westmoreland, P.; Cool, T.A.; Wang, J.; Hansen, N.; Taatjes, C.; Kasper, T. Benzene precursors and formation routes in a stoichiometric cyclohexane flame. Proc. Combust. Inst. 2007, 31, 565–573. [Google Scholar] [CrossRef]
  5. Ketterer, J.E. Soot Formation in Direct Injection Spark Ignition Engines Under Cold-Idle Operating Conditions. Ph.D. Thesis, Massachusetts Institute of Technology, Cambridge, MA, USA, 2013. [Google Scholar]
  6. Krestinin, A. Detailed modeling of soot formation in hydrocarbon pyrolysis. Combust. Flame 2000, 121, 513–524. [Google Scholar] [CrossRef]
  7. Bockhorn, H. Detailed Mechanism and Modeling of Soot Particle Formation. In Soot Formation in Combustion; Springer: Berlin/Heidelberg, Germany, 1994. [Google Scholar]
  8. Kittelson, D.B. Engines and nanoparticles: A review. J. Aerosol Sci. 1998, 29, 575–588. [Google Scholar] [CrossRef]
  9. Cheng, W.K.; Hamrin, D.; Heywood, J.B.; Hochgreb, S.; Min, K.; Norris, M. An Overview of Hydrocarbon Emissions Mechanisms in Spark-Ignition Engines; Technical Papers; SAE International: Warrendale, PA, USA, 1993. [Google Scholar] [CrossRef]
  10. Thawko, A.; Yadav, H.; Eyal, A.; Shapiro, M.; Tartakovsky, L. Particle emissions of direct injection internal combustion engine fed with a hydrogen-rich reformate. Int. J. Hydrog. Energy 2019, 44, 28342–28356. [Google Scholar] [CrossRef]
  11. Swanson, J.; Ragatz, A.; Watts, W.; Kittelson, D.; Winsor, R. Nanoparticle measurements used to detect an engine oil control ring failure. Proc. Inst. Mech. Eng. Part D J. Automob. Eng. 2009, 223, 1071–1076. [Google Scholar] [CrossRef]
  12. Berthome, V. Etude des Émissions de Particules d’un Moteur à Combustion Interne de Type Allumage Commandé. Ph.D. Thesis, Ecole Centrale de Nantes, Nantes, France, 2021. [Google Scholar]
  13. Berthome, V.; Chalet, D.; Hetet, J.-F. Characterization of Particle Emissions of Turbocharged Direct Injection Gasoline Engine in Transients and Hot Start Conditions. J. Therm. Sci. 2021, 30, 2056–2070. [Google Scholar] [CrossRef]
  14. Amirante, R.; Distaso, E.; Tamburrano, P.; Reitz, R.D. Measured and Predicted Soot Particle Emissions from Natural Gas Engines; Technical Papers; SAE International: Warrendale, PA, USA, 2015; Volume 2015. [Google Scholar] [CrossRef]
  15. Delvigne, T. Oil Consumption Sources in a Modern Gasoline Engine Including Contribution of Blow-by Separator and Turbocharger: An Experimental Study Based on the Use of Radiotracers. SAE Int. J. Fuels Lubr. 2010, 3, 916–924. [Google Scholar] [CrossRef]
  16. Manni, M.; Carriero, M.; Roselli, A. A Study of Oil Consumption on a Diesel Engine with Independently Lubricated Turbocharger; Technical Papers; SAE International: Warrendale, PA, USA, 2002. [Google Scholar] [CrossRef]
  17. Yilmaz, E. Sources and Characteristics of Oil Consumption in a Spark-Ignition Engine. Ph.D. Thesis, Massachusetts Instititute of Technologie, Cambridge, MA, USA, 2003. [Google Scholar]
  18. Gohl, M.; Friedmann, M.; Holzmüller, J.; Wulff, R.; Braun, M. Impact of Lubricating Oil on Particle Emissions. In Proceedings of the SIA Powertrain & Power Electronics Congress, Port-Marly, France, 9–10 June 2021; pp. 47–54. [Google Scholar]
  19. Yilmaz, E.; Tian, T.; Wong, V.W.; Heywood, J.B. The Contribution of Different Oil Consumption Sources to Total Oil Consumption in a Spark Ignition Engine; Technical Papers; SAE International: Warrendale, PA, USA, 2004. [Google Scholar] [CrossRef]
  20. Berthome, V.; Chalet, D.; Hetet, J.-F. Impact of Blow-By Gas and Endgap Ring Position on the Variations of Particle Emissions in Gasoline Engines. Energies 2021, 14, 7492. [Google Scholar] [CrossRef]
  21. Premnath, M.S.V.; Khalek, I.; Michlberger, A. Effect of Lubricant Oil on Particle Emissions from a Gasoline Direct Injection Light-Duty Vehicle; Technical Papers; SAE International: Warrendale, PA, USA, 2018; pp. 1–11. [Google Scholar] [CrossRef]
  22. Amirante, R.; Distaso, E.; Napolitano, M.; Tamburrano, P.; Di Iorio, S.; Sementa, P.; Vaglieco, B.M.; Reitz, R.D. Effects of lubricant oil on particulate emissions from port-fuel and direct-injection spark-ignition engines. Int. J. Engine Res. 2017, 18, 606–620. [Google Scholar] [CrossRef]
  23. Jues, T. Modélisation et Simulation des gaz de Blow-by dans un Décanteur Automobile. Ph.D Thesis, L’Ecole Nationale Supérieure d’Arts et Métiers, Paris, France, 2010. [Google Scholar]
  24. Min, B.-S.; Kim, J.-S.; Oh, D.-Y.; Choi, J.-K.; Jin, J.-H. Dynamic Characteristics of Oil Consumption- Relationship Between the Instantaneous Oil Consumption and the Location of Piston Ring Gap; Technical Papers; SAE International: Warrendale, PA, USA, 1998. [Google Scholar] [CrossRef]
  25. Gohl, M.; Matz, G.; Preuss, A.-C.; Pischinger, S.; Günther, M.; Ebert, T. Investigation of Oil Sources in the Combustion Chamber of Direct Injection Gasoline Engines; Technical Papers; SAE International: Warrendale, PA, USA, 2018; Volume 2018, pp. 1–11. [Google Scholar] [CrossRef]
  26. Thirouard, B.; Hart, D.P. Investigation of Oil Transport Mechanisms on the Piston Second Land of a Single Cylinder Diesel Engine, Using Two-Dimensional-Laser-Induzed Fluorescence; Technical Papers; SAE International: Warrendale, PA, USA, 1998. [Google Scholar] [CrossRef]
  27. Delprete, C.; Selmani, E.; Bisha, A. Gas escape to crankcase: Impact of system parameters on sealing behavior of a piston cylinder ring pack. Int. J. Energy Environ. Eng. 2019, 10, 207–220. [Google Scholar] [CrossRef] [Green Version]
  28. Thirouard, B.; Tian, T. Oil Transport in the Piston Ring Pack (Part II): Zone Analysis and Macro Oil Transport Model Benoist; Technical Papers; SAE International: Warrendale, PA, USA, 2003. [Google Scholar] [CrossRef]
  29. Nakashima, K.; Ishihara, S.; Urano, K. Influence of Piston Ring Gaps on Lubricating Oil Flow into the Combustion Chamber; Technical Papers; SAE International: Warrendale, PA, USA, 1995. [Google Scholar] [CrossRef]
  30. Agarwal, V.K.; Ajay Paul, J. Optimization of Piston and Ringpack Design to Improve the Performance and Emission Characteristics of a Gasoline Engine; Technical Papers; SAE International: Warrendale, PA, USA, 2013; Volume 12. [Google Scholar] [CrossRef]
  31. Tian, T. Dynamic behaviours of piston rings and their practical impact. Part 2: Oil transport, friction and wear of ring/liner interface and the effects of piston and ring dynamics. Proc. Inst. Mech. Eng. Part J J. Eng. Tribol. 2002, 216, 209–228. [Google Scholar] [CrossRef]
  32. Iijima, N.; Miyamoto, T.; Takiguchi, M.; Kai, R.; Sato, M. An Experimental Study on Phenomena of Piston Ring Collapse; Technical Papers; SAE International: Warrendale, PA, USA, 2002. [Google Scholar] [CrossRef]
  33. Tian, T. Dynamic behaviours of piston rings and their practical impact. Part 1: Ring flutter and ring collapse and their effects on gas flow and oil transport. Proc. Inst. Mech. Eng. Part J J. Eng. Tribol. 2002, 216, 209–228. [Google Scholar] [CrossRef]
  34. Cheng, C.; Schock, H.; Richardson, D. The Dynamics of Second Ring Flutter and Collapse in Modern Diesel Engines. J. Eng. Gas Turbines Power 2015, 137, 111504. [Google Scholar] [CrossRef]
  35. Rabute, R.; Tian, T. Challenges Involved in Piston Top Ring Designs for Modern SI Engines. J. Eng. Gas Turbines Power 2001, 123, 448–459. [Google Scholar] [CrossRef]
  36. Wróblewski, P.; Koszalka, G. An Experimental Study on Frictional Losses of Coated Piston Rings with Symmetric and Asymmetric Geometry. SAE Int. J. Engines 2021, 14, 6. [Google Scholar] [CrossRef]
  37. Wróblewski, P.; Iskra, A. Problems of Reducing Friction Losses of a Piston-Ring-Cylinder Configuration in a Combustion Piston Engine with an Increased Isochoric Pressure Gain; Technical Papers; SAE International: Warrendale, PA, USA, 2020. [Google Scholar] [CrossRef]
  38. Zarenbin, V.; Kolesnikova, T.; Sakno, O.; Ollo, V.; Klimenko, V. Impact Evaluation of Piston Rings Mobility on a Gas Passage in an Internal Combustion Engine (ICE). Sci. J. Sil. Univ. Technol. Ser. Transp. 2019, 104, 187–201. [Google Scholar] [CrossRef]
  39. Turnbull, R.; Dolatabadi, N.; Rahmani, R.; Rahnejat, H. An assessment of gas power leakage and frictional losses from the top compression ring of internal combustion engines. Tribol. Int. 2020, 142, 105991. [Google Scholar] [CrossRef]
  40. Schneider, E.W.; Blossfeld, D.H. Method for Measurement of Piston Ring Rotation in an Operating Engine; Technical Papers; SAE International: Warrendale, PA, USA, 1990. [Google Scholar] [CrossRef]
  41. Uhlig, B.P.; Kirner, C.; Preuss, A.-C.; Wachtmeister, G. Real-Time Measurement of the Piston Ring Gap Positions and Their Effect on Exhaust Engine Oil Emission; Technical Papers; SAE International: Warrendale, PA, USA, 2018; pp. 1–8. [Google Scholar] [CrossRef]
  42. Thiel, N.; Weimar, H.-J.; Kamp, H.; Windisch, H. Advanced Piston Cooling Efficiency: A Comparison of Different New Gallery Cooling Concepts; Technical Papers; SAE International: Warrendale, PA, USA, 2007; Volume 2007, pp. 776–790. [Google Scholar] [CrossRef]
  43. Abril, S.; García, C.; León, J. Numerical and Experimental Analysis of the Potential Fuel Savings and Reduction in CO Emissions by Implementing Cylinder Bore Coating Materials Applied to Diesel Engines. Lubricants 2021, 9, 19. [Google Scholar] [CrossRef]
  44. Husberg, T.; Gjirja, S.; Denbratt, I.; Omrane, A.; Aldén, M.; Engström, J. Piston Temperature Measurement by Use of Thermographic Phosphors and Thermocouples in a Heavy-Duty Diesel Engine Run Under Partly Premixed Conditions; Technical Papers; SAE International: Warrendale, PA, USA, 2005. [Google Scholar] [CrossRef]
  45. AVL GmbH. AVL 442, Operating and Service Manual Calibration and Procedure, AT0203E-07, November 1996, AVL List GmbH A8020 Gra-Austria. Available online: https://www.avl.com/documents/10138/2699442/AVL+Blow+By+Meter+Product+Description (accessed on 22 October 2022).
  46. Koszalka, G.; Guzik, M. Mathematical Model of Piston Ring Sealing in Combustion Engine. Pol. Marit. Res. 2014, 21, 66–78. [Google Scholar] [CrossRef] [Green Version]
  47. Takiguchi, M.; Nakayama, K.; Furuhama, S.; Yoshida, H. Variation of Piston Ring Oil Film Thickness in an Internal Combustion Engine–Comparison Between Thrust and Anti-Thrust Sides; Technical Papers; SAE International: Warrendale, PA, USA, 1998. [Google Scholar] [CrossRef]
  48. Thirouard, B. Characterization and Modeling of the Fundamental Aspects of Oil Transport in the Piston Ring Pack of Internal Combustion Engines. Ph.D. Thesis, Massachusetts Instititute of Technologie, Cambridge, MA, USA, 2001. [Google Scholar]
  49. Tomizawa, K.; Ito, A. Development of a New Method to Measure the Rotational Force Acting on the Piston Rings of a Gasoline Engine; Technical Papers; SAE International: Warrendale, PA, USA, 2019; pp. 1–5. [Google Scholar] [CrossRef]
  50. Yilmaz, E.; Thirouard, B.; Tian, T.; Wong, V.W.; Heywood, J.B.; Lee, N. Analysis of Oil Consumption Behavior during Ramp Transients in a Production Spark Ignition Engine; Technical Papers; SAE International: Warrendale, PA, USA, 2001. [Google Scholar] [CrossRef]
  51. Pegasor. User Manual; Pegasor Ltd.: Tampere, Finland, 2014; Volume 3. [Google Scholar]
  52. Amanatidis, S.; Maricq, M.M.; Ntziachristos, L.; Samaras, Z. Measuring number, mass, and size of exhaust particles with diffusion chargers: The dual Pegasor Particle Sensor. J. Aerosol Sci. 2016, 92, 1–15. [Google Scholar] [CrossRef]
  53. Ntziachristos, L.; Amanatidis, S.; Samaras, Z.; Janka, K.; Tikkanen, J. Application of the Pegasor Particle Sensor for the Measurement of Mass and Particle Number Emissions. SAE Int. J. Fuels Lubr. 2013, 6, 521–531. [Google Scholar] [CrossRef]
Figure 1. Oil removed by the blowby gas vs. endgap position of rings.
Energies 15 08772 g001
Figure 2. Experimental setup.
Energies 15 08772 g002
Figure 3. Simulation model development with GT-suite.
Energies 15 08772 g003
Figure 4. Set of Forces supported by the ring.
Energies 15 08772 g004
Figure 5. Evolution of the pressures and axial positions of the piston rings at 2000 rpm and full load.
Energies 15 08772 g005
Figure 6. Evolution of blowby flowrate at 2000 rpm and full load.
Energies 15 08772 g006
Figure 7. Blowby flowrate as a function of engine speed and load.
Energies 15 08772 g007
Figure 8. Quantity of oil swept by the blowby gases as a function of the endgap position at 1500 rpm.
Energies 15 08772 g008
Figure 9. Evolution of pressures and axial positions of the piston rings at idle.
Energies 15 08772 g009
Figure 10. Evolution of blowby flowrate at idle.
Energies 15 08772 g010
Figure 11. Cases description.
Energies 15 08772 g011
Figure 12. Evolution of engine parameters during a transient.
Energies 15 08772 g012
Figure 13. Evolution of particle emissions during the transient for each case.
Energies 15 08772 g013
Table 1. Engine main features.
Engine Main FeaturesMain Parameters of Piston Rings
Engine4-stroke, TGDI, 3-cylinderPiston diameter74.45 mm
Bore × Stroke75 mm × 90.48 mmRing 1 axial height1.2 mm
Displacement1199.9 cm3Ring 2 axial height1 mm
Valves12Ring 3 axial height2 mm
Compression ratio10.5: 1Ring 1 end gap0.2 mm
Maximum Power96 kW @ 5500 rpmRing 2 end gap0.4 mm
Maximum Torque230 Nm @ 1750 rpmRing 3 end gap0.2 mm
Table 2. Blowby flow measurement for the engine at full load.
Engine speed (rpm)10001500200025003000350040004500500055006000
Qv (l.min−1)3152515251494949514947
Qm (mg.cycle−1)24.126.919.916.213.210.99.518.467.926.926.08
Table 3. Test conditions.
Pressure (mbars)Averaged Temperature (°C)
AtmosphericSample line
PPS
IntakeCoolingOilEngine benchExhaustSample line
PPS
1013153826939617356170
Table 4. Results.
Table 4. Results.
Case NumberIdling Time
(s)
I n t e g I ¯
( pA )
σ
(%)
1010513
2713315
32232916
Publisher’s Note: MDPI stays neutral with regard to jurisdictional claims in published maps and institutional affiliations.

