
Determination of Curie Point Depth Distribution and Heat Flow Regime Characteristics in Eratosthenes Seamount, Eastern Mediterranean Sea


Abstract
:1. Introduction
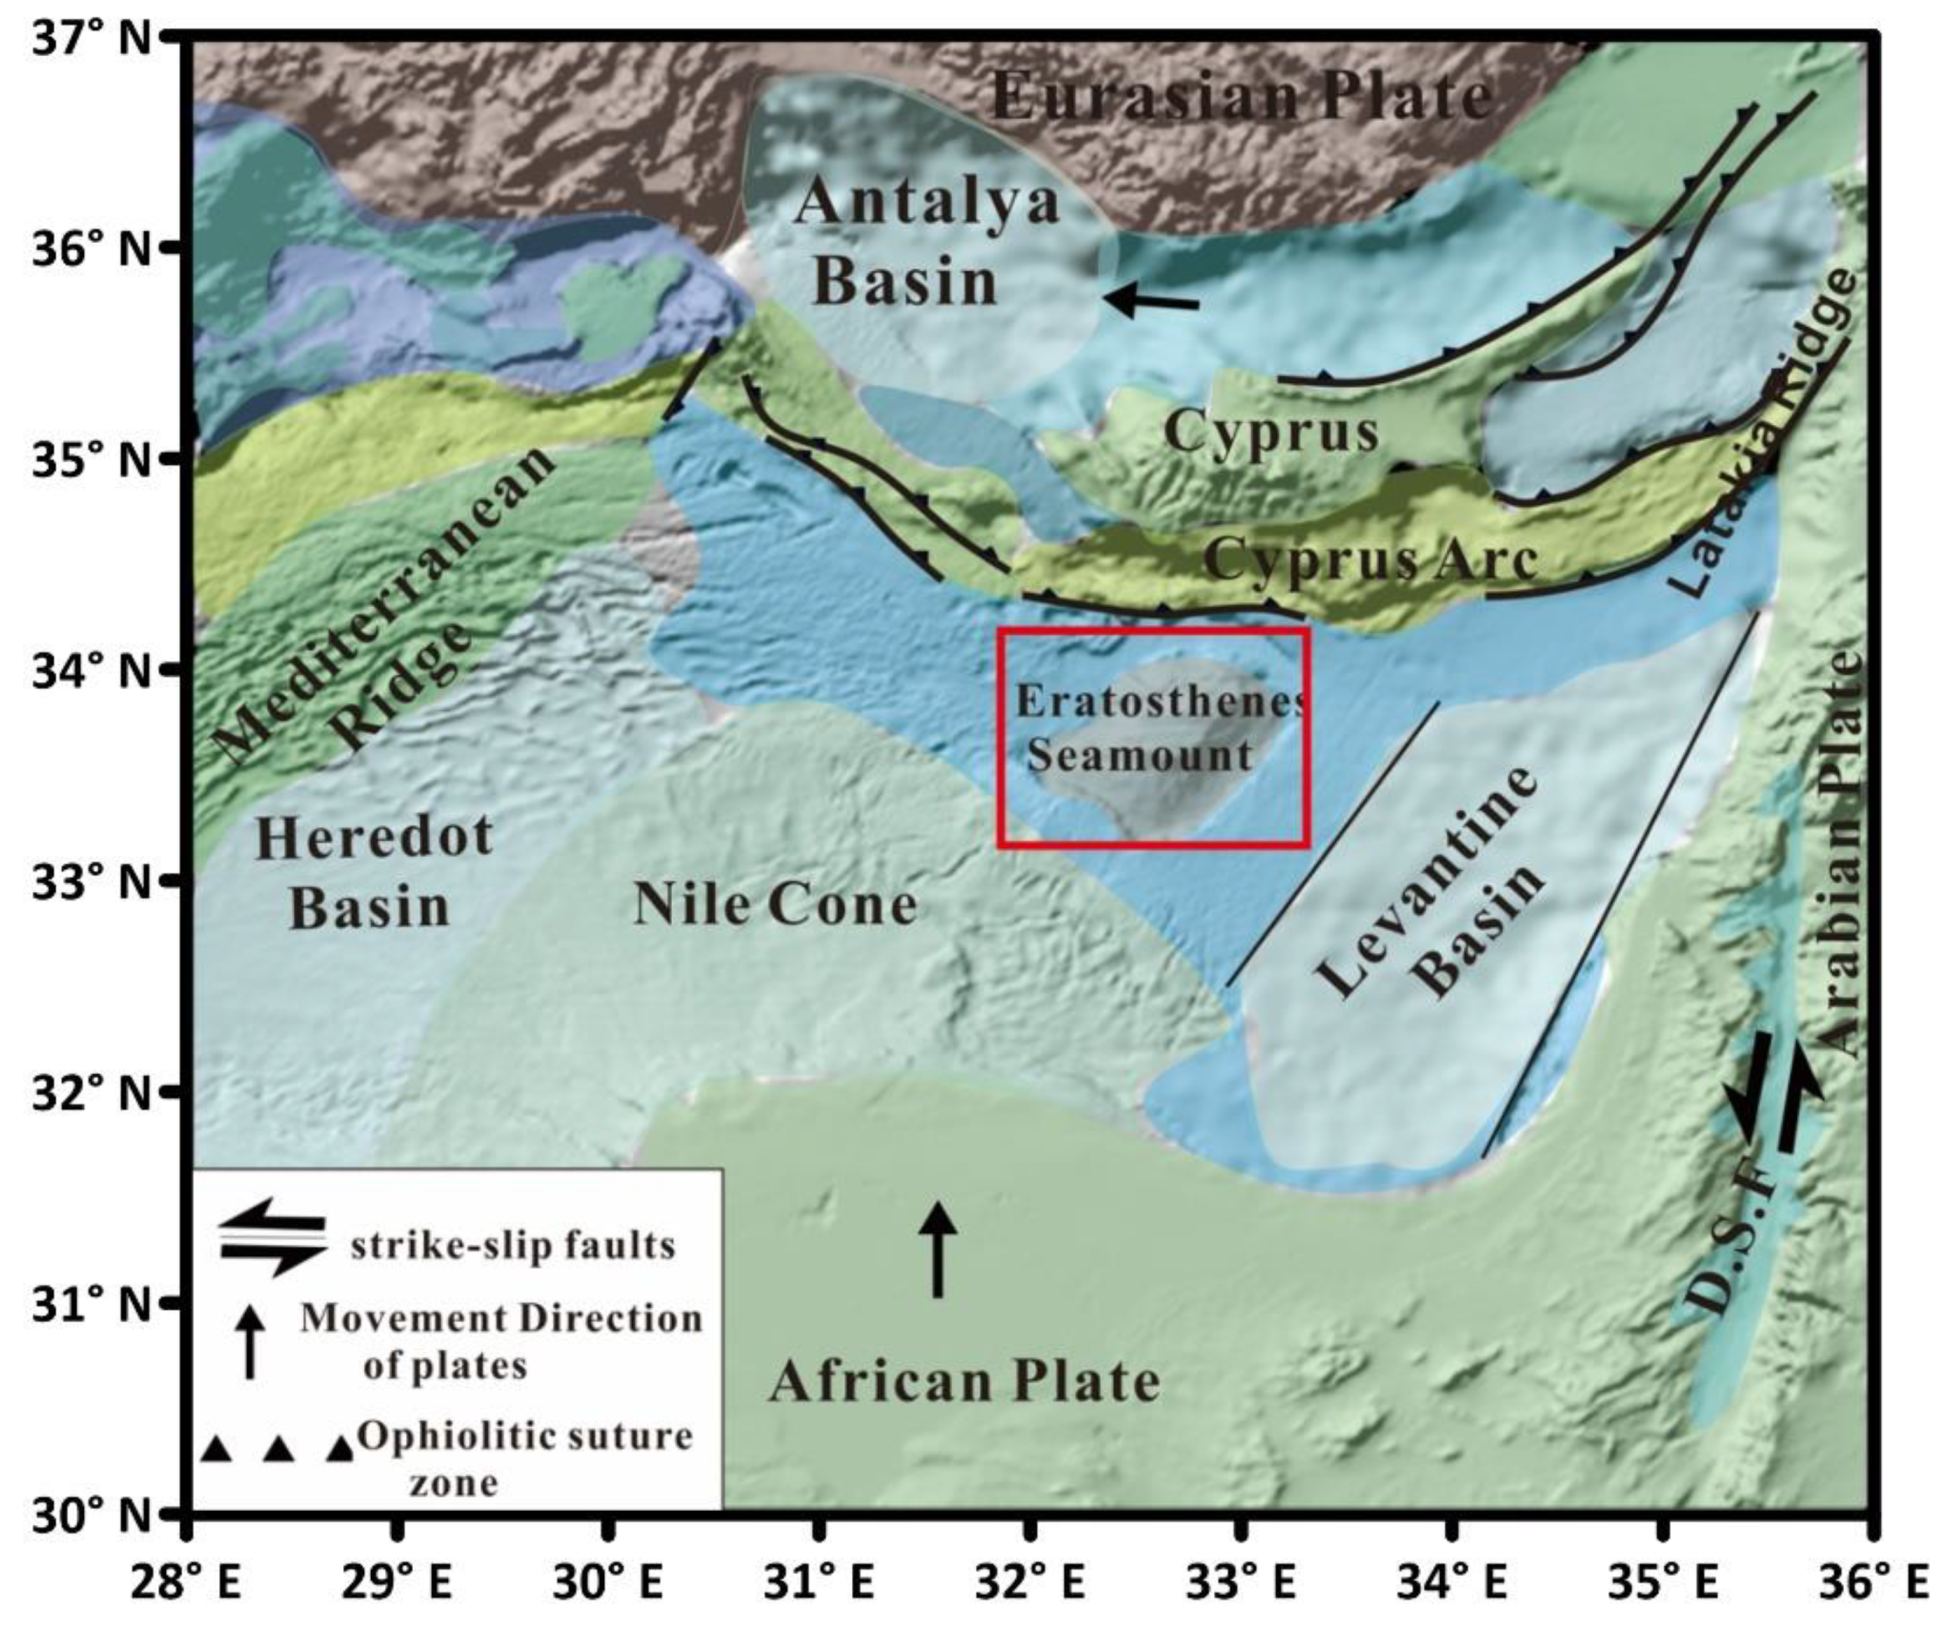
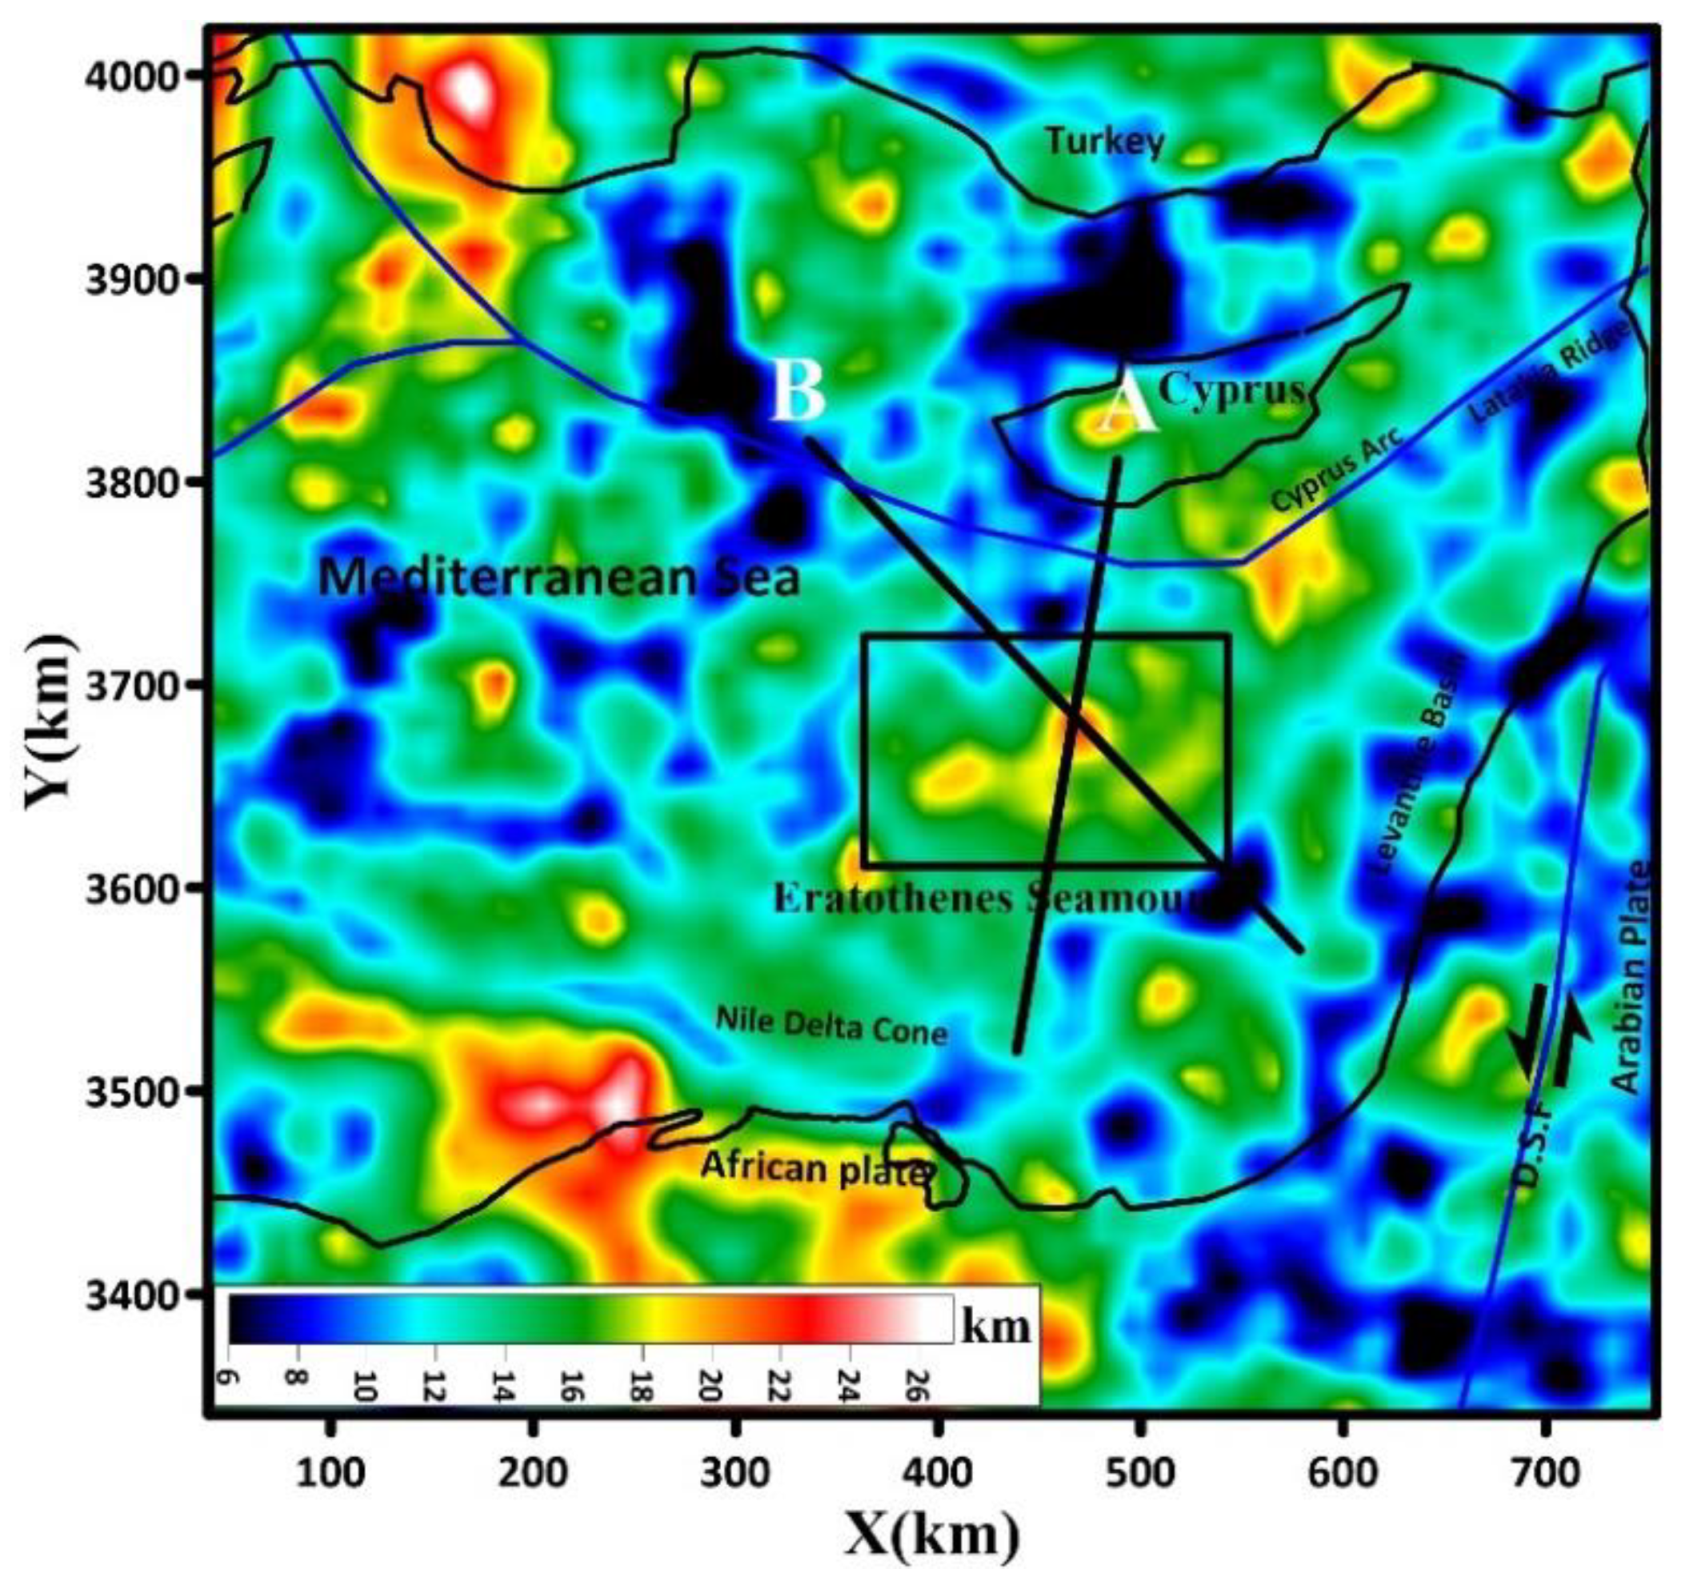
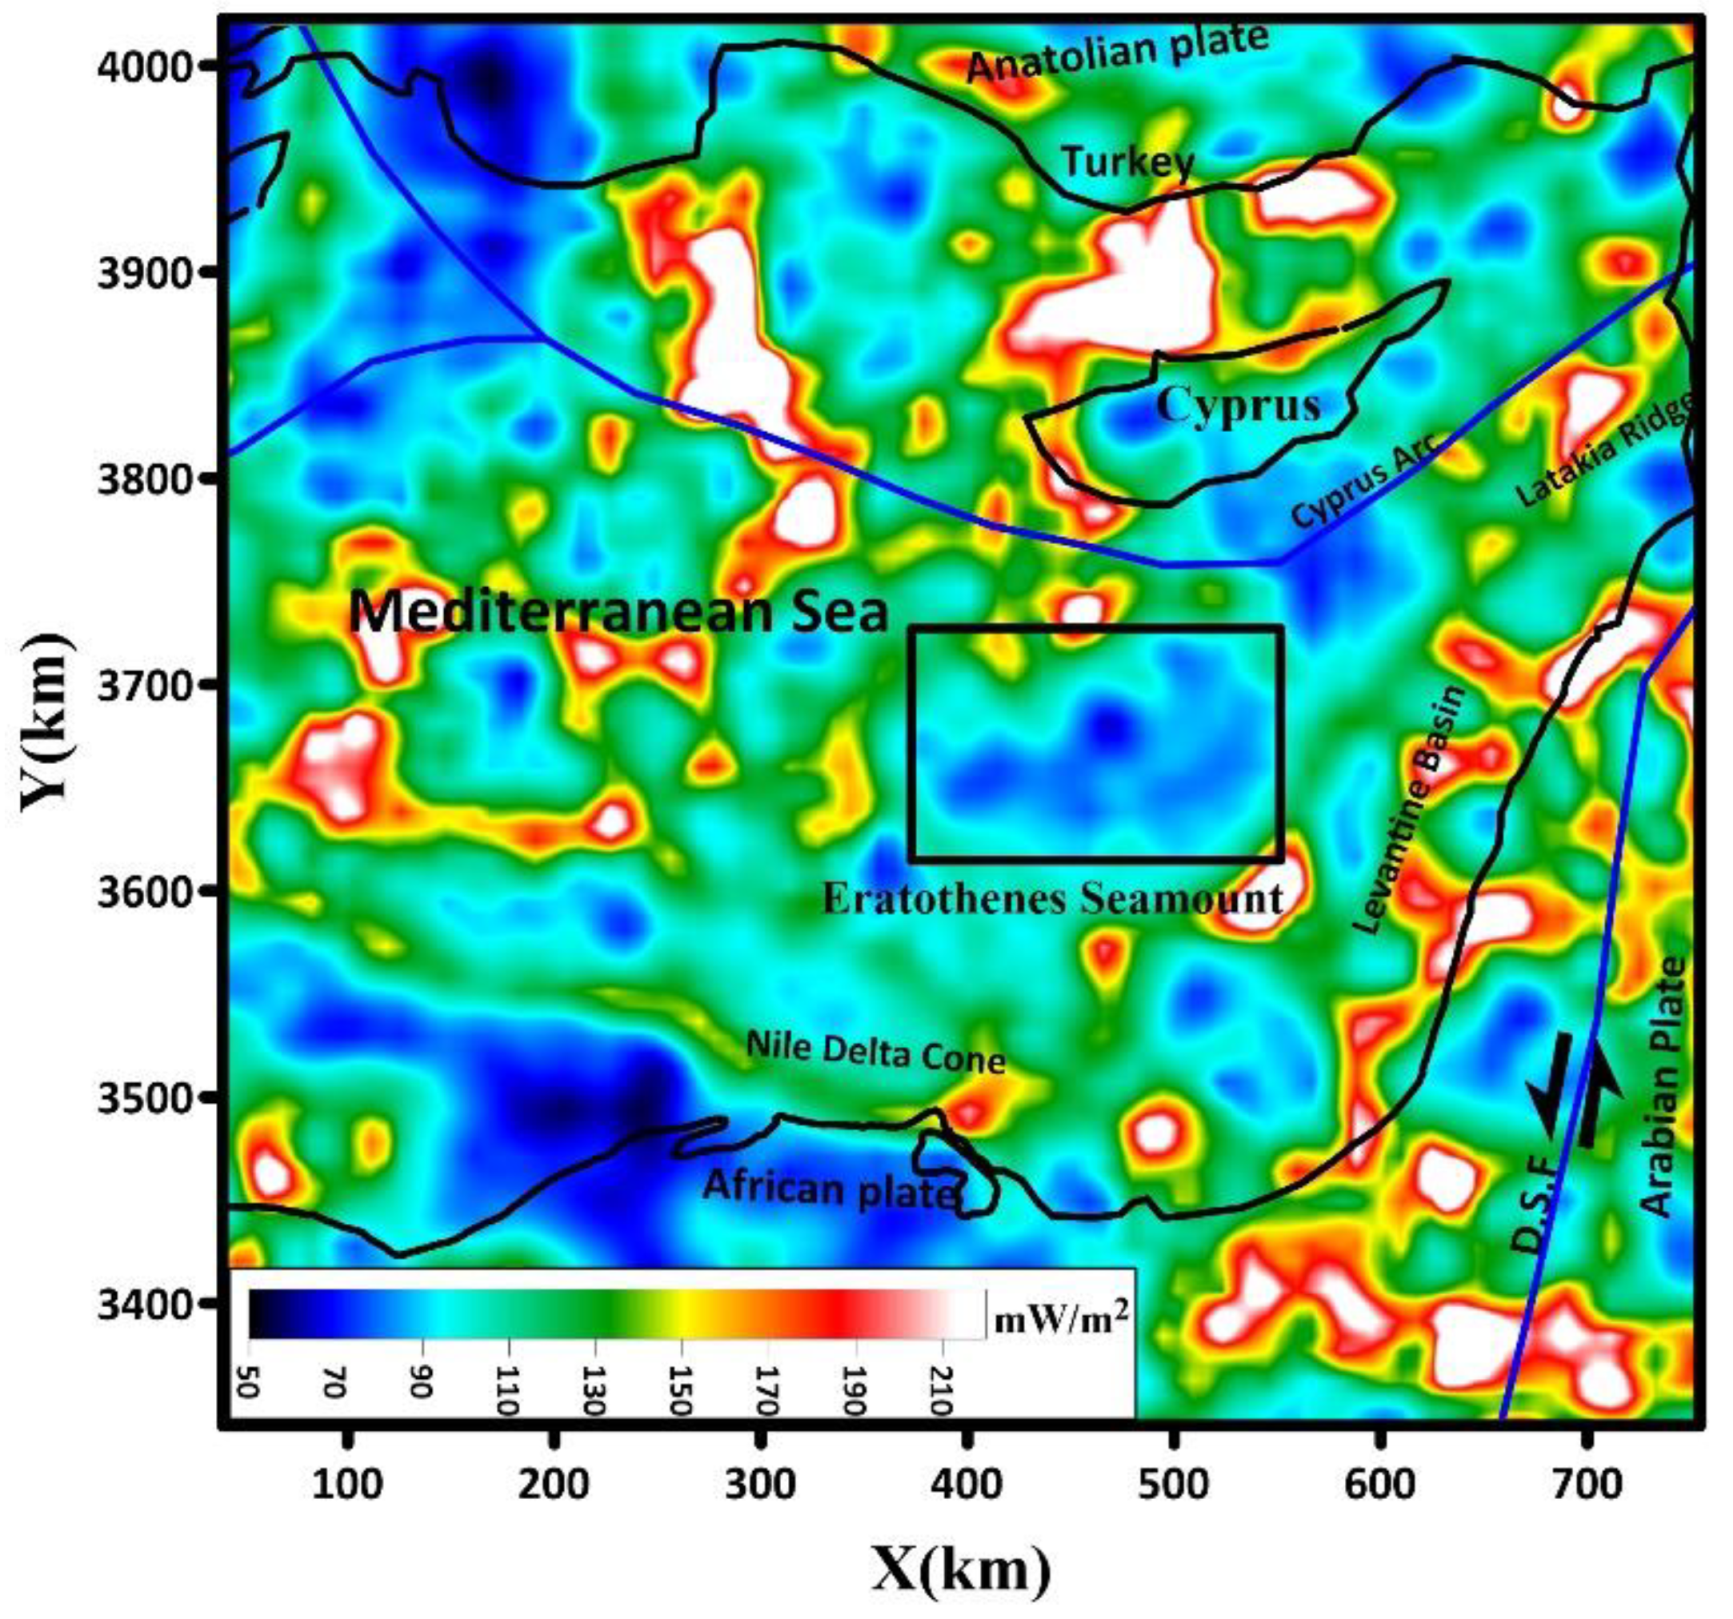
2. Geological and Tectonic Setting
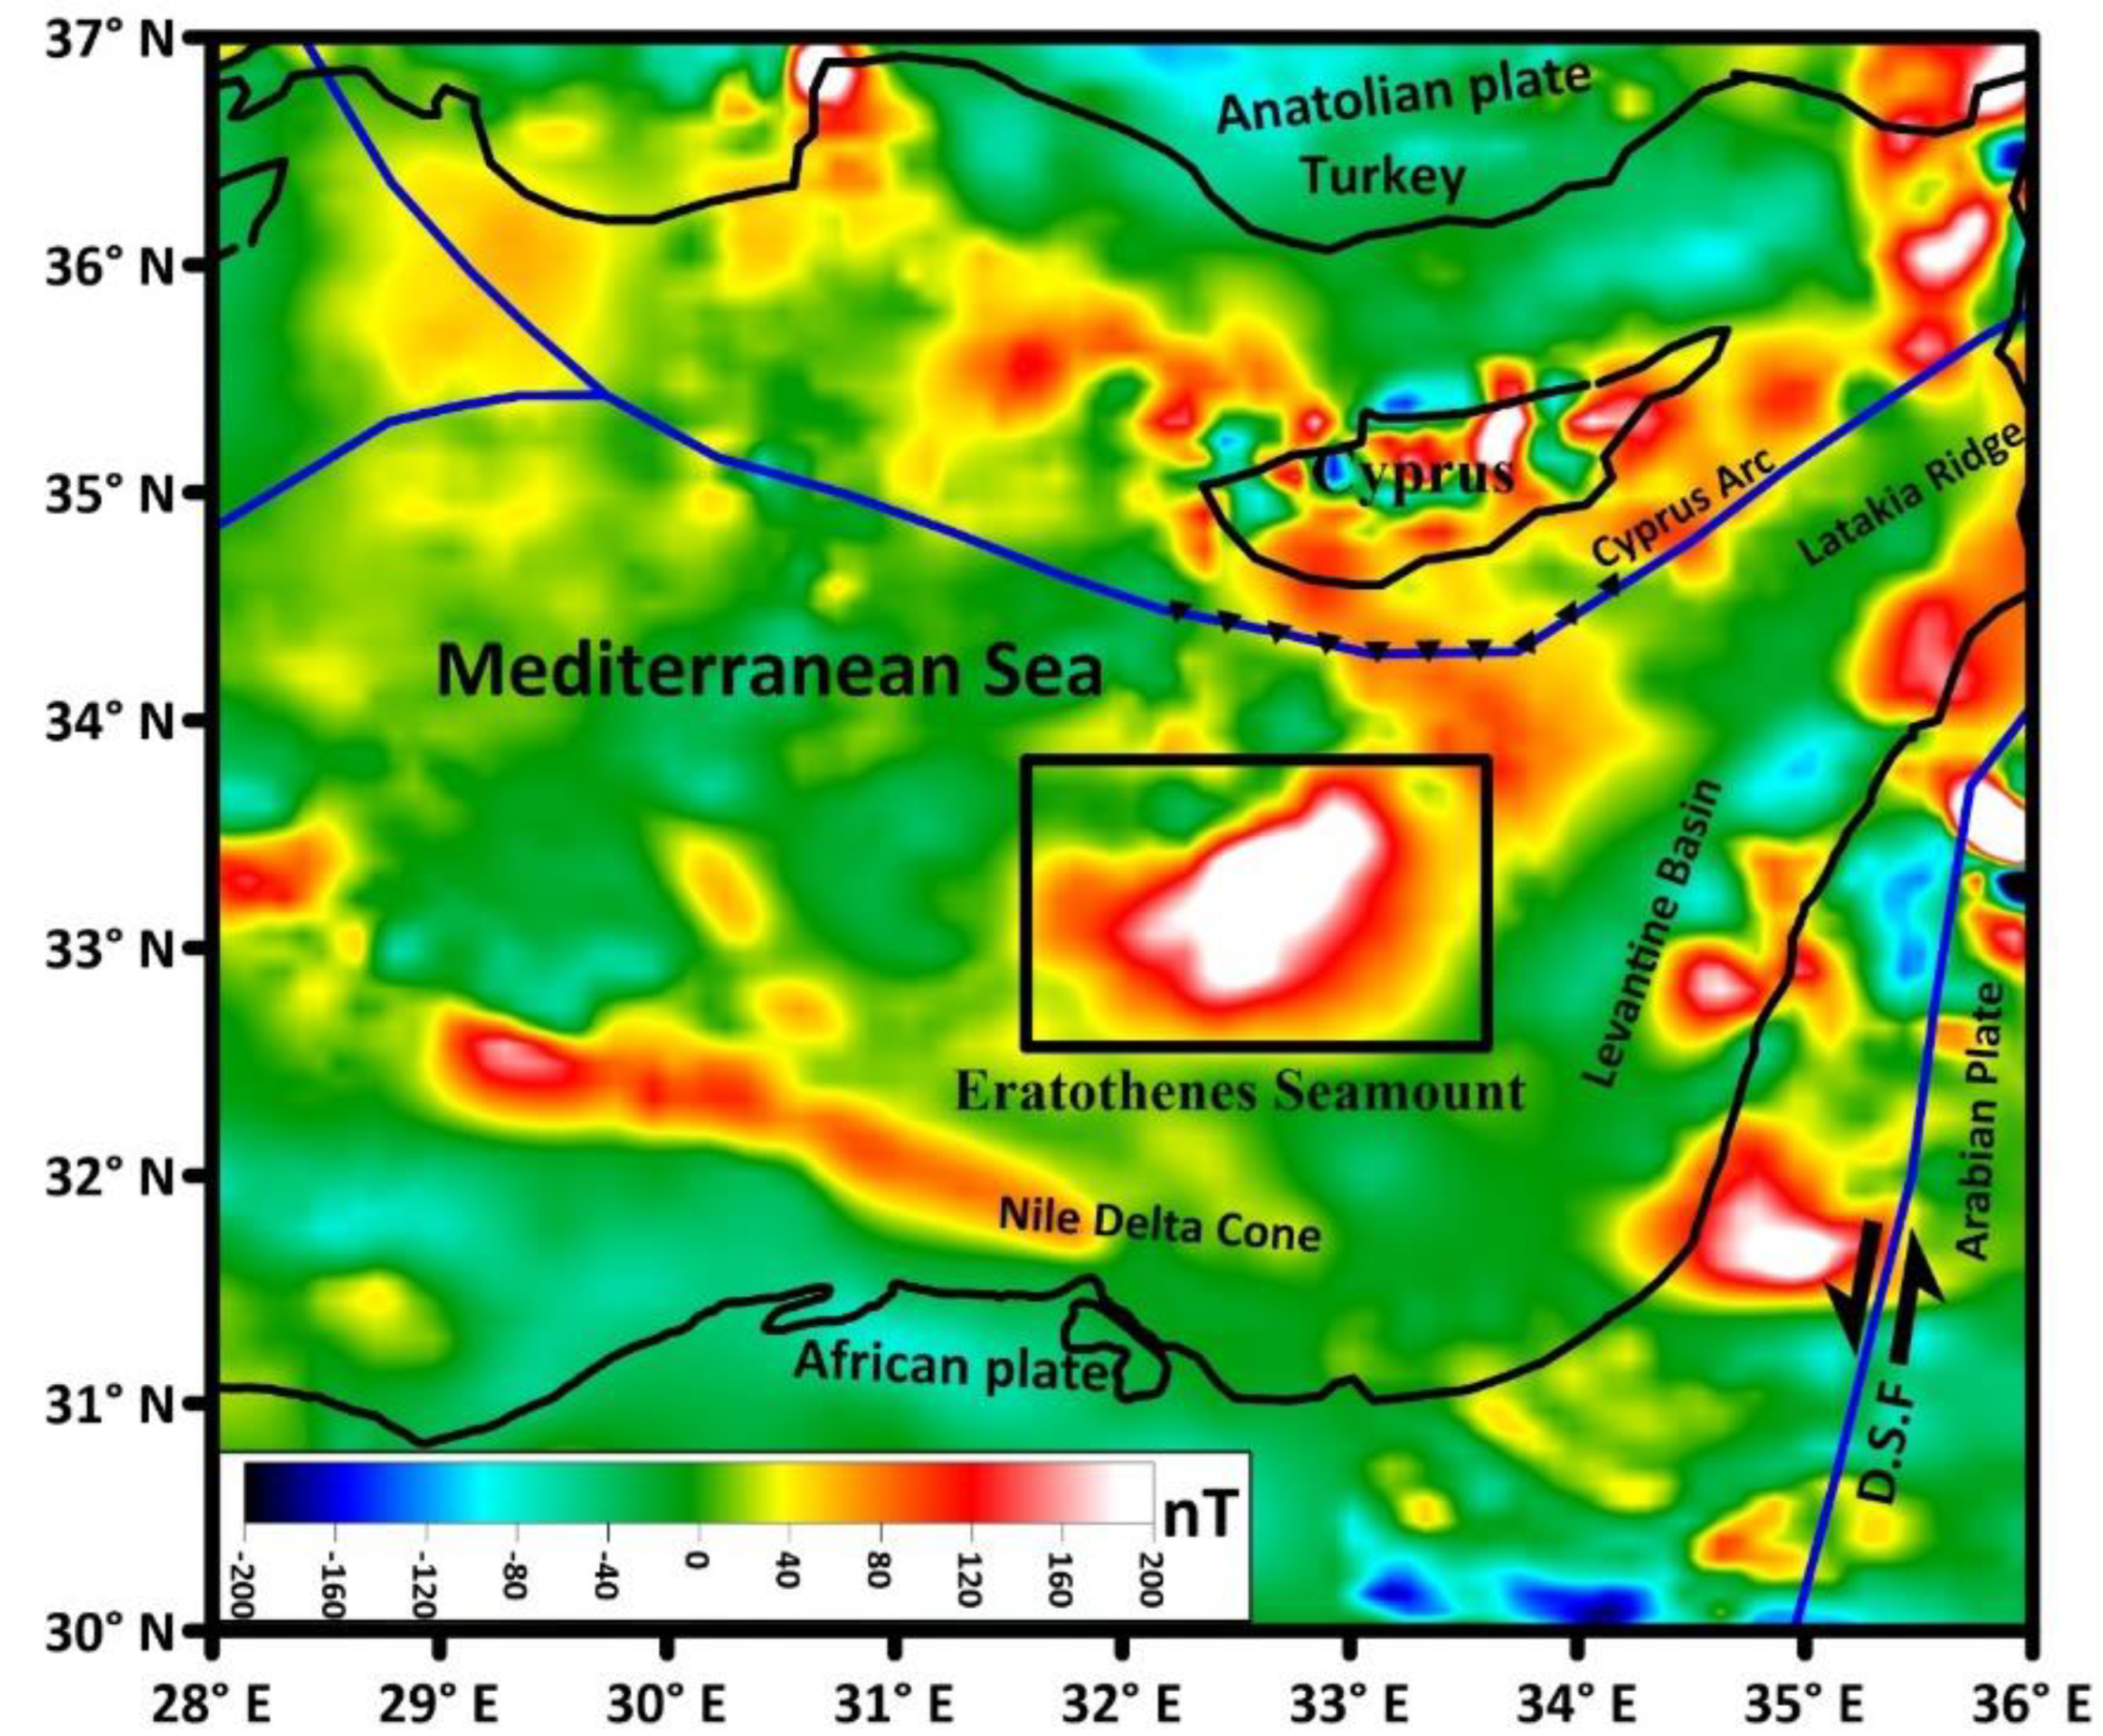
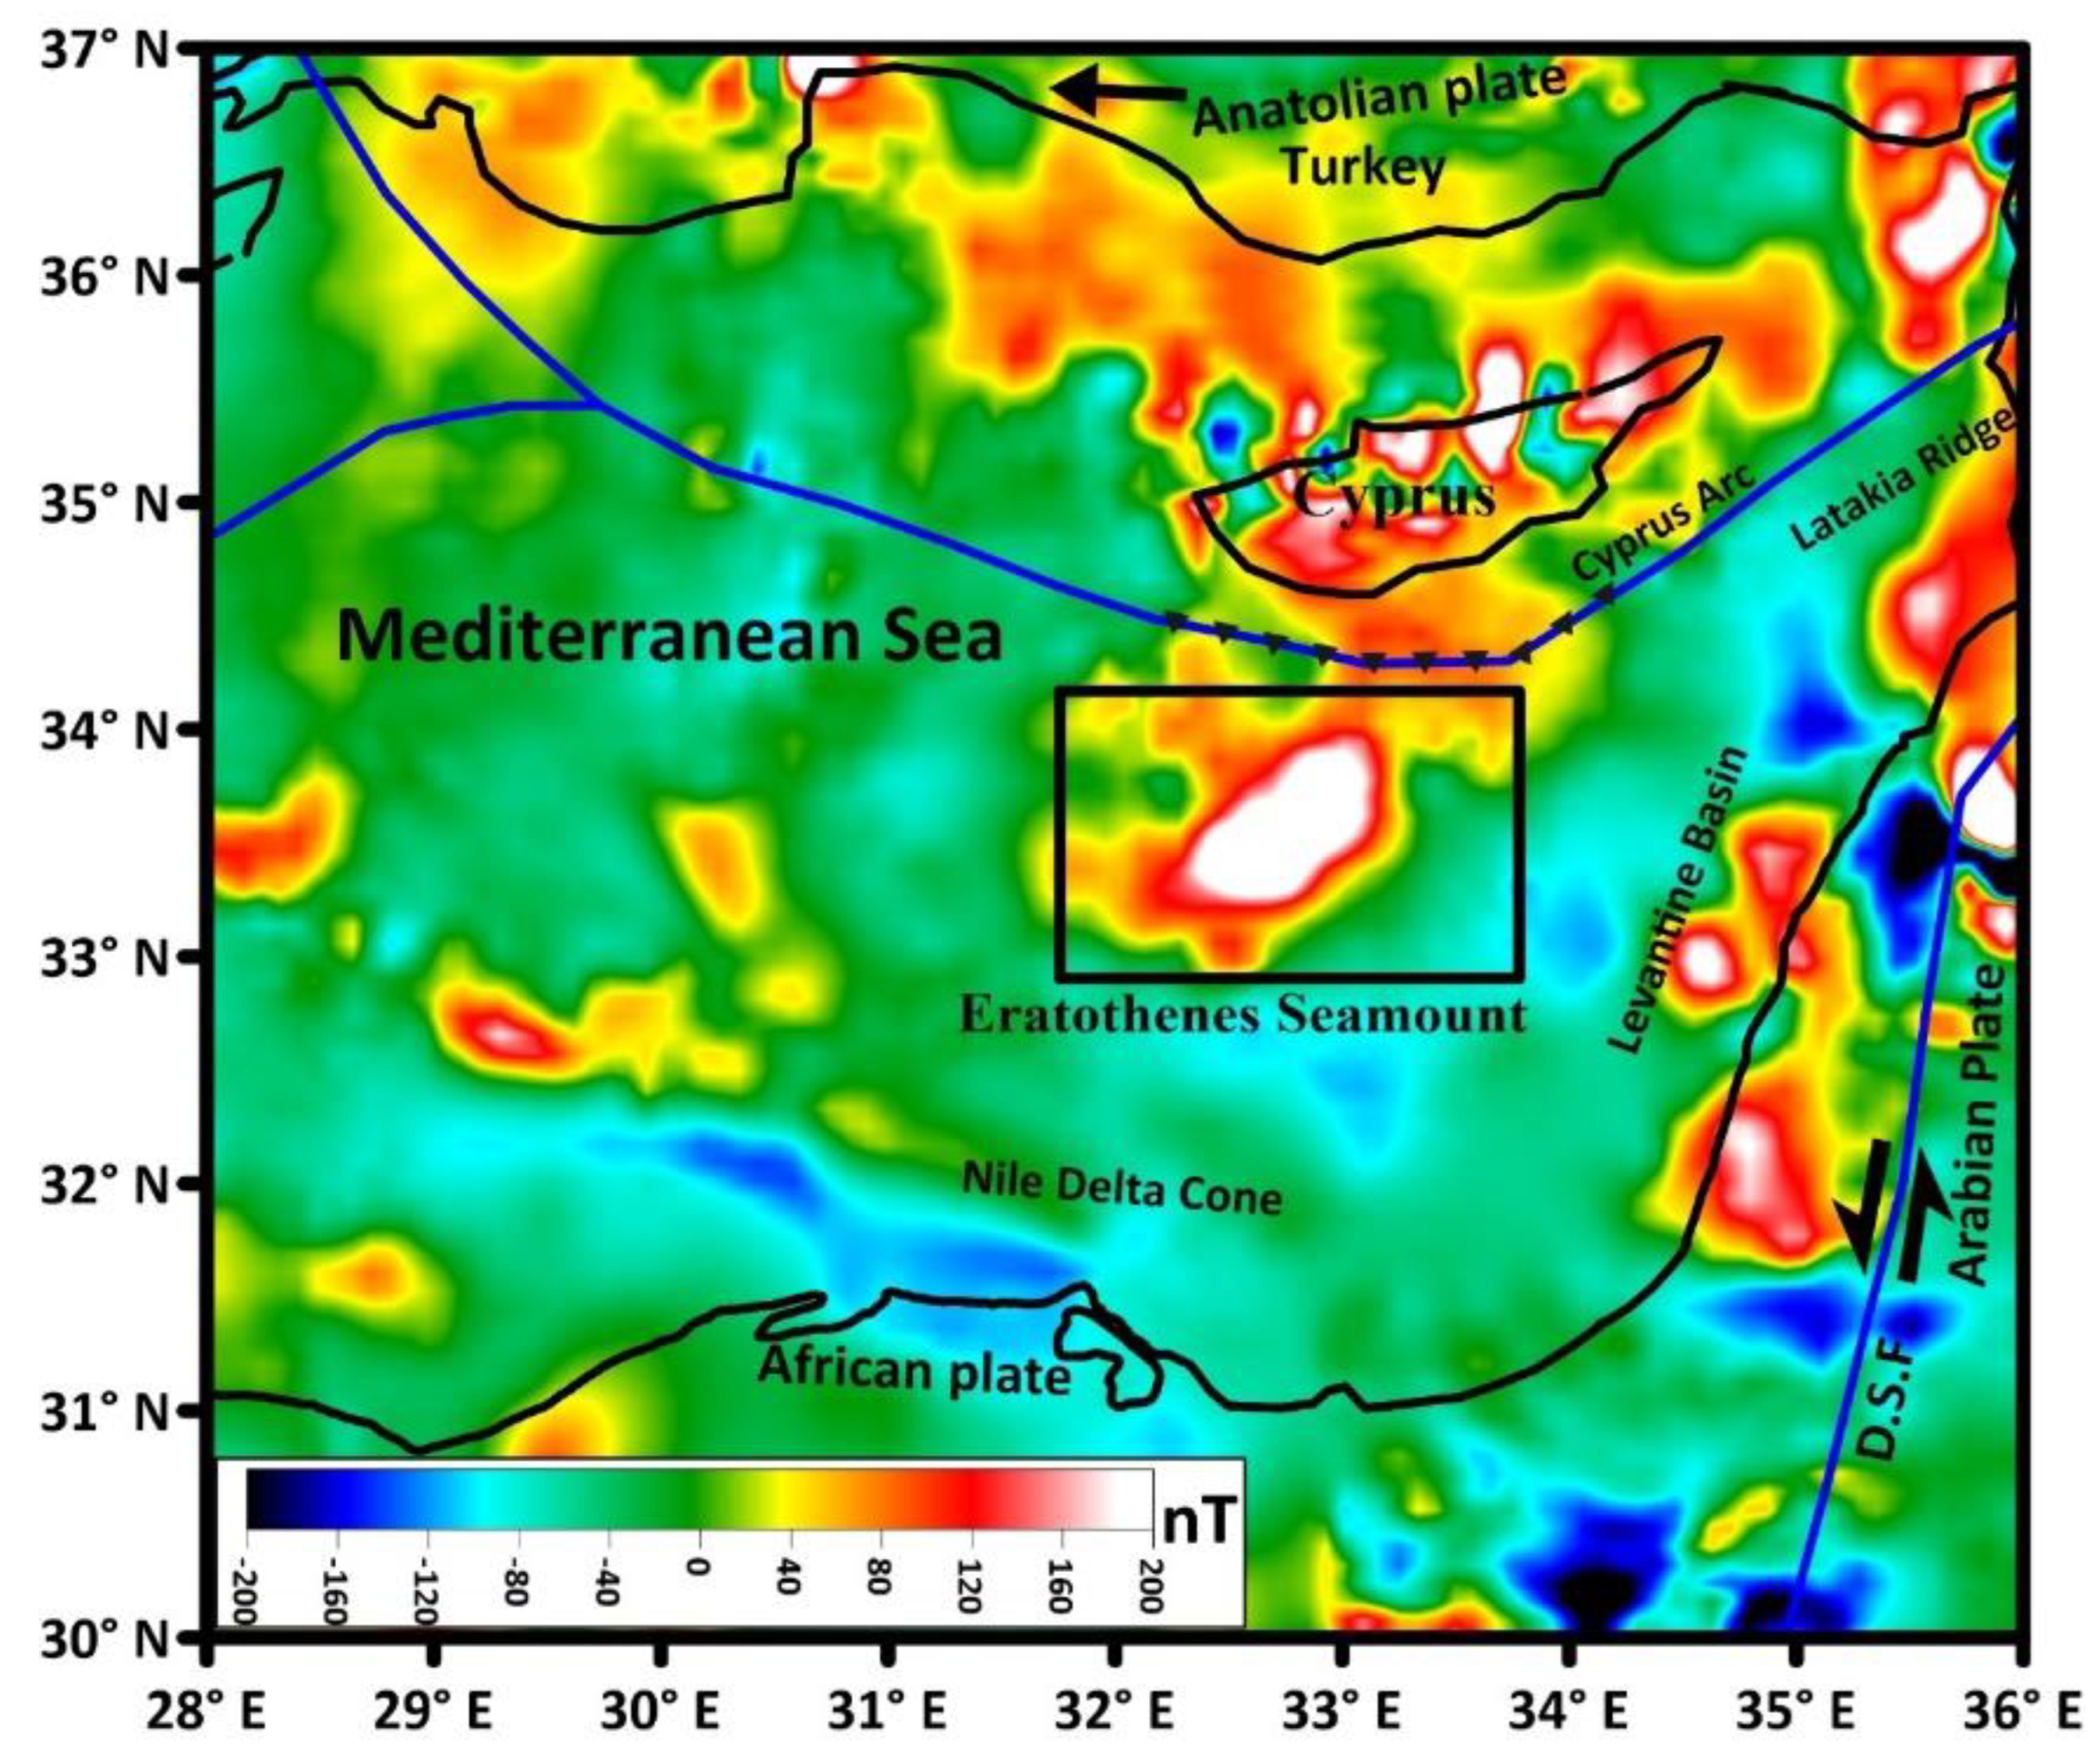
3. Materials and Methods
Methodology
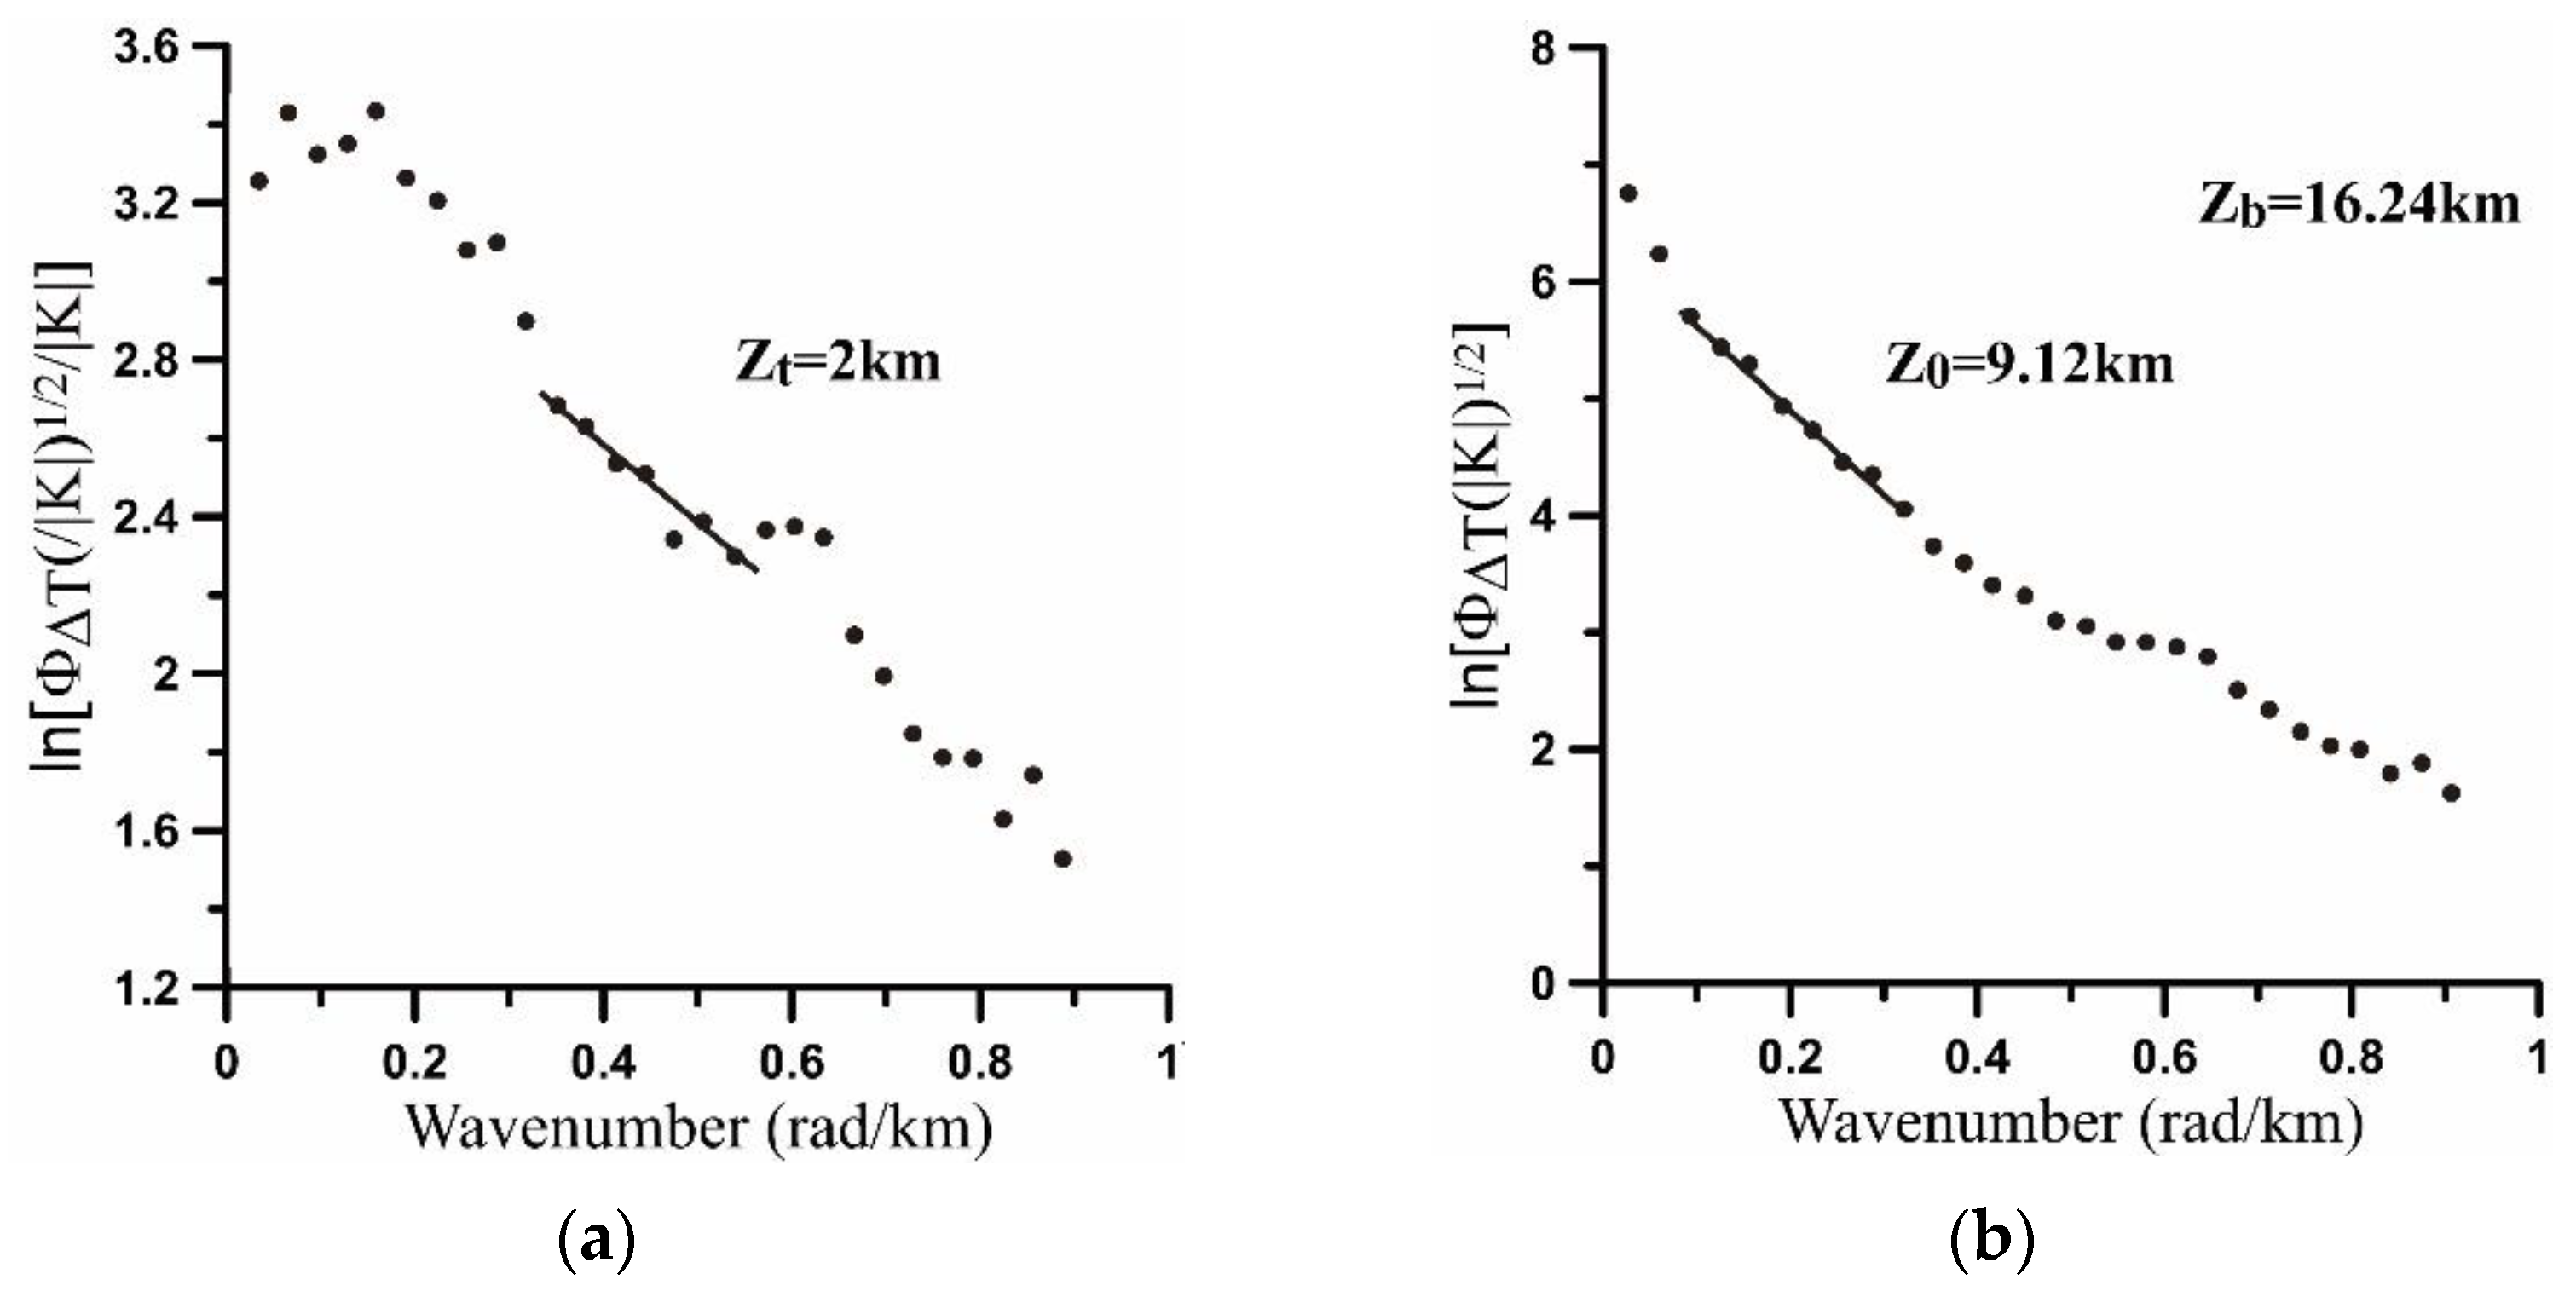
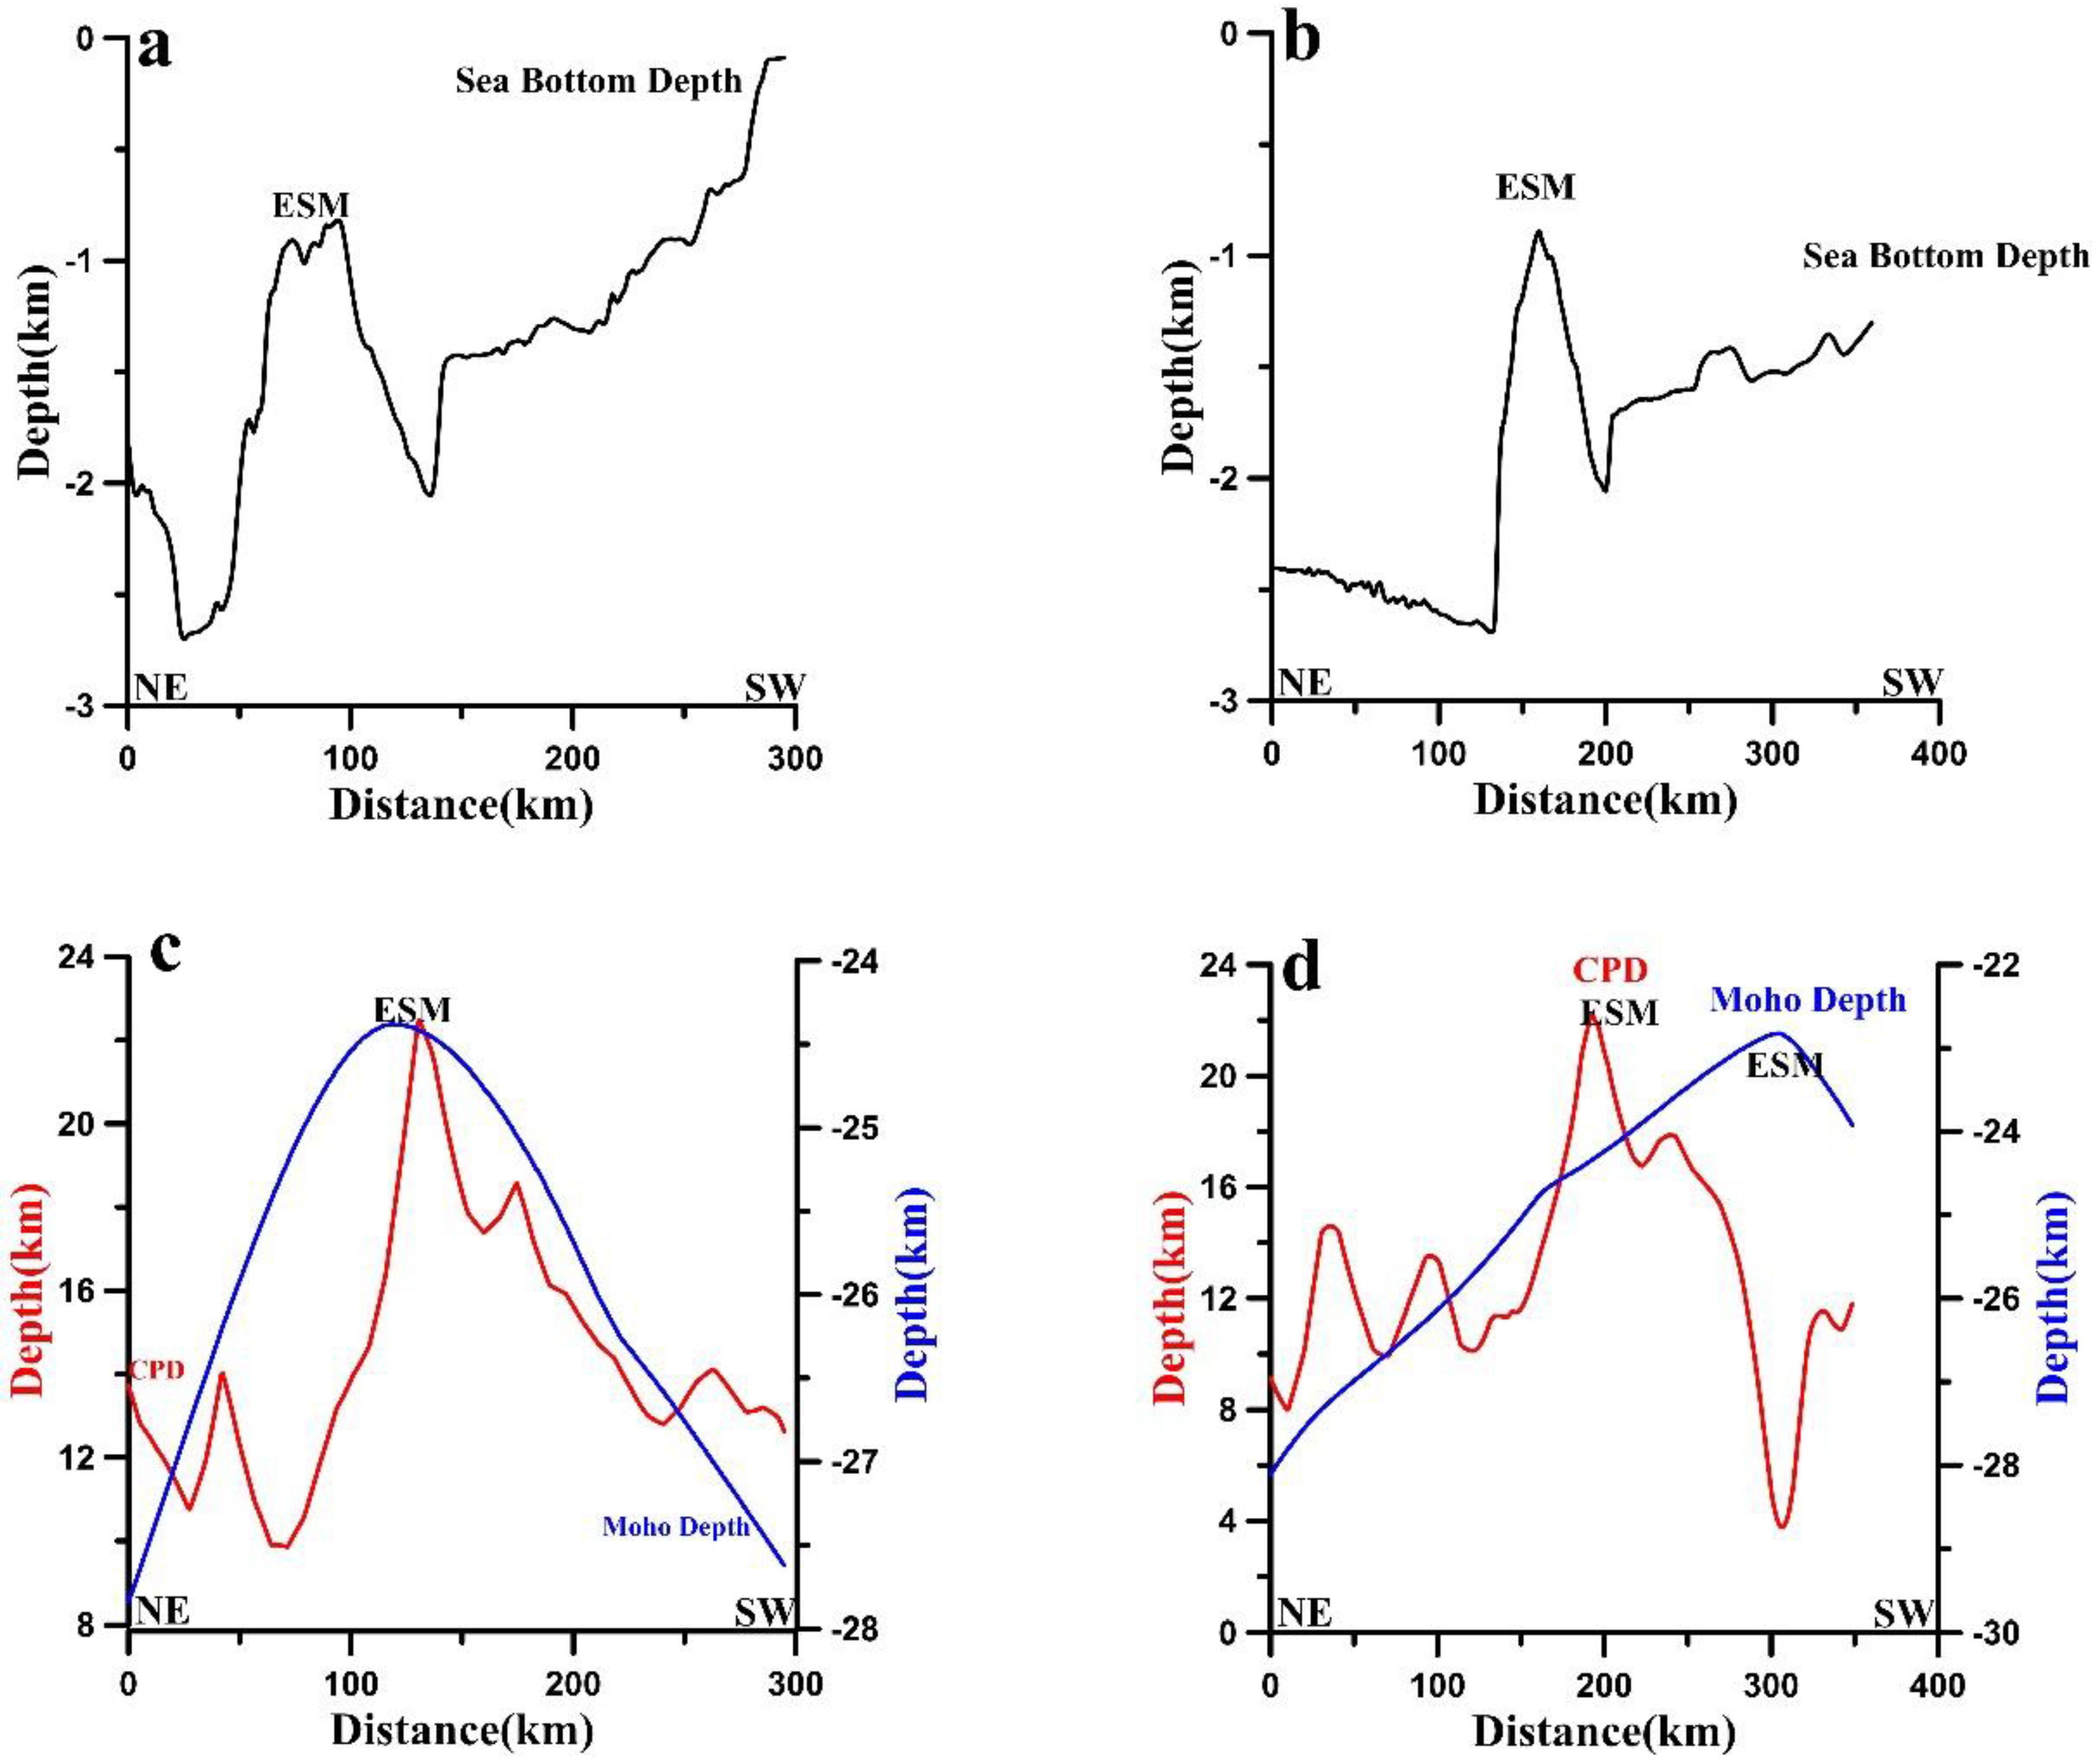
4. Results
5. Discussion
6. Conclusions
Author Contributions
Funding
Data Availability Statement
Acknowledgments
Conflicts of Interest
References
- Mart, Y.; Robertson, A.H.F. Eratosthenes seamount: An oceanographic yardstick recording the late mesozoic—Tertiary geological history of the eastern Mediterranean. Proc. Ocean. Drill. Program Sci. Results 1998, 160, 701–708. [Google Scholar]
- Dolmaz, M.N.; Hisarli, Z.M.; Ustao, T. Curie Point Depths Based on Spectrum Analysis of Aeromagnetic Data, West Anatolian Extensional Province, Turkey. Pure Appl. Geophys. 2005, 162, 571–590. [Google Scholar] [CrossRef]
- Maden, N. Curie-point Depth from Spectral Analysis of Magnetic Data in Erciyes Stratovolcano (Central Turkey). Pure Appl. Geophys. 2010, 167, 349–358. [Google Scholar] [CrossRef]
- Rao, C.R.; Kishore, R.K.; Kumar, V.P.; Babu, B.B. Delineation of intra crustal horizon in Eastern Dharwar Craton—An aeromagnetic evidence. J. Asian Earth Sci. 2011, 40, 534–541. [Google Scholar] [CrossRef]
- Bansal, A.R.; Anand, S.P.; Rajaram, M.; Rao, V.K.; Dimri, V.P. Depth to the bottom of magnetic sources (DBMS) from aeromagnetic data of Central India using modified centroid method for fractal distribution of sources. Tectonophysics 2013, 603, 155–161. [Google Scholar] [CrossRef]
- Obande, G.E.; Lawal, K.M.; Ahmed, L.A. Geothermics Spectral analysis of aeromagnetic data for geothermal investigation of Wikki Warm Spring, north-east Nigeria. Geothermics 2014, 50, 85–90. [Google Scholar] [CrossRef]
- Saibi, H.; Aboud, E.; Gottsmann, J. Curie point depth from spectral analysis of aeromagnetic data for geothermal reconnaissance in Afghanistan. J. Afr. Earth Sci. 2015, 111, 92–99. [Google Scholar] [CrossRef]
- Bilim, F.; Akay, T.; Aydemir, A.; Kosaroglu, S. Curie point depth, heat-flow and radiogenic heat production deduced from the spectral analysis of the aeromagnetic data for geothermal investigation on the Menderes Massif and the Aegean Region, western. Geothermics 2016, 60, 44–57. [Google Scholar] [CrossRef]
- Xu, Y.; Hao, T.; Zeyen, H.; Nan, F. Curie point depths in North China Craton based on spectral analysis of magnetic anomalies. Pure Appl. Geophys. 2017, 174, 339–347. [Google Scholar] [CrossRef]
- Pamuk, E. Investigating edge detection, Curie point depth, and heat flow using EMAG2 magnetic and EGM08 gravity data in the northern part of Eastern Anatolia, Turkey. Turk. J. Earth Sci. 2019, 28, 805–821. [Google Scholar]
- Shirani, S.; Kalateh, A.N.; Noorollahi, Y. Curie point depth estimations for northwest Iran through spectral analysis of aeromagnetic data for geothermal resources exploration. Nat. Resour. Res. 2020, 29, 2307–2332. [Google Scholar] [CrossRef]
- Njeudjang, K.; Kana, J.D.; Tom, A.; Essi, J.M.A.; Djongyang, N.; Tchinda, R. Curie point depth and heat flow deduced from spectral analysis of magnetic data over Adamawa volcanic region (Northern Cameroon): Geothermal implications. SN Appl. Sci. 2020, 2, 1330. [Google Scholar] [CrossRef]
- Özsöz, İ. Combined qualitative and quantitative regional interpretation of the thermal results of magnetic data in the Eastern Mediterranean Region. Turk. J. Earth Sci. 2021, 30, 665–680. [Google Scholar] [CrossRef]
- Özer, Ç.; Öztürk, S.; Pamuk, E. Tectonic and structural characteristics of Erzurum and its surroundings (Eastern Turkey): A detailed comparison between different geophysical parameters. Turk. J. Earth Sci. 2022, 31, 85–108. [Google Scholar]
- Blank, L.; Rioseco, E.M.; Caiazzo, A.; Wilbrandt, U. Modeling, simulation, and optimization of geothermal energy production from hot sedimentary aquifers. Comput. Geosci. 2021, 25, 67–104. [Google Scholar] [CrossRef]
- Bhattacharyya, B.K. Continous spectrum of the total-magnetic-field anomaly due to a rectangular prismatic body. Geophysics 1966, 31, 97. [Google Scholar]
- Bhattacharyya, B.K.; Leu, L.K. Analysis of magnetic anomalies over Yellowstone National Park: Mapping of Curie point isothermal surface for geothermal reconnaissance. J. Geophys. Res. 1975, 80, 4461–4465. [Google Scholar] [CrossRef]
- Mohammed, A.; Adewumi, T.; Kazeem, S.A.; . Abdulwaheed, R.; Adetona, A.A.; Usman, A. Assessment of geother- mal potentials in some parts of upper Benue Trough northeast Nigeria using aeromagnetic data. J. Geosci. Engin. Env. Technol. 2019, 4, 7–15. [Google Scholar] [CrossRef]
- Pamukçu, O.; Akçığ, Z.; Hisarlı, M.; Tosun, S. Curie Point Depths and Heat Flow of Eastern Anatolia (Turkey). Energy Sources Part A Recovery Util. Environ. Eff. 2014, 36, 2699–2706. [Google Scholar] [CrossRef]
- Ben-Avraham, Z.; Shoham, Y.; Ginzburg, A. Magnetic Anomalies in the Eastern Mediterranean and the Tectonic Setting of the Eratosthenes Seamount. Geophys. J. R. Astron. Soc. 1976, 45, 105–123. [Google Scholar] [CrossRef]
- Klimke, J.; Ehrhardt, A. Tectonophysics Impact and implications of the Afro-Eurasian collision south of Cyprus from re fl ection seismic data. Tectonophysics 2014, 626, 105–119. [Google Scholar] [CrossRef]
- Rybakov, M.; Voznesensky, V.; Ben-Avraham, Z.; Lazar, M. The Niklas anomaly southwest of Cyprus: New insights from combined gravity and magnetic data. Isr. J. Earth Sci. 2008, 57, 125–138. [Google Scholar] [CrossRef]
- Ergün, M.; Okay, S.; Sari, C.; Oral, E.Z.; Ash, M.; Hall, J.; Miller, H. Gravity anomalies of the Cyprus Arc and their tectonic implications. Mar. Geol. 2005, 221, 349–358. [Google Scholar] [CrossRef]
- Robertson, A.H.F.; Kidd, R.B.; Ivanov, M.K.; Limonov, A.F.; Woodside, J.M.; Galindo-Zaldivar, J.; Nieto, L. Probing continental collision in the Mediterranean Sea. Eos Trans. Am. Geophys. Union 1994, 75, 233–248. [Google Scholar] [CrossRef]
- Sage, L.; Letouzey, J. Convergence of the African and Eurasian plates in the eastern Mediterranean. Pet. Tecton. Mob. Belts 1990, 49–68. [Google Scholar]
- Spector, A.; Grant, F.S. Statistical Models For Interpreting Aeromagnetic Data. Geoyphysics 1970, 35, 293–302. [Google Scholar] [CrossRef]
- Okubo, Y.; Graf, R.J.; Hansen, R.O.; Ogawa, K.; Tsu, H. Curie point depths of the Island of Kyushu and surrounding areas, Japan. Geophysics 1985, 50, 481–494. [Google Scholar] [CrossRef]
- Tanaka, A.; Okubo, Y.; Matsubayashi, O. Curie point based on spectrum alanysis of the magnetic anomaly data in East and Southeast Asia. Tectonophysics 1999, 306, 461–470. [Google Scholar] [CrossRef]
- Bansal, A.R.; Gabriel, G.; Dimri, V.P.; Krawczyk, C.M. Estimation of depth to the bottom of magnetic sources by a modified centroid method for fractal distribution of sources: An application to aeromagnetic data in Germany. Geophysics 2011, 76, L11–L22. [Google Scholar] [CrossRef]
- Nwankwo, L.I. Estimation of depths to the bottom of magnetic sources and ensuing geothermal parameters from aeromagnetic data of Upper Sokoto Basin, Nigeria. Geothermics 2015, 54, 76–81. [Google Scholar] [CrossRef]
- Shuey, R.T.; Schellinger, D.K.; Tripp, A.C.; Alley, L.B. Curie depth determination from aeromagnetic spectra. Geophys. J. R. Astron. Soc. 1977, 50, 75–101. [Google Scholar] [CrossRef] [Green Version]
- Blakely, R. Curie temperature isotherm analysis and tectonic implications ofaeromagnetic data from Nevada. J. Geophys. Res. 1988, 93, 11817–11832. [Google Scholar] [CrossRef]
- Hussein, M.; Mickus, K.; Serpa, L.F. Curie Point Depth Estimates from Aeromagnetic Data from Death Valley and Surrounding Regions, California. Pure Appl. Geophys. 2013, 170, 617–632. [Google Scholar] [CrossRef]
- Fshar, A.A.; Orouzi, G.H.N.; Oradzadeh, A.M.; Iahi, M.A.R.; Orkhial, S.P. Curie Point Depth, Geothermal Gradient and Heat-Flow Estimation and Geothermal Anomaly Exploration from Integrated Analysis of Aeromagnetic and Gravity Data on the Sabalan Area, NW Iran. Pure Appl. Geophys. 2016, 174, 1133–1152. [Google Scholar] [CrossRef]
- Low, U.; Absar, A.; Duraiswami, R.; Singh, A. Geophysical exploration of Tural-Rajwadi group of hot springs, West Coast Geothermal Province, Maharashtra, India and its implications. Geothermics 2020, 88, 101874. [Google Scholar] [CrossRef]
- Blakely, R. Potential Theory in Gravity and Magnetic Applications; Cambridge University Press: Cambridge, UK, 1995. [Google Scholar]
- Lowrie, W.; Fichtner, A. Fundamentals of Geophysics, 2nd ed.; Cambridge University Press: Cambridge, UK, 1982. [Google Scholar]
- Bektaş, Ö.; Ravat, D.; Büyüksaraç, A.; Bilim, F.; Ateş, A. Regional Geothermal Characterisation of East Anatolia from Aeromagnetic, Heat Flow and Gravity Data. Pure Appl. Geophys. 2007, 164, 975–998. [Google Scholar] [CrossRef]
- Nwankwo, L.I.; Olasehinde, P.I.; Akoshile, C.O. Heat flow anomalies from the spectral analysis of airborne magnetic data of Nupe Basin, Nigeria. Asian J. Earth Sci. 2011, 4, 20–28. [Google Scholar] [CrossRef] [Green Version]
- Abraham, E.M.; Lawal, K.M.; Ekwe, A.C.; Alile, O.; Murana, K.A.; Lawal, A.A. Spectral analysis of aeromagnetic data for geothermal energy investigation of Ikogosi Warm Spring—Ekiti State, southwestern Nigeria. Geotherm. Energy 2014, 2, 6. [Google Scholar] [CrossRef] [Green Version]
- Kappelmeyer, O.; Hänel, R. Geothermics with Special Reference to Application; Gebruder Borntrargen: Stutgart, Germany, 1974. [Google Scholar]
- Poelchau, H.S.; Baker, D.R.; Hantschel, T.H.; Horsfield, B.; Wygrala, B. Basin Simulation and the Design of the Conceptual Basin Model; Welte, D.H., Horsfield, B., Baker, D.R., Eds.; Springer: Berlin, Germany, 1997; pp. 36–41. [Google Scholar]
- Eppelbaum, L.; Kutasov, I.; Pilchin, A. Thermal Properties of Rocks and Density of Fluids. Appl. Geotherm. 2014. [Google Scholar] [CrossRef]
- Lubimova, E.A. Thermal history of the Earth. In The Earth’s Crust and Upper Mantle; Geophysical Monograph Series; American Geophysical Union: Washington, DC, USA, 1968; Volume 13, pp. 63–77. [Google Scholar]
- Clauser, C.; Huenges, E. Thermal conductivity of rocks and minerals. In Rock Physics and Phase Relations: A Handbook of Physical Constants; Ahrens, T.J., Ed.; American Geophysical Union: Washington, DC, USA, 1995; Volume 3, pp. 105–126. [Google Scholar]
- Eucken, A. Dependence of the thermal conductivity of certain gases on the temperature. Physihal Zeitsch. 1911, 12, 1101–1107. [Google Scholar]
- Petrunin, G.I.; Popov, V.G. Temperature dependence of lattice thermal conductivity of Earth’s mineral substance. Izv. Russ. Acad. Sci. Phys. Solid Earth 1995, 30, 617–623. [Google Scholar]
- Litovsky, E.; Shapiro, M. Gas pressure and temperature dependencies of thermal conductivity of porous ceramic materials: Part 1, refractories and ceramics with porospty below 30%. J. Am. Ceram. Soc. 1992, 75, 3425–3439. [Google Scholar] [CrossRef]
- Cermak, V.; Rybach, L. Thermal conductivity and specific heat of minerals and rocks. In Landolt-Bornstein Numerical Data and Functional Relationships in Science and Technology; Angenheister, G., Ed.; Springer: New York, NY, USA, 1982; pp. 213–256. [Google Scholar]
- Maus, S.; Barckhausen, U.; Berkenbosch, H.; Bournas, N.; Brozena, J.; Childers, V.; Dostaler, F.; Fairhead, J.D.; Finn, C.; von Frese, R.R.B.; et al. EMAG2: A 2–arc min resolution Earth Magnetic Anomaly Grid compiled from satellite, airborne, and marine magnetic measurements. Geochem. Geophys. Geosystems 2009, 10. [Google Scholar] [CrossRef]
- Erickson, A.J. The Measurement and Interpretation of Heat Sow in the Mediterranean and Black Sea. Ph.D. Thesis, Massachusetts Institute of Technology (MIT), Cambridge, MA, USA, 1970. [Google Scholar]
- Welford, J.K.; Hall, J.; Christian, H.; Louden, K. Crustal seismic velocity structure from Eratosthenes Seamount to Hecataeus Rise across the Cyprus Arc, eastern Mediterranean. GJI Geodyn. Tecton. 2015, 200, 935–953. [Google Scholar] [CrossRef]
- Robertson, A.H.F. Tectonic significance of the Eratosthenes Seamount: A continental fragment in the process of collision with a subduction zone in the eastern Mediterranean ( Ocean Drilling Program Leg 160). Tectonophysics 1998, 298, 63–82. [Google Scholar] [CrossRef]
- Ben-Avraham, Z.; Ginzburg, A.; Makris, J.; Eppelbaum, L. Crustal structure of the Levant Basin, eastern Mediterranean. Tectonophysics 2002, 346, 23–43. [Google Scholar] [CrossRef]
- Netzeband, G.L.; Gohl, K.; Hübscher, C.P.; Ben-avraham, Z.; Dehghani, G.A.; Gajewski, D.; Liersch, P. The Levantine Basin—Crustal structure and origin. Tectonophysics 2006, 418, 167–188. [Google Scholar] [CrossRef]
- Segev, A.; Rybakov, M.; Lyakhovsky, V.; Hofstetter, A. The structure, isostasy and gravity field of the Levant continental margin and the southeast Mediterranean area. Tectonophysics 2006, 425, 137–157. [Google Scholar] [CrossRef]
- Woodside, J.M.; Williams, S.A. Geophysical Data Report of the Eastern Mediterranean Sea: RRS Shackleton Cruises 3/72, 5/72 and 1/74D; Cambridge University: Cambridge, UK, 1977. [Google Scholar]
- Selim, E.S.; Abouad, E.; Moustafa, S.R.; Al-Arifi, N.S. Active tectonic trends and crustal modeling of the eastern Mediterranean Sea deduced from geophysical data. Environ. Earth Sci. 2016, 75. [Google Scholar] [CrossRef]
- Pamuk, E.; Özsöz, İ. Estimation of Curie-Point Depths and Heat Flow from Spectral Analysis of EMAG2 Magnetic Data in Cyprus Island. Ann. Geophys. 2022, 65, 1036. [Google Scholar] [CrossRef]
- Guimarães, S.N.P.; Ravat, D.; Hamza, V.M. Combined use of the centroid and matched filtering spectral magnetic methods in determining thermomagnetic characteristics of the crust in the structural provinces of Central Brazil. Tectonophysics 2014, 624, 87–99. [Google Scholar] [CrossRef]
- Oliveira, J.T.C.; Barbosa, J.A.; de Castro, D.L.; de Barros Correia, P.; Magalhães, J.R.G.; Filho, O.J.C.; Buarque, B.V. Precambrian tectonic inheritance control of the NE Brazilian continental margin revealed by Curie point depth estimation. Ann. Geophys. 2021, 64, 213. [Google Scholar]
- Wasilewski, P.J.; Thomas, H.H. The Moho as a magnetic boundary. Geophys. Res. Lett. 1979, 6, 541–544. [Google Scholar] [CrossRef]


Publisher’s Note: MDPI stays neutral with regard to jurisdictional claims in published maps and institutional affiliations. |
© 2022 by the authors. Licensee MDPI, Basel, Switzerland. This article is an open access article distributed under the terms and conditions of the Creative Commons Attribution (CC BY) license (https://creativecommons.org/licenses/by/4.0/).
Share and Cite
Harash, F.; Chen, C. Determination of Curie Point Depth Distribution and Heat Flow Regime Characteristics in Eratosthenes Seamount, Eastern Mediterranean Sea. Energies 2022, 15, 8634. https://doi.org/10.3390/en15228634
Harash F, Chen C. Determination of Curie Point Depth Distribution and Heat Flow Regime Characteristics in Eratosthenes Seamount, Eastern Mediterranean Sea. Energies. 2022; 15(22):8634. https://doi.org/10.3390/en15228634
Chicago/Turabian StyleHarash, Fayez, and Chao Chen. 2022. "Determination of Curie Point Depth Distribution and Heat Flow Regime Characteristics in Eratosthenes Seamount, Eastern Mediterranean Sea" Energies 15, no. 22: 8634. https://doi.org/10.3390/en15228634