


Options for Methane Fuel Processing in PEMFC System with Potential Maritime Applications


Abstract
:1. Introduction
2. Methodology
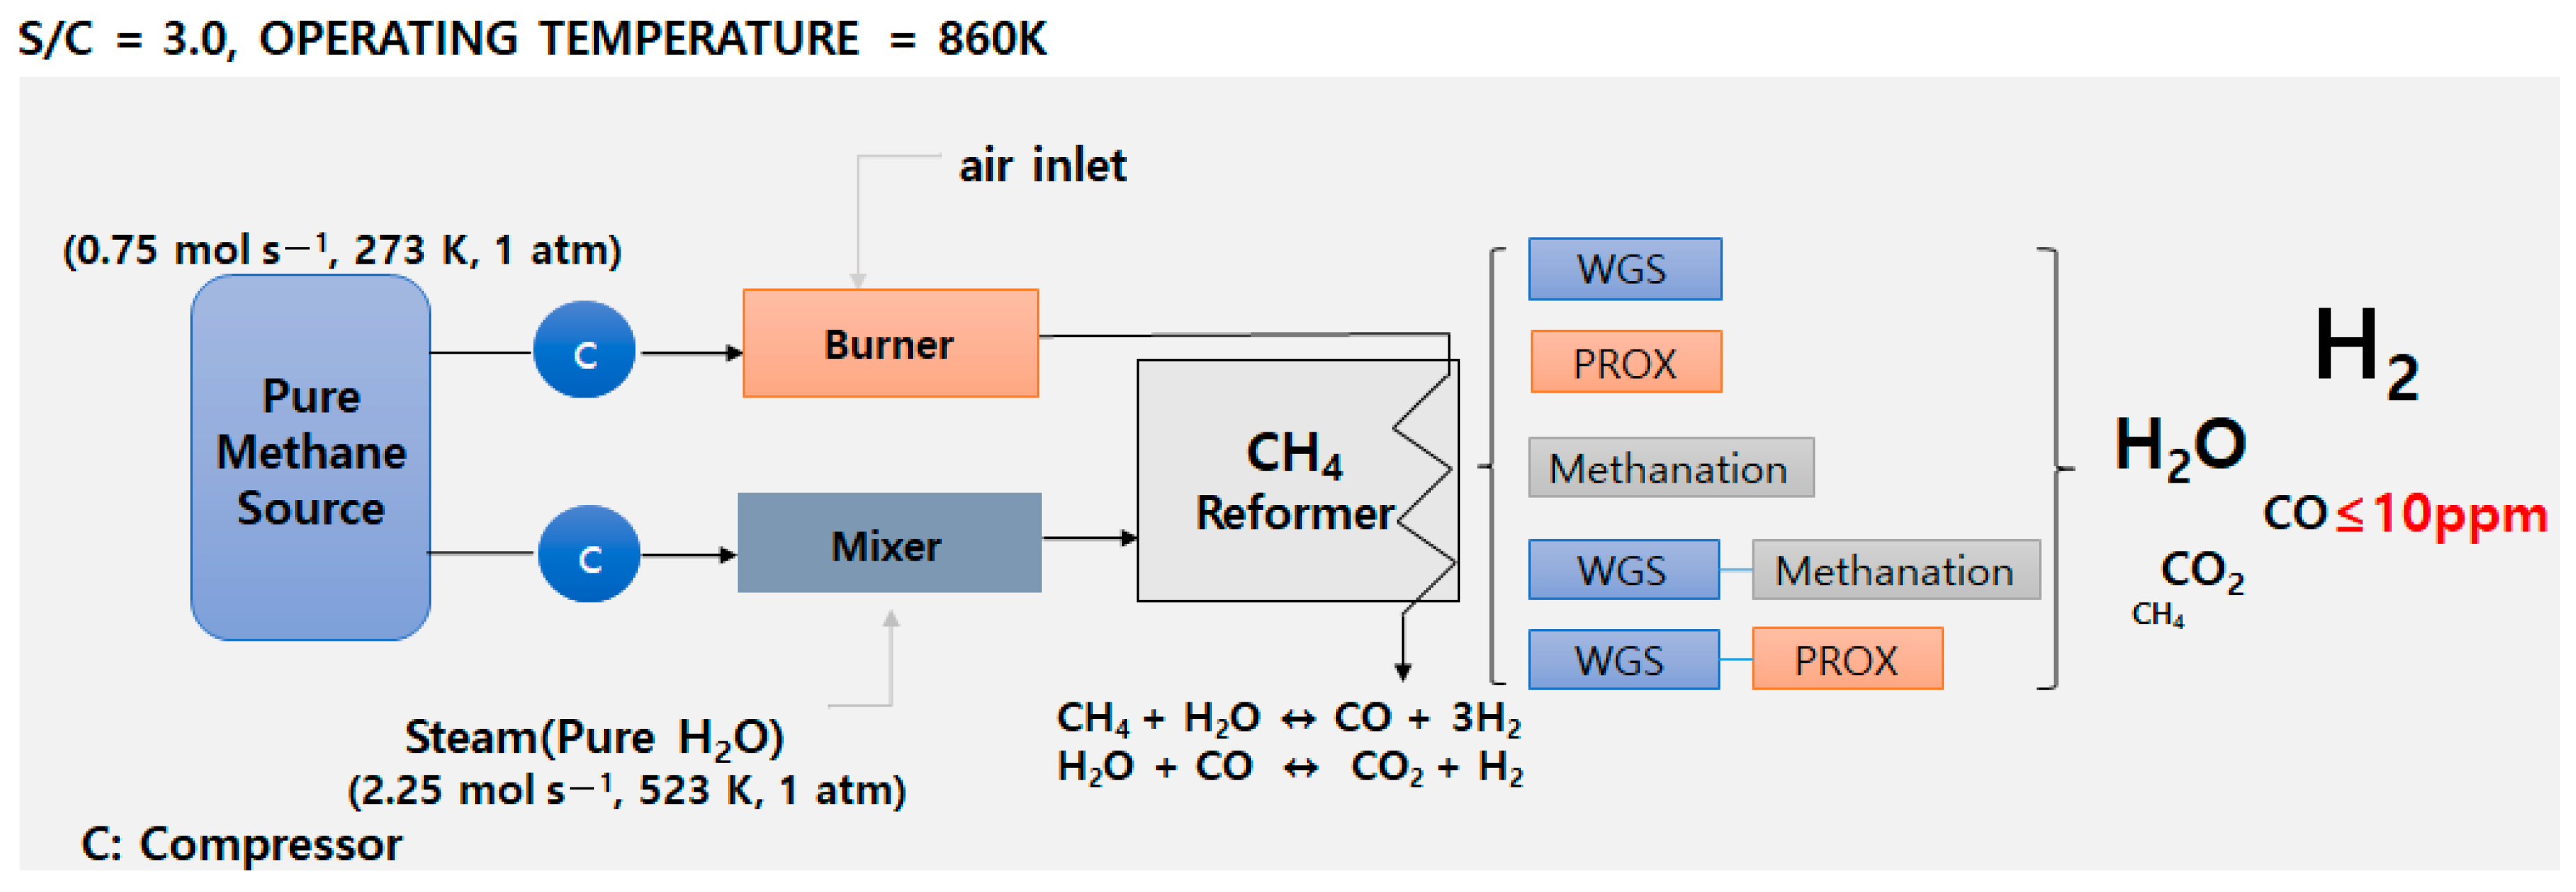
2.1. Modeling
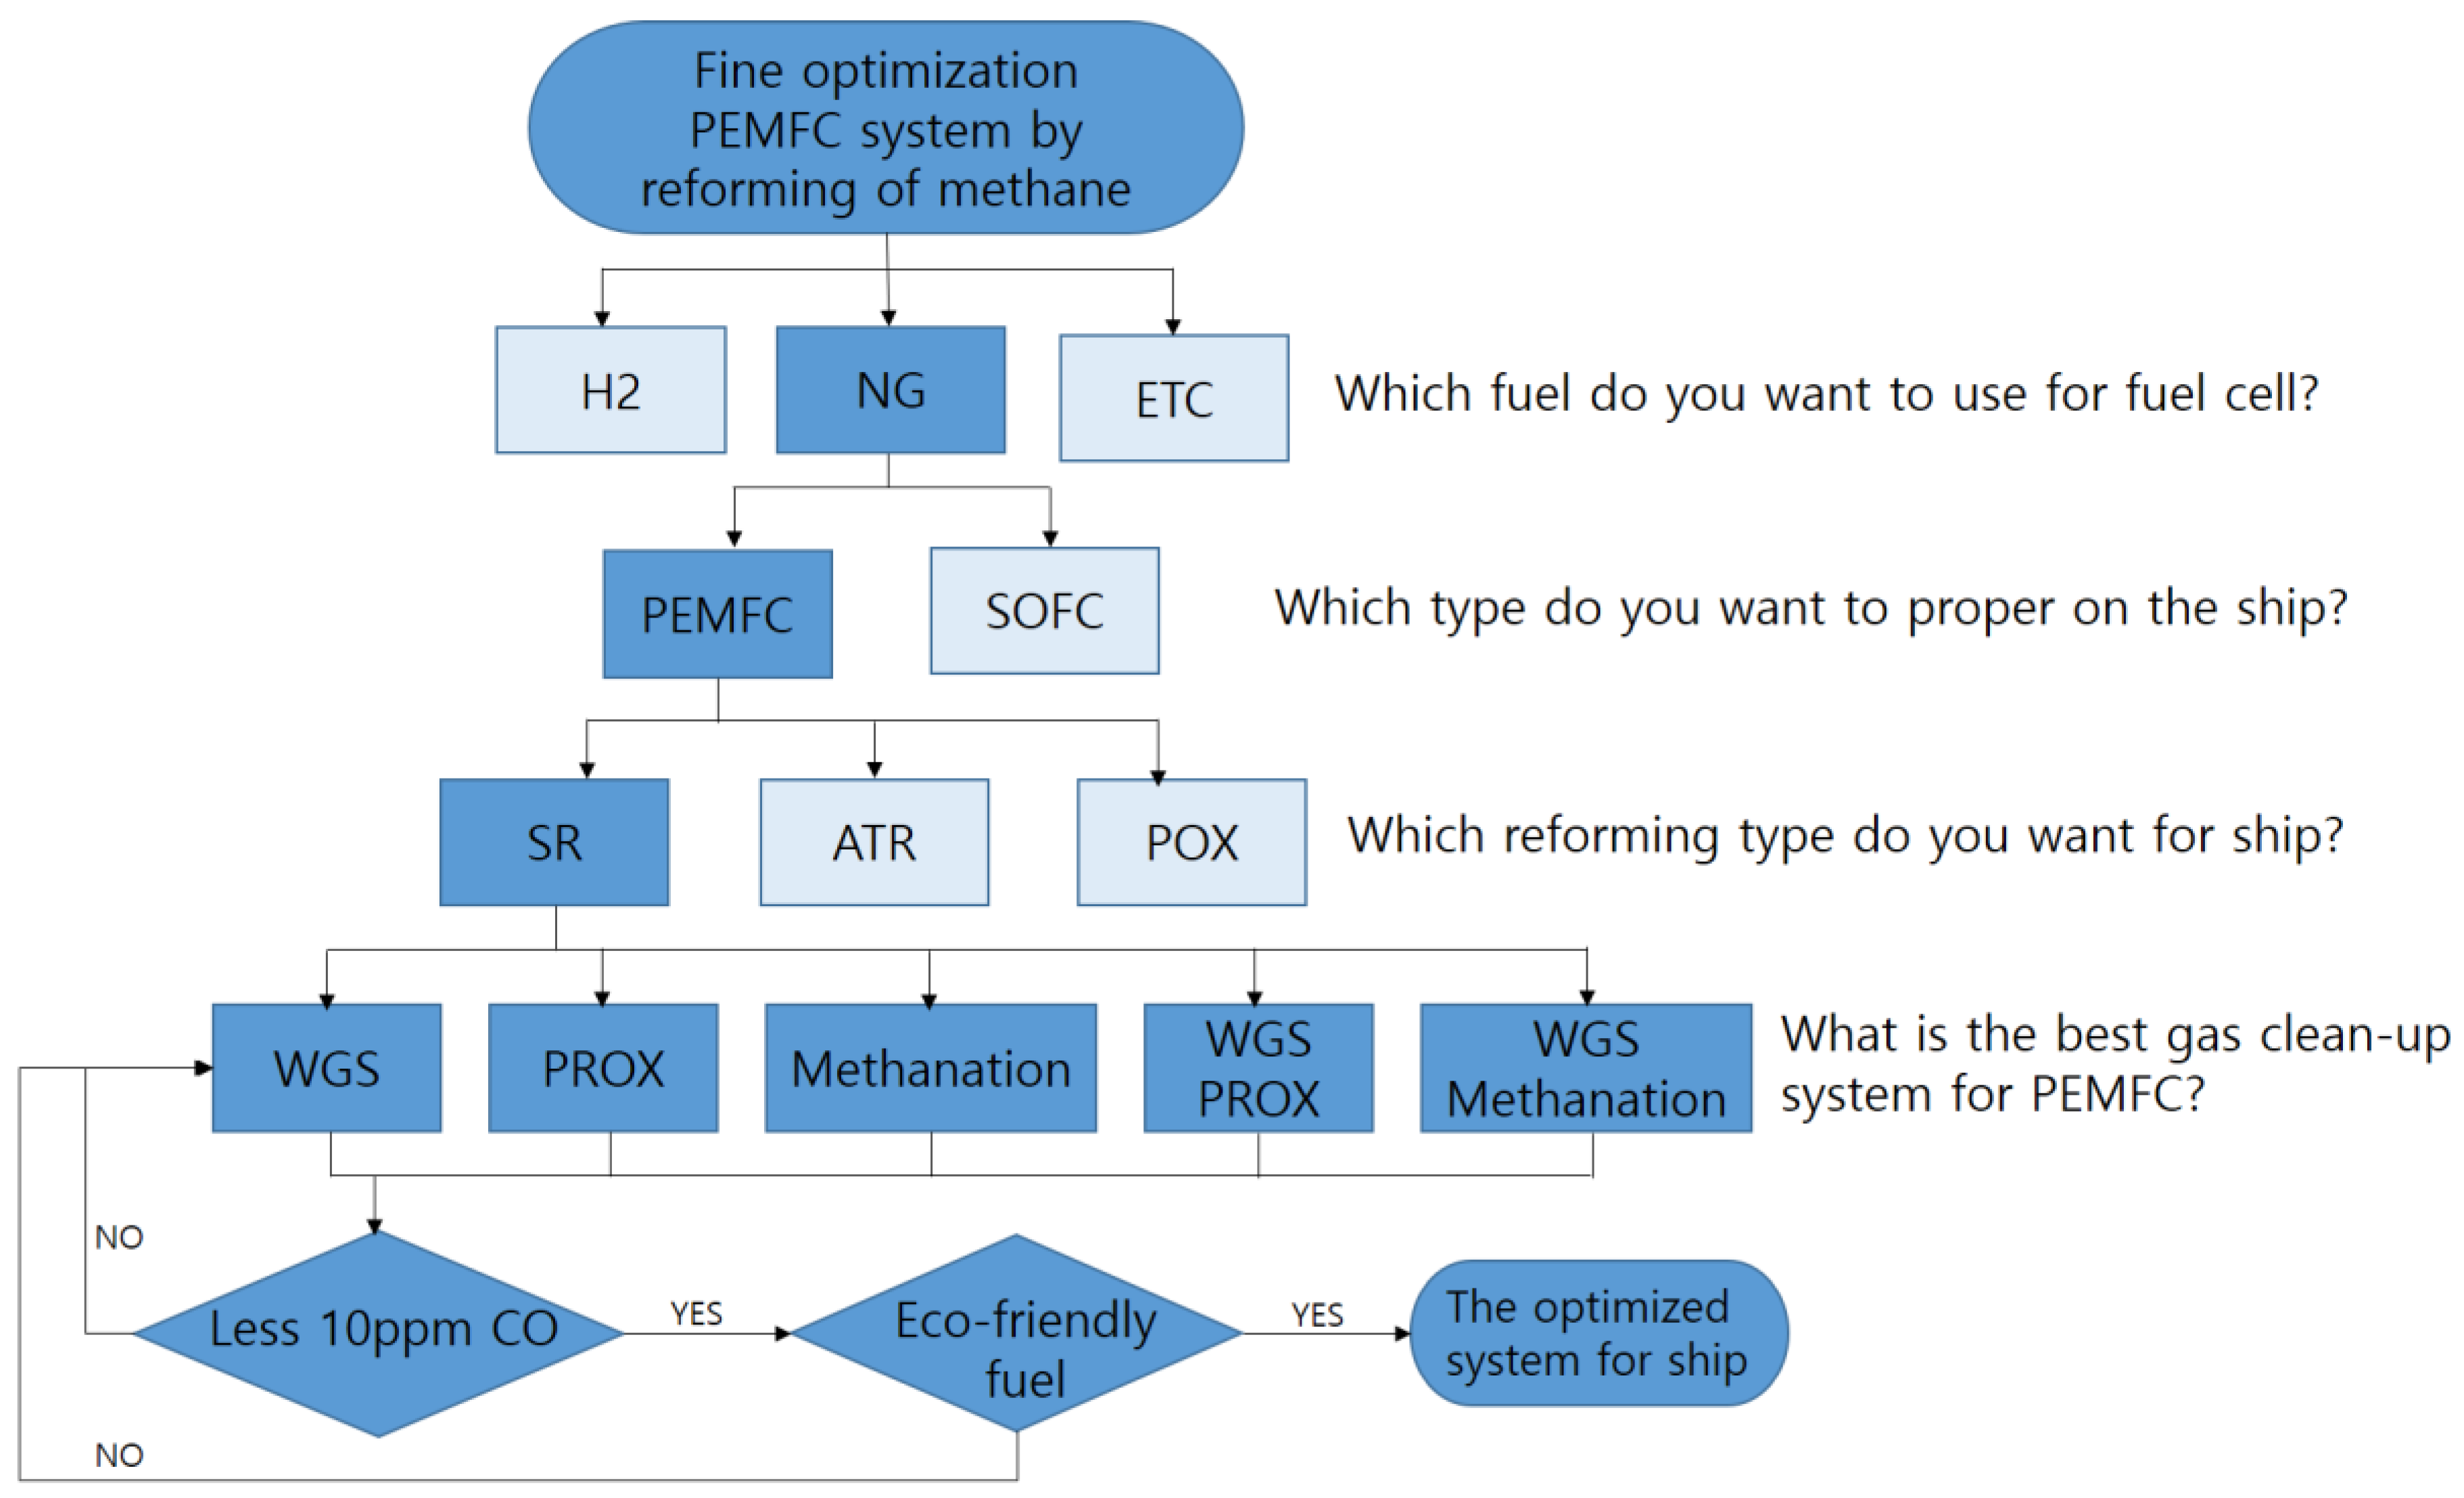
2.2. Reforming Methods
- (1)
- Reforming Reaction
- (2)
- Shift Reaction
2.3. Post-Treatment System
3. Results
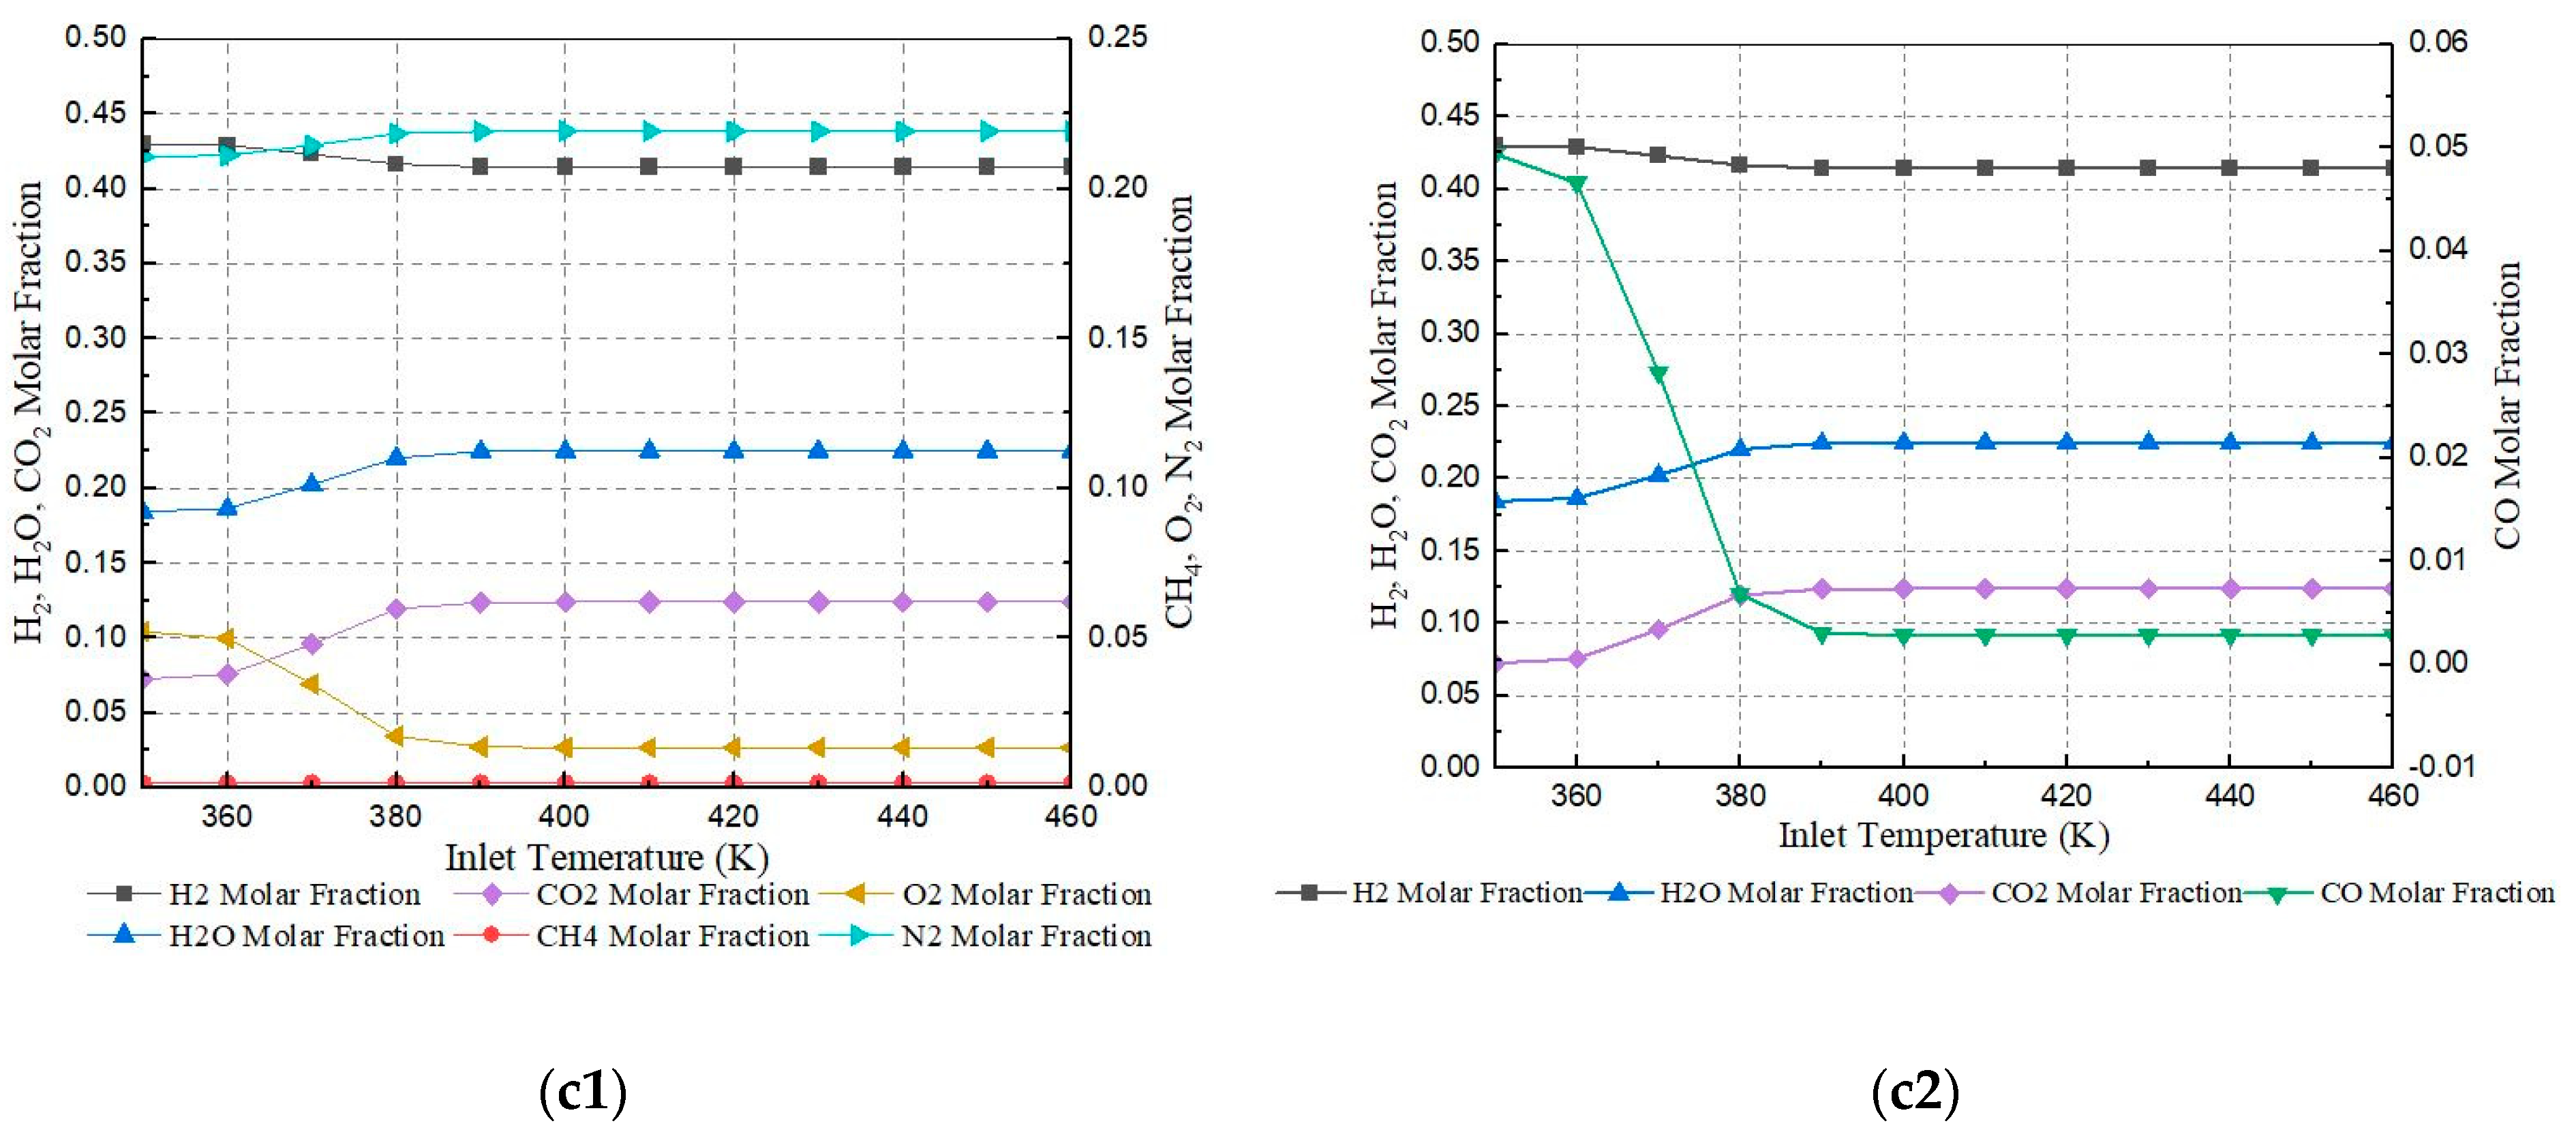
3.1. Reforming
3.2. Post-Treatment System
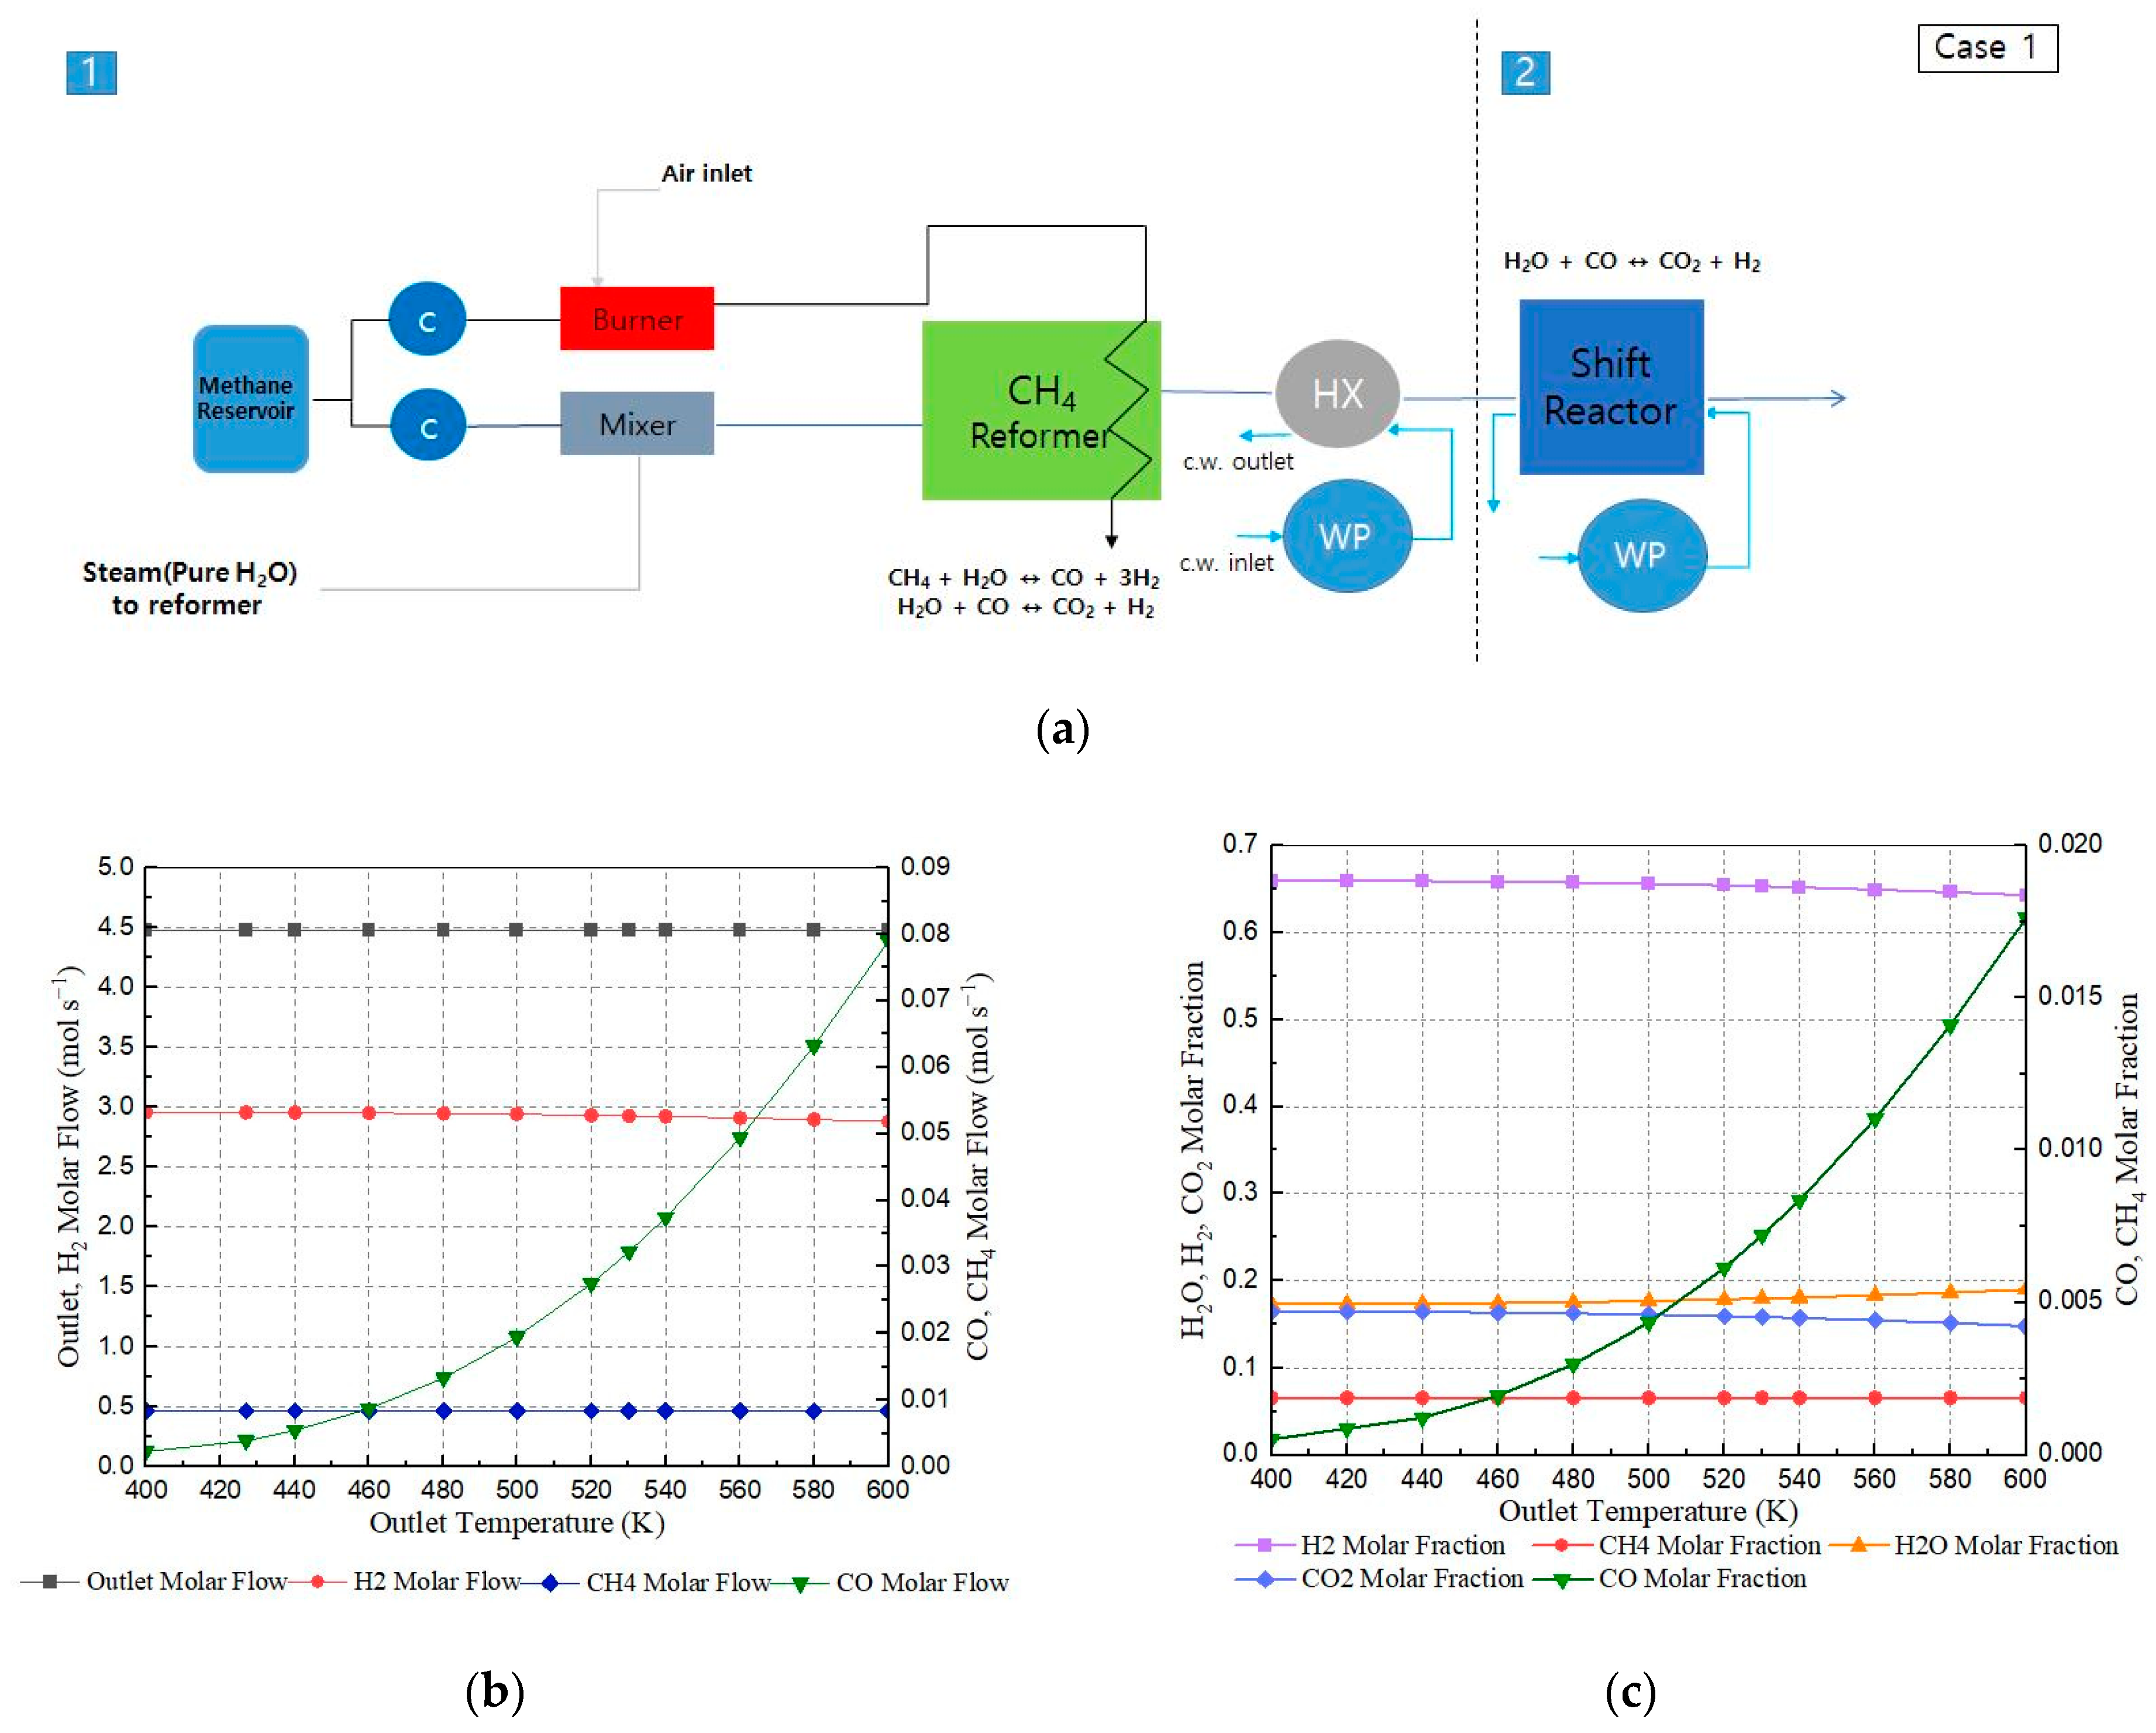
3.2.1. Case 1: WGS Only
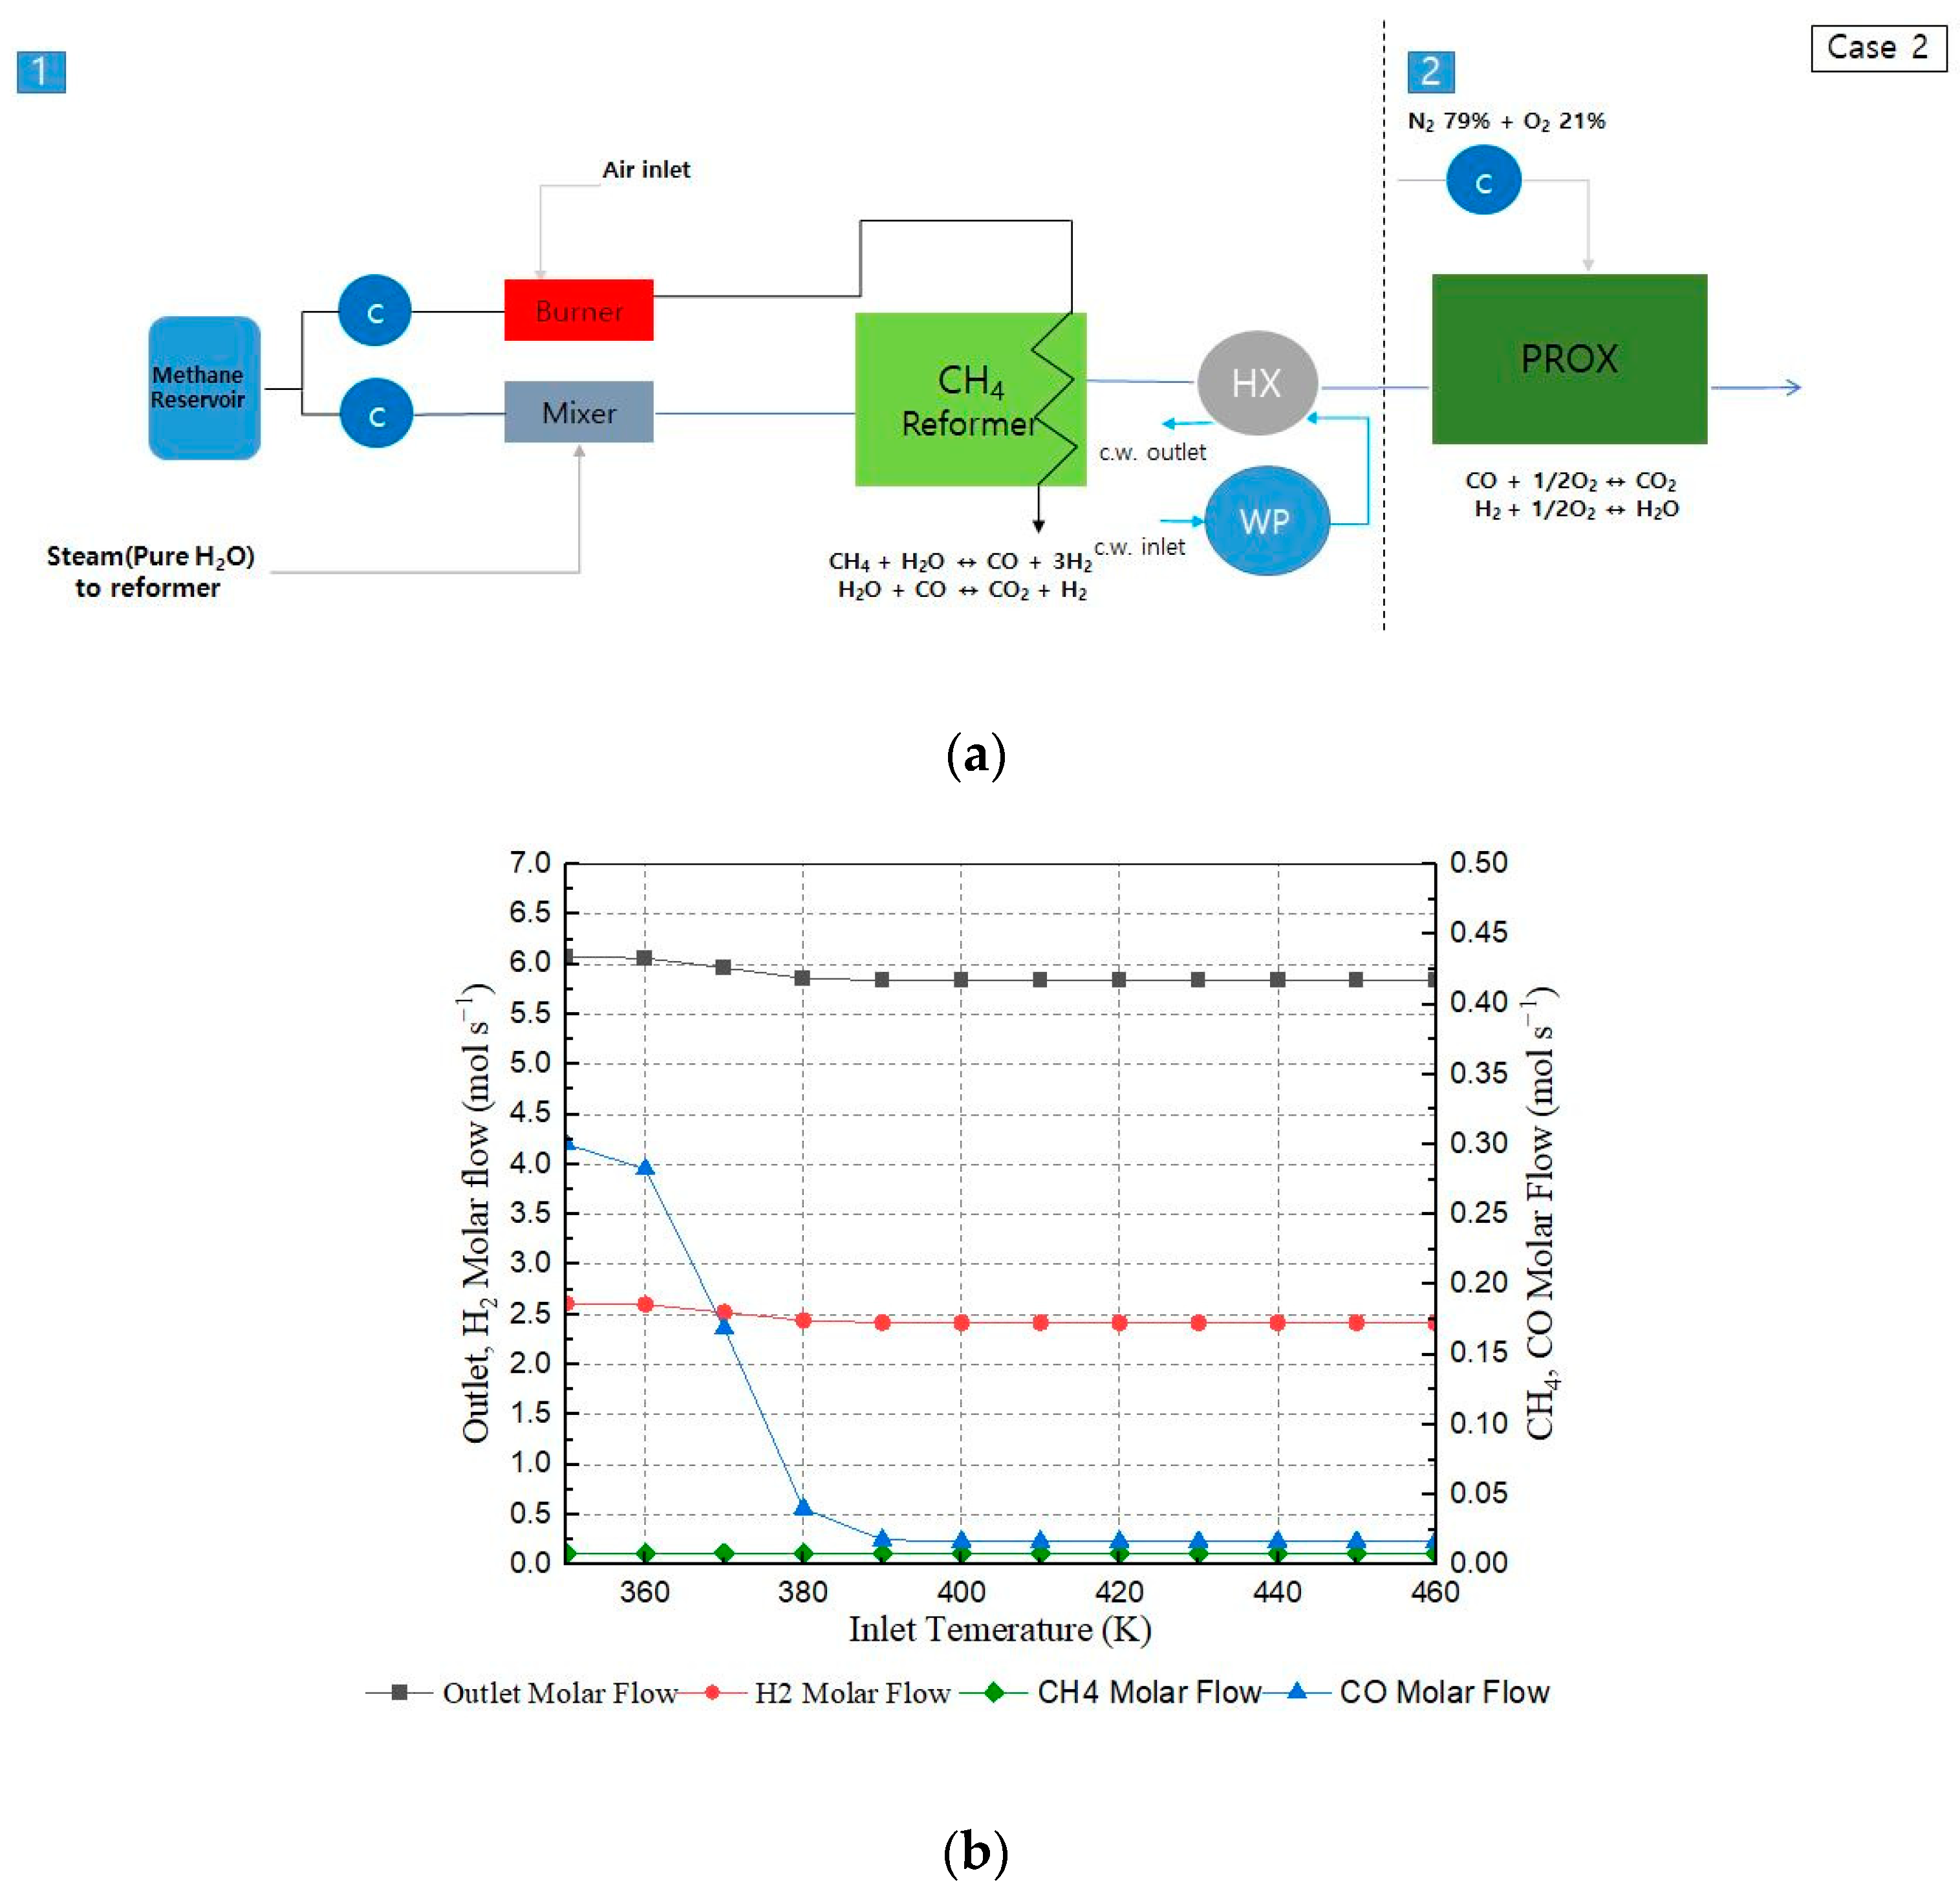
3.2.2. Case 2: PROX Only
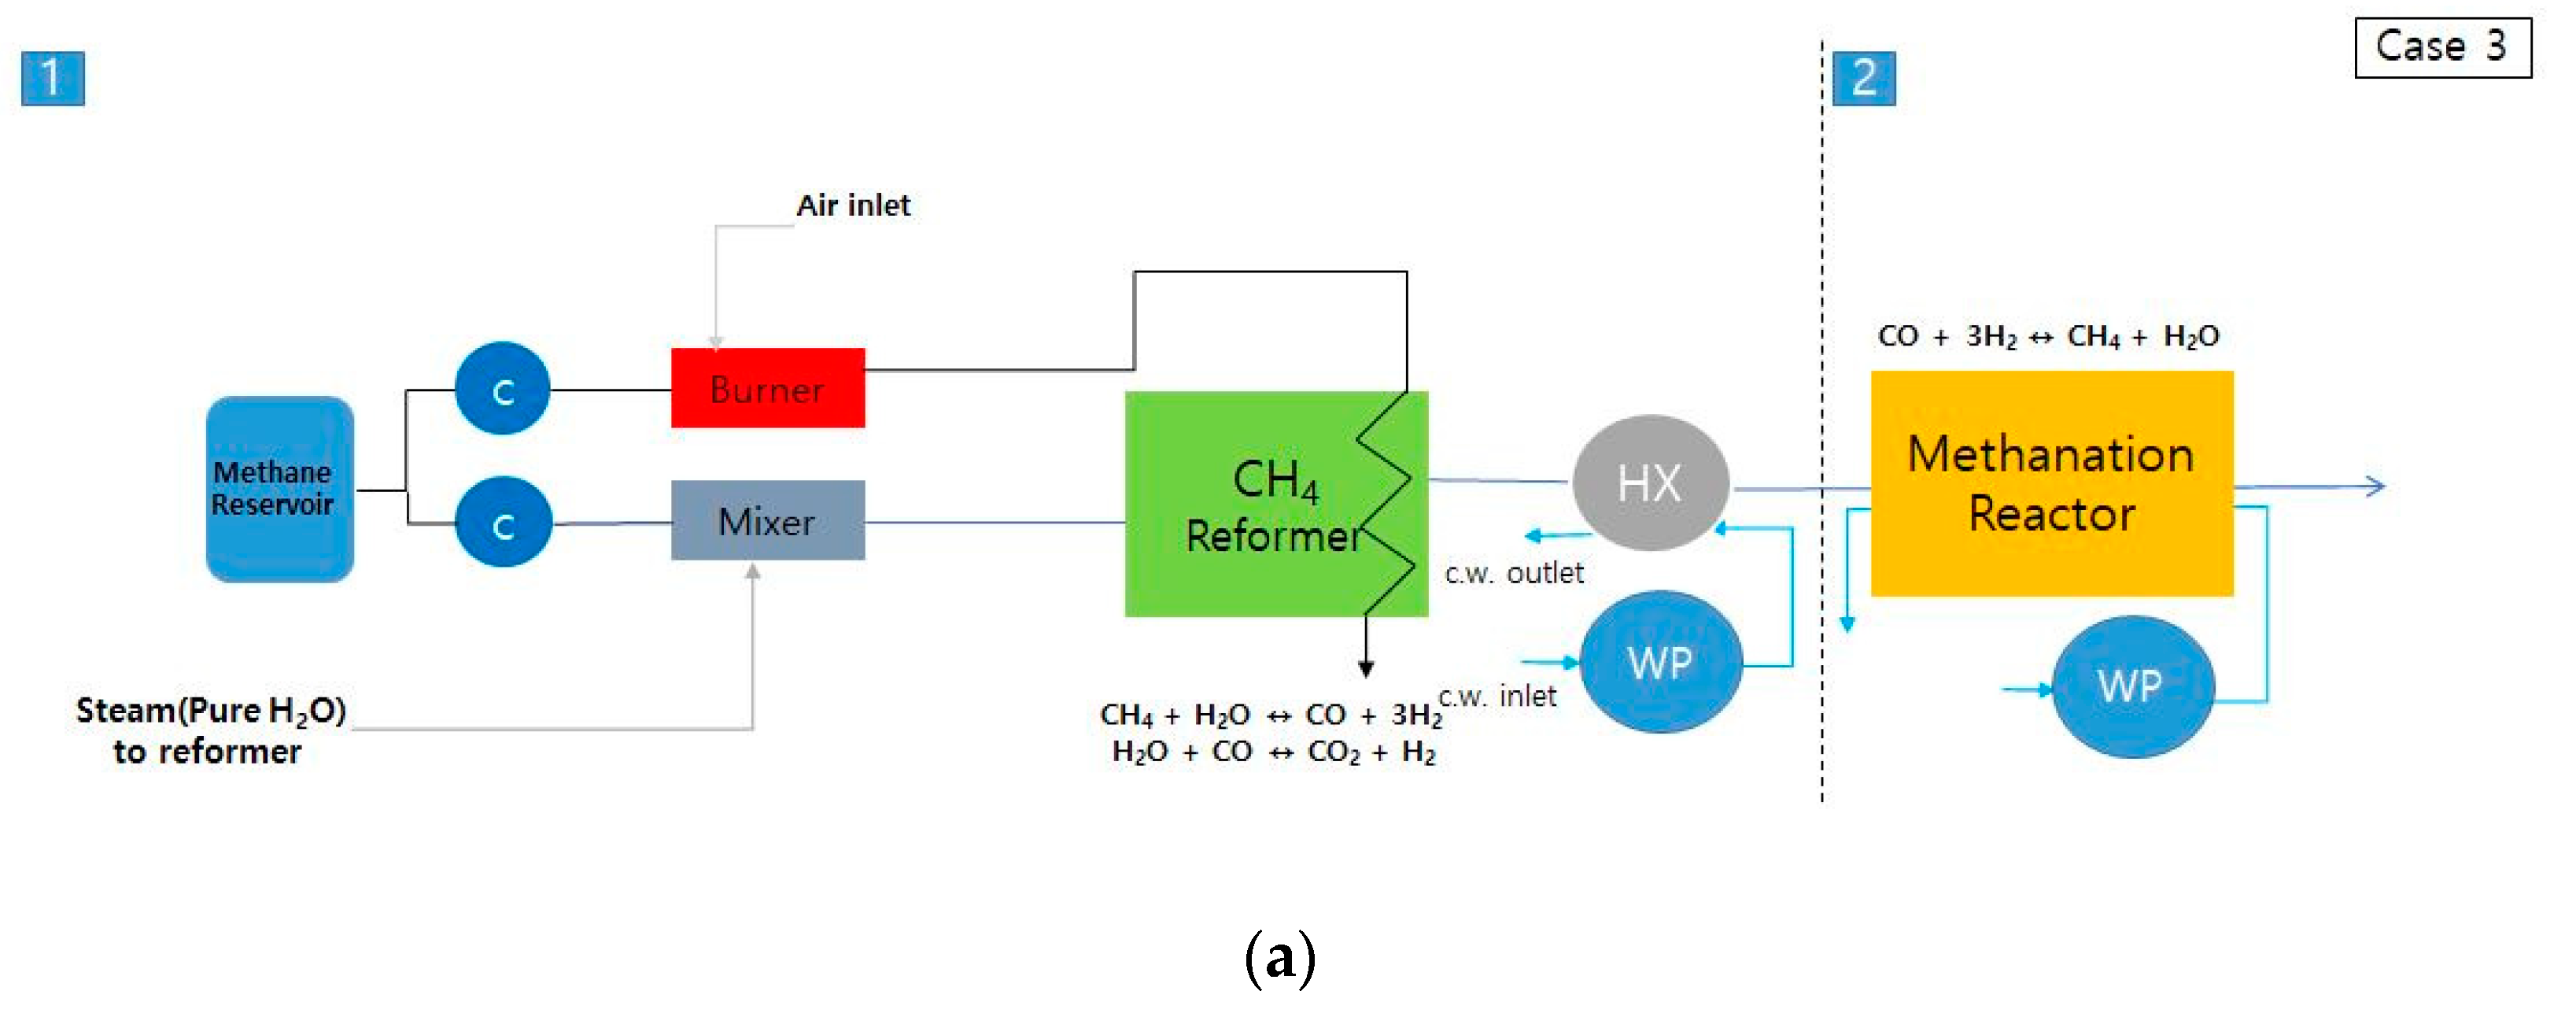
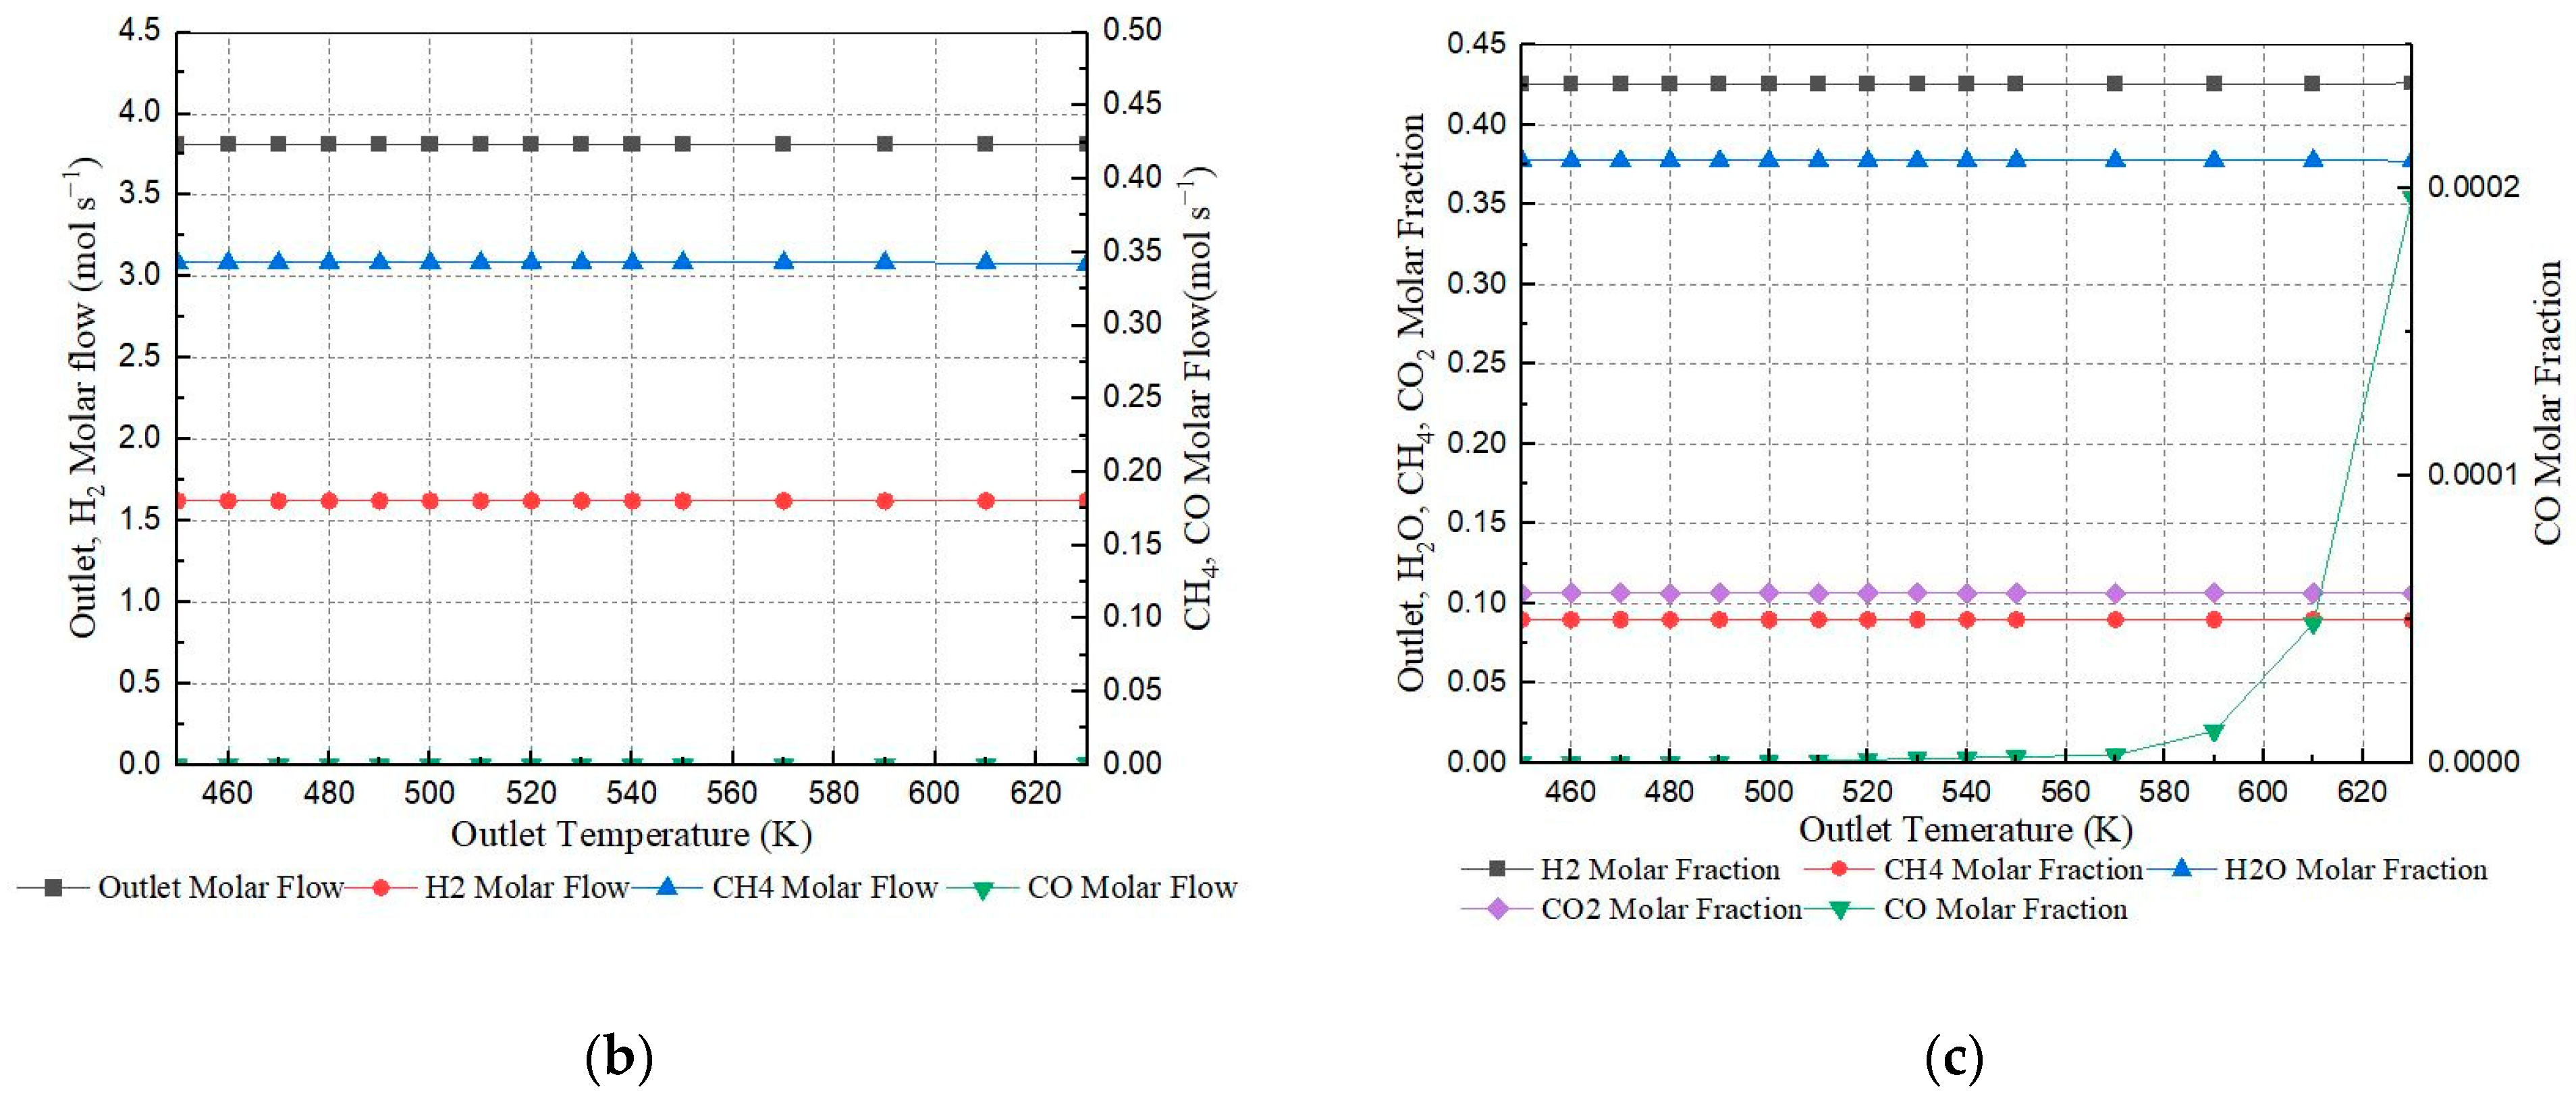
3.2.3. Case 3: Methanation Only
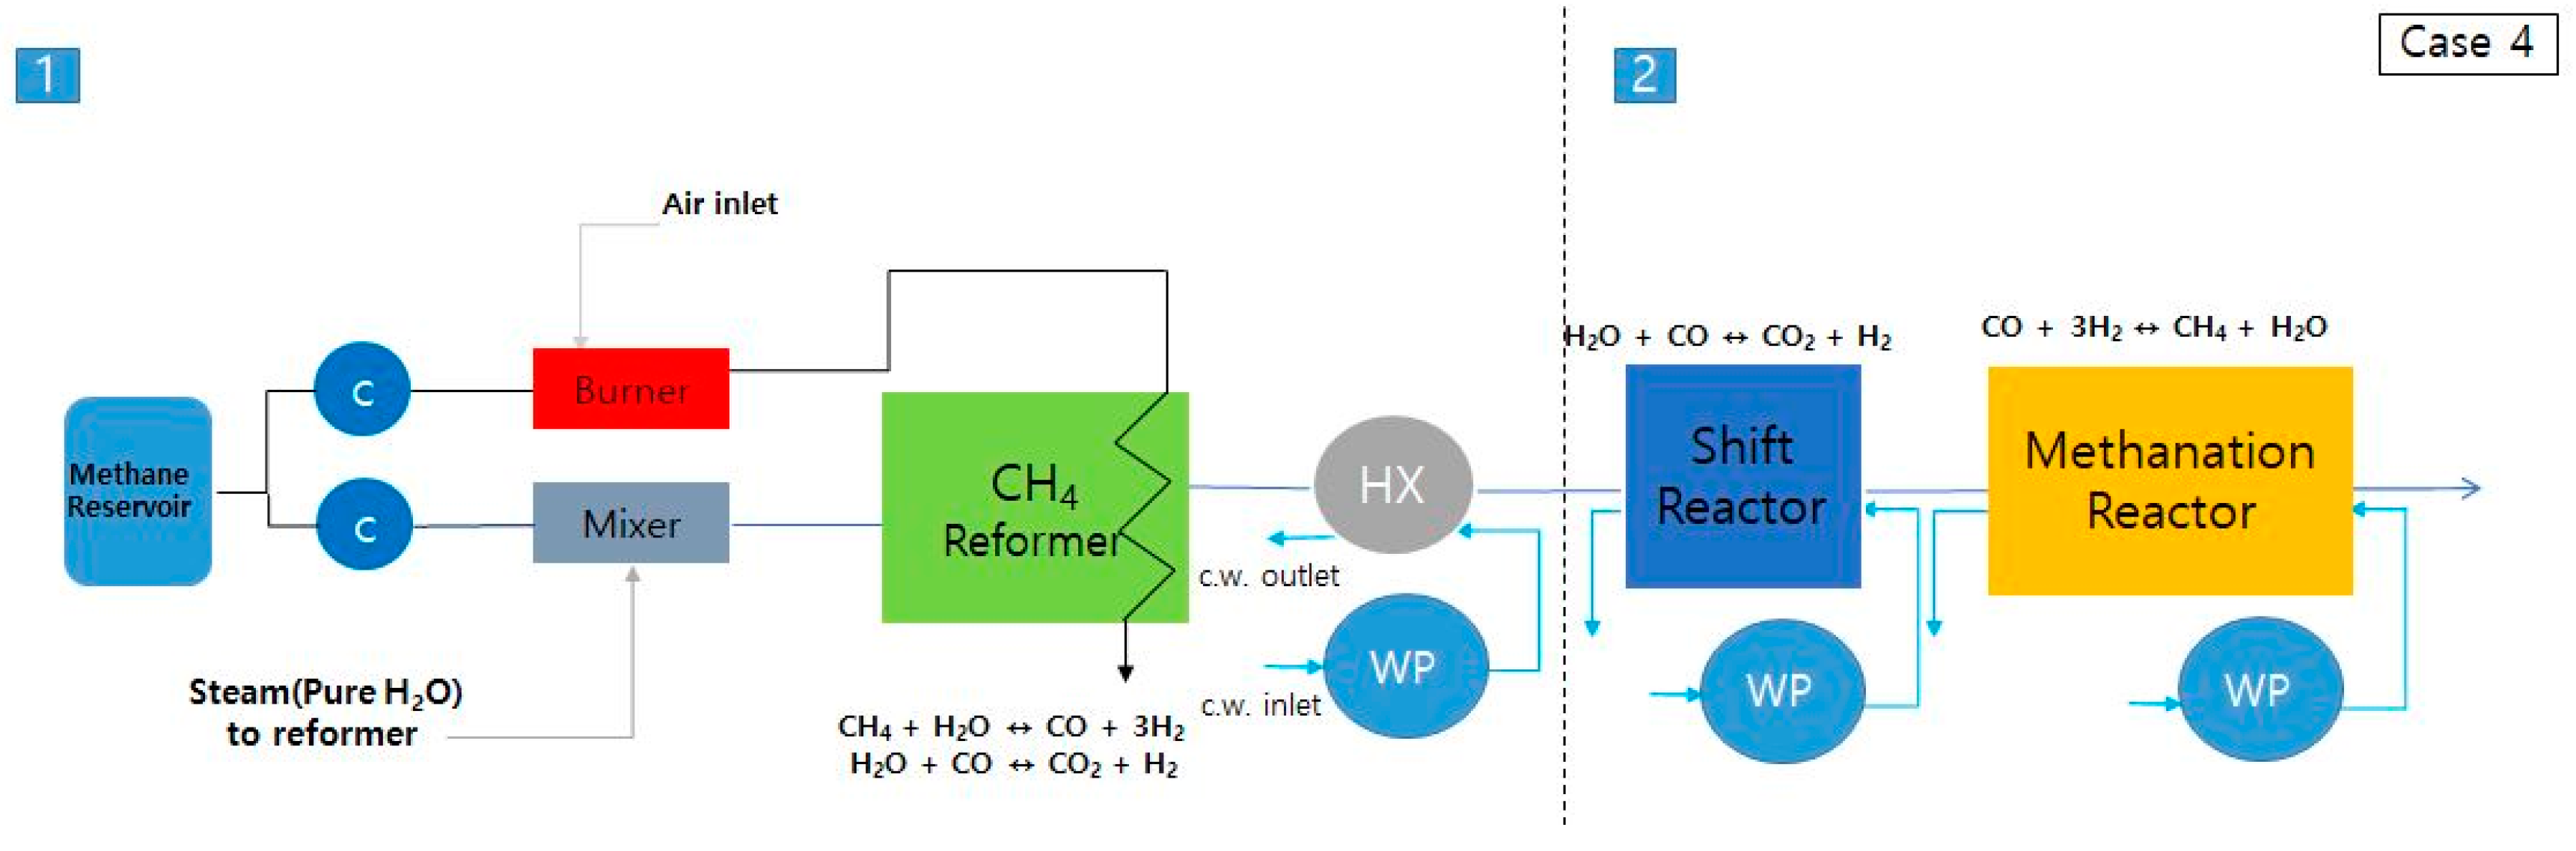
3.2.4. Case 4: WGS + Methanation
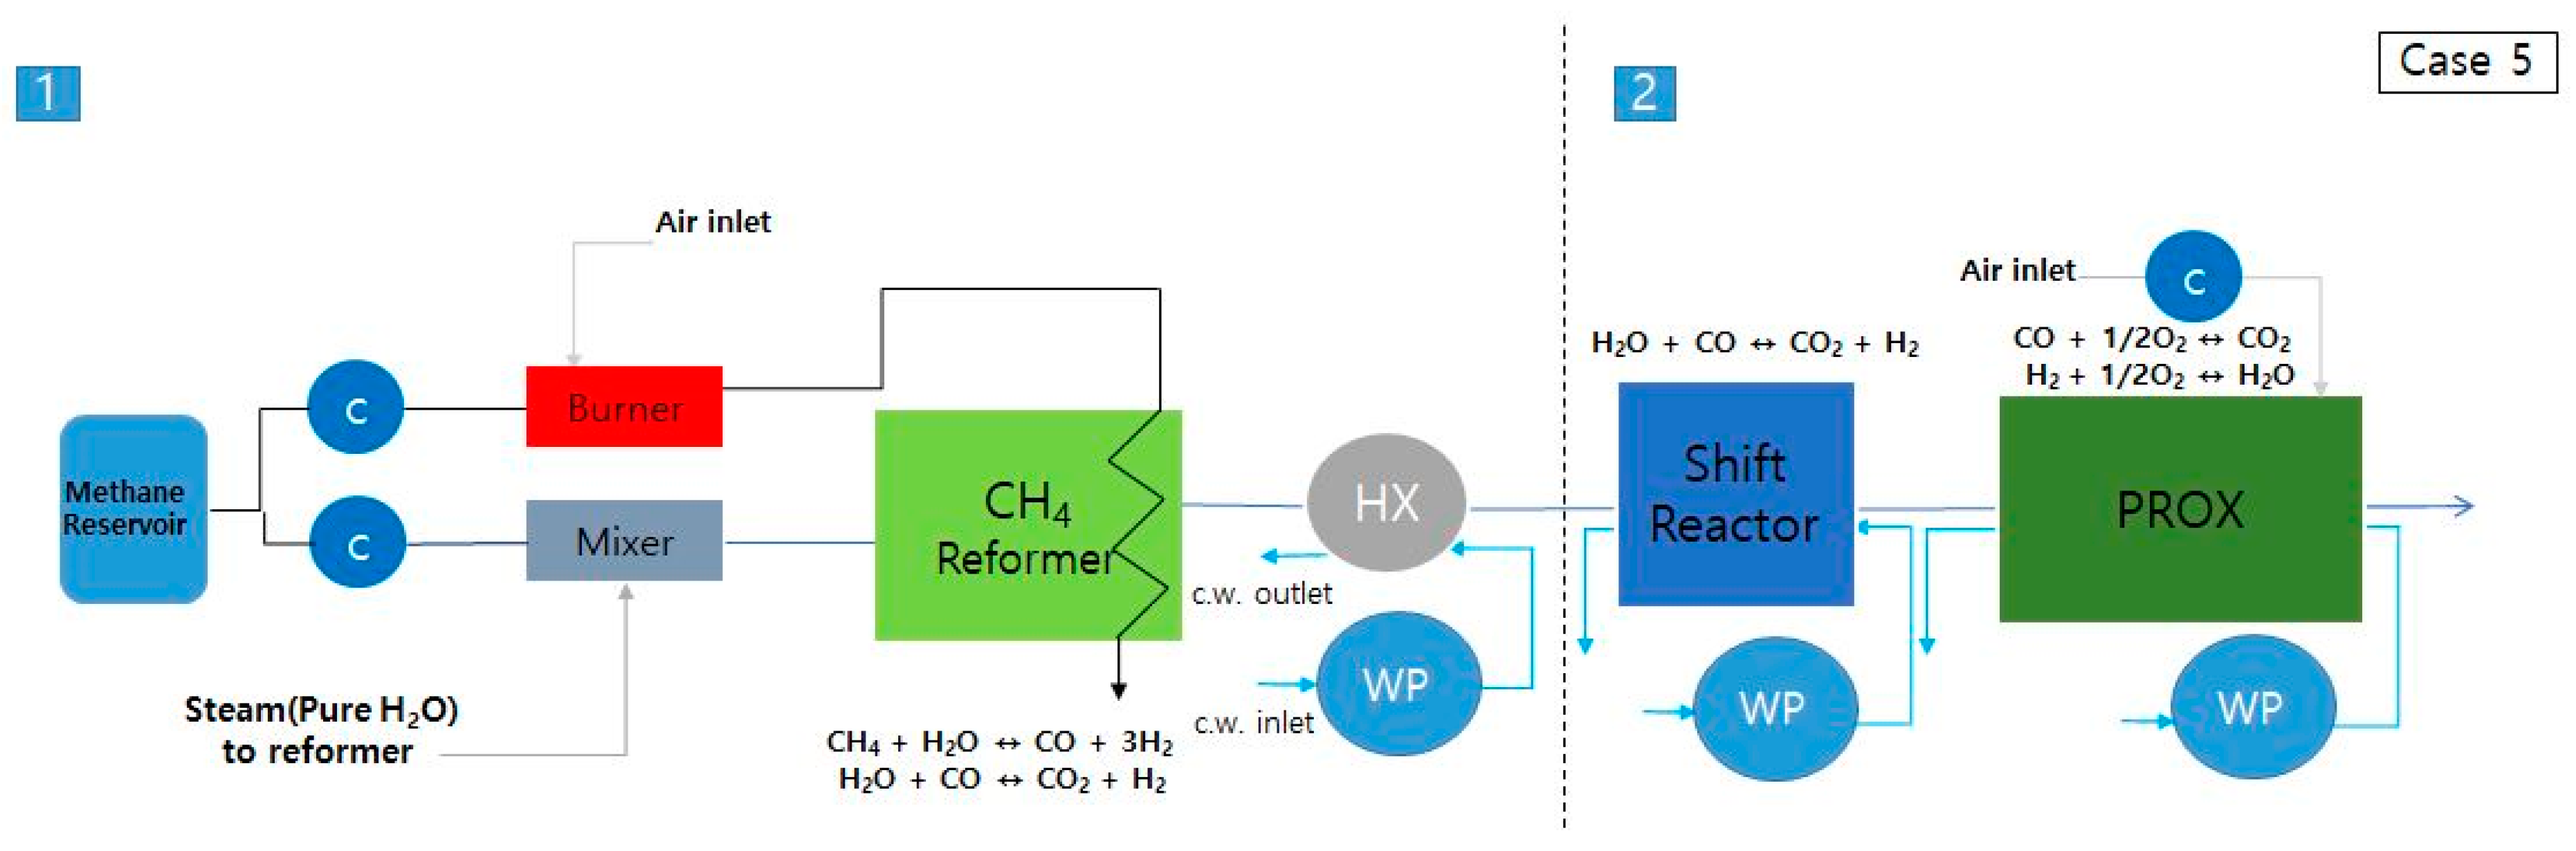
3.2.5. Case 5: WGS + PROX
3.3. Results Analysis
4. Discussion
5. Conclusions
Author Contributions
Funding
Acknowledgments
Conflicts of Interest
References
- Tronstad, T.; Astrand, H.H.; Haugom, G.P.; Langfeldt, L. Study on the Use of Fuel Cells in Shipping; European Maritime Safety Agency: Lisbon, Portugal, 2017. [Google Scholar]
- Van Biert, L.; Godjevac, M.; Visser, K.; Aravind, P.V. A review of fuel cell systems for maritime applications. J. Power Sources 2016, 327, 345–364. [Google Scholar] [CrossRef] [Green Version]
- Kim, M.-H. Performance and Safety Analysis of Marine Solid Oxide Fuel Cell and Gas Turbine Hybrid Power System (under Conditions of Turbine Cooling and Constant TIT). J. Korean Soc. Mar. Eng. 2009, 33, 484–496. [Google Scholar]
- Liso, V.; Olesen, A.C.; Nielsen, M.P.; Kær, S.K. Performance comparison between partial oxidation and methane steam reforming processes for solid oxide fuel cell (SOFC) micro combined heat and power (CHP) system. Energy 2011, 36, 4216–4226. [Google Scholar] [CrossRef]
- Klebanoff, L.E.; Pratt, J.W.; Madsen, R.T.; Caughlan, S.A.M.; Leach, T.S.; Appelgate, T.B., Jr.; Kelety, S.Z.; Wintervoll, H.-C.; Haugom, G.P.; Teo, A.T.Y.; et al. Feasibility of the Zero-V: A Zero-Emission, Hydrogen Fuel-Cell, Coastal Research Vessel; Sandia National Laboratories: Albuquerque, NM, USA, 2018; p. 325. [Google Scholar]
- El Gohary, M.M.; Ammar, N.R.; Seddiek, I.S. Steam and SOFC based reforming options of PEM fuel cells for marine applications. Brodogr. Teor. I Praksa Brodogr. I Pomor. Teh. 2015, 66, 61–76. [Google Scholar]
- Iulianelli, A.; Liguori, S.; Wilcox, J.; Basile, A. Advances on methane steam reforming to produce hydrogen through membrane reactors technology: A review. Catal. Rev. 2016, 58, 1–35. [Google Scholar] [CrossRef]
- Yuan, J.; Ren, F.; Sundén, B. Analysis of chemical-reaction-coupled mass and heat transport phenomena in a methane reformer duct for PEMFCs. Int. J. Heat Mass Transf. 2007, 50, 687–701. [Google Scholar] [CrossRef]
- Salemme, L.; Menna, L.; Simeone, M. Analysis of the energy efficiency of innovative ATR-based PEM fuel cell system with hydrogen membrane separation. Int. J. Hydrog. Energy 2009, 34, 6384–6392. [Google Scholar] [CrossRef]
- Iulianelli, A.; Manzolini, G.; De Falco, M.; Campanari, S.; Longo, T.; Liguori, S.; Basile, A. H2 production by low pressure methane steam reforming in a Pd–Ag membrane reactor over a Ni-based catalyst: Experimental and modeling. Int. J. Hydrog. Energy 2010, 35, 11514–11524. [Google Scholar] [CrossRef]
- Authayanun, S.; Arpornwichanop, A.; Patcharavorachot, Y.; Wiyaratn, W.; Assabumrungrat, S. Hydrogen production from glycerol steam reforming for low-and high-temperature PEMFCs. Int. J. Hydrogen Energy 2011, 36, 267–275. [Google Scholar] [CrossRef]
- Ahn, S.H.; Choi, I.; Kwon, O.J.; Kim, J.J. Hydrogen production through the fuel processing of liquefied natural gas with silicon-based micro-reactors. Chem. Eng. J. 2014, 247, 9–15. [Google Scholar] [CrossRef]
- Hamid, M.K.A.; Ibrahim, N.; Ibrahim, K.A.; Ahmad, A. Simulation of hydrogen production for mobile fuel cell applications via autothermal reforming of methane. In Proceedings of the 1st International Conference on Natural Resources Engineering & Technology, Putrajaya, Malaysia, 24–25 July 2006; Citeseer: University Park, PA, USA, 2006. [Google Scholar]
- Lin, S.-T.; Chen, Y.-H.; Yu, C.-C.; Liu, Y.-C.; Lee, C.-H. Modelling an experimental methane fuel processor. J. Power Sources 2005, 148, 43–53. [Google Scholar] [CrossRef]
- Xu, J.; Froment, G.F. Methane steam reforming, methanation and water-gas shift: I. Intrinsic kinetics. AIChE J. 1989, 35, 88–96. [Google Scholar]
- Nakagawa, N.; Sagara, H.; Kato, K. Catalytic activity of Ni–YSZ–CeO2 anode for the steam reforming of methane in a direct internal-reforming solid oxide fuel cell. J. Power Sources 2001, 92, 88–94. [Google Scholar] [CrossRef]
- Clarke, S.H.; Dicks, A.; Pointon, K.; Smith, T.A.; Swann, A. Catalytic aspects of the steam reforming of hydrocarbons in internal reforming fuel cells. Catal. Today 1997, 38, 411–423. [Google Scholar] [CrossRef]
- Dicks, A.L. Hydrogen generation from natural gas for the fuel cell systems of tomorrow. J. Power Sources 1996, 61, 113–124. [Google Scholar] [CrossRef]
- Belyaev, V.; Politova, T.; Mar’Ina, O.; Sobyanin, V. Internal steam reforming of methane over Ni-based electrode in solid oxide fuel cells. Appl. Catal. A Gen. 1995, 133, 47–57. [Google Scholar] [CrossRef]
- Ahmed, K.; Foger, K. Kinetics of internal steam reforming of methane on Ni/YSZ-based anodes for solid oxide fuel cells. Catal. Today 2000, 63, 479–487. [Google Scholar] [CrossRef]
- Achenbach, E.; Riensche, E. Methane/steam reforming kinetics for solid oxide fuel cells. J. Power Sources 1994, 52, 283–288. [Google Scholar] [CrossRef]
- Heinzel, A.; Vogel, B.; Hübner, P. Reforming of natural gas—hydrogen generation for small scale stationary fuel cell systems. J. Power Sources 2002, 105, 202–207. [Google Scholar] [CrossRef]
- Cheekatamarla, P.K.; Finnerty, C. Finnerty. Reforming catalysts for hydrogen generation in fuel cell applications. J. Power Sources 2006, 160, 490–499. [Google Scholar] [CrossRef]
- Meusinger, J.; Riensche, E.; Stimming, U. Stimming. Reforming of natural gas in solid oxide fuel cell systems. J. Power Sources 1998, 71, 315–320. [Google Scholar] [CrossRef]
- Calise, F.; D’Accadia, M.D.; Palombo, A.; Vanoli, L. Simulation and exergy analysis of a hybrid solid oxide fuel cell (SOFC)–gas turbine system. Energy 2006, 31, 3278–3299. [Google Scholar] [CrossRef]
- Peters, R.; Dahl, R.; Klüttgen, U.; Palm, C.; Stolten, D. Internal reforming of methane in solid oxide fuel cell systems. J. Power Sources 2002, 106, 238–244. [Google Scholar] [CrossRef]
- Chaniotis, A.; Poulikakos, D. Modeling and optimization of catalytic partial oxidation methane reforming for fuel cells. J. Power Sources 2005, 142, 184–193. [Google Scholar] [CrossRef]
- Akbari, M.; Ardakani, A.S.; Tadbir, M.A. A microreactor modeling, analysis and optimization for methane autothermal reforming in fuel cell applications. Chem. Eng. J. 2011, 166, 1116–1125. [Google Scholar] [CrossRef]
- Hoang, D.; Chan, S. Modeling of a catalytic autothermal methane reformer for fuel cell applications. Appl. Catal. A Gen. 2004, 268, 207–216. [Google Scholar] [CrossRef]
- Xu, J.; Froment, G.F. Methane steam reforming: II. Diffusional limitations and reactor simulation. AIChE J. 1989, 35, 97–103. [Google Scholar] [CrossRef]
- Kim, S.H.; Nam, S.-W.; Lim, T.-H.; Lee, H.-I. Effect of pretreatment on the activity of Ni catalyst for CO removal reaction by water–gas shift and methanation. Appl. Catal. B Environ. 2008, 81, 97–104. [Google Scholar] [CrossRef]
- Elnashaie, S.; Abashar, M. Steam reforming and methanation effectiveness factors using the dusty gas model under industrial conditions. Chem. Eng. Process. Process Intensif. 1993, 32, 177–189. [Google Scholar] [CrossRef]
- Finnerty, C.M.; Coe, N.J.; Cunningham, R.H.; Ormerod, R. Carbon formation on and deactivation of nickel-based/zirconia anodes in solid oxide fuel cells running on methane. Catal. Today 1998, 46, 137–145. [Google Scholar] [CrossRef]
- EUtech Scientific Engineering GmbH. Thermodynamic System Library, Release 5.4; EUtech Scientific Engineering GmbH: Aachen, Germany, 2016; p. 333. [Google Scholar]
- O’Hayre, R.; Cha, S.-W.; Colella, W.; Prinz, F.B. Fuel Cell Fundamentals; Wiley & Sons: New York, NY, USA, 2016. [Google Scholar]
- Larminie, J.; Dicks, A.; McDonald, M.S. Fuel Cell Systems Explained; Wiley: Chichester, UK, 2003; Volume 2. [Google Scholar]
- Molochas, C.; Tsiakaras, P. Carbon Monoxide Tolerant Pt-Based Electrocatalysts for H2-PEMFC Applications: Current Progress and Challenges. Catalysts 2021, 11, 1127. [Google Scholar] [CrossRef]
- Garbis, P.; Kern, C.; Jess, A. Kinetics and reactor design aspects of selective methanation of CO over a Ru/γ-Al2O3 catalyst in CO2/H2 rich gases. Energies 2019, 12, 469. [Google Scholar] [CrossRef]


| Outlet Temp. [K] | Molar flow [mol s−1] | Molar Fraction | |||||||
|---|---|---|---|---|---|---|---|---|---|
| Outlet | H2 | Methane Used | CO | H2 | Methane | H2O | CO | CO2 | |
| 860.30 | 4.48 | 2.62416 | 0.73959 | 0.33418 | 0.58612 | 0.00188 | 0.24681 | 0.07464 | 0.09055 |
| Inlet Temp. [K] | Value | After Reformer CO Fraction | After PROX CO Fraction |
|---|---|---|---|
| 323 | 0 | 0.074642219 | 0.063159 |
| 393 | 0.1 | 0.057105 | |
| 403 | 0.5 | 0.054042 | |
| 413 | 0.5 | 0.032221 | |
| 423 | 0.9 | 0.006519 | |
| 433 | 0.95 | 0.003263 |
| Inlet Temp. [K] | Value | After Reformer H2 Fraction | After PROX H2 Fraction | After Reformer O2 Fraction | After PROX O2 Fraction | After Reformer CO Fraction | After PROX CO Fraction |
|---|---|---|---|---|---|---|---|
| 323 | 0.9 | 0.5861222 | 0.511425 | 0.0321567 | 0.0019884 | 0.0746422 | 0.0032591 |
| 393 | 0.8 | 0.511114 | 0.0017801 | 0.0032598 | |||
| 403 | 0.75 | 0.510959 | 0.0016759 | 0.0032601 | |||
| 413 | 0.6 | 0.510492 | 0.0013631 | 0.0032611 | |||
| 423 | 0.45 | 0.510025 | 0.0010501 | 0.0032622 | |||
| 433 | 0.4 | 0.509870 | 0.0009457 | 0.0032625 |
| Inlet Temp. [K] | Selectivity Value | Efficiency Value | After Reformer H2 Fraction | After PROX H2 Fraction |
|---|---|---|---|---|
| 323 | 0.9 | 0 | 0.586122238 | 0.49638 |
| 393 | 0.8 | 0.1 | 0.49707 | |
| 403 | 0.75 | 0.5 | 0.497182 | |
| 413 | 0.6 | 0.5 | 0.499353 | |
| 423 | 0.45 | 0.9 | 0.508082 | |
| 433 | 0.4 | 0.95 | 0.50987 |
| Outlet Temp. [K] | Molar Flow [mol s−1] | Molar Fraction | |||||||
|---|---|---|---|---|---|---|---|---|---|
| Outlet | H2 | Methane | CO | H2 | Methane | H2O | CO | CO2 | |
| 480.68 | 4.480 | 2.947 | 0.008 | 0.013 | 0.658 | 0.002 | 0.175 | 0.003 | 0.162 |
| Outlet Temp. [K] | Molar Flow [mol s−1] | Molar Fraction | |||||||
|---|---|---|---|---|---|---|---|---|---|
| Outlet | H2 | Methane | CO | H2 | Methane | H2O | CO | CO2 | |
| 499.75 | 4.453 | 2.906 | 0.022 | 0 | 0.653 | 0.005 | 0.179 | 0 | 0.163 |
| Outlet Temp. [K] | Molar Flow [mol s−1] | Molar Fraction | |||||||||
|---|---|---|---|---|---|---|---|---|---|---|---|
| Outlet | H2 | Methane | CO | H2 | Methane | H2O | CO | CO2 | O2 | N2 | |
| 443.57 | 5.566 | 2.642 | 0.008 | 4.05 × 10⁻⁵ | 0.475 | 0.002 | 0.196 | 7.27 × 10⁻⁶ | 0.133 | 0.018 | 0.177 |
| Molar Flow [mol s−1] | Molar Fraction | ||||||||||
|---|---|---|---|---|---|---|---|---|---|---|---|
| Outlet | H2 | Methane | CO | H2 | Methane | H2O | CO | CO2 | O2 | N2 | |
| WGS (Case 1) | 4.480 | 2.947 | 0.008 | 0.013 | 0.658 | 0.002 | 0.175 | 0.003 | 0.162 | - | - |
| PROX (Case 2) | 5.838 | 2.419 | 0.008 | 0.017 | 0.414 | 0.001 | 0.225 | 0.003 | 0.124 | 0.013 | 0.219 |
| Methanation (Case 3) | 3.811 | 1.623 | 0.343 | 0 | 0.426 | 0.090 | 0.378 | 0 | 0.106 | - | - |
| WGS + Methanation (Case 4) | 4.453 | 2.906 | 0.022 | 0 | 0.653 | 0.005 | 0.179 | 0 | 0.163 | - | - |
| WGS + PROX (Case 5) | 5.566 | 2.642 | 0.008 | 4.05 × 10⁻⁵ | 0.475 | 0.002 | 0.196 | 7.27 × 10⁻⁶ | 0.133 | 0.018 | 0.177 |
| Type of Post-Treatment System | Satisfaction of CO Standard Concentration (≤10 ppm) | Eco-Friendly (Methane Regeneration) |
|---|---|---|
| WGS (Case 1) | Bad | Good |
| PROX (Case 2) | Bad | Good |
| Methanation (Case 3) | Good | Bad |
| WGS + Methanation (Case 4) | Good | Bad |
| WGS + PROX (Case 5) | Good | Good |
Publisher’s Note: MDPI stays neutral with regard to jurisdictional claims in published maps and institutional affiliations. |
© 2022 by the authors. Licensee MDPI, Basel, Switzerland. This article is an open access article distributed under the terms and conditions of the Creative Commons Attribution (CC BY) license (https://creativecommons.org/licenses/by/4.0/).
Share and Cite
Bang, E.-S.; Kim, M.-H.; Park, S.-K. Options for Methane Fuel Processing in PEMFC System with Potential Maritime Applications. Energies 2022, 15, 8604. https://doi.org/10.3390/en15228604
Bang E-S, Kim M-H, Park S-K. Options for Methane Fuel Processing in PEMFC System with Potential Maritime Applications. Energies. 2022; 15(22):8604. https://doi.org/10.3390/en15228604
Chicago/Turabian StyleBang, Eun-Shin, Myoung-Hwan Kim, and Sang-Kyun Park. 2022. "Options for Methane Fuel Processing in PEMFC System with Potential Maritime Applications" Energies 15, no. 22: 8604. https://doi.org/10.3390/en15228604