Article

Techno-Economic Analysis of Renewable-Energy-Based Micro-Grids Considering Incentive Policies

1
Power Systems Modeling & Simulation Lab, Department of Electrical and Computer Engineering, University of Kurdistan, Sanandaj 66177-15175, Iran
2
Department of Electrical Engineering, Sanandaj Branch, Islamic Azad University, Sanandaj 66169-35391, Iran
3
Arts et Metiers Institute of Technology, Centrale Lille, Yncrea Hauts-de-France, ULR 2697-L2EP, F59000 Lille, France
4
GECAD—Research Group on Intelligent Engineering and Computing for Advanced Innovation and Development, LASI—Intelligent Systems Associate Laboratory, Polytechnic of Porto, Rua Dr. Antonio Bernardino de Almeida, 431, 4249-015 Porto, Portugal
*
Author to whom correspondence should be addressed.
Energies 2022, 15(21), 8285; https://doi.org/10.3390/en15218285
Submission received: 10 October 2022 / Revised: 31 October 2022 / Accepted: 3 November 2022 / Published: 6 November 2022

Abstract

:
Renewable-energy-based microgrids (MGs) are being advocated around the world in response to increasing energy demand, high levels of greenhouse gas (GHG) emissions, energy losses, and the depletion of conventional energy resources. However, the high investment cost of the MGs besides the low selling price of the energy to the main grid are two main challenges to realize the MGs in developing countries such as Iran. For this reason, the government should define some incentive policies to attract investor attention to MGs. This paper aims to develop a framework for the optimal planning of a renewable energy-based MG considering the incentive policies. To investigate the effect of the incentive policies on the planning formulation, three different policies are introduced in a pilot system in Iran. The minimum penetration rates of the RESs in the MG to receive the government incentive are defined as 20% and 40% in two different scenarios. The results show that the proposed incentive policies reduce the MG’s total net present cost (NPC) and the amount of carbon dioxide (CO2) emissions. The maximum NPC and CO2 reduction in comparison with the base case (with incentive policies) are 22.87% and 56.13%, respectively. The simulations are conducted using the hybrid optimization model for electric renewables (HOMER) software.

1. Introduction

Producing a large amount of greenhouse gas (GHG) emissions from power plants, high system expansion costs, and high energy losses in the transmission and distribution networks are three main challenges of electrical energy systems. Supplying a large percentage of the electrical demand in developing countries from fossil fuel-based power plants produces a large amount of carbon dioxide (CO2) emissions. Furthermore, the conversion of only one-third of fuel energy into electrical power in bulk power generation units, compounded with the high voltage transmission network’s poor efficiency, makes microgrids (MGs) in distribution networks more viable [1,2]. Realization of MGs, as one of the main components of smart grids, has become an emergent research area in the electrical industry [3]. Due to the high investment cost of the local energy resources, however, realizing the MG concept to satisfy the load is not a very practical plan in developing countries. Therefore, it seems that incentive policies should be defined by the government to encourage investors to realize the renewable energy sources (RESs)-based MG. Hence, this paper aims to formulate an optimal plan for a RESs-based MG considering the incentive policies which in turn decrease the net present cost (NPC) and CO2 emission.
There are many studies on the optimal planning of MGs to meet the load from different viewpoints. A comprehensive review of the optimal design of MGs in grid-connected and stand-alone modes is undertaken in [4]. The authors of [5] performed a technical and economic feasibility study using a hybrid optimization model for electric renewable (HOMER) pro version 3.12.2. The optimal planning formulation of the MGs considering electric vehicles (EVs) was investigated using the multi-objective particle swarm optimization (PSO) approach in [6]. A combination of a photovoltaic (PV) system, wind power, and a battery was proposed as the best plan to satisfy the load of a community area in Egypt using HOMER software in [7]. The authors of [8] employed HOMER to calculate an optimal plan, consisting of a PV system, wind turbine, and biomass, to supply the load in China. The MG configuration consisting of a PV system, and biomass was determined to meet electrical energy needs in a rural area in India [9]. An MG based on renewable energy sources was designed for an urban area in Egypt using the HOMER [10]. Several studies have also been performed in Iran to investigate the deployment of RES-based MGs for a variety of applications, including educational buildings [11], rural areas [12,13,14], and residential buildings [15,16,17]. However, the majority of these works have concentrated on the feasibility of using stand-alone MG and NPC minimization. Furthermore, the research so far fails to consider incentive policies in the problem formulation. Table 1 summarizes the contributions of the research so far in the state of the art.
Investigating the effect of RES incentive policies on the power system studies is undertaken in several studies. In general, these policies can be divided into two categories: (1) price-based, and (2) quantity-based policies. In the early one, the power from RESs is purchased at a specific price, which can be fixed or variable for different periods. Later, the governments announce the scheduled RES capacity, and the selling energy price is decided by the supply and demand mechanism. Currently, the feed-in-tariff (FIT) policy, as a fixed-price-based policy, is implemented in most countries [38,39]. The effect of several incentive policies on the increasing penetration rate of PV systems in China was investigated in [40] using a leader–follower approach. In [41], the effect of incentive policies on the reduction of GHG emissions was investigated. The generation expansion planning (GEP) problem was addressed in [42] and [43] regarding the need for incentive policies to employ diesel generators (DGs) and RESs to supply the demand of the systems, respectively. The financial mechanism was addressed in [44] to enhance the usage of electrical energy storage in electrical power systems.
Investigation of the previous studies shows that although incentive policies should be defined to increase the penetration rate of renewable-energy-based MGs, this issue is not properly addressed in the literature. More precisely, the incentive policies in the research so far are impractical for developing countries. Furthermore, the researches fails to simultaneously consider NPC, CO2 emissions reduction, and incentive policies. Therefore, this study investigates the planning problem of a renewable-energy-based MG for an educational complex in Iran considering incentive policies. Three new incentive policies, appropriate for developing as well as developed countries, are developed in which the NPC and the quantity of CO2 emissions are taken into account. It should be noted that the considered incentive policies are technically feasible, scalable, and implementable in real power systems. Therefore, the following are the key contributions of this paper:
  • Tackling the incentive policies of the governments in the optimal planning problem formulation of grid-connected RES-based MGs;
  • Determining the optimum size of the RES-based MG’s components considering three new incentive policies;
  • Investigating the social, economic, and technical impacts of grid-connected RES-based MGs in developing countries;
  • Proposing a strategy for implementing incentive policies in commercial software.
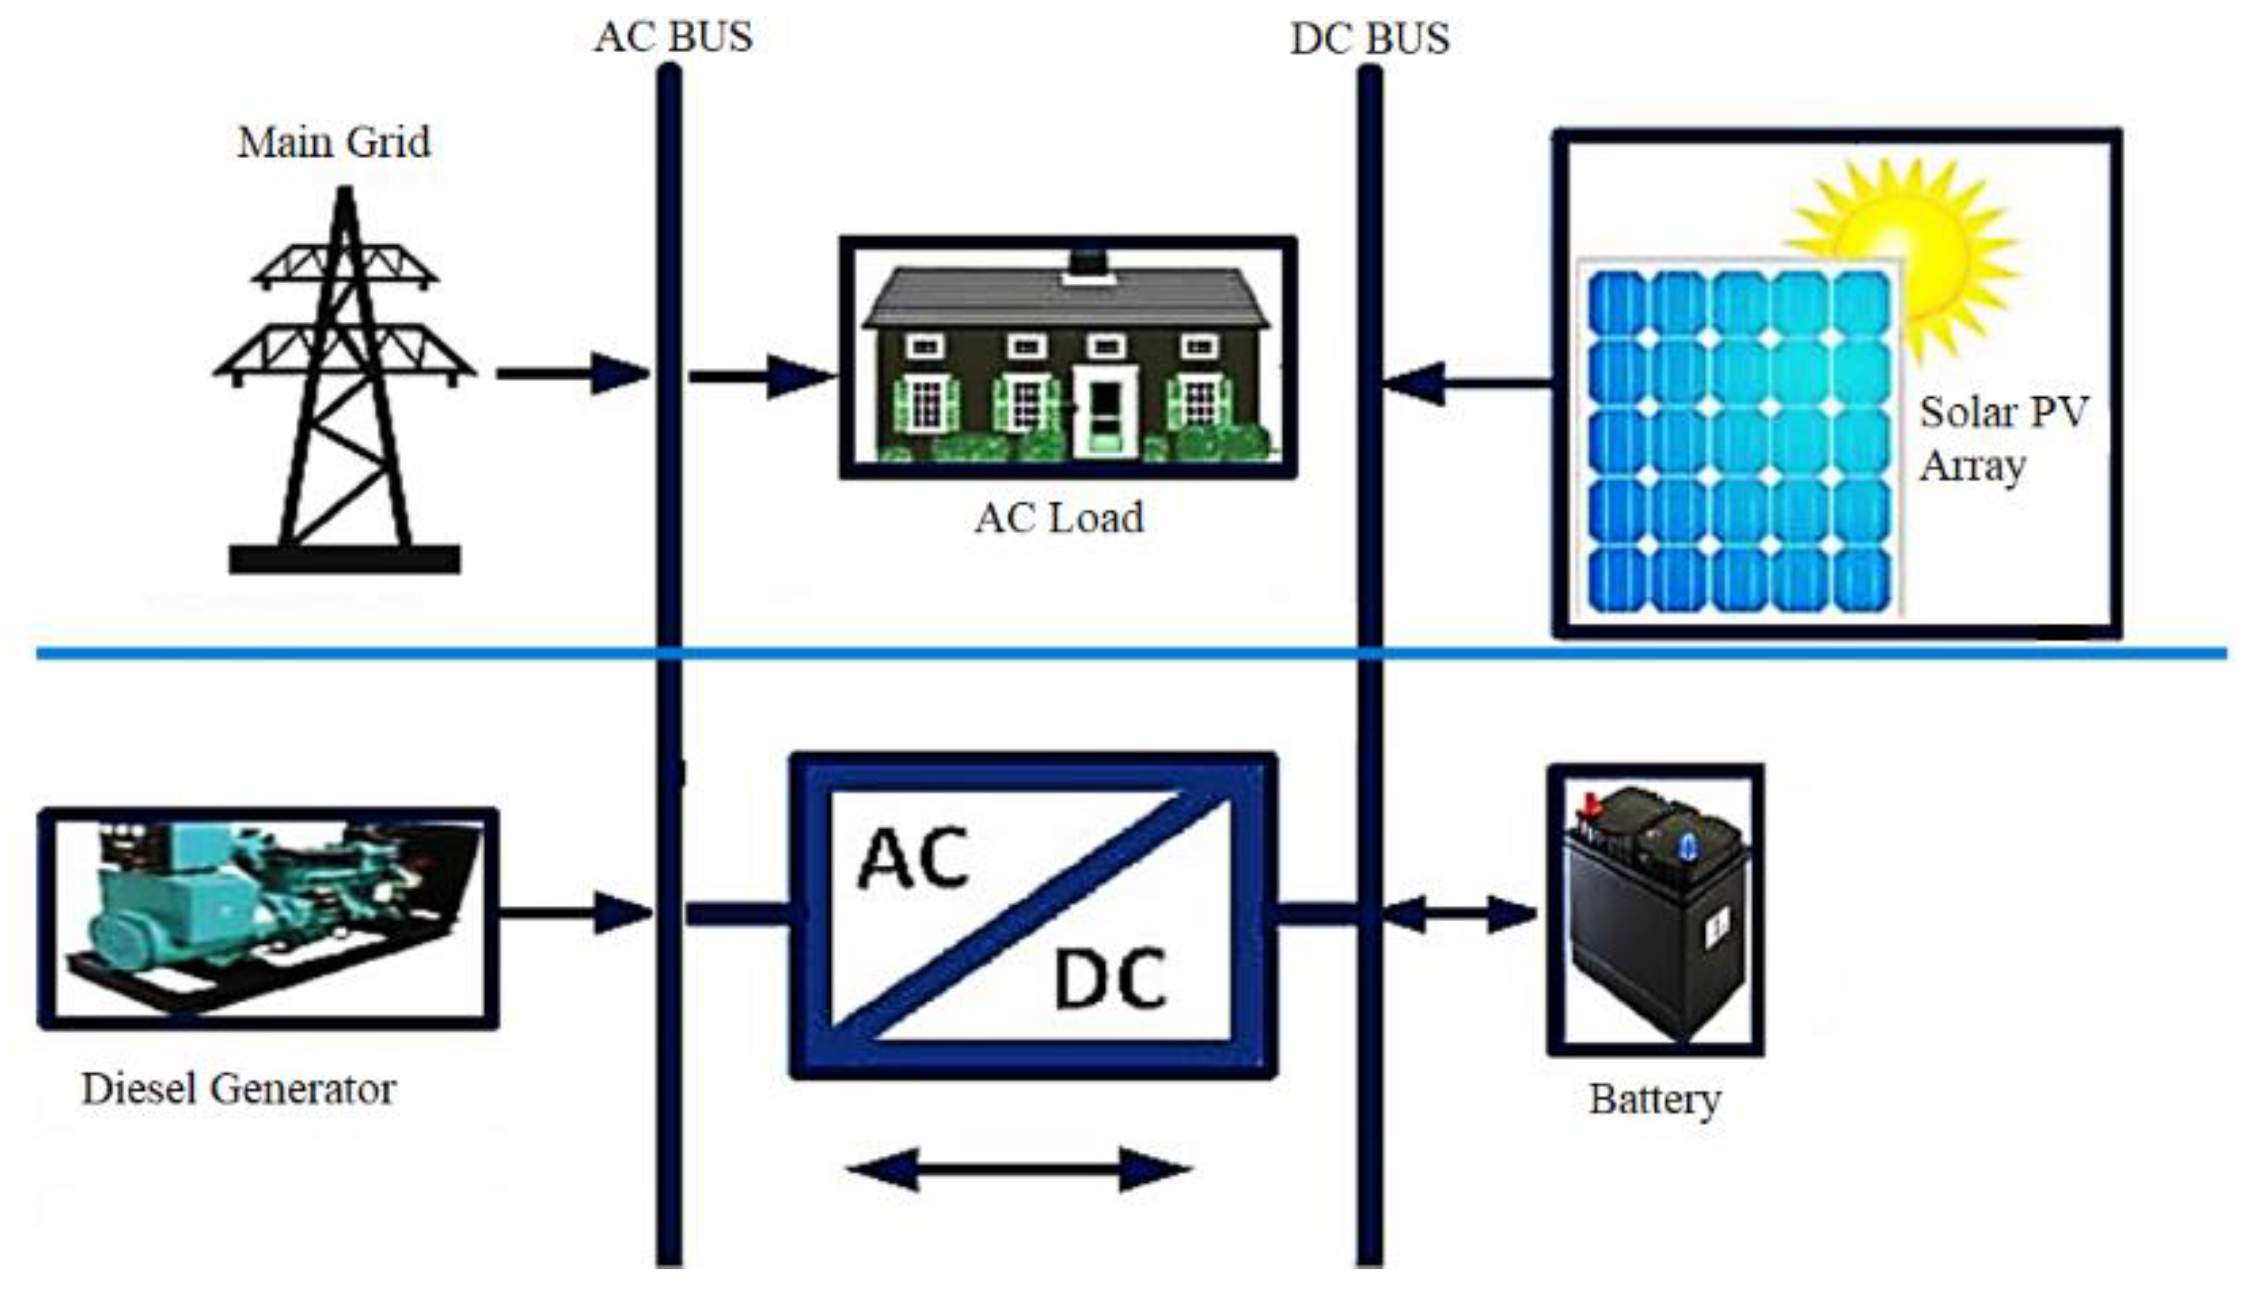
2. System Modeling

A two-pronged method is used to simulate the intended MG: (1) modeling of components, and (2) modeling of economics. The MG components help in planning the net power generation, while the economic model facilitates estimating whether the desired model is feasible or not.

2.1. System Components Modeling

2.1.1. Solar Photovoltaic Panel Modeling

Solar radiation and temperature may influence the performance of the PV system. The PV generation is calculated using [22]:
P t PV = P ¯ PV D PV S R t PV S R PV_Stan . 1 + α p T t PV T PV_Stan .
where P ¯ PV refers to the PV system’s power output under standard test conditions [kW]. The PV system de-rating factor is a scaling factor that is applied to the PV array power output to account for lower output in real-world operating circumstances than when the PV panel was rated. In this paper, to simulate realistic conditions, the de-rating factor of 90% is considered owing to the changing effect of dust and temperature.

2.1.2. Diesel Generator Modeling

The model of a fuel-based DG is assumed to be a straight-line curve. Thus, electrical output is computed by
F t DG = A   P ¯ DG + B   P t DG

2.1.3. Battery System

The excess PV energy is stored in the battery and utilized when needed. This paper uses a battery to store the extra power generated from PV panels. The supplementary battery energy and prime movers are calculated as [45,46]:
Q B a t = Q B a t , 0 + 0 t V B a t I B a t d t
The battery state of charge (SOC) can be calculated as [47]:
S O C Δ t = S O C 0 0 Δ t ξ p t d t E E S S , r a t e d
where
ξ = ξ c p t < 0 1 ξ d p t > 0
and p(t) is battery power which has negative values for the charging procedure and positive values for the discharging period, EESS,rated, Δt, ζc, and ζd are the nominal energy capacity, charge/discharge time, and charging and discharging efficiencies of the battery, respectively.
The total amount of energy stored in the storage component at any time is the sum of the available and bound energy. The energy that is quickly available for conversion to DC power is known as available energy (Q1); in contrast, the energy that is chemically bonded and hence not immediately available for transmission is known as bound energy (Q2). Hence, one could write:
Q = Q1 + Q2
The greatest amount of power that the battery can store over a certain period is described by [22]:
P B a t , c max , k b m = k Q 1 e k Δ t + Q k c 1 e k Δ t 1 e k Δ t + c k Δ t 1 + e k Δ t
where k and c are set to 2.12 h−1 and 0.305, respectively. Similarly, the maximum amount of power that the storage may discharge over a given period (∆t) can be computed by [22]:
P B a t , d max , k b m = k c Q max + k Q 1 e k Δ t + Q k c 1 e k Δ t 1 e k Δ t + c k Δ t 1 + e k Δ t
After determining the actual charge or discharge power, the following two equations are used to determine the amount of available energy at the end of ∆t [22]:
Q 1 , e n d = Q 1 e k Δ t + Q k c p 1 e k Δ t k + p c k Δ t 1 + e k Δ t k
Furthermore, one has (9) for the bound energy at the end of ∆t as
Q 2 , e n d = Q 2 e k Δ t + Q 1 c 1 e k Δ t + p 1 c k Δ t 1 + e k Δ t k

2.1.4. Converter

The output power of the inverter-based source is calculated as:
P t out_inv . = P t in_inv . × η Inverter

2.2. Economical Modeling

2.2.1. Net Present Cost

The NPC of a system is HOMER’s main economic output, which is the present value of all costs incurred minus the present value of all revenue earned over the system’s lifetime. Investment costs, replacement costs, operation, and maintenance (O&M) costs, pollution penalties, fuel costs, and grid power purchase costs are incorporated into the problem formulation. Salvage value and grid sales revenue are two sources of revenue.

2.2.2. Total Annualized Cost

The COE is defined as the system’s average cost per kWh. In MGs with non-thermal load, COE is calculated as [48]:
C O E = C Annual P Demand
where C Annual is expressed by:
C Annual = C R F × N P C
The CRF in Equation (12) is defined as
C R F i , N = i 1 + i N 1 + i N 1

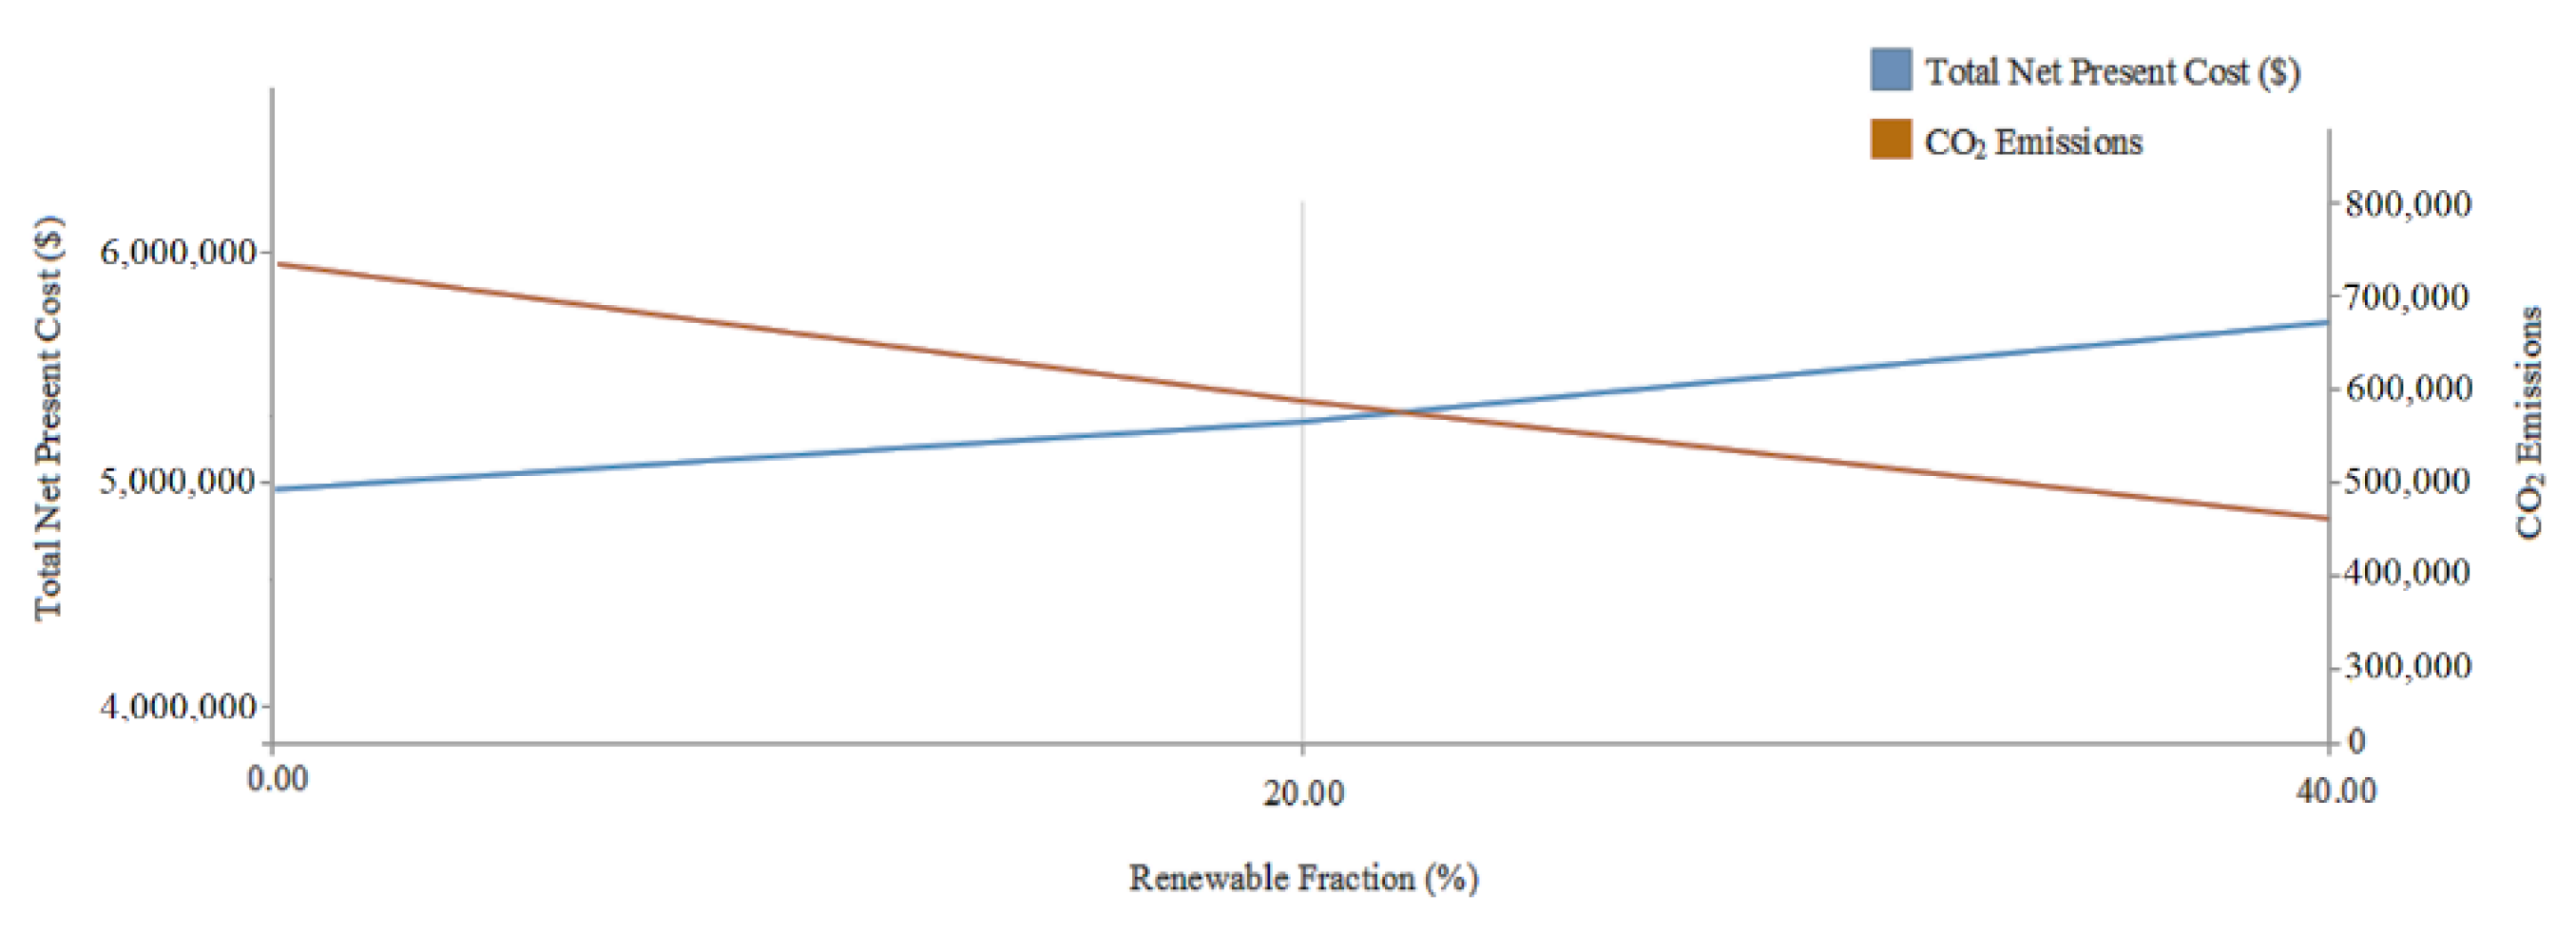
2.2.3. Renewable Fraction

The renewable fraction (RF), defined as the percentage of load supplied by RESs, is calculated as:
R F = 1 E Production E Supplied × 100
where the energy sold to the grid is included in E Supplied .

2.3. CO2 Emissions Calculation

The HOMER calculates the CO2 emissions from two points of view as follows:
Generator: Before simulating the power system, the software estimates the emissions factor (kg of pollutant emitted per unit of fuel consumed) for each pollutant. The annual emissions are computed by multiplying the emissions factor by the total annual fuel consumption.
Main grid: To calculate emissions, HOMER multiplies net grid purchased power (in kWh) by the emission factor (in g/kWh) for each pollutant. The net grid purchased power is defined as
N e t   g r i d   p u r c h a s e s = E Supplied E Production

3. Input Data

This section is devoted to describing the required input data for the formulation of the proposed planning problem.

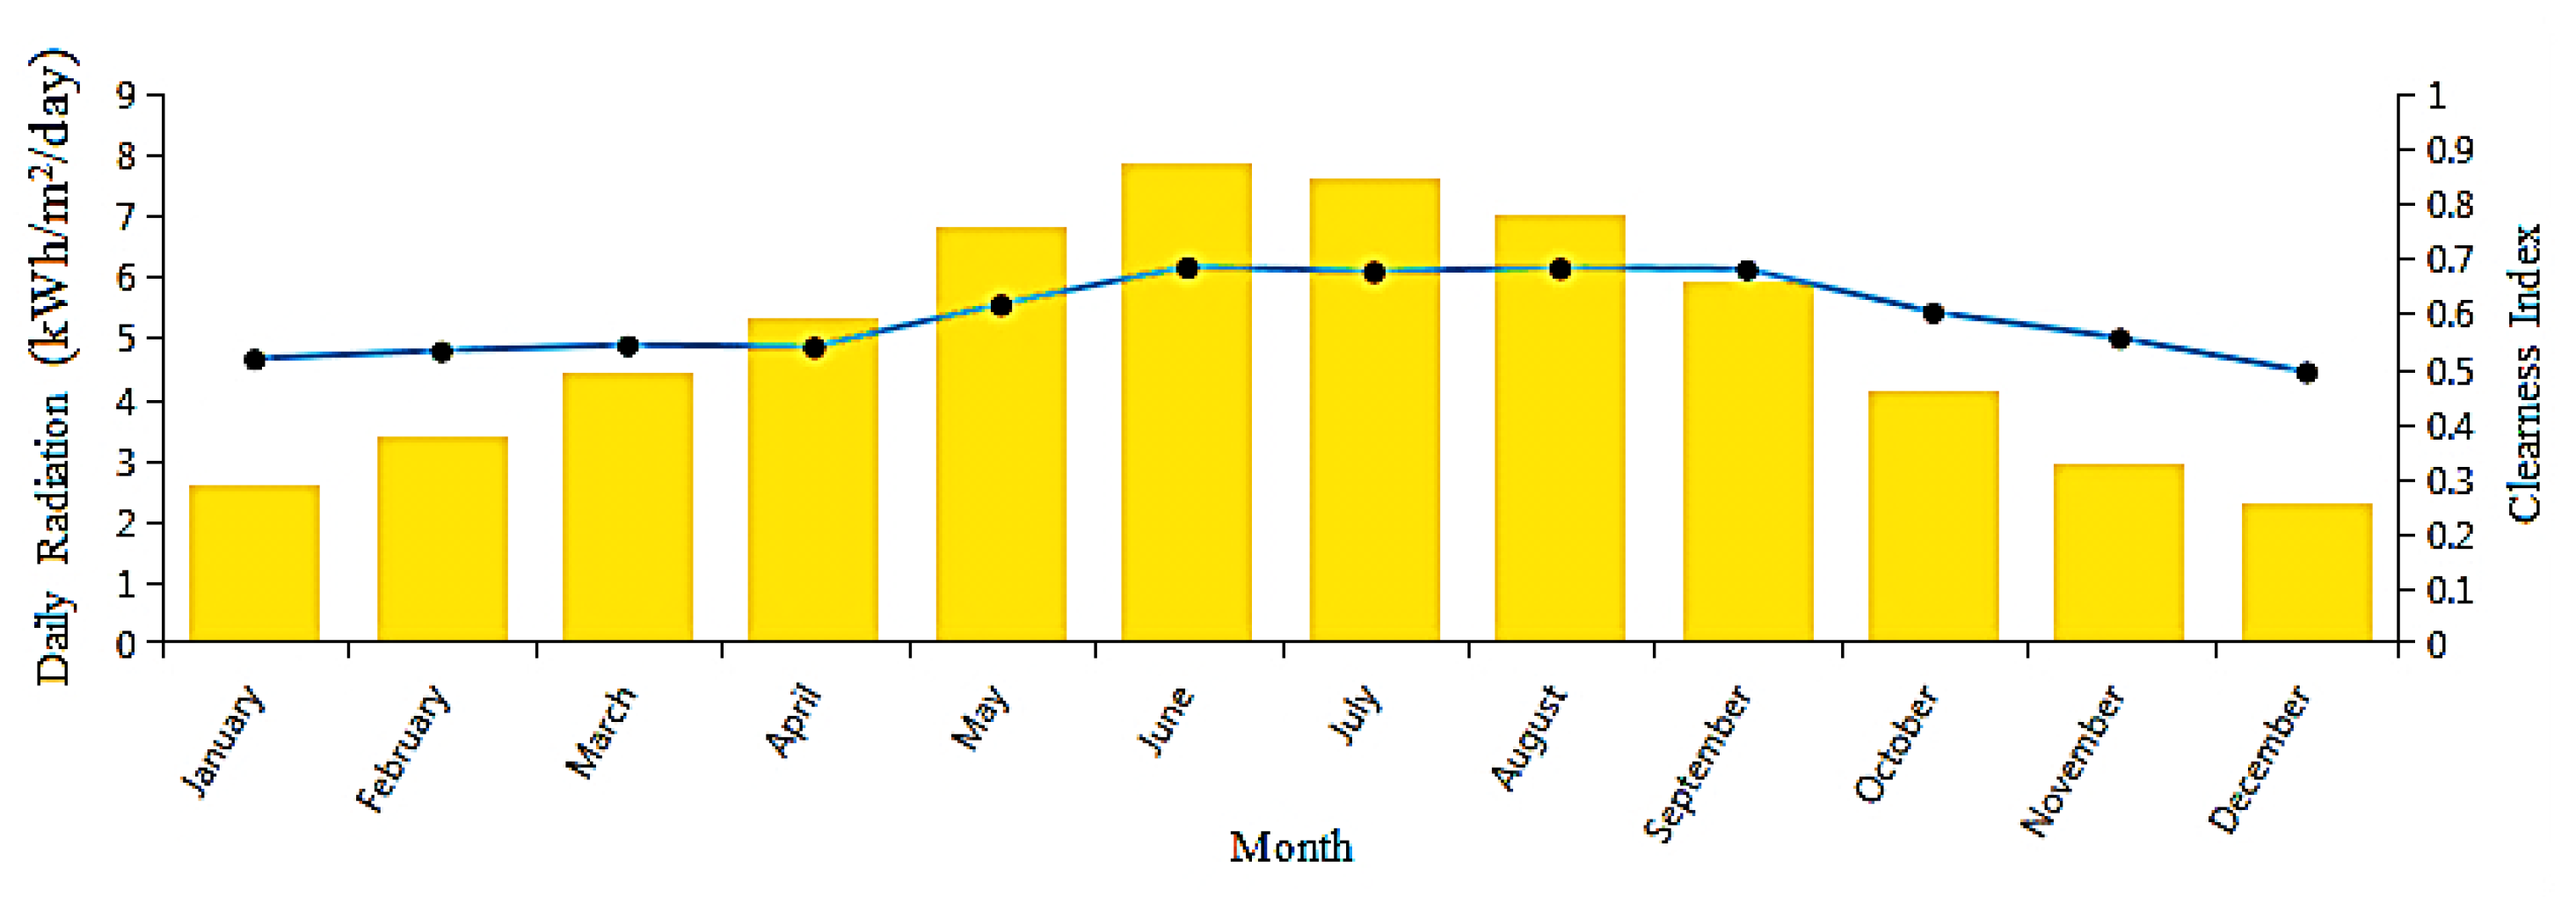
3.1. The Solar Radiation

The proposed case study is an educational complex in Sanandaj, Iran. The latitude and longitude of Sanandaj are 35.3219° N and 46.9862° E, respectively. The average amount of solar radiation and the clearness index, defined as a measure of atmosphere clearness, are shown in Figure 1. The monthly average data of temperature is also represented in Figure 2.

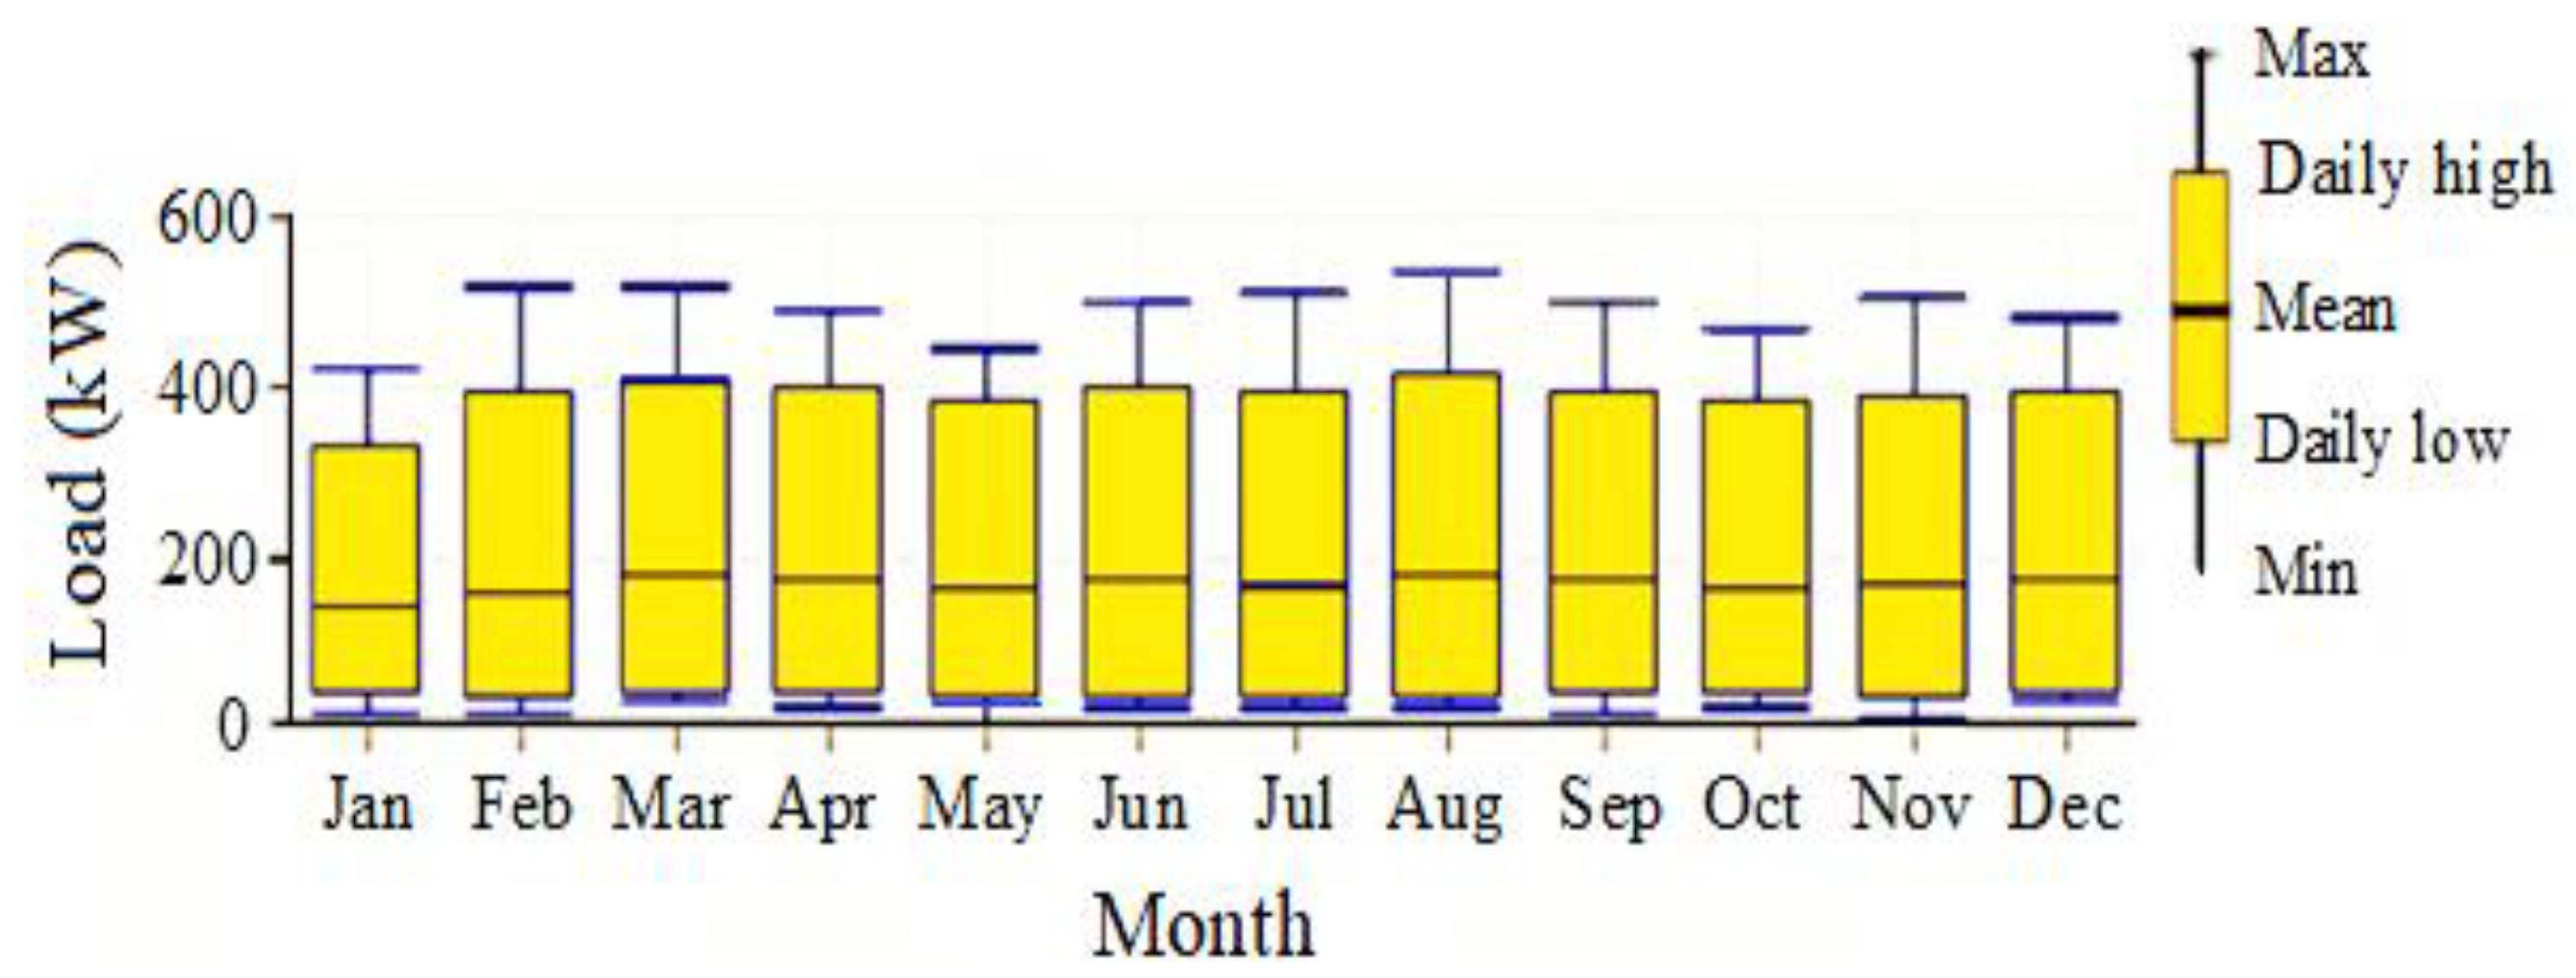
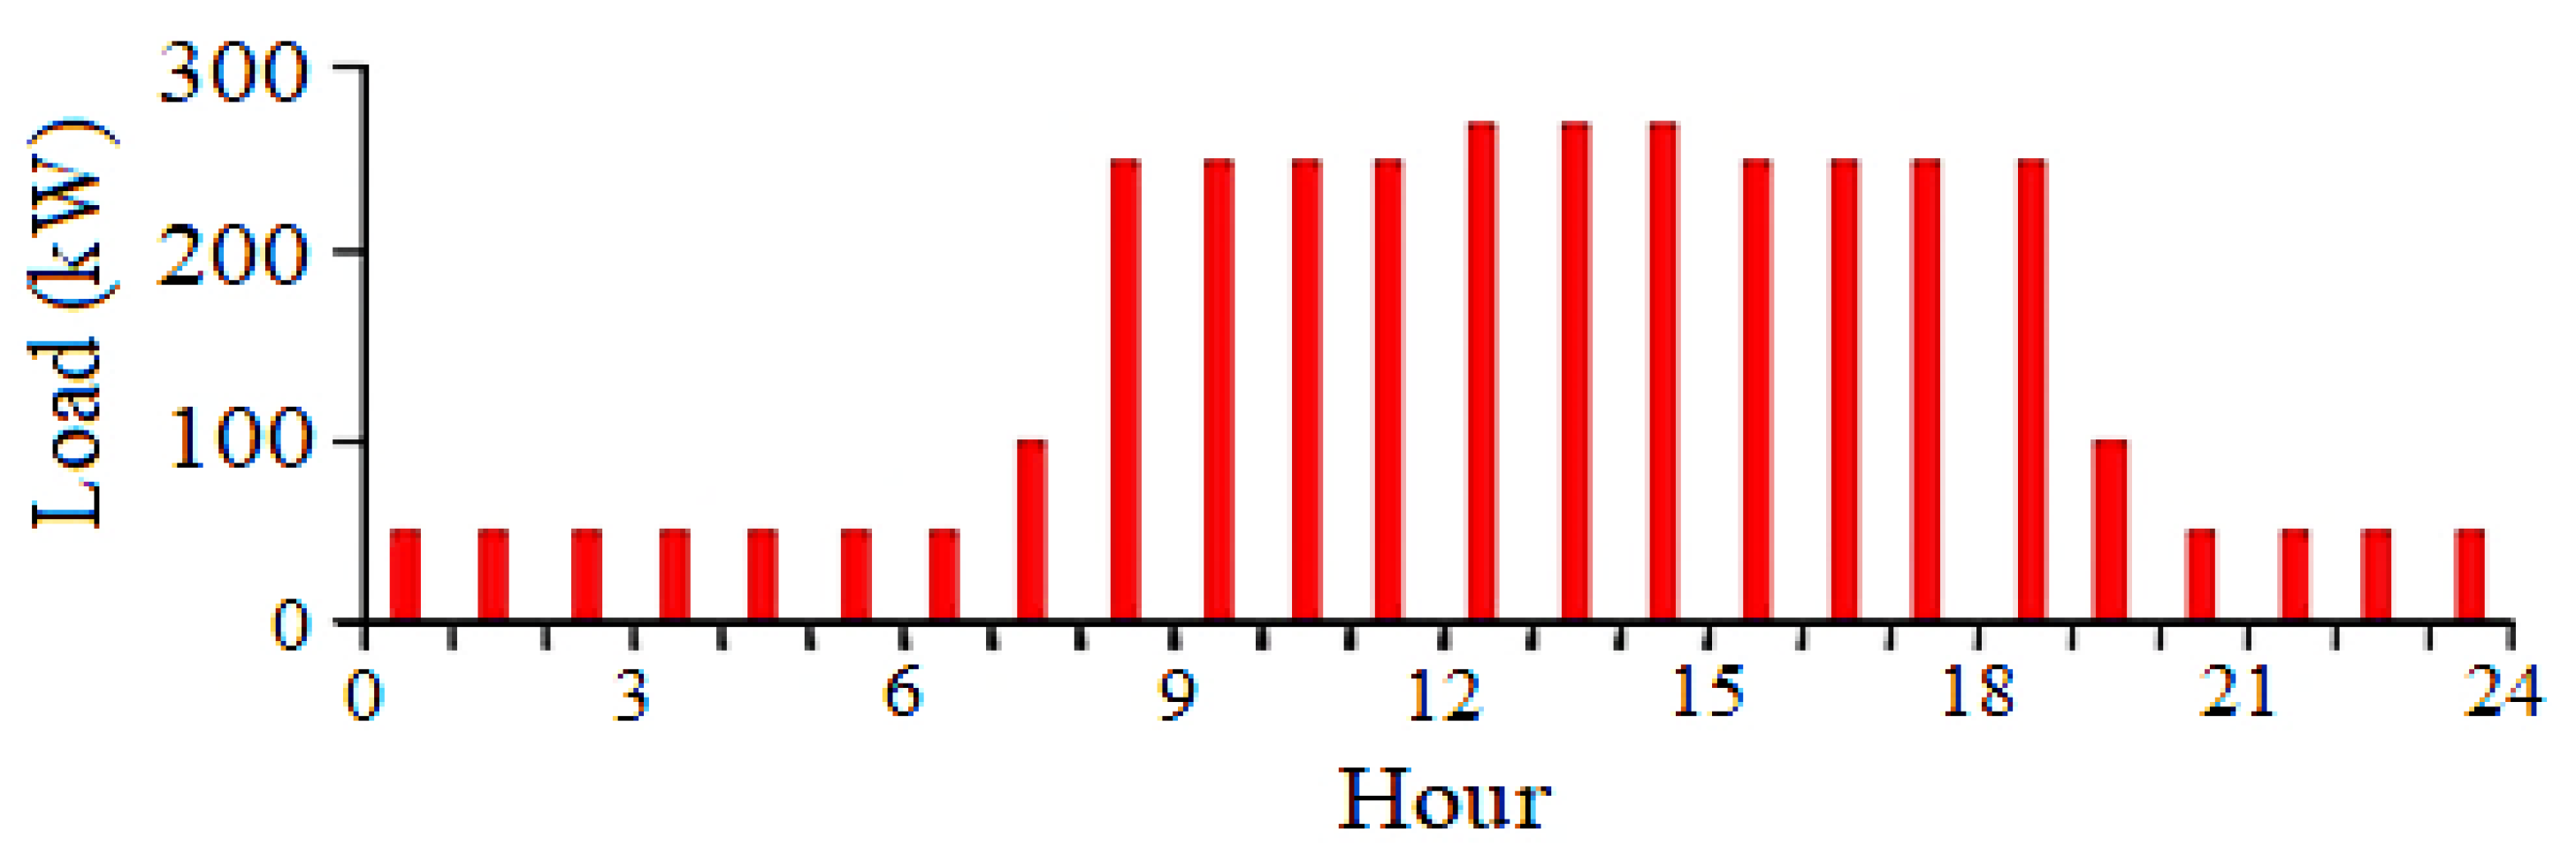
3.2. Load Consumption

The peak load of the under-study case study is 514.82 kW; the average energy consumption is 4060.6 kWh/day, and 169.17 kW; the load factor is assumed to be 0.33, with a 5% random variety factor (day-to-day and hour-to-hour). The proposed case study’s average seasonal profile and daily load profile are shown in Figure 3 and Figure 4, respectively. More details about the load classification can be found in Table 2.

3.3. System Description and Requirements

The under-study MG is assumed to operate in grid-connected mode and capable of trading energy with the main grid at predetermined prices. The equipment data are presented in Table 3. In addition, details of pricing are given in Table 4. Furthermore, note that:
  • To generate more electricity, 10 batteries are connected in series, forming a battery string.
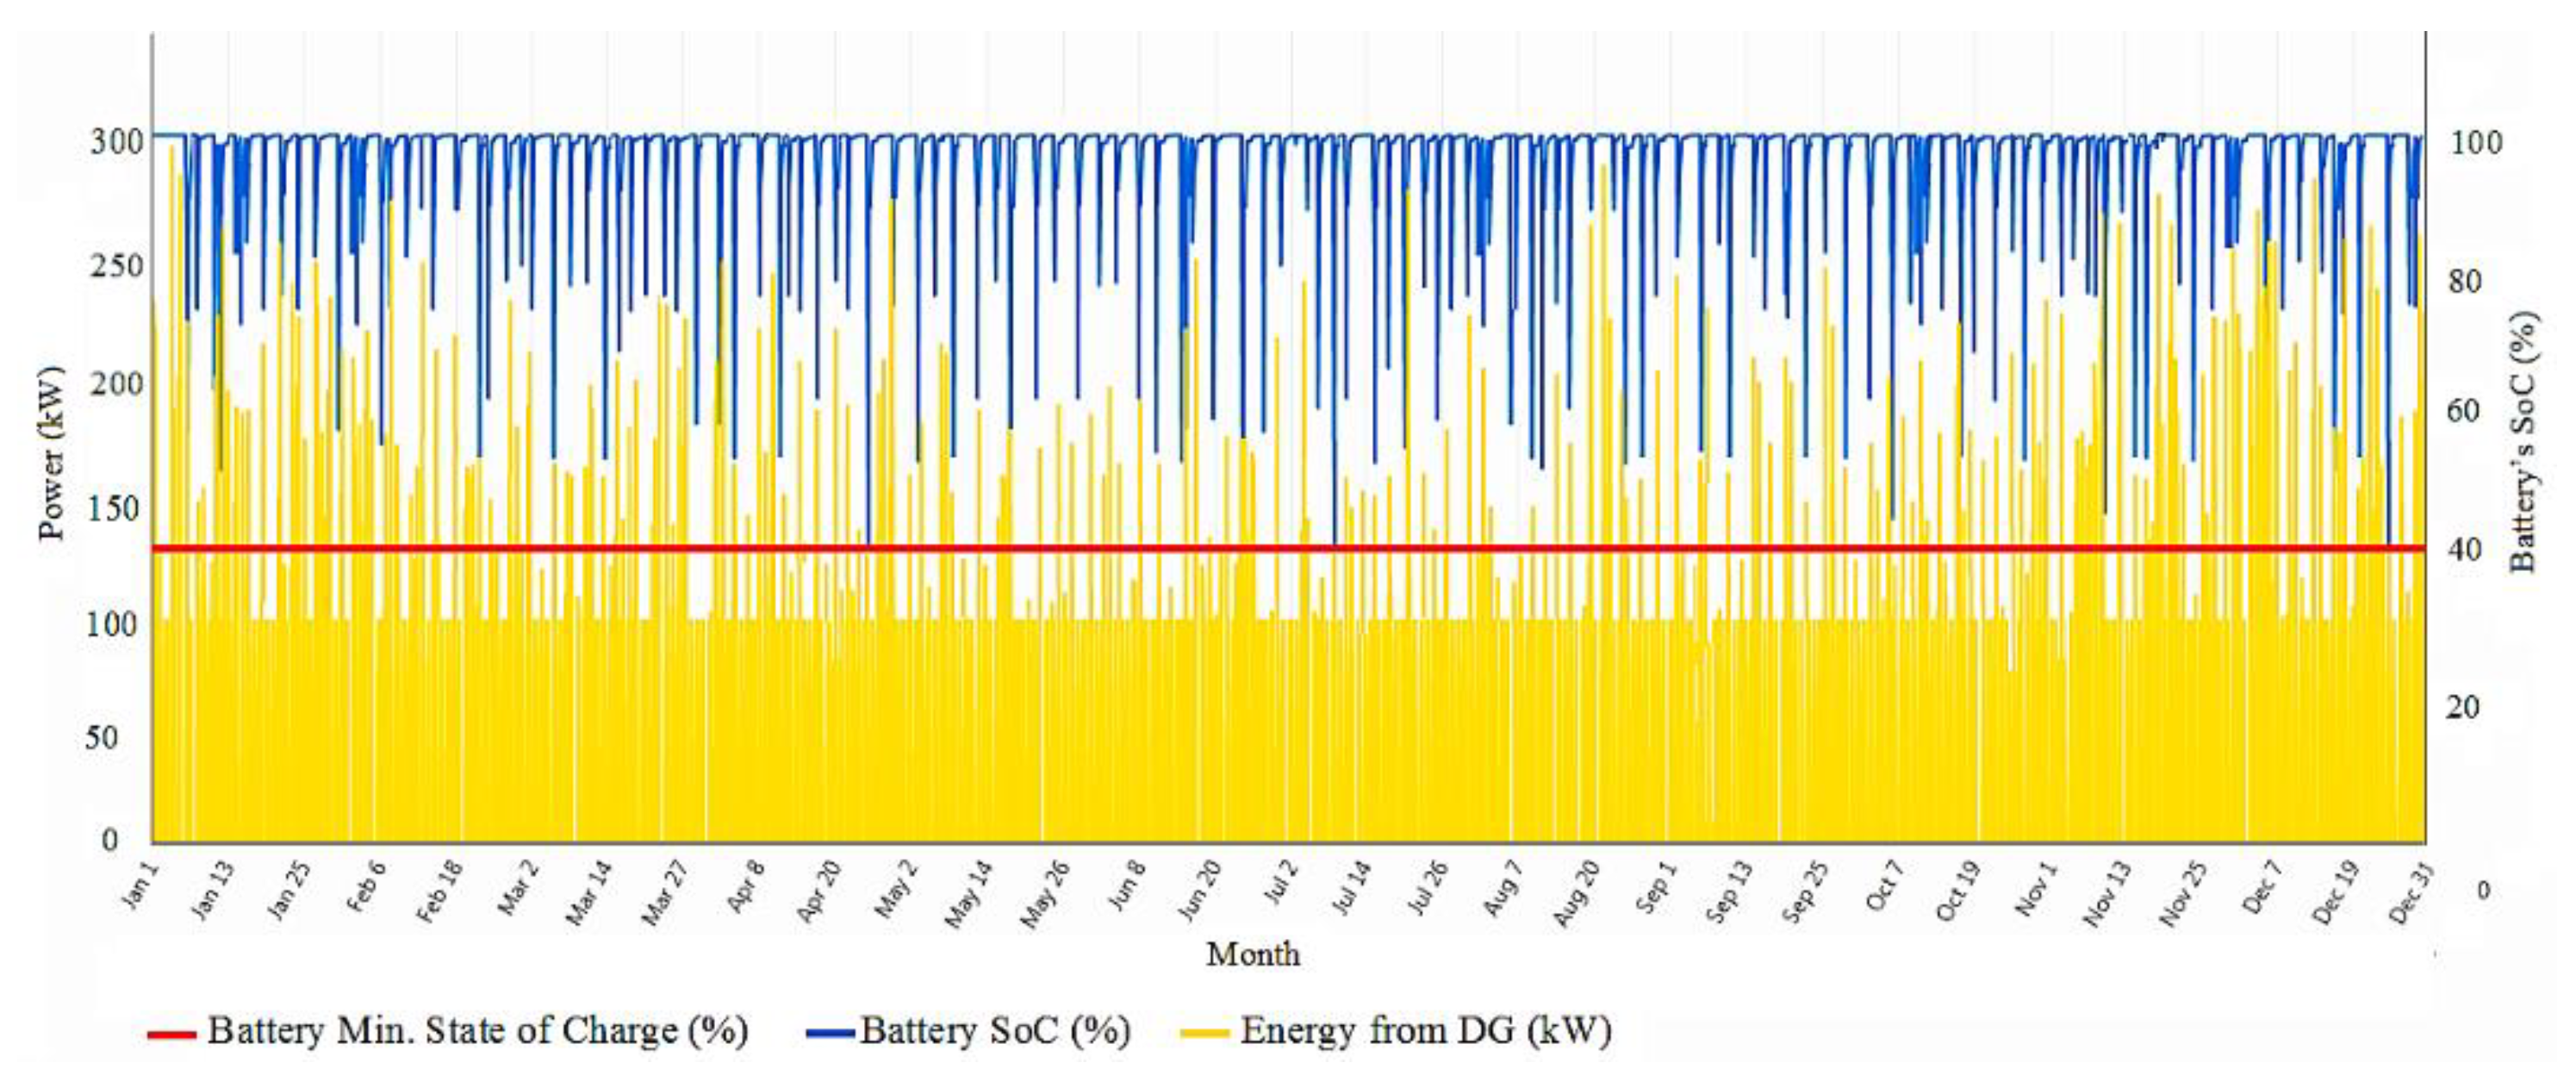
  • The batteries’ initial and minimum SOCs are set to 100% and 40%, respectively.
Table 3. The MG components description and specification [50].
ItemSpecificationItemSpecification
  • PV panel
Minimum load ratio (%)30
ModelMF100-EC4Lifetime15,000 h
Rated power250 kW
  • Battery
Capital cost (USD)7300/kWTypeSurrette-6CS25P
Replacement cost (USD)2974/kWCapital cost (USD)1229/single cell
O&M cost (USD)10/yearReplacement cost (USD)1229/single cell
Temperature coefficient−0.5%/°CO&M cost (USD)10/year
De-rating factor (%)80
  • Inverter
Lifetime25 yearsTypeLeonics GTP519S
  • Diesel generator
Rated power900 kW
TypePerkinsCapital cost (USD)300/kW
Rated power250 kVAReplacement cost (USD)300/kW
Capital cost (USD)500/kWO&M cost (USD)10/year
Replacement cost (USD)500/kWEfficiency (%)90
O&M cost (USD)0.03/hoursLifetime10 years
Table 4. Grid purchase and sell tariffs [50].
Selling Energy Cost (USD/kWh)Buying Energy Cost (USD/kWh)
Off-peak0.160.0011
Normal0.160.0047
Peak0.160.0155

3.4. System Control and Constraints

The other required information to formulate the system is as follows:
  • The project lifetime is considered as 10 years with an annual discount rate of 18%, and an inflation rate of 19% [51].
  • The system’s fixed capital cost and fixed O&M cost are considered as USD 10,000 for the entire project, and 10 USD/year, respectively.
  • A maximum annual capacity shortage restriction is established throughout the simulation process. This value is set to 0 to assess the system’s ability to deliver peak demand even in the event of a short fault or interruption.
  • The penalty for CO2 pollution is considered 50 (USD/t).
  • The discharge efficiency is assumed to be unity.
  • The operational reserves are defined as 10% of hourly loads and 25% of PV output.

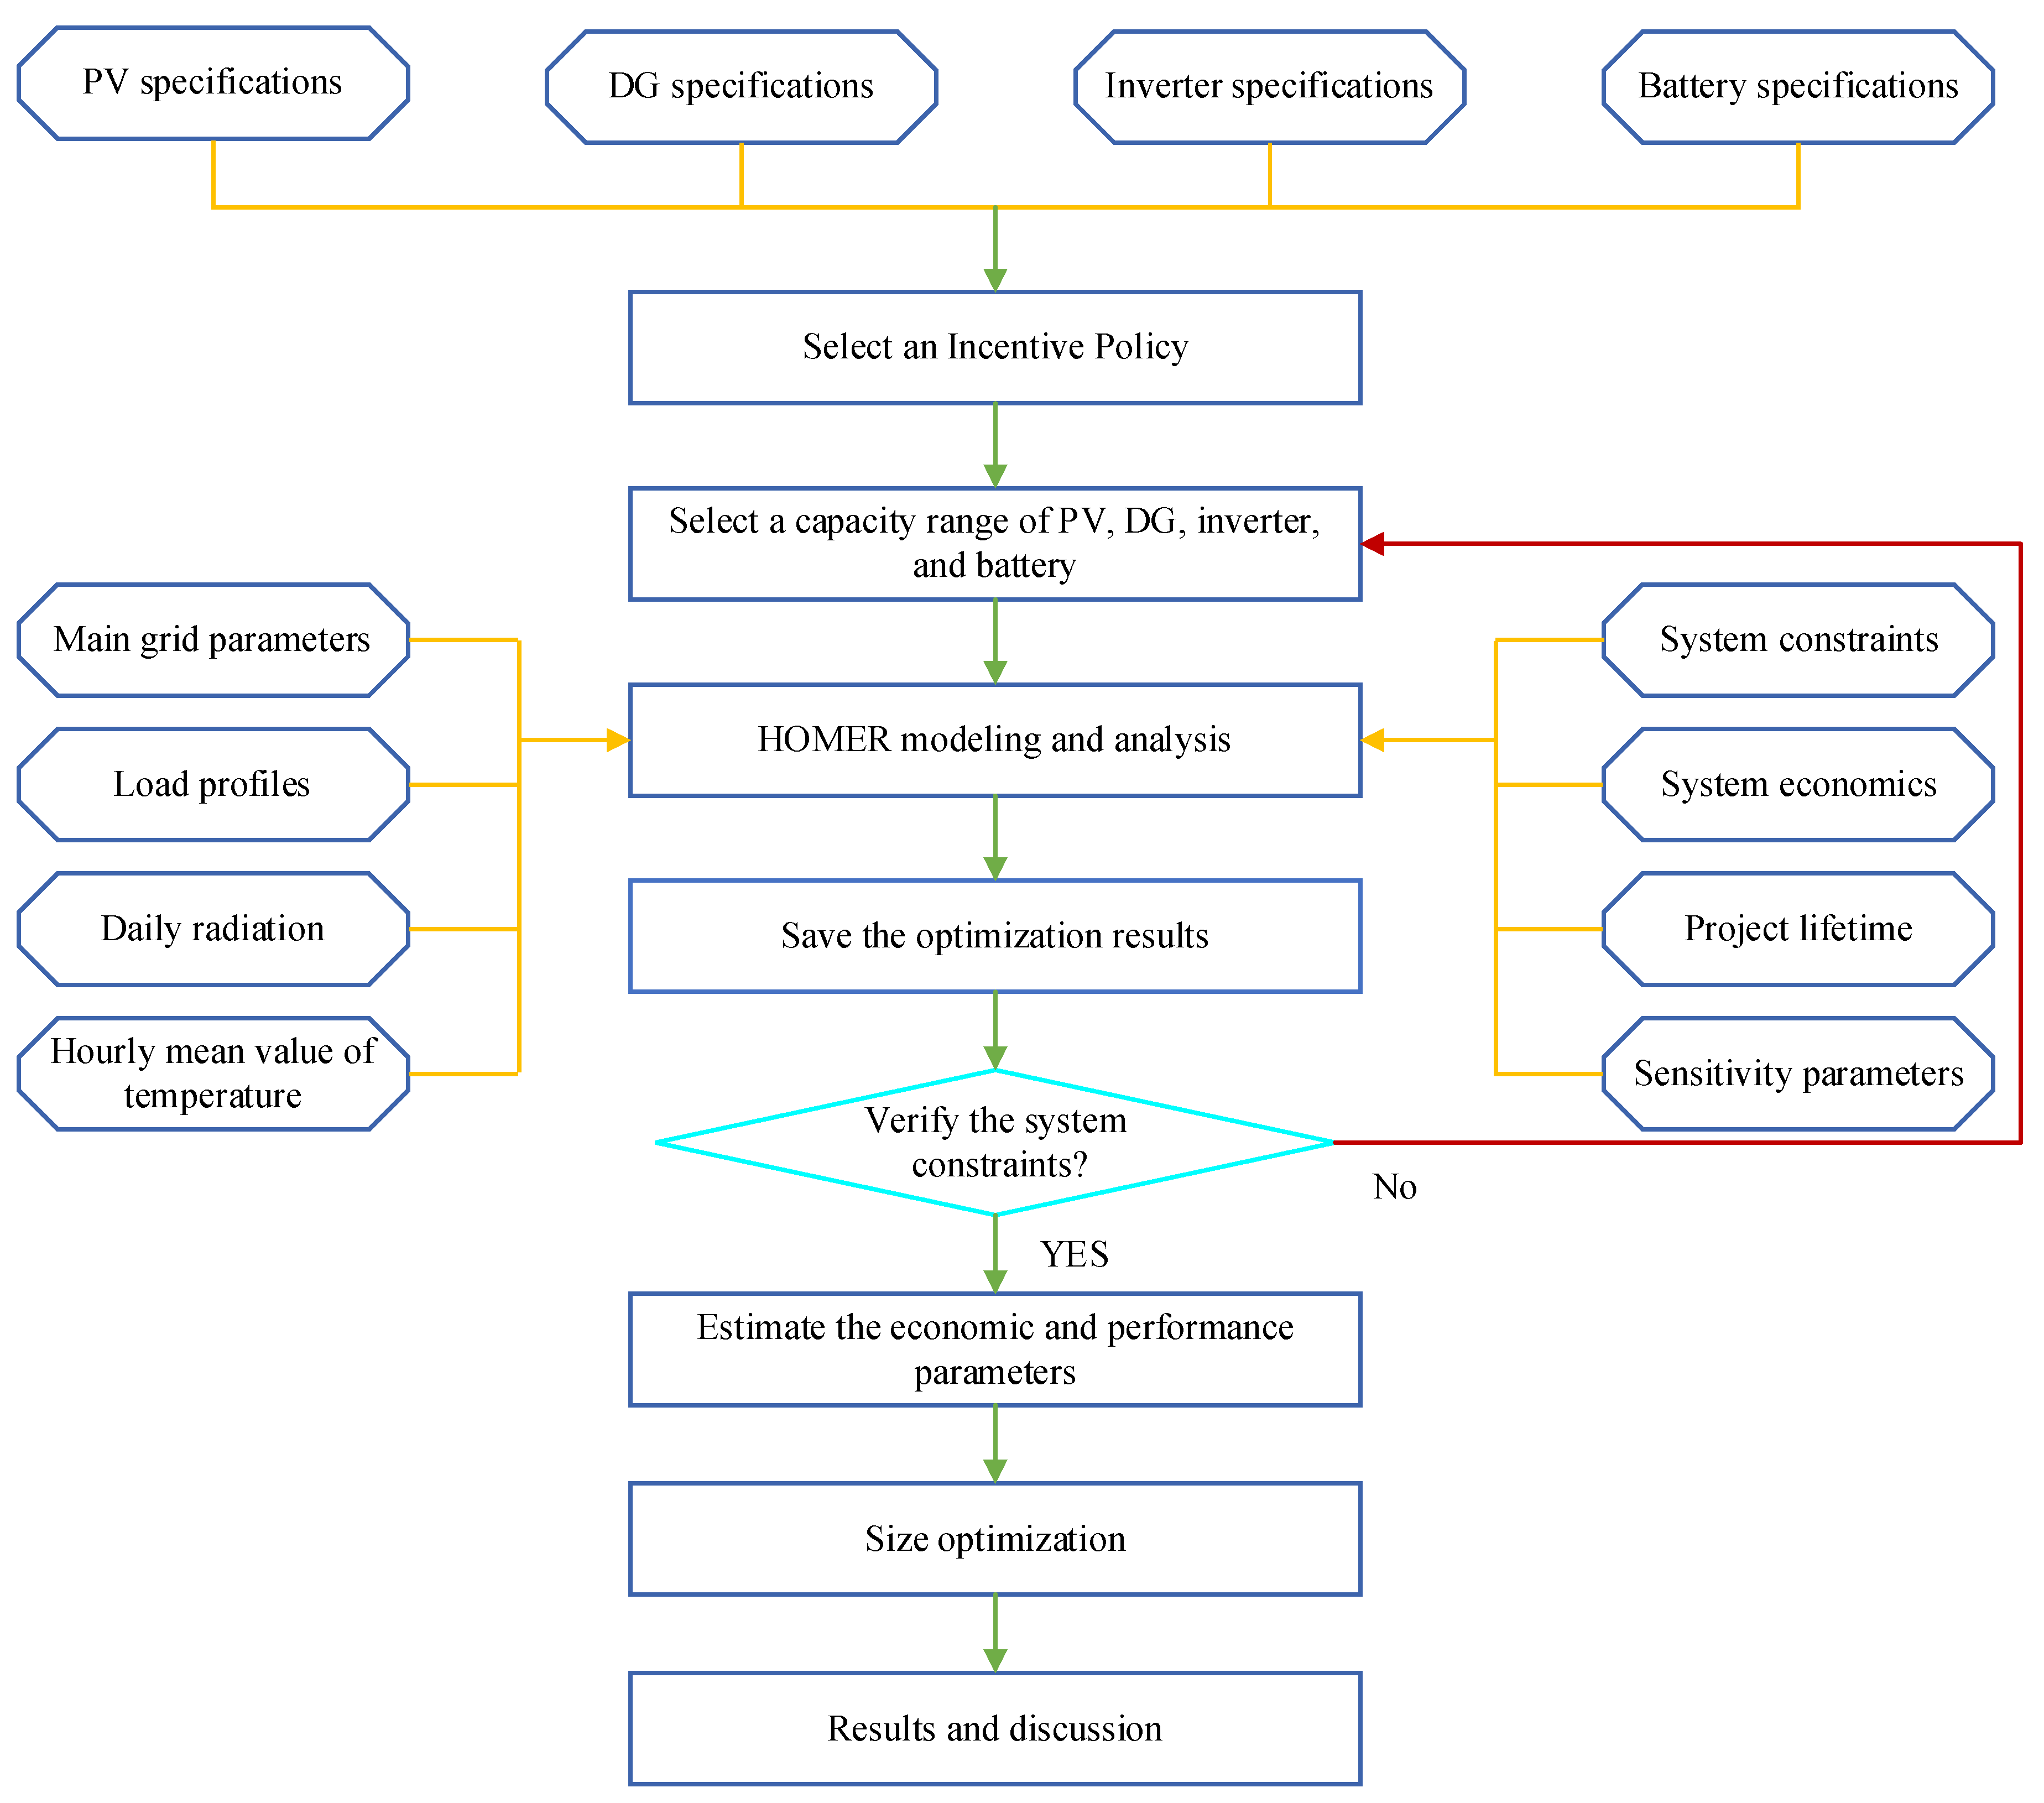
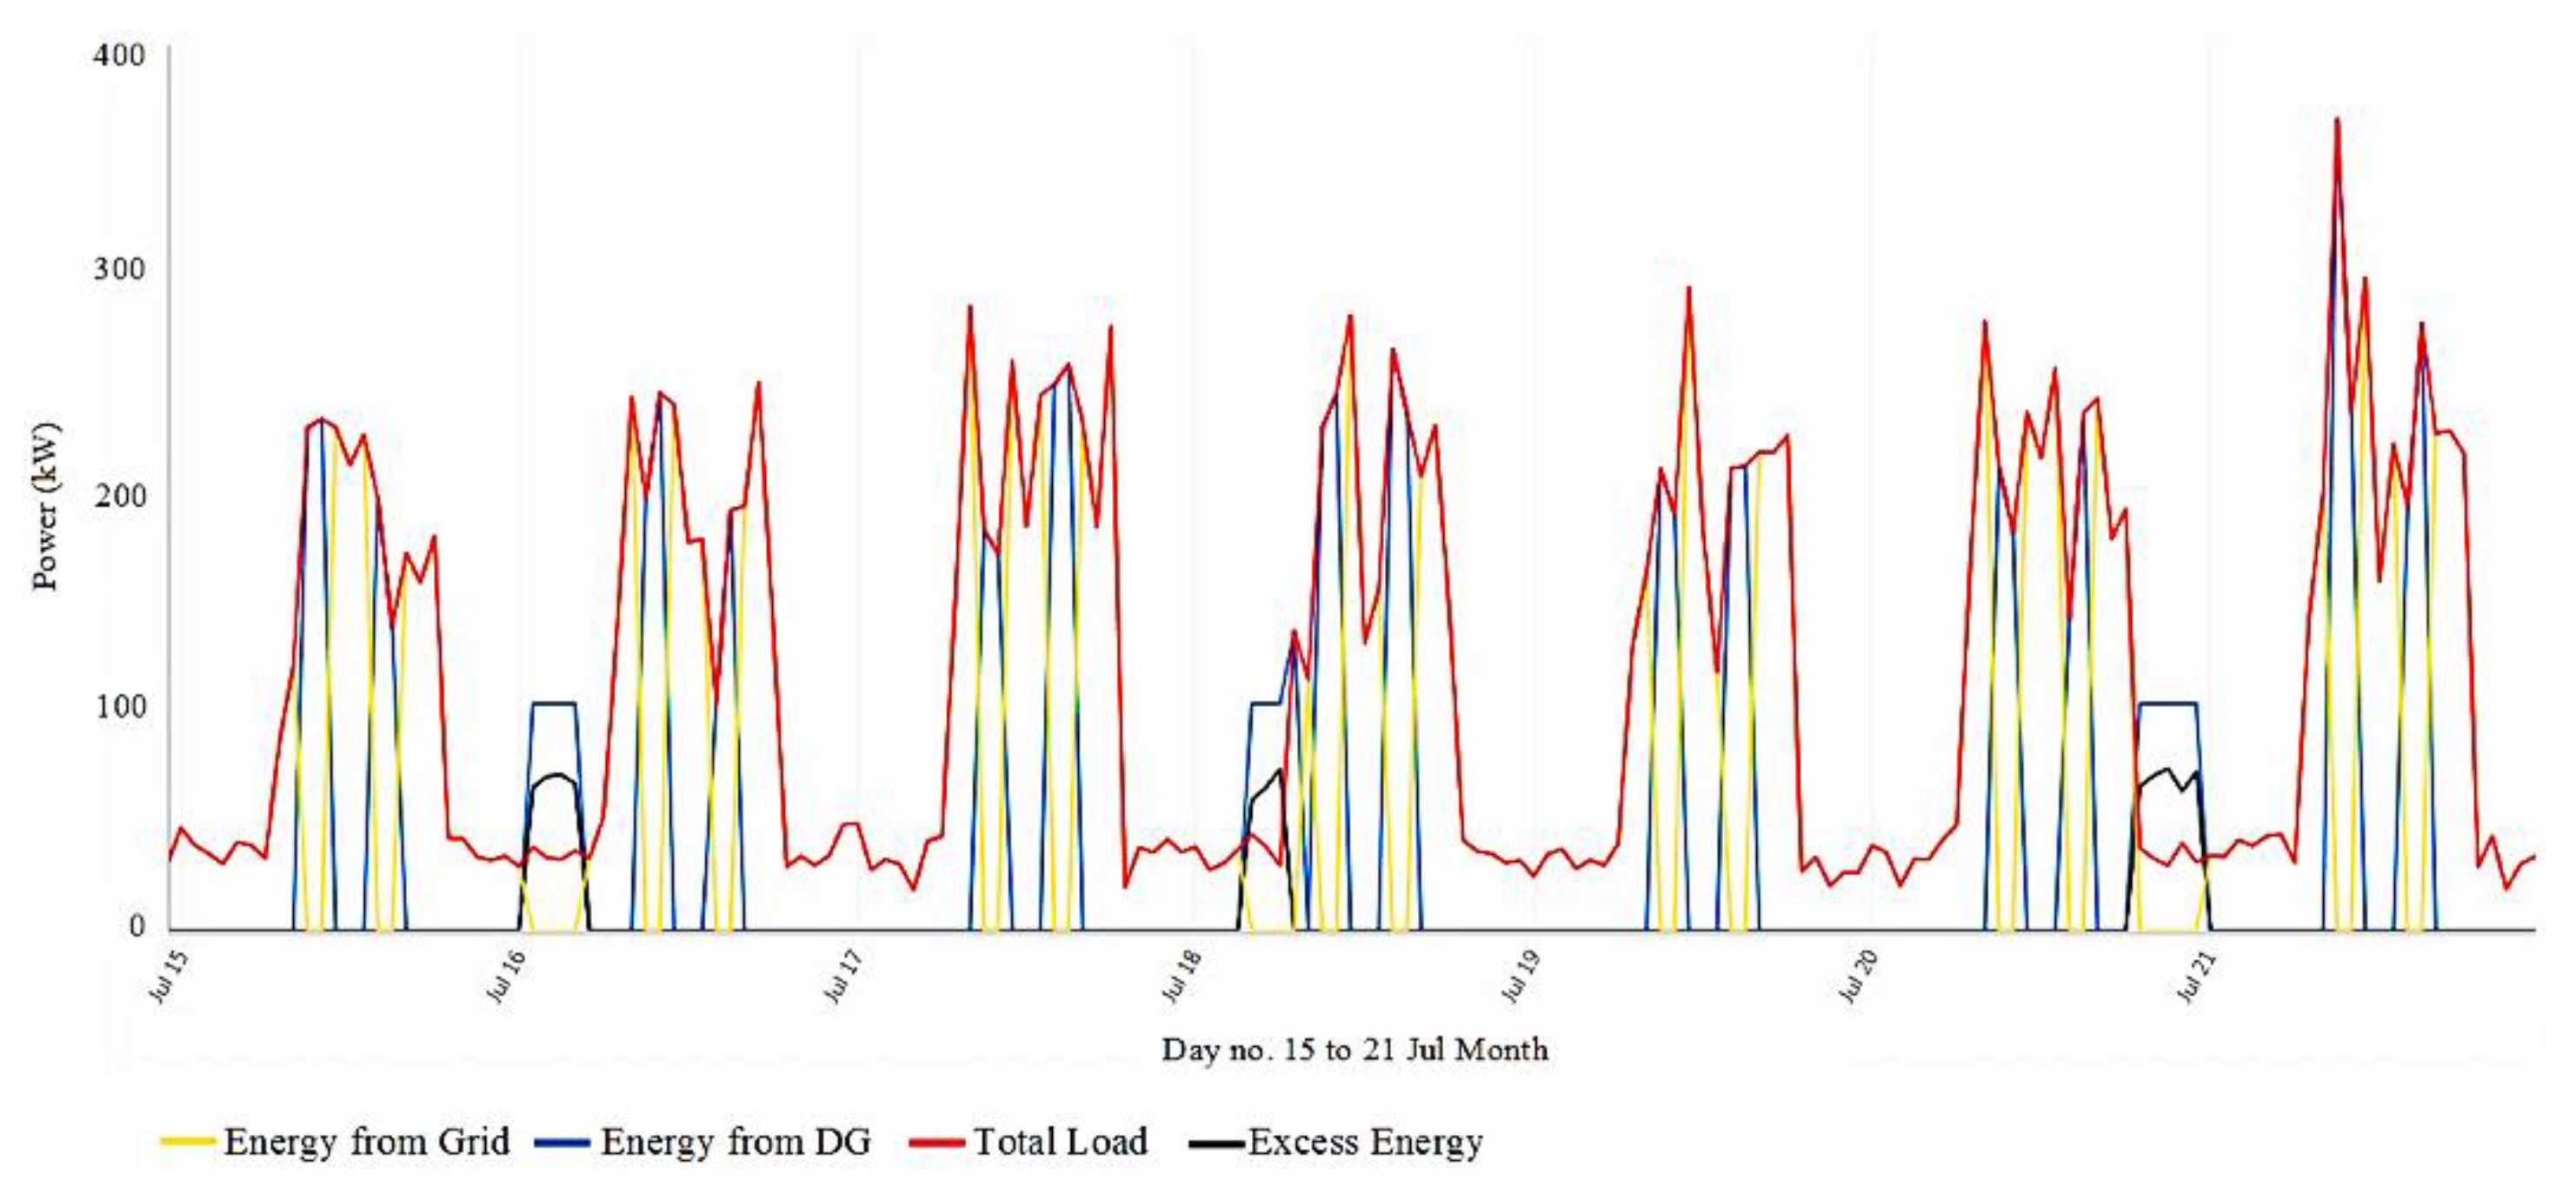
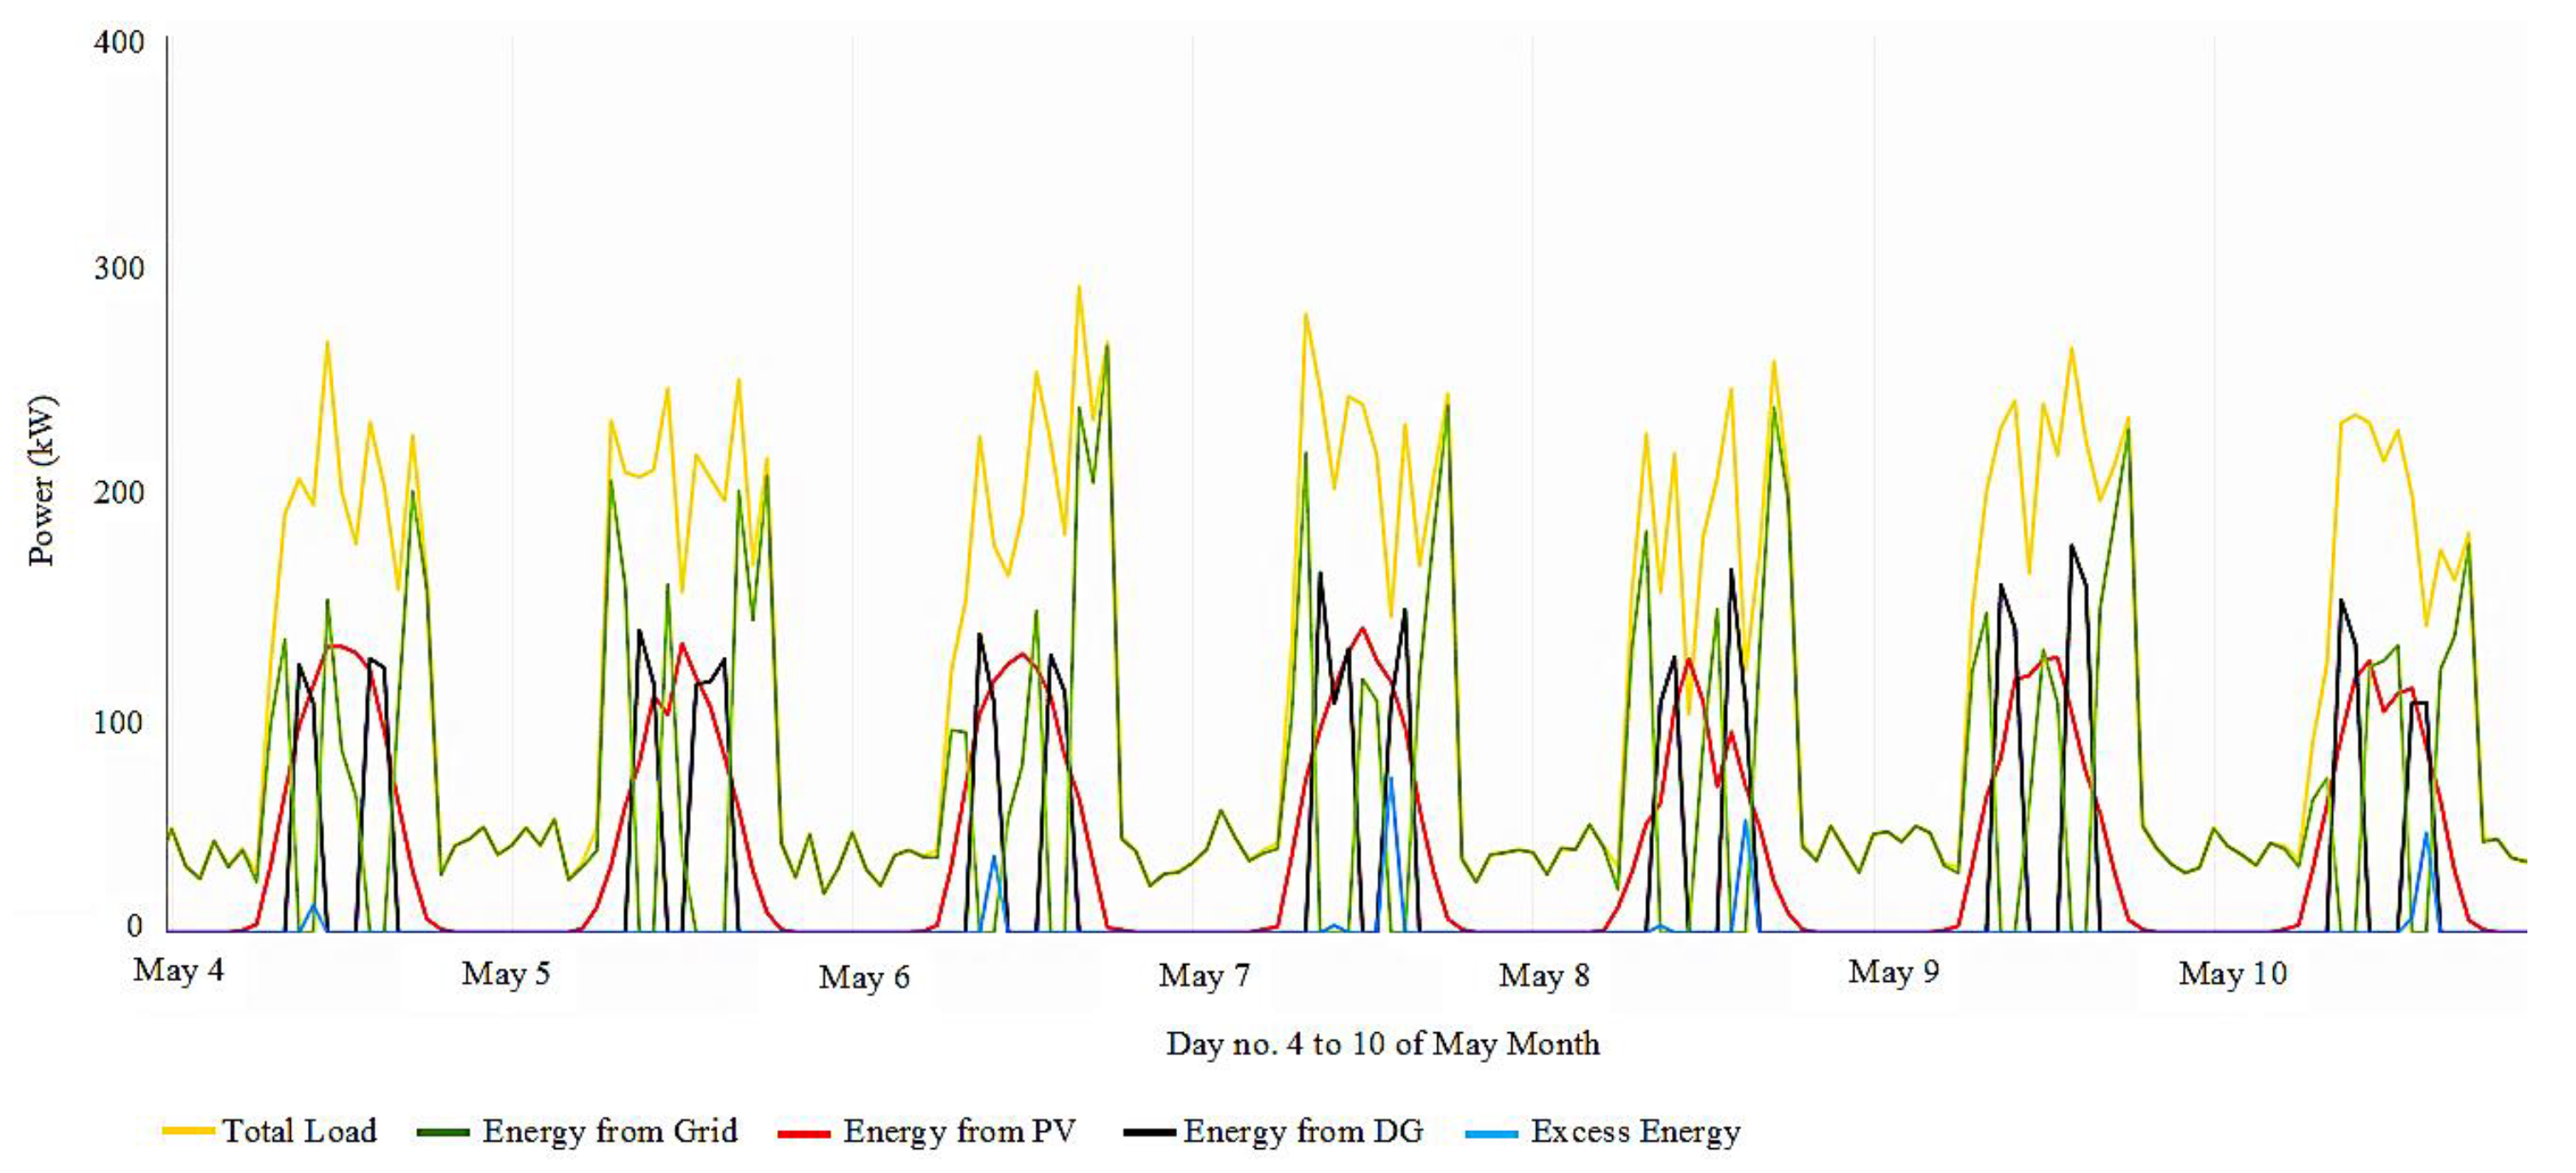
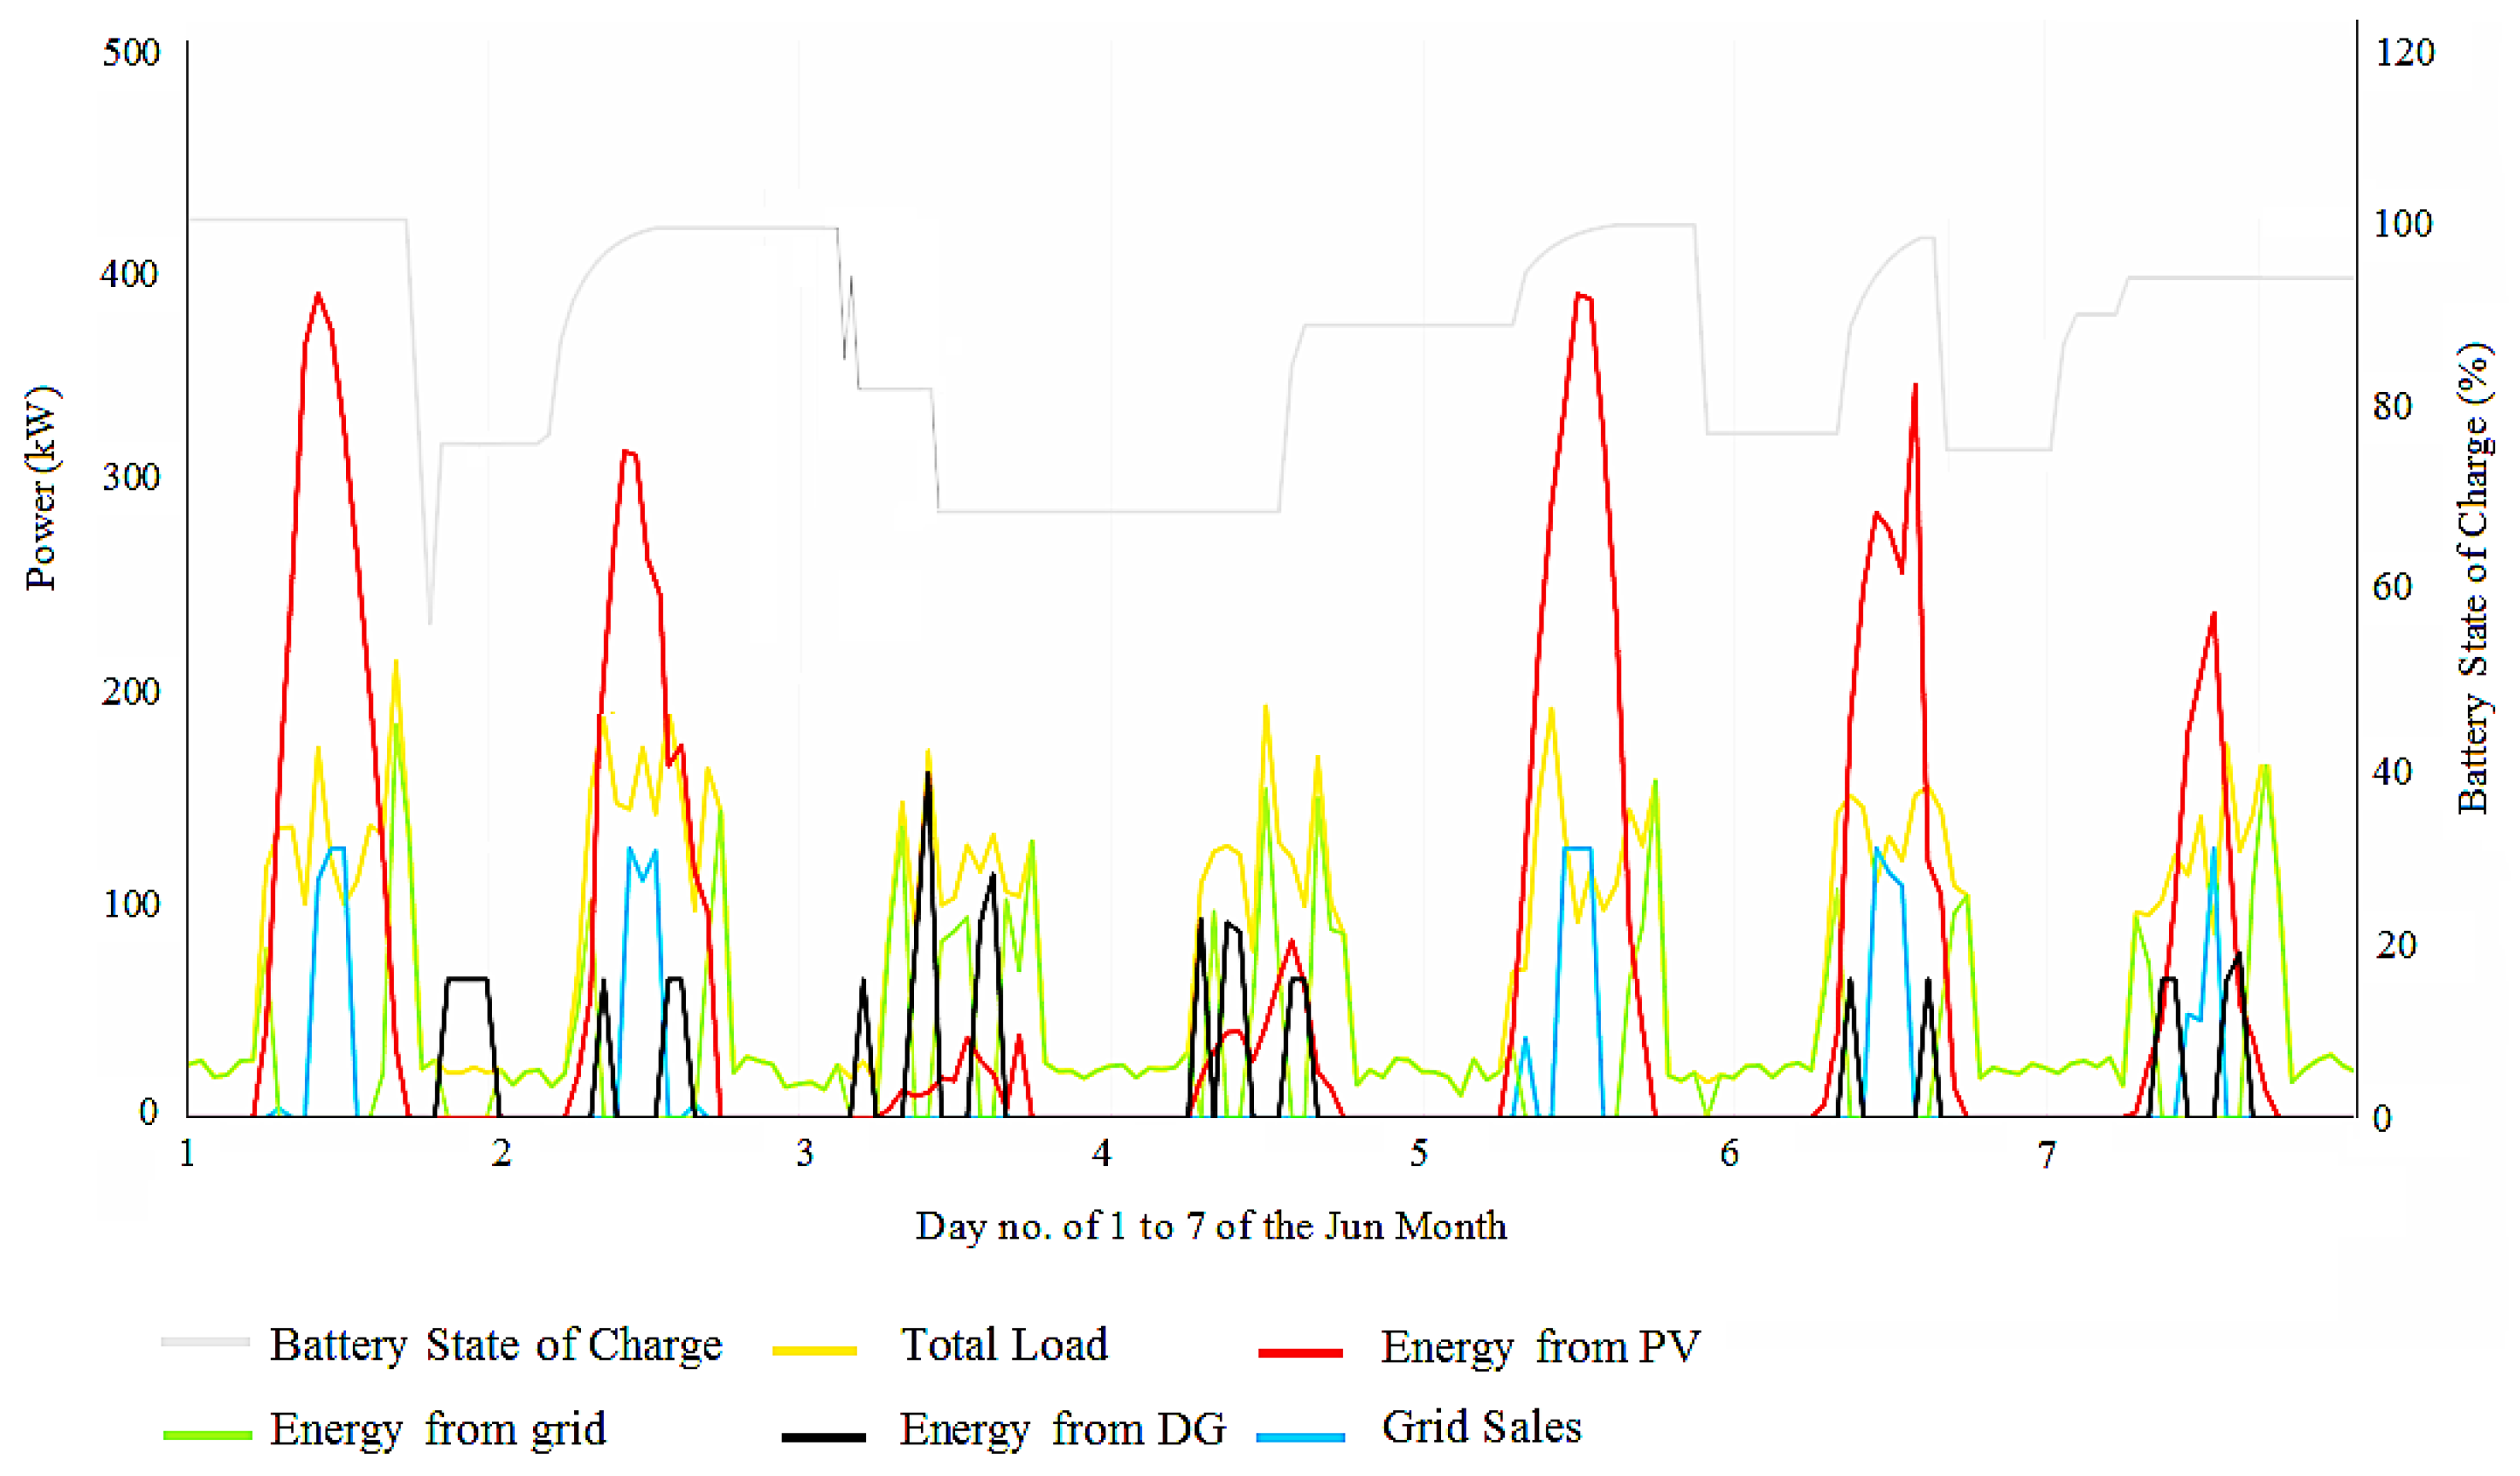
4. Simulation Results

This paper uses the HOMER simulation software to assess the performance of hybrid system structures. The under-study MG structure is shown in Figure 5. The simulation’s goal is to find the best incentive strategy and MG configuration to meet the MG’s load while reducing NPC and CO2 emissions. To this end, the first sub-section investigates the impact of RES-based MG generation on NPC and CO2 emissions. Then, the impact of incentive policies on the MG design from technical and economic points of view is investigated. The detailed methodology used for analysis and modeling is shown in Figure 6. The general description of the figure can be explained as follows:
  • The technical features of PV panels, DGs, batteries, and converters, as well as their O&M and capital costs, are fed into HOMER software as input data.
  • One of the incentive policies is chosen.
  • Various sizes of the components are defined as a search space for the problem.
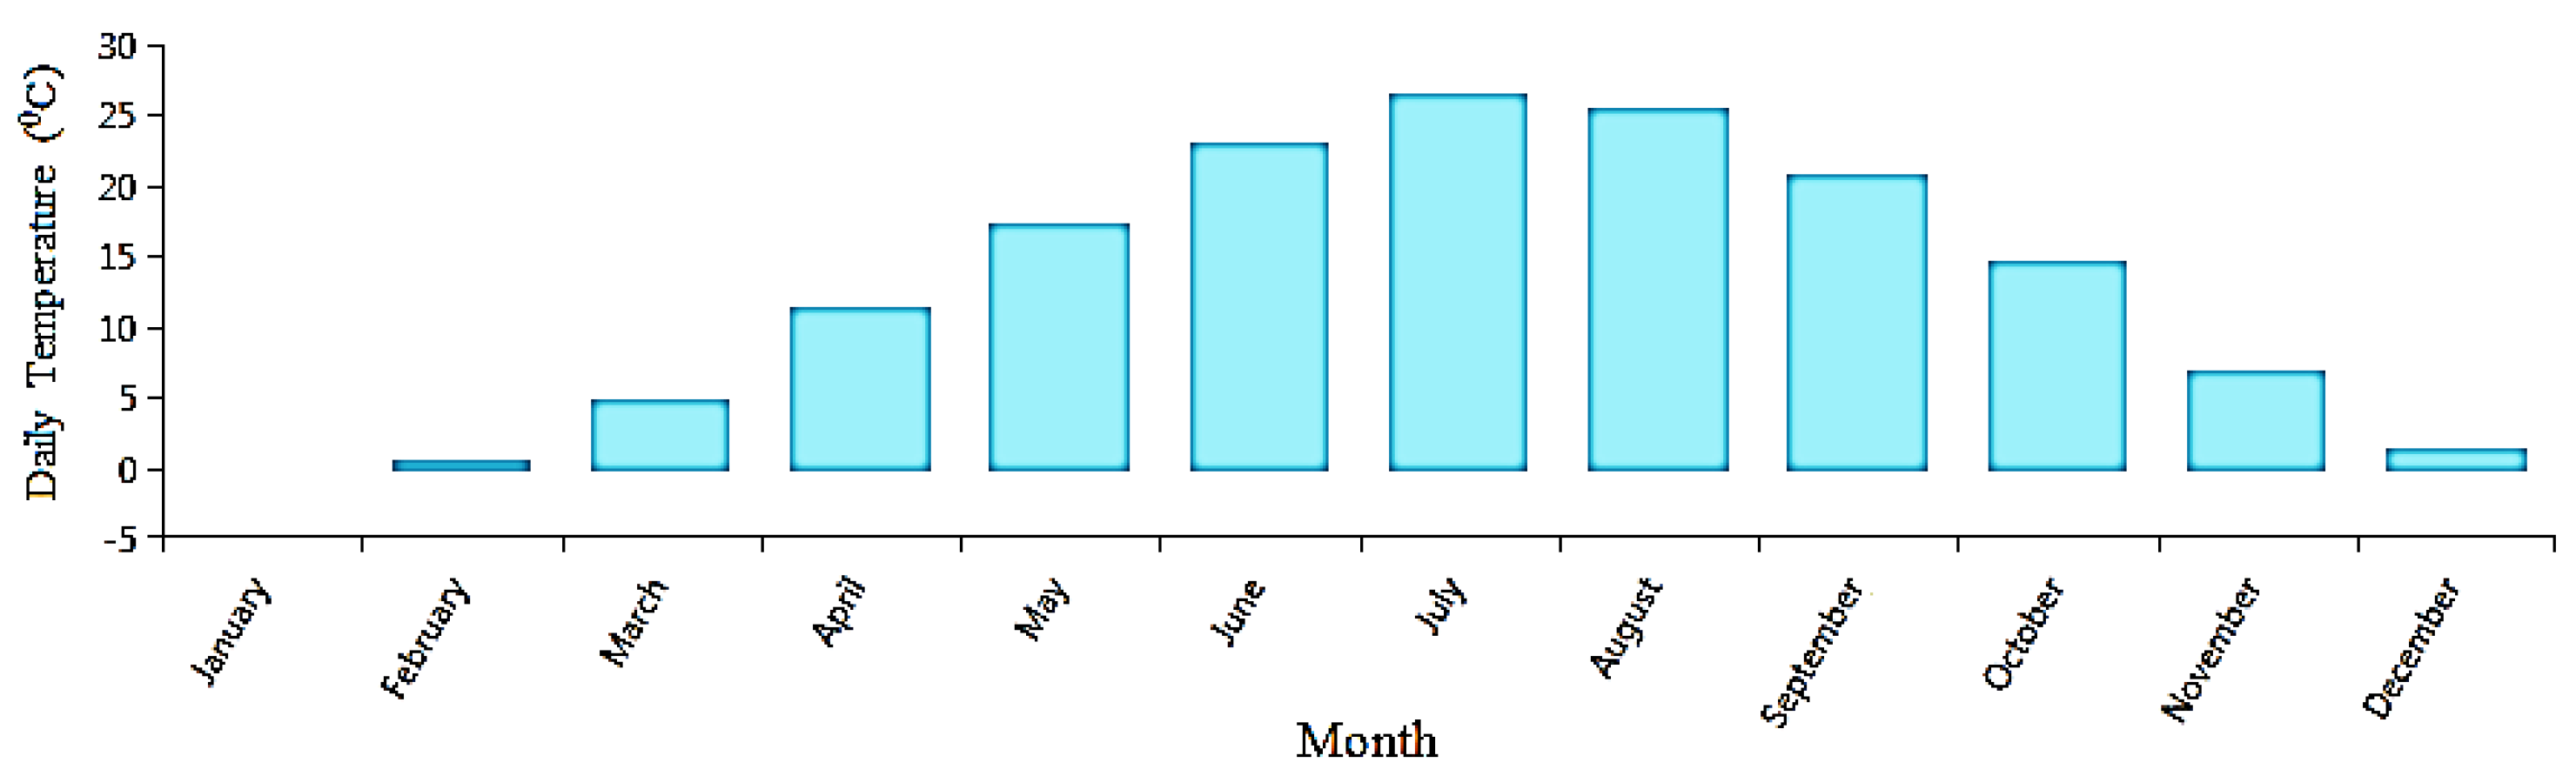
  • An optimum solution is determined by utilizing the following data: temperature data, daily average solar radiation with the clearness index, system constraints and project economics, project lifetime, the main grid parameters, total load, and sensitivity variables.
  • Optimization is completed for a different combination of devices.
Figure 5. The MG studied in this paper.
Energies 15 08285 g005
Figure 6. Flowchart of analysis using the HOMER Pro MG analysis tool.
Energies 15 08285 g006

4.1. Results of the MG Design without Considering Incentive Policy

To demonstrate the effect of RES penetration on the proposed case study, three scenarios were investigated without considering incentive policies: (1) the base case (without penetration of RESs), (2) the base case with at least 20% penetration rate of RESs, and (3) the base with at least 40% penetration rate of RESs.

4.1.1. Base Case

The results of the optimal configuration of DGs and the main grid to meet the load in the basic case are shown in Table 5. The electrical generation of DGs is 365,425 kWh/year, and the MG purchases 724,421 kWh/year from the main grid. This means that while DGs supply 33.6% of the total load, the main grid provides 66.4%. The excess energy is 13,381 kWh/year (1.23). The CO2 emissions are calculated to be 734,498 kg/year, while a DG’s total fuel consumption is 106,417 L. Figure 7 shows the energy contributions from the main grid, energy from the DG, total load, and excess energy for July. From Figure 7, it can be seen that excess energy is increased when a DG provides the load by generating more electrical power than the actual demand. As a result, it may be regarded as a financial benefit in countries such as Iran, where diesel is a national product and a low-cost fuel. However, to reduce air pollution, DG usage should be kept to a minimum.

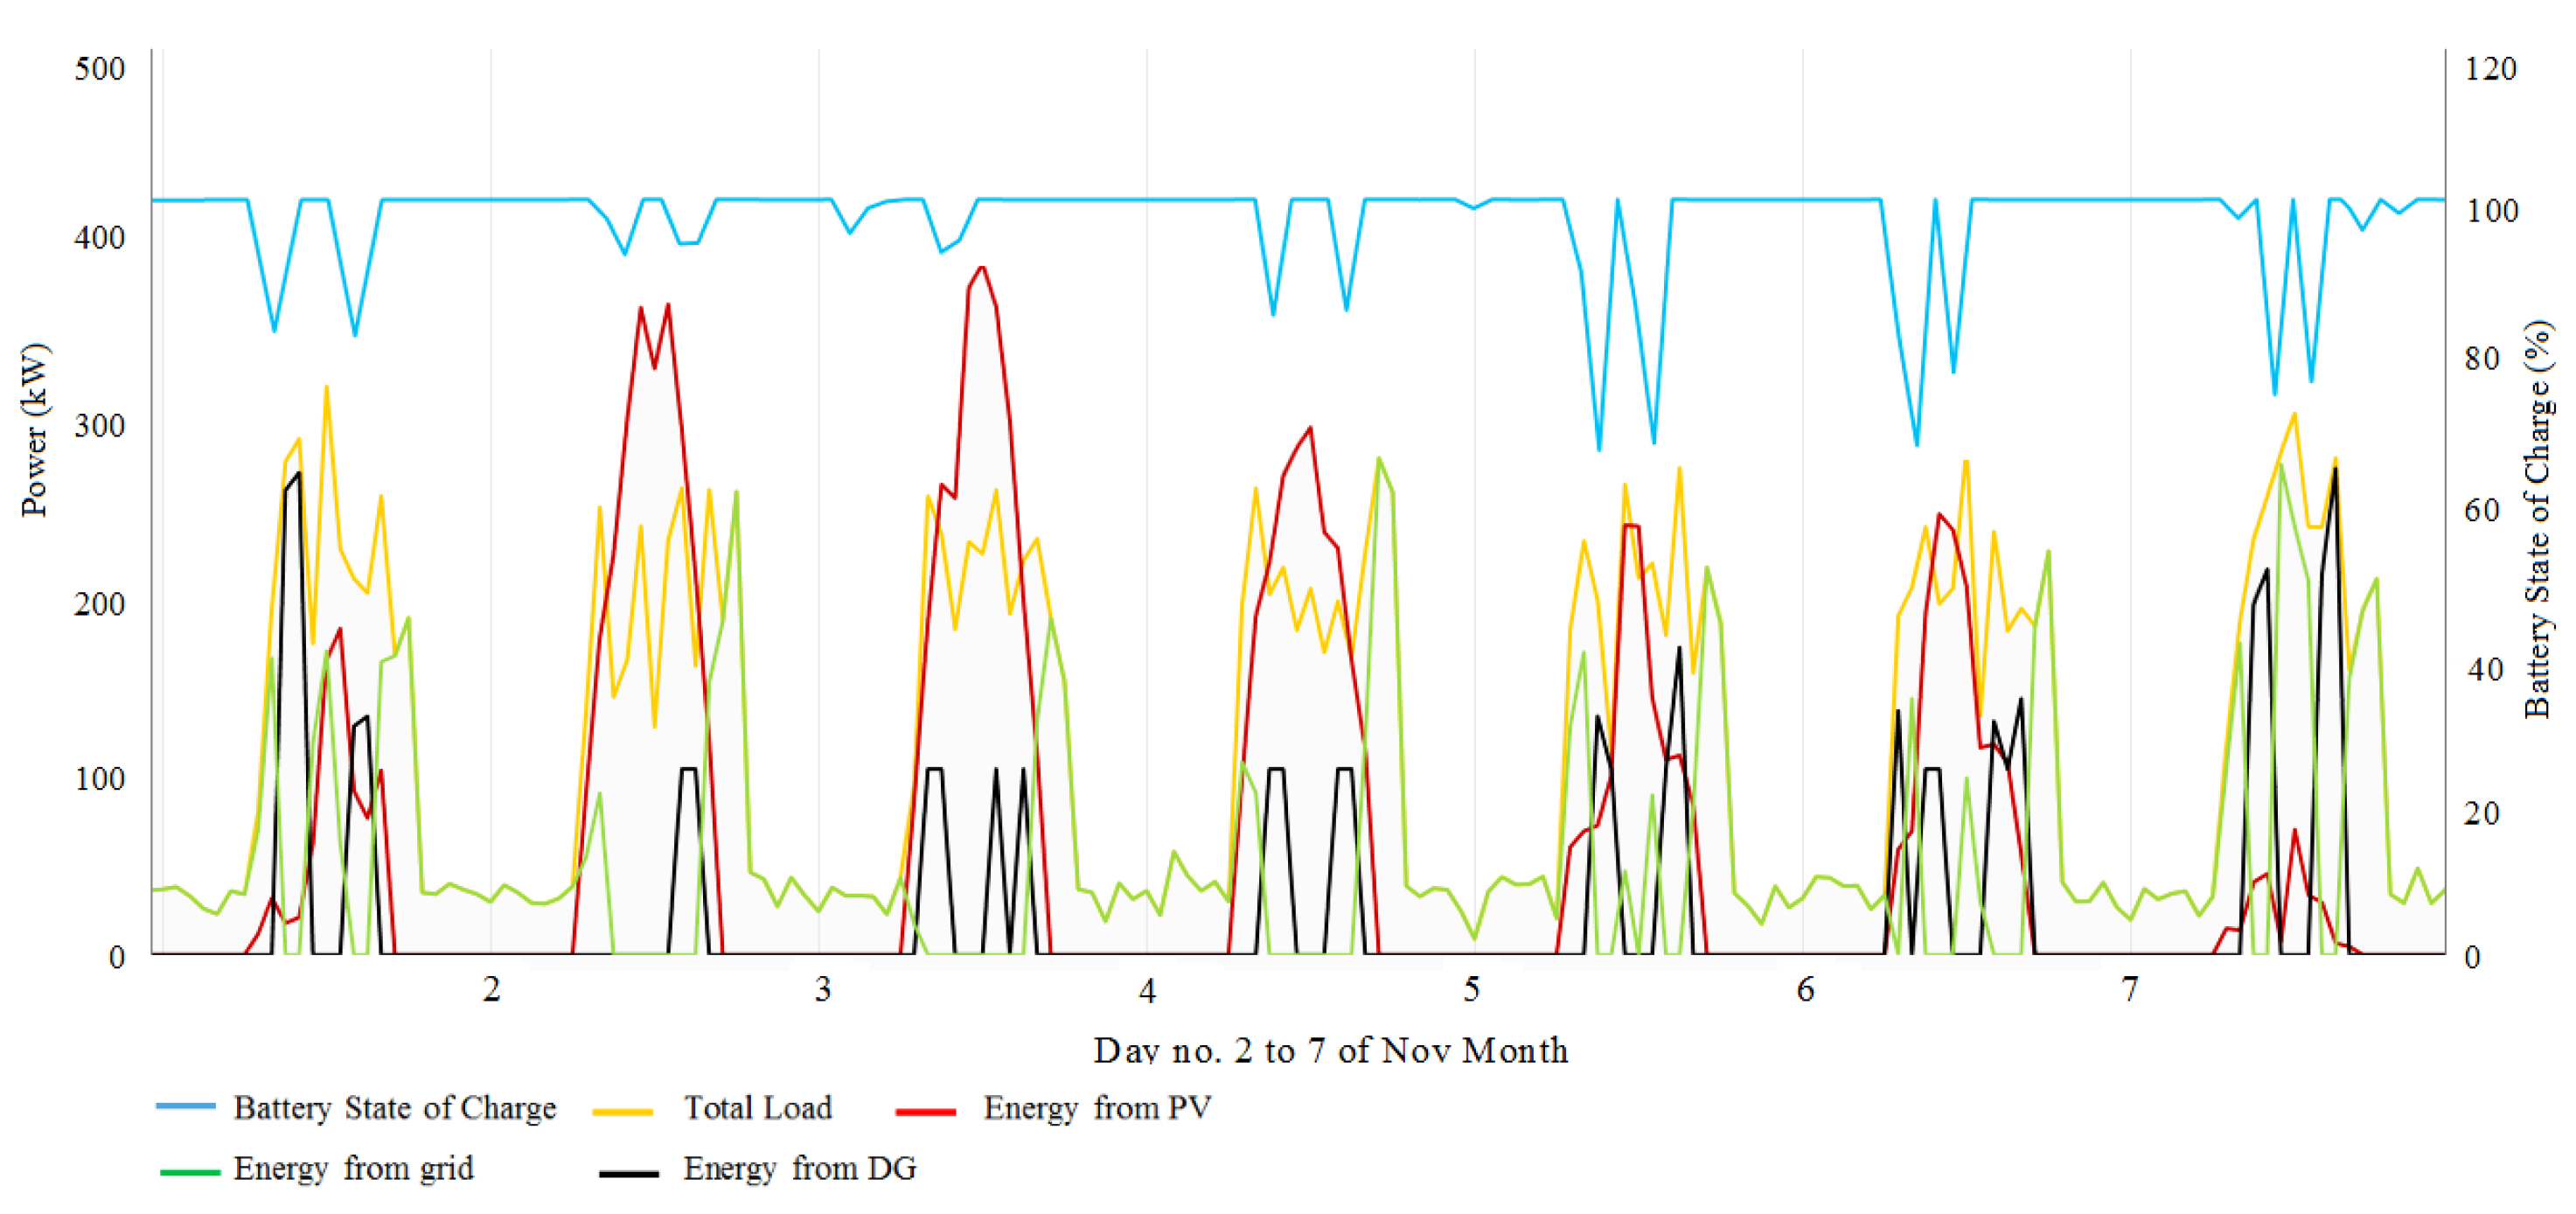
4.1.2. The Base Case with at Least 20% Penetration Rate of RESs

The results of the MG planning for the base case with an RES penetration level of 20%, as the second scenario, are shown in Table 6. In this case, the PV generation amounts to 264,449 kWh/year (23.6%), DG generation is 266,046 kWh/year (23.7%), and the main grid meets 591,369 kWh/year (52.7%) of the total load with 22,787 kWh/year excess energy (2.03%). Furthermore, 108 kWh of energy is also sold to the main grid. Moreover, the DG produces 586,959 kg/year of CO2 emission and consumes 81,453 L of fuel. This scenario reduces CO2 emissions compared to the base case without RES penetration because of the increased contribution of RESs and lower consumption of diesel fuel. The NPC for this system, however, is significantly higher due to the fact that the initial capital cost, replacement cost, and operating cost are all higher than the base scenario. The optimization results of the MG planning for this case are presented in Table 6. Figure 8 depicts the contribution of MG components to meet demand, main grid energy, total load, and excess energy for May.

4.1.3. The Base Case with at Least 40% Penetration Rate of RESs

Finally, according to Table 7, in the base scenario with at least a 40% RES penetration rate, PV panels, a DG, and a battery are assumed to be the best components for the proposed grid-connected MG. PV panels, the DG, and the main grid provide 582,402 kWh/year (46.7%), 198,097 kWh/year (16%), and 460,789 kWh/year (37.1%), respectively. The CO2 emissions, in this case, are 546,175 kg/year, while the excess energy is 91,232 kWh/year (7.35 percent). The DG’s total fuel consumption is 63018 L, and 26,020 kWh of MG energy is sold to the main grid. The MG component generations and status for November are shown in Figure 9. As shown in Figure 9, the battery is charged by the PV panels, but when the PV generation is insufficient to meet the load, the battery is discharged. In this case, the DG will meet the load and maintain a stable battery charge level.
According to the results of Table 8 and as shown in Figure 10, increasing the penetration level of RESs reduces CO2 emissions while increasing the NPC. The main problem of interest, however, is how to reduce NPC.

4.2. Incentive Policies’ Results

Three incentive policies are defined in this section to realize an MG.
A.
Reducing the investment cost of MG equipment;
B.
Increasing the price of selling energy by the MG to the main grid;
C.
Reducing the price of purchasing energy by the MG from the main grid.
Furthermore, it is assumed that the government’s incentive is conditional on the presence of the selected RES penetration rate.
A. Reducing the investment cost of MG equipment:
Under the first incentive program, the government pays a portion of the investment cost of the MG’s equipment to encourage the investors to realize the RES-based MG. For this aim, the following two cases would be considered.
A.1. The government pays 20% of the investment cost of the MG’s resources for an RES penetration rate of at least 20%:
In this case, the optimum MG design is a combination of PV panels, DGs, and batteries. While PV panels and DGs provide 264,449 kWh/year (23.6%), and 266,046 kWh/year (23.7%) of the load, respectively, the remaining 591,369 kWh/year (52.7%) is provided by the main grid. The excess energy is 2.03% of the load (22,787 kWh/year), while the energy sold to the main grid is 108 kWh. Furthermore, the amount of CO2 emissions is 586,959 kg/year, and the total fuel consumption by a DG is 81,453 L. While the components’ contributions in this scenario are the same as the base case with a 20% RES penetration level, the NPC is decreased in response to the definition of an incentive scheme.
A.2. The government pays 40% of the investment cost of the MG’s resources for an RES penetration rate of at least 40%:
A combination of PV panels, DGs, and batteries is considered to be the best configuration for the proposed grid-connected MG. The contributions of PV panels, DGs, and the main grid are 1065560 kWh/year (69.2%), 107,394 kWh/year (6.97%), and 367,966 kWh/year (23.9%) of total load, respectively. The excess energy of this plan is 245,145 kWh/year (15.9%) of the load, and the DG consumes 34,240 L of fuel in total. The amount of CO2 emissions is 322,182 kg/year is significantly lower than the other cases due to RESs’ higher penetration. The system is also financially efficient, with a 138,834 kWh energy sell-back rate to the main grid.
B. Increasing the price of selling energy by the MG to the main grid:
In the second scenario, the price of selling energy by the MG to the main grid increases as follows.
B.1. A total of 20% for the MG with at least 20% penetration rate of the RESs:
The optimal plan of this case includes the PV system, a DG, and the main grid, with the participation of 23.6% (264,449 kWh/year), 23.7% (266,046 kWh/year), and 52.7% (591,369 kWh/year), respectively. The plan’s excess energy is 2.03% of the total load (22,787 kWh/year), resulting in 108 kWh of electricity sold to the main grid. In addition, the total fuel usage of the DG is 81,453 L, and the amount of CO2 emissions is 586,959 kg/year. The amount of increase in CO2 emissions, in this case, is increased due to the lower RES penetration rate than in case A.1.
B.2. A total of 40% for the MG with at least 40% penetration rate of the RESs:
In this case, 47.9% (607,702 kWh/year), 16.3% (207,236), and 35.8% (453,553 kWh/year) of the load are provided by the PV system, a DG, and the main grid, respectively. The excess energy of this system is 8.91% (112,988 kWh/year) of the total load. Energy sold to the grid is 31,238 kWh, the CO2 emissions are 459,834 kg/year, and the total fuel consumption by the DG is 66,163 L.
C. Reducing the price of purchasing energy by the MG from the main grid:
In the third scenario, the government decreases the price of selling energy to the MG through two cases as follows:
C.1. A total of 20% reduction in the price of purchasing energy from the main grid for the MG with at least 20% penetration rate of RESs:
At the 20% penetration rate of RESs, while 23.6% of the load is satisfied through the PV system (264,449 kWh/year), DG output is 23.7% (266,046 kWh/year), and 52.7% of the load is supplied through the main grid (591,369 kWh/year). In this scenario, the CO2 emissions are 586,959 kg/year, while the total fuel use by the DG is 81453 L. Furthermore, the excess energy is 2.03% (22,787 kWh/year) of the total load, with 108 kWh sold to the main grid.
C.2. A total of 40% reduction in the price of purchasing energy from the main grid for the MG with at least 40% penetration rate of RESs:
The optimal grid-connected hybrid configuration model for this case includes the PV system, a DG, and the main grid with capacities of 627,943 kWh/year (49%), 205,748 kWh/year (16.1%), and 448,220 kWh/year (35%), respectively. The excess energy is 9.41% (120,574 kWh/year) of the load; the energy sold to the main grid is 35,806 kWh; the CO2 emissions are 455,400 kg/year. The DG consumes 65,756 L of fuel in total.

4.3. Discussion

Table 9 and Table 10 show more details of the MG’s configuration, taking into consideration incentive policies and assuming at least 20% and 40% RES penetration rates, respectively. The comparison of the scenarios in terms of CO2 emissions is shown in Table 11. It shows that at a lower RES penetration rate (i.e., 20%), the scenarios reduce CO2 emissions by the same amount. However, in terms of NPC and COE reductions, scenarios A, B, and C, respectively, have the highest NPC and COE reduction compared to the base case. Furthermore, according to Table 10, for an RES penetration level of at least 40%, scenario A gives leads to the highest reduction in NPC and COE. For scenarios B and C with an increasing RES penetration rate, not only does NPC not decrease, but it also increases due to the high initial cost of the equipment. Hence, these two incentive policies are not effective in decreasing NPC in systems with at least a 40% RES penetration. As a result, the proposed incentive policy in scenario A is suggested as the effective incentive policy from NPC and COE points of view. At this level of RES penetration, again, scenario A leads to a maximum reduction in CO2 emissions; and between scenarios B and C, scenario C has the better performance. This is due to the fact that compared to the other cases, case A has the highest PV system penetration rate. Consequently, as shown in Table 11, reducing the investment cost of MG’s equipment may be suggested as an effective incentive policy to encourage customers to utilize MG-produced energy rather than purchasing electricity from the main grid.
To further justify the proposed formulation, individual system component costs for scenarios A.1 and A.2 are presented in Figure 11 and Figure 12, respectively. According to these figures, the PV system’s initial capital cost is the system’s dominant cost in both cases.
The simulation results of the main grid, PV system, DG, and battery, which are the fundamental elements of the hybrid system optimization process, are shown in Figure 13. The figure depicts the daily trend of the PV system and DG power generations, total load, battery SOC, energy from the main grid, and grid sales for the period of 1–7 June. Extra energy exists when the PV power provides the load, as shown in Figure 13; at these times, the DG is turned off and the excess energy is sold to the main grid. When PV generation is less than the load, the DG works to feed the load.
The fluctuation in the SOC of the battery as well as the contribution of the DG for recovering SOC for each month of the year is depicted in Figure 14. It is worth noting that the minimum value of SOC does not fall below 40%, even during the months with the least solar radiation. On three days in April, July, and December, the SOC of the battery reaches its lowest level; however, the blackout was prevented due to the availability of the DG.

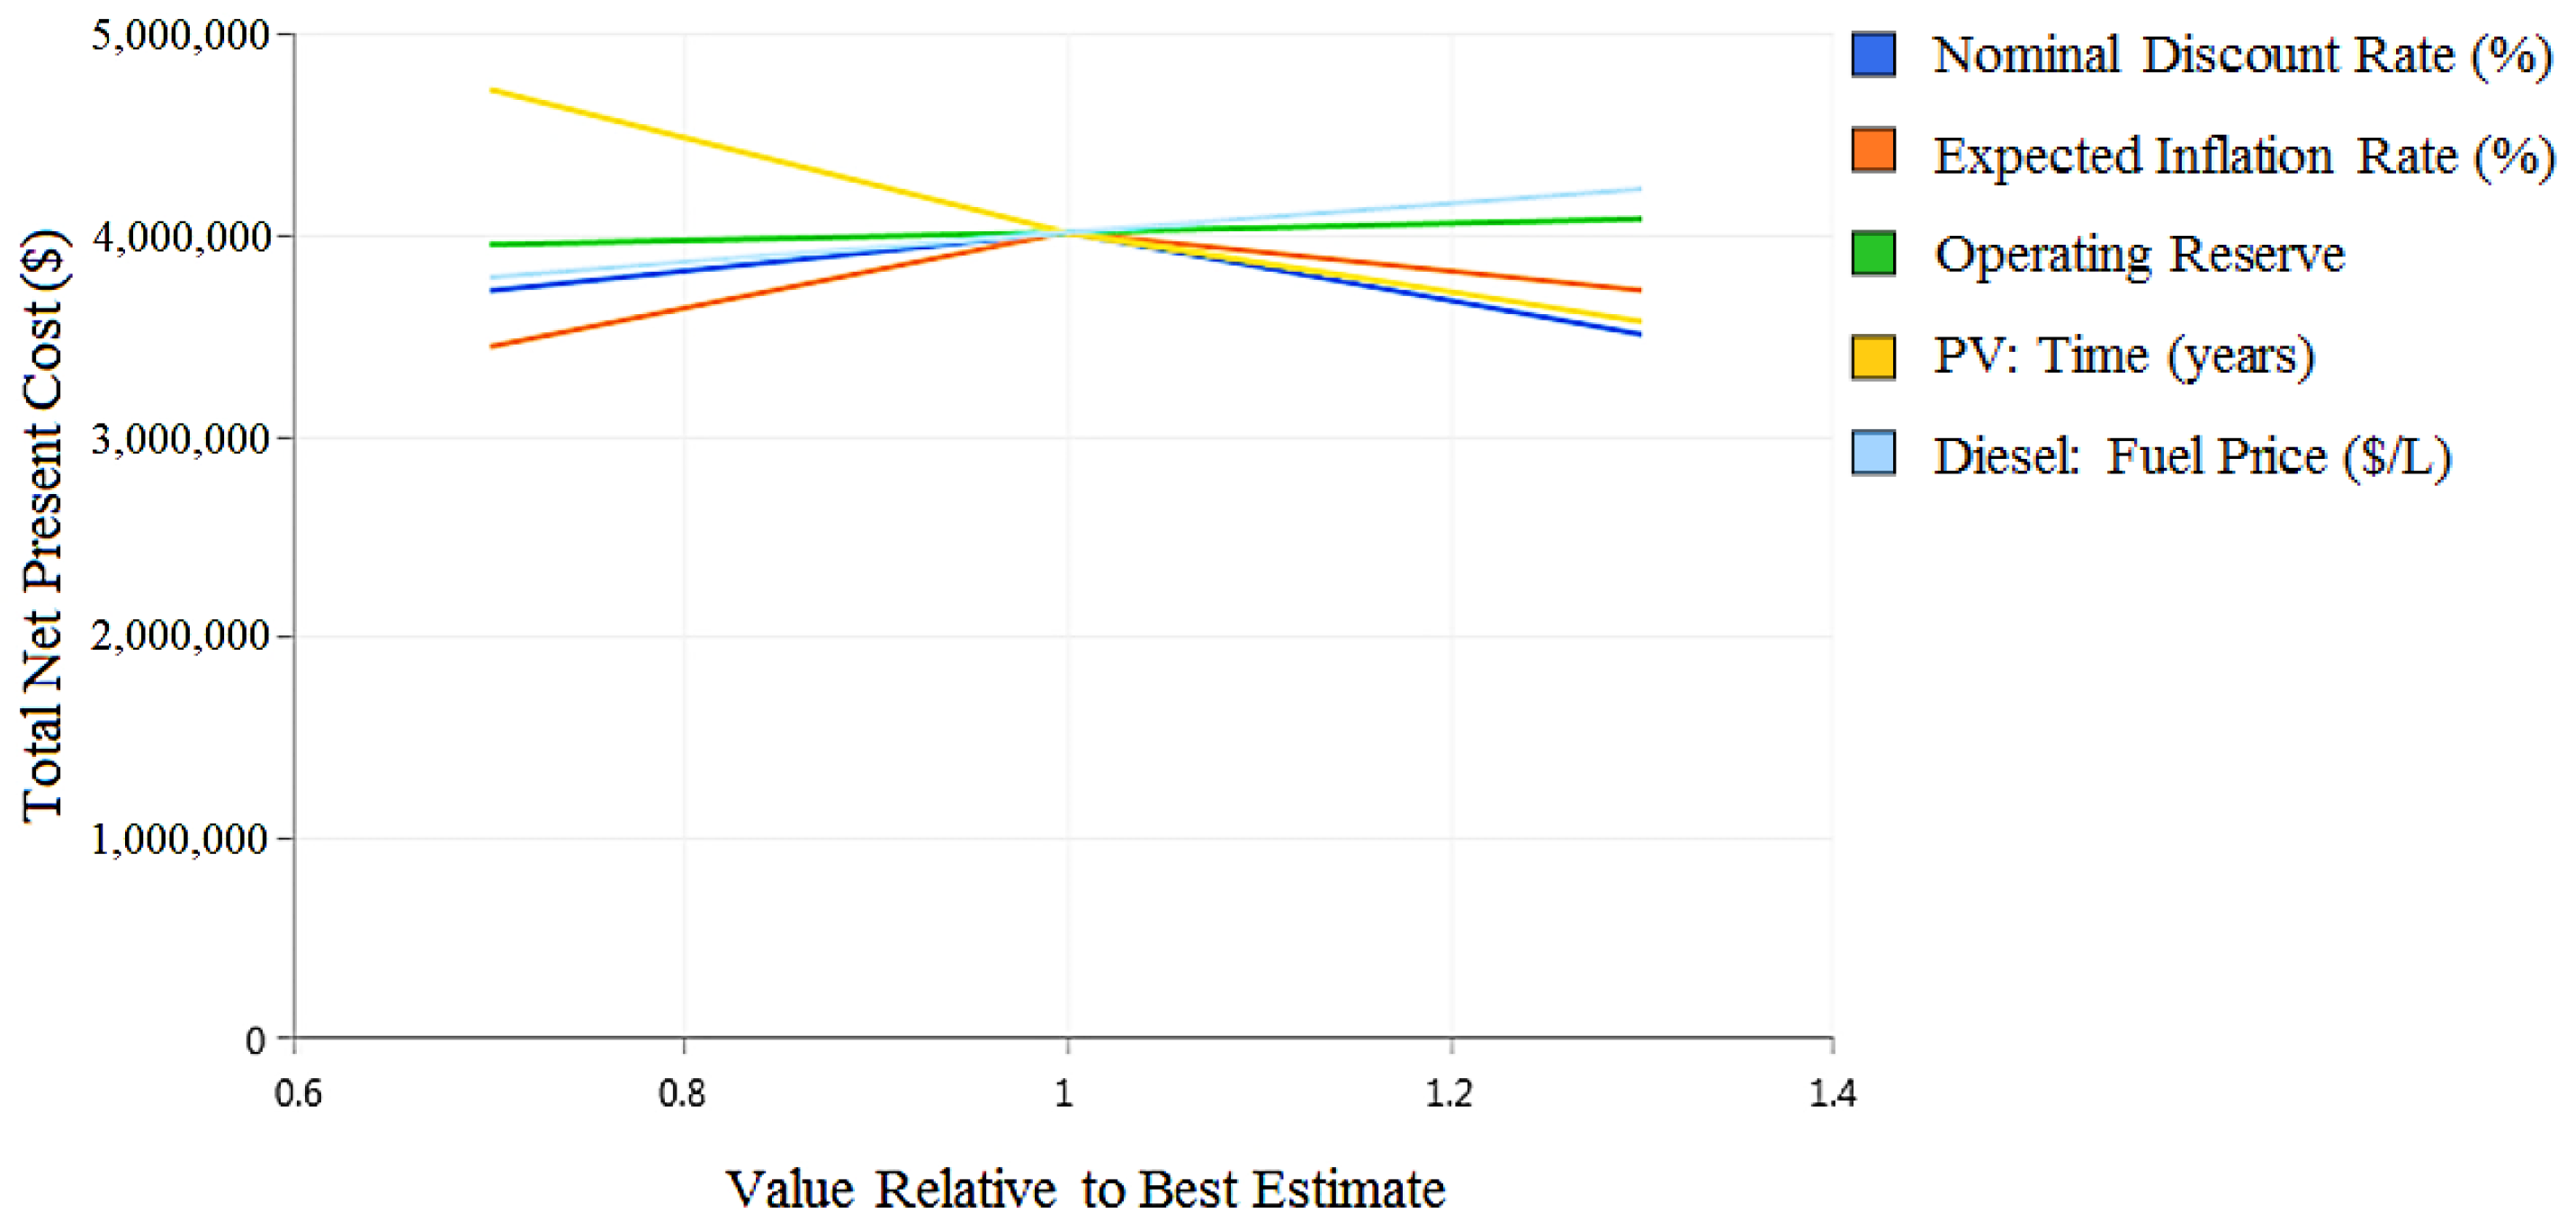
5. Uncertainty in Key Variables

One of the main challenges for MG designers is uncertainties in the key parameters of interest. This section investigates the impact of the nominal discount rate, expected inflation rate, PV lifetime, DG fuel price, and optimal reserve on the NPC. This study takes 30 percent uncertainty into account for the variables. The spider graph in Figure 15 shows the sensitivity of NPC to each type of uncertain parameter. As a result, the NPC is more sensitive to the nominal discount rate, expected inflation rate, and PV lifetime.

6. Conclusions

In this paper, the optimal combination and size of an MG’s energy resources are determined to power an educational complex in Iran, considering the incentive policies. The suggested resources in the MG are the PV system, DGs, batteries, and inverter-based sources. The simulation was conducted using the HOMER software as an accepted powerful tool for optimal planning of the MG. The base case results showed that the DGs, in addition to trading energy with the main grid, are the only choices to supply the load. The NPC and the amount of CO2 emission of the best plan are USD 4.94 million and 734,498 kg/year. Then, three incentive policies are defined, where for each of them, two scenarios consisting of at least 20% and 40% penetration rate of RESs are proposed. The main conclusions from applying these incentive policies to the planning problem of the MG are as follows:
  • The case with an incentive policy for the investment cost of the MG’s resources has the maximum impact on the NPC reduction.
  • The maximum CO2 and NPC reduction occurred in the case of reducing the investment cost of the MG’s equipment.
  • The sensitivity analysis results, carried out based on a variation of some parameters, including the expected inflation rate, the PV lifetime, DG fuel price, and optimal reserve show a significant influence of the nominal discount rate, expected inflation rate, and PV lifetime on the NPC.
  • The considering incentive policy for investors has resulted in increasing RES penetration and minimizing the dependence on harmful emissions and fossil fuels. Finally, it should be noted that the present work fails to consider uncertainties in load and weather data, which may affect simulation results. Furthermore, the results for the high penetration of inverter-based sources should consider technical aspects regarding stability rather than the economical perspective.

Author Contributions

Data curation, S.A.; Formal analysis, S.A., S.B. and H.G.; Software, S.A.; Supervision, S.B. and H.G.; Validation, H.G.; Writing—original draft, S.A.; Writing—review & editing, S.B., H.G., B.F. and J.S. All authors have read and agreed to the published version of the manuscript.

Funding

João Soares has received funding from FCT, namely CEECIND/02814/2017 and UIDB/00760/2020.

Data Availability Statement

Data is contained within the article.

Conflicts of Interest

The authors declare no conflict of interest.

Nomenclature

Parameters
A Fuel curve intercept coefficient[unit/hour/kW]
cBattery capacity ratio-
D PV PV de-rating factor[%]
EESS,ratedNominal energy capacity[Ah]
ESuppliedTotal supplied electrical[kW]
F t DG Fuel consumption of diesel generator[kWh/L]
iAnnual interest rate[%]
IBatBattery current[A]
kBattery rate constant[h-1]
NProject lifetime[year]
p(t)Battery power[kW]
P ¯ DG The generator’s rated capacity[kW]
P Demand Total demand of the MG[kW]
P ¯ PV The PV array’s rated capacity[kW]
S R PV_Stan . Incident radiation at standard test conditions[kW/m2]
T PV_Stan . Cell temperature under standard test conditions[°C]
VBatBattery voltage[V]
αpTemperature coefficient of power[%/°C]
ζcCharging efficiencies[%]
ζdDischarging efficiencies[%]
Variables
BFuel curve slope[units/hour/kW]
EProductionNon-RES production[kWh/year]
QTotal quantity of energy stored at the start of the time step[kWh]
Q1Available energy[kWh]
Q1,endAvailable energy at the end of Δt[kWh]
Q2Bound energy[kWh]
Q2,endBound energy the end of Δt[kWh]
QBatBattery charge[kWh]
QBat,0Initial battery charge[kWh]
QmaxTotal capacity of the storage bank[kWh]
S R t PV Solar radiation incident on the PV array in the current time step[kW/m2]
T t PV PV array temperature in the present time step[°C]
ΔtCharge/discharge time[hour]
η Inverter Inverter efficiency[%]
Decision Variable
C Annual Total annual NPC[USD/year]
P t DG Electrical output of the generator[kW]
P t in_inv . Input power of inverter[kW]
P t out_inv . Output power of inverter[kW]
P t PV Output power from panels[kW]
Acronyms
CO2Carbon Dioxide-
DGDiesel generator-
GHGGreenhouse gas-
LCOElevelized cost of energy[USD]
MGMicrogrid-
NPCNet present cost[USD]
O&MOperation and Maintenance [USD]
PVPhotovoltaic-
RFRenewable fraction[%]

References

  1. Golpîra, H.; Seifi, H.; Haghifam, M.R. Dynamic equivalencing of an active distribution network for large-scale power system frequency stability studies. IET Gener. Transm. Distrib. 2015, 9, 2245–2254. [Google Scholar] [CrossRef]
  2. Golpîra, H.; Amini, S.; Atarodi, A.; Bevrani, H. A data-driven inertia adequacy-based approach for sustainable expansion planning in distributed generations-penetrated power grids. IET Gener. Transm. Distrib. 2022, 16, 4614–4629. [Google Scholar] [CrossRef]
  3. Minh, Q.N.; Oad, A. Edge Computing for IoT-Enabled Smart Grid: The Future of Energy. Energies 2022, 15, 6140. [Google Scholar] [CrossRef]
  4. Bahramara, S.; Moghaddam, M.P.; Haghifam, M.R. Optimal planning of hybrid renewable energy systems using HOMER: A review. Renew. Sustain. Energy Rev. 2016, 62, 609–620. [Google Scholar] [CrossRef]
  5. Baruah, A.; Basu, M.; Amuley, D. Modeling of an autonomous hybrid renewable energy system for electrification of a township: A case study for Sikkim, India. Renew. Sustain. Energy Rev. 2020, 135, 110158. [Google Scholar] [CrossRef]
  6. Sadeghi, D.; Naghshbandy, A.H.; Bahramara, S. Optimal sizing of hybrid renewable energy systems in presence of electric vehicles using multi-objective particle swarm optimization. Energy 2020, 209, 118471. [Google Scholar] [CrossRef]
  7. Kotb, K.M.; Elkadeem, M.; Elmorshedy, M.F.; Dán, A. Coordinated power management and optimized techno-enviro-economic design of an autonomous hybrid renewable microgrid: A case study in Egypt. Energy Convers. Manag. 2020, 221, 113185. [Google Scholar] [CrossRef]
  8. Mostafaeipour, A.; Qolipour, M.; Rezaei, M.; Goudarzi, H. Techno-economic assessment of using wind power system for tribal region of Gachsaran in Iran. J. Eng. Des. Technol. 2020, 18, 293–307. [Google Scholar] [CrossRef]
  9. Chambon, C.L.; Karia, T.; Sandwell, P.; Hallett, J.P. Techno-economic assessment of biomass gasification-based mini-grids for productive energy applications: The case of rural India. Renew. Energy 2020, 154, 432–444. [Google Scholar] [CrossRef]
  10. Elkadeem, M.; Wang, S.; Azmy, A.M.; Atiya, E.G.; Ullah, Z.; Sharshir, S.W. A systematic decision-making approach for planning and assessment of hybrid renewable energy-based microgrid with techno-economic optimization: A case study on an urban community in Egypt. Sustain. Cities Soc. 2020, 54, 102013. [Google Scholar] [CrossRef]
  11. Taghavifar, H.; Zomorodian, Z.S. Techno-economic viability of on grid micro-hybrid PV/wind/Gen system for an educational building in Iran. Renew. Sustain. Energy Rev. 2021, 143, 110877. [Google Scholar] [CrossRef]
  12. Rad, M.A.V.; Ghasempour, R.; Rahdan, P.; Mousavi, S.; Arastounia, M. Techno-economic analysis of a hybrid power system based on the cost-effective hydrogen production method for rural electrification, a case study in Iran. Energy 2020, 190, 116421. [Google Scholar] [CrossRef]
  13. Ghasemi, A.; Asrari, A.; Zarif, M.; Abdelwahed, S. Techno-economic analysis of stand-alone hybrid photovoltaic–diesel–battery systems for rural electrification in eastern part of Iran—A step toward sustainable rural development. Renew. Sustain. Energy Rev. 2013, 28, 456–462. [Google Scholar] [CrossRef]
  14. Abnavi, M.D.; Mohammadshafie, N.; Rosen, M.A.; Dabbaghian, A.; Fazelpour, F. Techno-economic feasibility analysis of stand-alone hybrid wind/photovoltaic/diesel/battery system for the electrification of remote rural areas: Case study Persian Gulf Coast-Iran. Environ. Prog. Sustain. Energy 2019, 38, 13172. [Google Scholar] [CrossRef]
  15. Aghapouramin, K. Techno-Economic Assessment of Hybrid Renewable Energy Systems for Residential Complexes of Tabriz City, Iran. Strat. Plan. Energy Environ. 2022, 41, 99–130. [Google Scholar] [CrossRef]
  16. Jahangir, M.H.; Mousavi, S.A.; Rad, M.A.V. A techno-economic comparison of a photovoltaic/thermal organic Rankine cycle with several renewable hybrid systems for a residential area in Rayen, Iran. Energy Convers. Manag. 2019, 195, 244–261. [Google Scholar] [CrossRef]
  17. Goudarzi, S.A.; Fazelpour, F.; Gharehpetian, G.B.; Rosen, M.A. Techno-economic assessment of hybrid renewable resources for a residential building in tehran. Environ. Prog. Sustain. Energy 2019, 38, 13209. [Google Scholar] [CrossRef]
  18. Ghorbani, N.; Kasaeian, A.; Toopshekan, A.; Bahrami, L.; Maghami, A. Optimizing a hybrid wind-PV-battery system using GA-PSO and MOPSO for reducing cost and increasing reliability. Energy 2018, 154, 581–591. [Google Scholar] [CrossRef]
  19. Amrollahi, M.H.; Bathaee, S.M.T. Techno-economic optimization of hybrid photovoltaic/wind generation together with energy storage system in a stand-alone micro-grid subjected to demand response. Appl. Energy 2017, 202, 66–77. [Google Scholar] [CrossRef]
  20. Halabi, L.M.; Mekhilef, S.; Olatomiwa, L.; Hazelton, J. Performance analysis of hybrid PV/diesel/battery system using HOMER: A case study Sabah, Malaysia. Energy Convers. Manag. 2017, 144, 322–339. [Google Scholar] [CrossRef]
  21. Hafez, O.; Bhattacharya, K. Optimal planning and design of a renewable energy based supply system for microgrids. Renew. Energy 2012, 45, 7–15. [Google Scholar] [CrossRef]
  22. Das, B.K.; Hoque, N.; Mandal, S.; Pal, T.K.; Raihan, A. A techno-economic feasibility of a stand-alone hybrid power generation for remote area application in Bangladesh. Energy 2017, 134, 775–788. [Google Scholar] [CrossRef]
  23. Movahediyan, Z.; Askarzadeh, A. Multi-objective optimization framework of a photovoltaic-diesel generator hybrid energy system considering operating reserve. Sustain. Cities Soc. 2018, 41, 1–12. [Google Scholar] [CrossRef]
  24. Mandal, S.; Das, B.K.; Hoque, N. Optimum sizing of a stand-alone hybrid energy system for rural electrification in Bangladesh. J. Clean. Prod. 2018, 200, 12–27. [Google Scholar] [CrossRef]
  25. Zhang, W.; Maleki, A.; Rosen, M.A.; Liu, J. Optimization with a simulated annealing algorithm of a hybrid system for renewable energy including battery and hydrogen storage. Energy 2018, 163, 191–207. [Google Scholar] [CrossRef]
  26. Singh, S.; Singh, M.; Kaushik, S.C. Feasibility study of an islanded microgrid in rural area consisting of PV, wind, biomass and battery energy storage system. Energy Convers. Manag. 2016, 128, 178–190. [Google Scholar] [CrossRef]
  27. Aykut, E.; Terzi, K. Techno-economic and environmental analysis of grid connected hybrid wind/photovoltaic/biomass system for Marmara University Goztepe campus. Int. J. Green Energy 2020, 17, 1036–1043. [Google Scholar] [CrossRef]
  28. Gamil, M.M.; Lotfy, M.E.; Hemeida, A.M.; Mandal, P.; Takahashi, H.; Senjyu, T.; Co, L.F.E. Optimal sizing of a residential microgrid in Egypt under deterministic and stochastic conditions with PV/WG/Biomass Energy integration. AIMS Energy 2021, 9, 483–515. [Google Scholar] [CrossRef]
  29. Abid, M.Z.; Yousif, M.; Ullah, S.; Hassan, M. Design, sizing and economic feasibility of a hybrid PV/diesel/battery based water pumping system for farmland. Int. J. Green Energy 2021, 19, 614–637. [Google Scholar] [CrossRef]
  30. Ribó-Pérez, D.; Herraiz-Cañete, Á.; Alfonso-Solar, D.; Vargas-Salgado, C.; Gómez-Navarro, T. Modelling biomass gasifiers in hybrid renewable energy microgrids; a complete procedure for enabling gasifiers simulation in HOMER. Renew. Energy 2021, 174, 501–512. [Google Scholar] [CrossRef]
  31. Barua, A.; Jain, A.K.; Mishra, P.K.; Singh, D. Design of grid connected microgrid with solar photovoltaic module. Mater. Today: Proc. 2021, 47, 6971–6975. [Google Scholar] [CrossRef]
  32. Ghiasi, M. Detailed study, multi-objective optimization, and design of an AC-DC smart microgrid with hybrid renewable energy resources. Energy 2019, 169, 496–507. [Google Scholar] [CrossRef]
  33. Ghiasi, M.; Niknam, T.; Dehghani, M.; Siano, P.; Alhelou, H.H.; Al-Hinai, A. Optimal Multi-Operation Energy Management in Smart Microgrids in the Presence of RESs Based on Multi-Objective Improved DE Algorithm: Cost-Emission Based Optimization. Appl. Sci. 2021, 11, 3661. [Google Scholar] [CrossRef]
  34. Rashid, M.U.; Ullah, I.; Mehran, M.; Baharom, M.N.R.; Khan, F. Techno-Economic Analysis of Grid-Connected Hybrid Renewable Energy System for Remote Areas Electrification Using Homer Pro. J. Electr. Eng. Technol. 2022, 17, 981–997. [Google Scholar] [CrossRef]
  35. Aziz, A.S.; Tajuddin, M.F.N.; Zidane, T.E.K.; Su, C.-L.; Alrubaie, A.J.K.; Alwazzan, M.J. Techno-economic and environmental evaluation of PV/diesel/battery hybrid energy system using improved dispatch strategy. Energy Rep. 2022, 8, 6794–6814. [Google Scholar] [CrossRef]
  36. Kalappan, B.; Amudha, A.; Keerthivasan, K. Techno-economic study of hybrid renewable energy system of Metropolitan Cities in India. Int. J. Ambient Energy 2022, 43, 1408–1412. [Google Scholar] [CrossRef]
  37. Islam, M.R.; Akter, H. Optimal Sizing and Techno-Economic Analysis of Grid-Independent Hybrid Energy System for Sustained Rural Electrification in Developing Countries: A Case Study in Bangladesh. Energies 2022, 15, 6381. [Google Scholar] [CrossRef]
  38. Dong, C. Feed-in tariff vs. renewable portfolio standard: An empirical test of their relative effectiveness in promoting wind capacity development. Energy Policy 2012, 42, 476–485. [Google Scholar] [CrossRef]
  39. González, P.D.R. Ten years of renewable electricity policies in Spain: An analysis of successive feed-in tariff reforms. Energy Policy 2008, 36, 2917–2929. [Google Scholar] [CrossRef]
  40. Chen, W.; Wei, P. Socially optimal deployment strategy and incentive policy for solar photovoltaic community microgrid: A case of China. Energy Policy 2018, 116, 86–94. [Google Scholar] [CrossRef]
  41. Mondol, J.D.; Koumpetsos, N. Overview of challenges, prospects, environmental impacts and policies for renewable energy and sustainable development in Greece. Renew. Sustain. Energy Rev. 2013, 23, 431–442. [Google Scholar] [CrossRef]
  42. Zhou, Y.; Wang, L.; McCalley, J.D. Designing effective and efficient incentive policies for renewable energy in generation expansion planning. Appl. Energy 2011, 88, 2201–2209. [Google Scholar] [CrossRef]
  43. Careri, F.; Genesi, C.; Marannino, P.; Montagna, M.; Rossi, S.; Siviero, I. Generation Expansion Planning in the Age of Green Economy. IEEE Trans. Power Syst. 2011, 26, 2214–2223. [Google Scholar] [CrossRef]
  44. Zame, K.K.; Brehm, C.A.; Nitica, A.T.; Richard, C.L.; Schweitzer, G.D., III. Smart grid and energy storage: Policy recommendations. Renew. Sustain. Energy Rev. 2018, 82, 1646–1654. [Google Scholar] [CrossRef]
  45. Brka, A.; Al-Abdeli, Y.M.; Kothapalli, G. Predictive power management strategies for stand-alone hydrogen systems: Operational impact. Int. J. Hydrogen Energy 2016, 41, 6685–6698. [Google Scholar] [CrossRef]
  46. Golpira, H.; Atarodi, A.; Amini, S.; Messina, A.R.; Francois, B.; Bevrani, H. Optimal Energy Storage System-Based Virtual Inertia Placement: A Frequency Stability Point of View. IEEE Trans. Power Syst. 2020, 35, 4824–4835. [Google Scholar] [CrossRef]
  47. Golpîra, H.; Román-Messina, A.; Bevrani, H. Renewable Integrated Power System Stability and Control; John Wiley & Sons: Hoboken, NJ, USA, 2021. [Google Scholar]
  48. Gebrehiwot, K.; Mondal, A.H.; Ringler, C.; Gebremeskel, A.G. Optimization and cost-benefit assessment of hybrid power systems for off-grid rural electrification in Ethiopia. Energy 2019, 177, 234–246. [Google Scholar] [CrossRef]
  49. Average Weather at Sanandaj. Available online: https://www.accuweather.com (accessed on 13 March 2021).
  50. Naderi, M.; Bahramara, S.; Khayat, Y.; Bevrani, H. Optimal planning in a developing industrial microgrid with sensitive loads. Energy Rep. 2017, 3, 124–134. [Google Scholar] [CrossRef]
  51. Sadat, S.A.; Faraji, J.; Babaei, M.; Ketabi, A. Techno-economic comparative study of hybrid microgrids in eight climate zones of Iran. Energy Sci. Eng. 2020, 8, 3004–3026. [Google Scholar] [CrossRef]
Figure 1. The average radiation and the amount of energy [49].
Energies 15 08285 g001
Figure 2. Monthly average data of temperature.
Energies 15 08285 g002
Figure 3. The seasonal load profile.
Energies 15 08285 g003
Figure 4. The typical daily load profile.
Energies 15 08285 g004
Figure 7. MG energy flow for 15–21 July.
Energies 15 08285 g007
Figure 8. MG energy flows for 4–10 May.
Energies 15 08285 g008
Figure 9. MG energy flows for 2–7 November.
Energies 15 08285 g009
Figure 10. Variation of NPC and CO2 emissions with a renewable fraction.
Energies 15 08285 g010
Figure 11. Cost summary for case A.1.
Energies 15 08285 g011
Figure 12. Cost summary for case A.2.
Energies 15 08285 g012
Figure 13. Energy contribution from different sources for 1–7 days of Jun month for case A.2.
Energies 15 08285 g013
Figure 14. Monthly variation of the battery state-of-charge.
Energies 15 08285 g014
Figure 15. The spider graph of the effect of variations in six key sensitivity variables.
Energies 15 08285 g015
Table 1. The specification of hybrid system simulation research works.
Ref.MG ModeComponentOptimization ToolObjective FunctionsIncentive Policy
Total Cost MinimizationPollution Emissions Minimization
[18]Stand-aloneWT/PV/BatteryGenetic algorithm (GA), PSO and multi-objective PSO algorithms, and HOMER software--
[19]Stand-alonePV/WT/BatteryHOMER and GAMS--
[20]Stand-alonePV/DG/BatteryHOMER--
[21]Grid-connected/Stand-aloneDG/PV/WT/Micro/HydroHOMER--
[22]Stand-aloneBiogas generator/PV/DG/WT/BatteryHOMER--
[23]Stand-alonePV/DGCrow search algorithm-
[24]Stand-alonePV/WT/DG/BatteryHOMER--
[25]Stand-alonePV/WT/Hydrogen storage/BatteryHybrid chaotic search, harmony search, simulated annealing algorithms--
[12]Grid-connected/Stand-alonePV/WT/Biogas generator/Fuel cellHOMER-
[26]Stand-alonePV/WT/DG/Biogas generator/BatteryArtificial bee colony (ABC), PSO algorithms, and HOMER--
[27]Grid-connectedPV/WT/Biogas generator/BatteryHOMER--
[28]Stand-aloneWT/PV/Battery/Biomass generatorMulti-objective GA, epsilon multi-objective genetic algorithm (ε-MOGA)--
[29]Stand-alonePV/Diesel/BatteryHOMER--
[30]Grid-connectedPV/Biomass gasifiers/BatteryHOMER--
[31]Grid-connectedPV/DG/BatteryHOMER--
[32]Grid-connectedPV/WT/BatteryMOPSO and MOGA--
[33]Grid-connectedPV/WT/Microturbine/Fuel cell/BatteryImproved differential evolutionary and PSO techniques-
[34]Grid-connectedPV/WT/Battery/Fuel cell/Electrolyzer/Hydrogen tankHOMER--
[35]Stand-alonePV/DG/BatteryHOMER-
[36]Stand-alonePV/WT/BatteryHOMER--
[37]Stand-alonePV/WT/Battery/DGHOMER-
This paperGrid-connectedPV/DG/BatteryHOMER
“✓” refers to considered; “-” refers to not considered.
Table 2. Classified breakdown of educational complex loads.
ParticularsTotal Energy Consumption (%)
Uninterrupted power supply35
Air conditioning26
Air handling unit10
Lighting15
Others14
Table 5. The best optimization results of the MG planning for the base case.
ScenarioGrid (kW)DG (kW)PV (kW)Converter (kW)Energy Storage (n)Initial
Capital
(USD in Millions)
Operating Cost
(USD/year)
COE
(USD)
NPC
(USD in Millions)
RF (%)
Base case6003500000.35267187,2760.1934.940
Table 6. The best optimization results of the MG planning for the base case with at least 20% penetration rate of RESs.
ScenarioGrid (kW)DG (kW)PV (kW)Converter (kW)Energy Storage (n)Initial
Capital
(USD in Millions)
Operating Cost
(USD/year)
COE
(USD)
NPC
(MUSD)
RF (%)
Base case with at least 20% penetration rate of RESs60038016424801.48158,0790.2105.3020.1
Table 7. The best optimization results of the MG planning for the base case with at least 40% penetration rate of RESs.
ScenarioGrid (kW)DG (kW)PV (kW)Converter (kW)Energy Storage (n)Initial
Capital
(USD in Millions)
Operating Cost
(USD/year)
COE
(USD)
NPC
(MUSD)
RF (%)
Base case with at least 40% penetration rate of RESs6003803623221203.07129,6160.2465.9140.1
Table 8. Overall effects of RES penetration on the NPC and CO2 emissions.
ScenarioRF (%)CO2 Emissions (kg/year)COE (USD)NPC (MUSD)
Base case0734,4980.1934.94
Base case with at least 20% penetration rate of RESs20.1586,9590.2105.30
Base case with at least 40% penetration rate of RESs40.1546,1750.2465.91
Table 9. Optimization result of the proposed MG system with 20% injections of RESs.
PlanGrid (kW)DG (kW)PV (kW)Converter (kW)Battery (n)Initial
Capital
(USD in Millions)
Operating Cost
(USD)
COE
(USD/kWh)
NPC
(USD in Millions)
RF (%)
A.1600380164248201.2129,5440.1724.0320.1
B.160038016424801.48128,4240.1834.2920.1
C.1600380164248401.5128,3900.1834.3120.1
Table 10. Optimization result of proposed MG system with 40% injections of RESs.
PlanGrid (kW)DG (kW)PV (kW)Converter (kW)Battery (n)Initial
Capital
(USD in Millions)
Operating Cost
(USD)
CoE
(USD/kWh)
NPC
(USD in Milliona)
RF (%)
A.26004006614511403.1729,1820.1443.8160.8
B.2600410377367803.0998,2700.2175.2440.2
C.260041039034603.0596,0680.2175.2641.0
Table 11. Summary of NPC, COE, and CO2 emissions compression between cases.
Case ACase BCase C
A.1A.2B.1B.2C.1C.2
NPC compared to the base case (%)−18.42−22.87−13.15+0.06−12.75+0.06
COE compared to the base case (%)−10.88−25.38−0.01+12.43−0.01+12.43
CO2 emissions compared to the base case (%)−20.8−56.13−20.8−37.39−20.8−37.99
Publisher’s Note: MDPI stays neutral with regard to jurisdictional claims in published maps and institutional affiliations.

