1. Introduction
Monte Carlo (MC) simulations are widely used for nuclear reactor core analysis because of their capability of handling heterogeneous geometries and continuous energy cross-section libraries. While many MC simulation codes have been verified and validated in reactor physics experiments and operating power reactors, attempts to validate fast reactor cores are still limited due to the lack of benchmark problems and limited operating experience. In this light, the International Atomic Energy Agency (IAEA) initiated a new coordinated research project (CRP) for the start-up tests of the China Experimental Fast Reactor (CEFR) [
1] with the aid of the China Institute of Atomic Energy (CIAE) [
2].
The CEFR, the first fast reactor in China, reached its first criticality in 2010 [
2]. It is a small pool-type sodium-cooled fast reactor with an active core height of 500 mm. The thermal power of the CEFR is 65 MW, and its core is loaded with oxide fuels with an enrichment of 64.4 wt.%. The data provided by the CRP are valuable to understand experimental procedures in pool-type sodium fast reactors, and the measurement data can further be utilized for neutronics code validation. Therefore, many participants from various organizations in the world have filed applications for CRP data and submitted their own analysis results of the CEFR [
3]. These results include MC calculations from various MC codes, such as MCNP [
4], Serpent [
5], OpenMC [
6], MCS [
7], and McCARD [
8].
In various experiments conducted in the course of the CEFR start-up tests, the reactivity of temperature, sodium void, and sub-assembly swap were measured via control rod worth. The critical rod positions were recorded at every measurement step, and the position changes were converted to reactivity using pre-obtained control rod worth curves, or S-curves. Here, the uncertainty of the reactivity should include the propagated error from the rod worth curves, but the formulation of uncertainty as well as its impact on the related numerical analyses has not been thoroughly studied yet. While most of the MC simulation results from MCS [
9], Serpent2 [
10], and OpenMC [
10,
11] showed a suitable agreement with the reactivity measurements, detailed procedures for obtaining the uncertainty contribution from the rod worth curves were not described or only briefly discussed. Additionally, MC calculation results have shown consistently large errors for some reactivity measurements, but the reason has yet to be identified.
Our previous work showed that the uncertainty from S-curves can be represented as a function of the critical rod positions under some assumptions [
12]. The uncertainty can increase or decrease with respect to the control rod position changes before and after reactivity insertion. However, we found out that the statistical uncertainty from the S-curves is still too small to explain the large errors in some numerical results.
In this work, we rigorously derive the uncertainty of the reactivity in terms of the statistical uncertainty of the S-curves under an assumption of linear interpolation. Additionally, we introduce a numerical error term for the calculation error of the control rod worth to assess the effect of control rod worth error on the reactivity calculations. McCARD MC simulations are conducted with the ENDF/B-VII.0 library [
13] to obtain numerical results of the reactivity measurements in the CEFR, and these results are compared with the measurements in terms of the estimated uncertainty. The uncertainty components are separately quantified for each calculation, and the main reason behind the observed error is pinpointed via the uncertainty components of each reactivity measurement. In the rest of this paper, the uncertainty formulation is derived first in
Section 2, and the analysis results are shown in
Section 3 with detailed discussions. A summary and conclusions are given in
Section 4.
2. Uncertainty Formulation for Reactivity Calculation
2.1. Reactivity Measurement Procedure in the CEFR Start-Up Tests
Reactivity measurements in the CEFR start-up tests were conducted in the following steps. Before a reactivity measurement, the core was set to critical and the critical rod positions were recorded, which was considered the basis state. After that, the core state was modified according to the reactivity of interest such as temperature, sodium void, or sub-assembly swap. The control rod positions were then moved to achieve criticality again, as a compensation for the reactivity. The core state at these new recorded control rod positions was considered the perturbed state, and the difference in the control rod worth between the basis and perturbed states was considered to equal the reactivity. Note that the core was not perfectly critical in either basis or perturbed state, and thus the off-criticality was measured with a reactivity meter and added to the reactivity for correction. Therefore, the measured reactivity in the CEFR start-up tests can be represented as:
where
stands for the reactivity of interest such as temperature, sodium void, or sub-assembly swap, while
and
represent the reactivity correction and the reactivity compensation by the control rods, respectively. From Equation (1), the uncertainty of the reactivity can be formulated as:
Meanwhile, the reactivity correction in Equation (1) is defined as:
where
and
are criticalities of the basis and perturbed state, respectively. Note that the uncertainty of
can be evaluated as:
The control rod worth, , was not separately measured for reactivity estimation. Rather, S-curves were considered in estimating the rod worth. From the experiments, S-curves were obtained from the differential rod worth measurements for each rod. In a numerical analysis, S-curves can be calculated from the control rod worth at multiple axial positions. The detailed procedure of estimating the rod worth is described in the following sub-section.
2.2. Estimation of Rod Worth from S-Curves
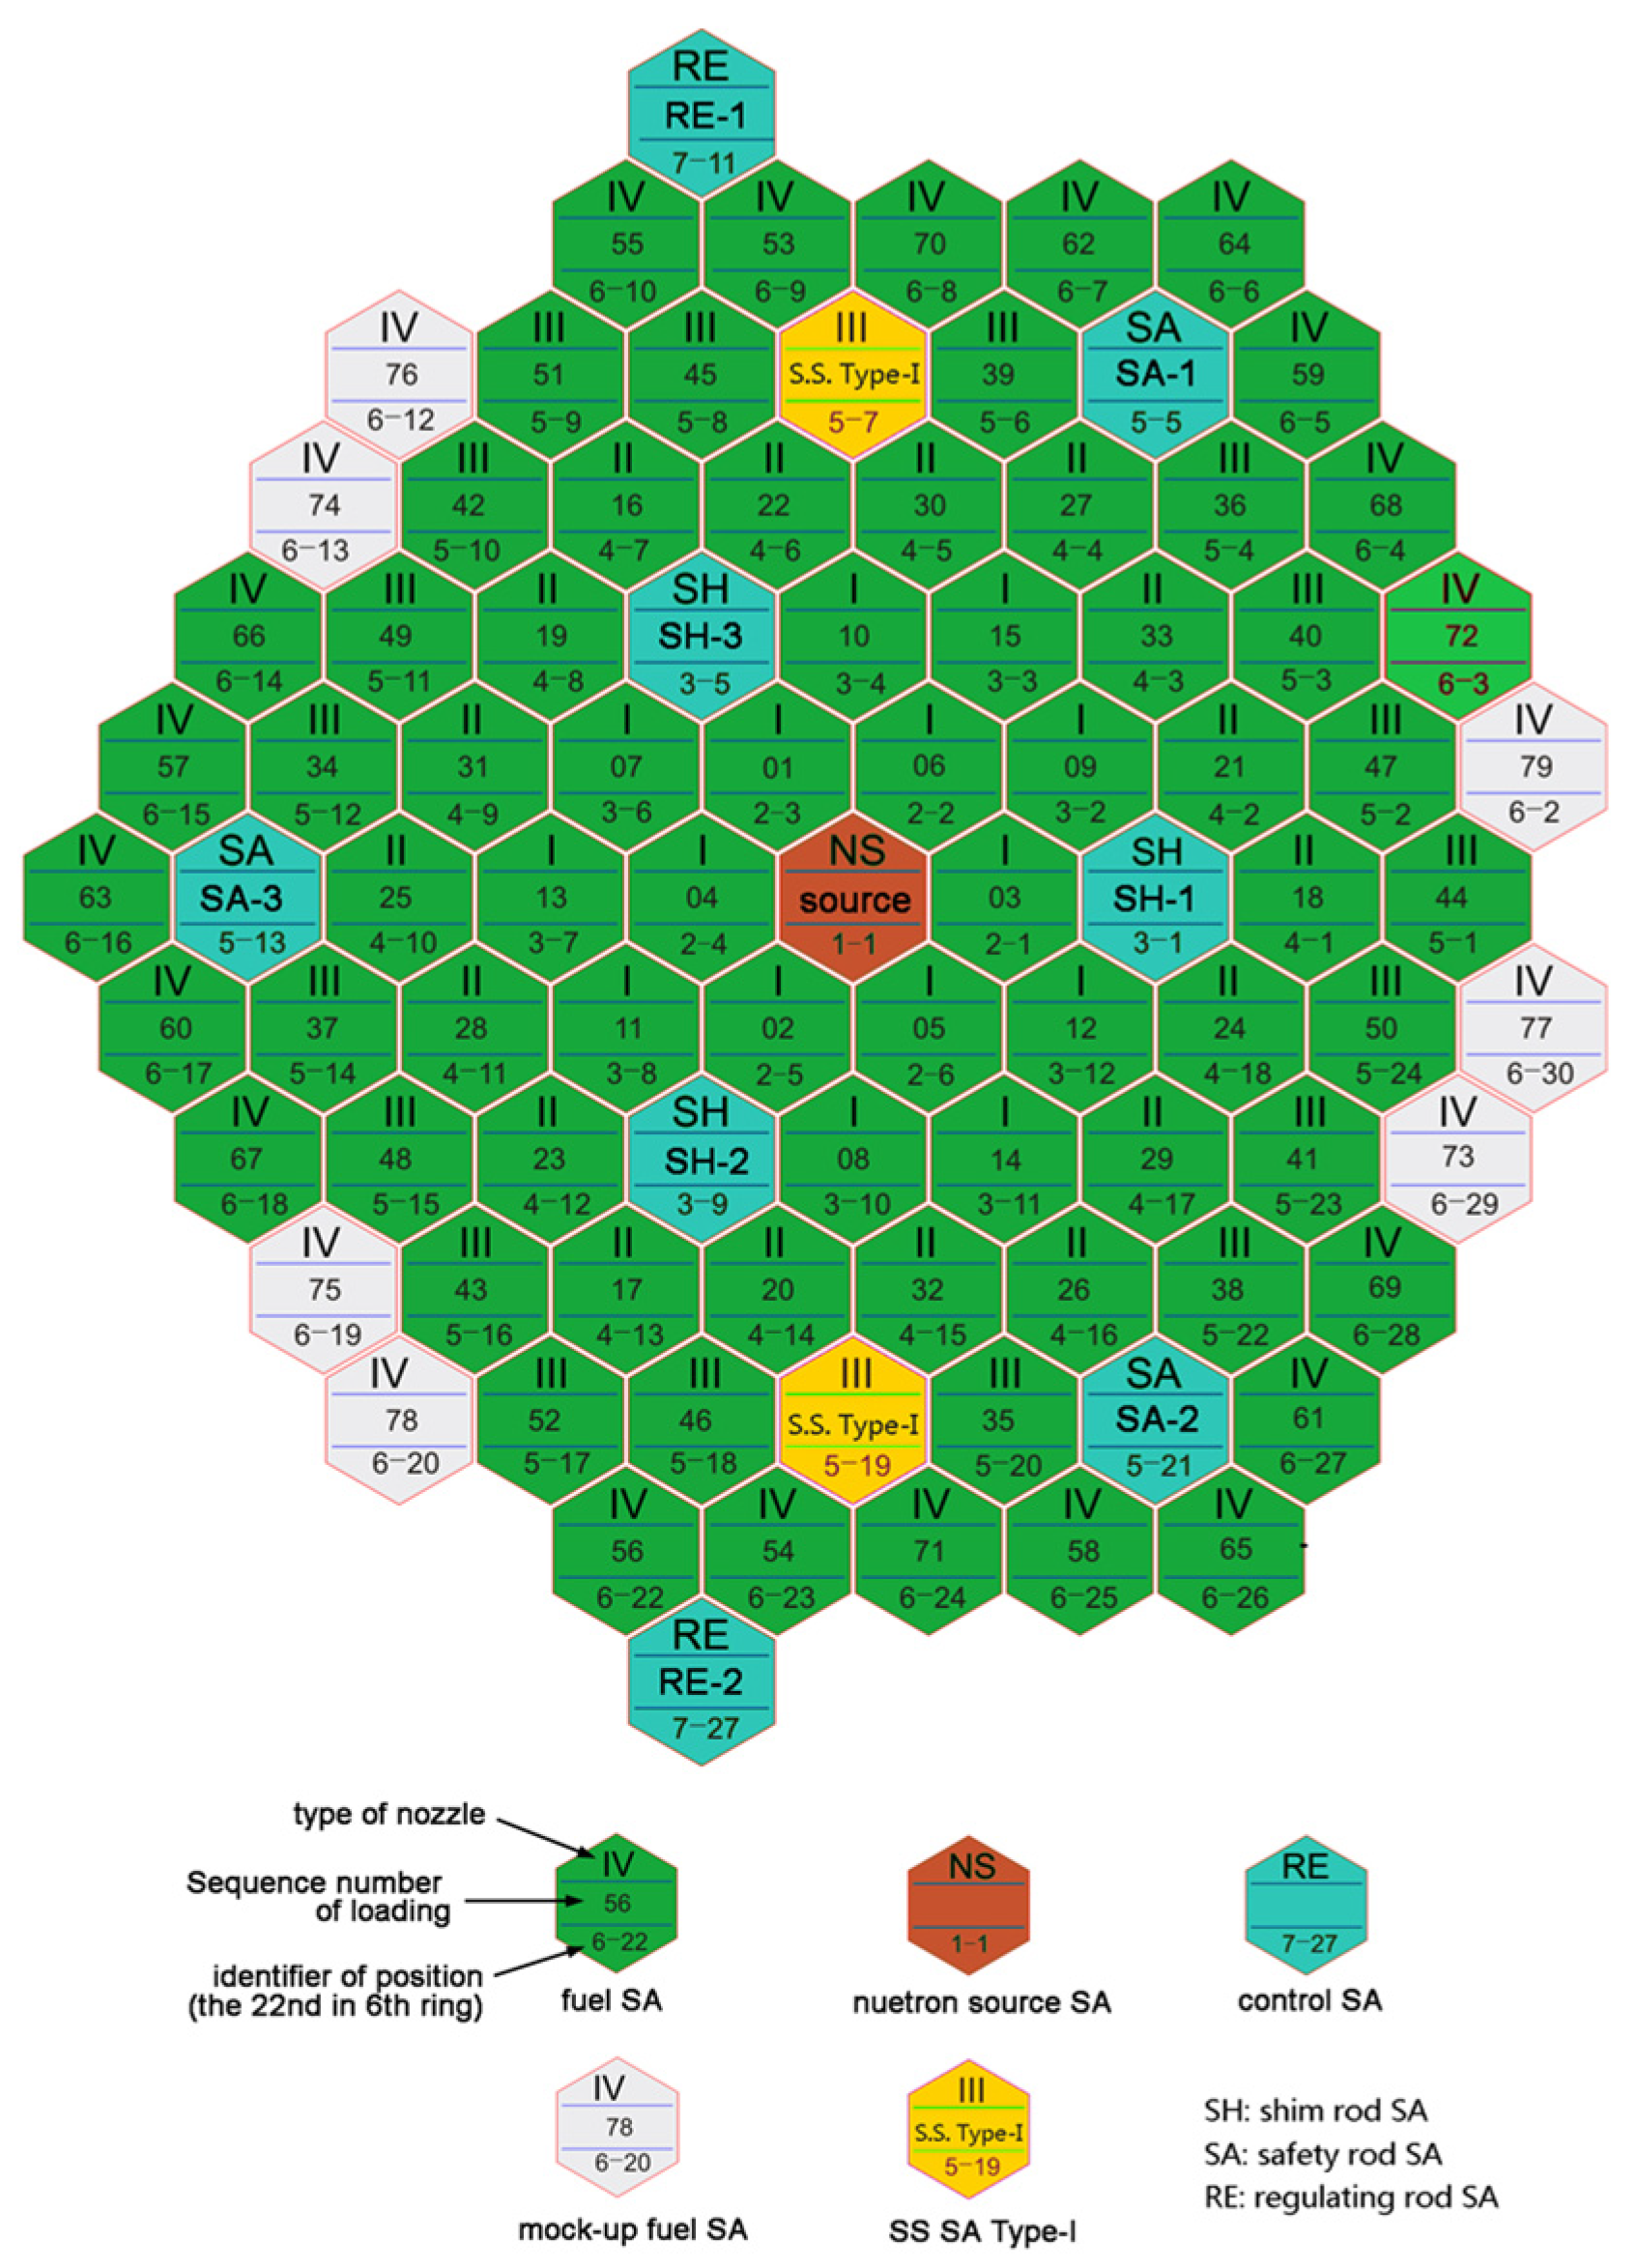
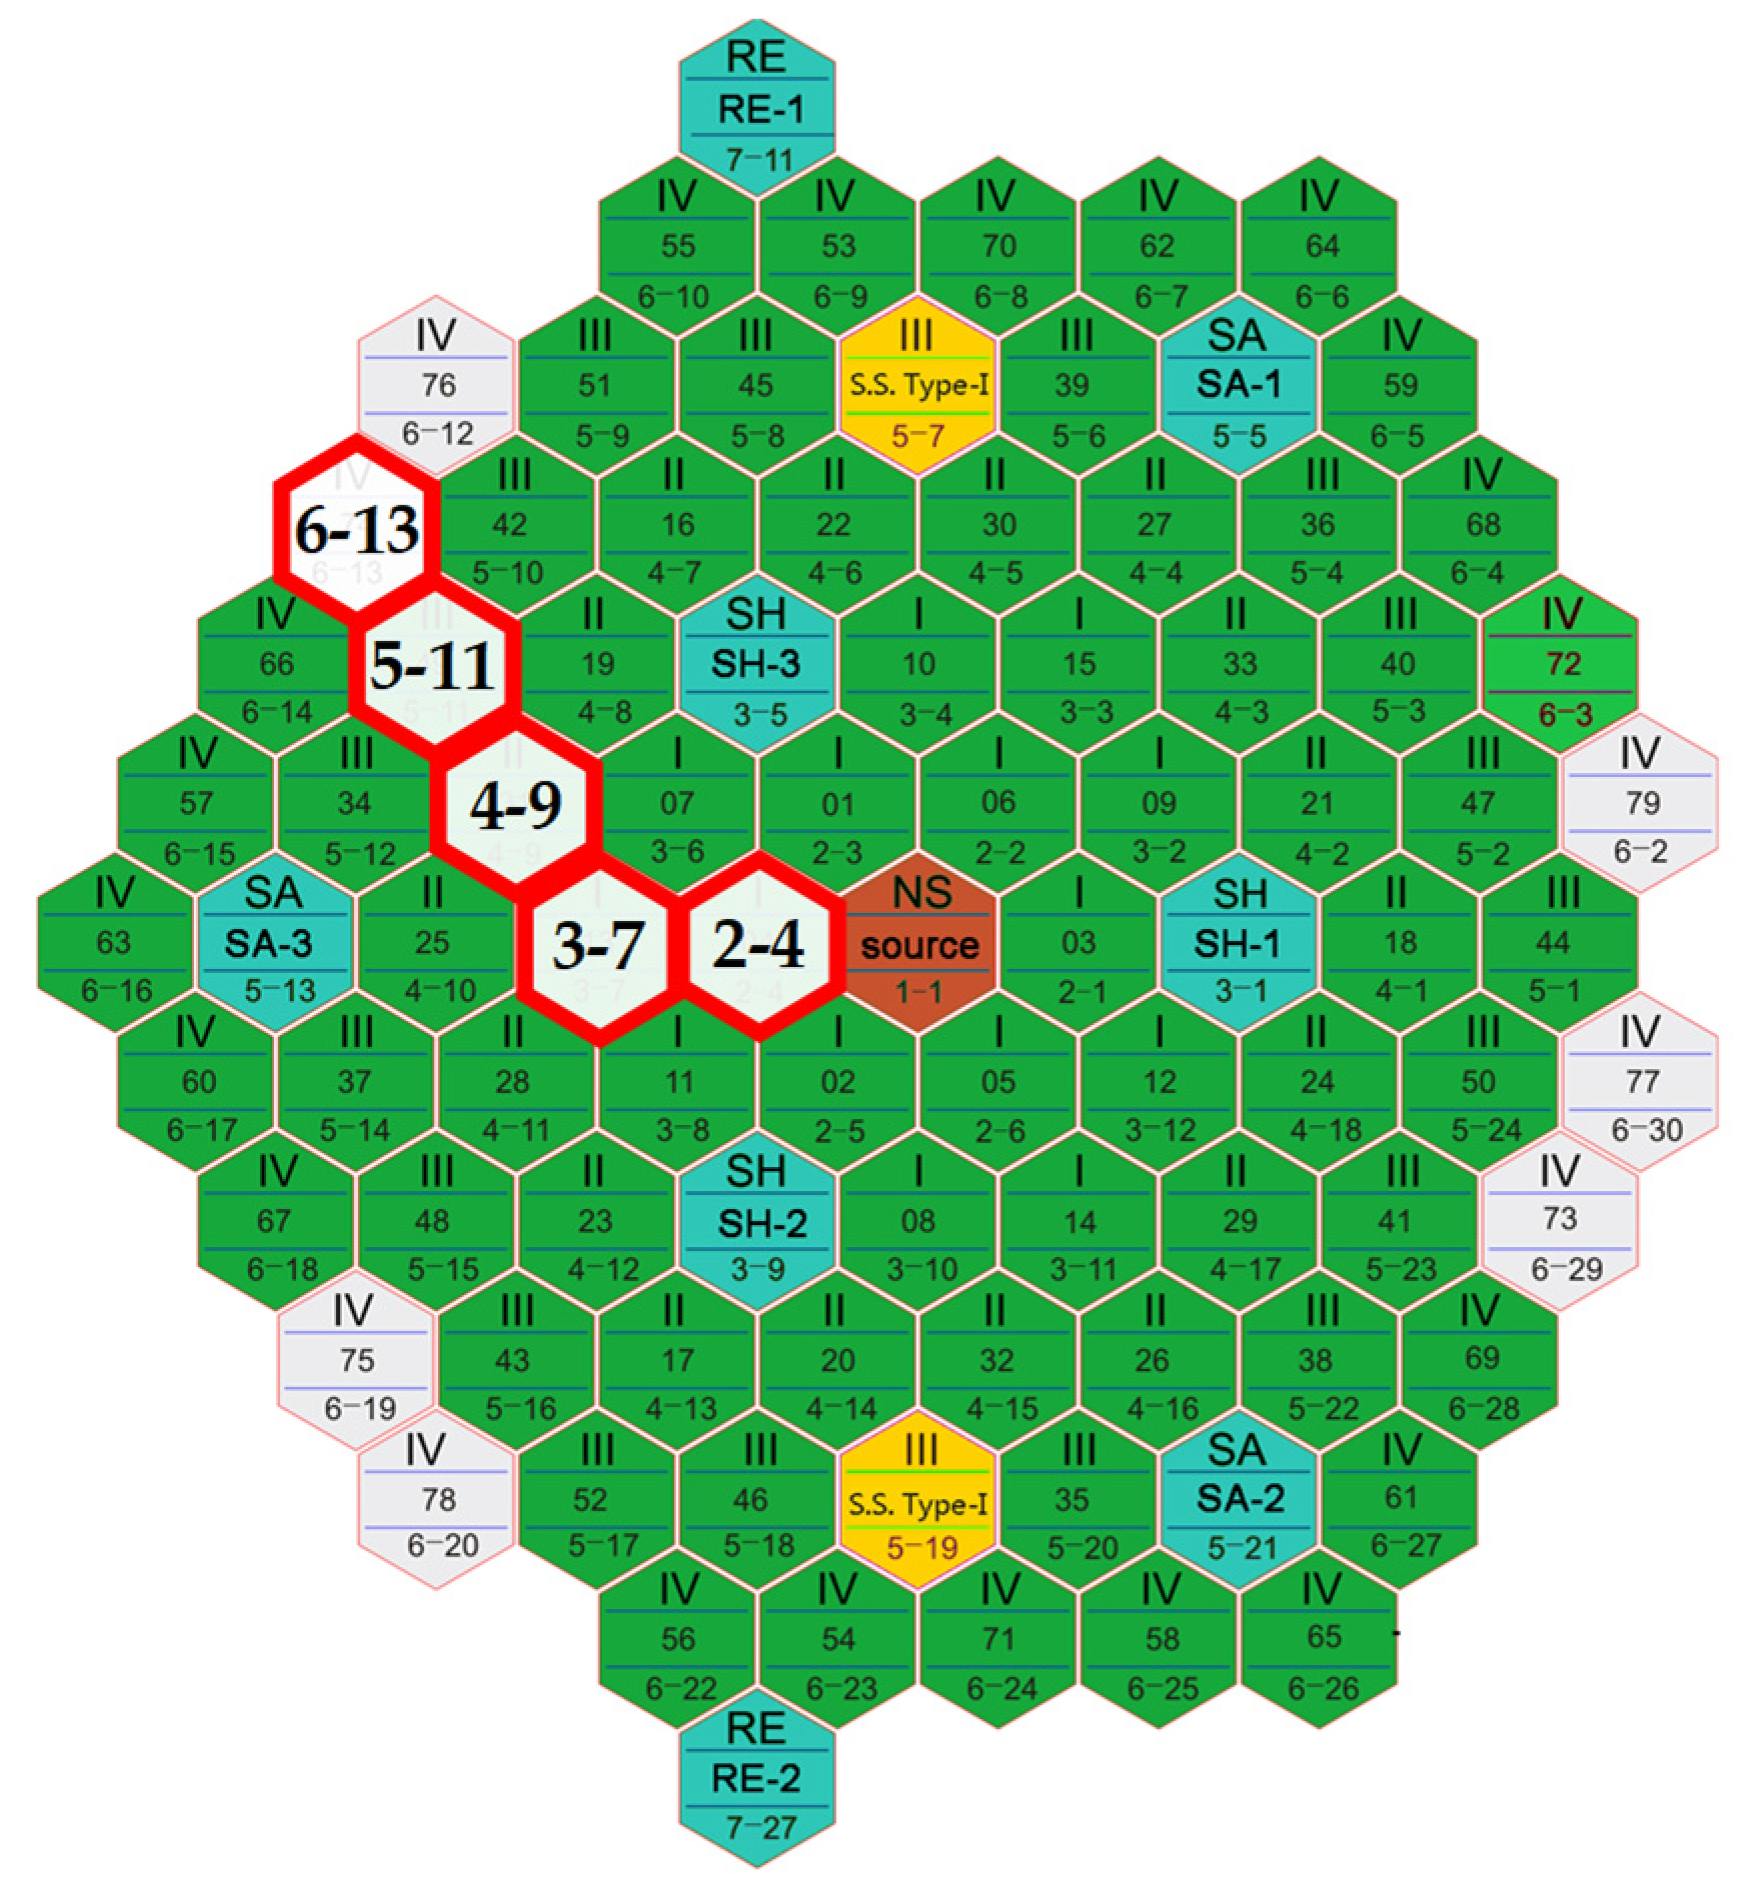
The CEFR core has eight control rods, among which two are regulating (RE) rods, three are shim (SH) rods, and three are safety (SA) rods. The positions of the eight control rods can be found in
Figure 1, along with the general core layout. Enriched
10B is used for the SH and SA rods, while natural
10B is used for the RE rods, meaning that the RE rods have a smaller worth compared to the others. Among the control rods, the SH rods are designated to control large reactivity, and the RE rods are used for minor reactivity adjustments. The SA rods are not used for reactivity compensation.
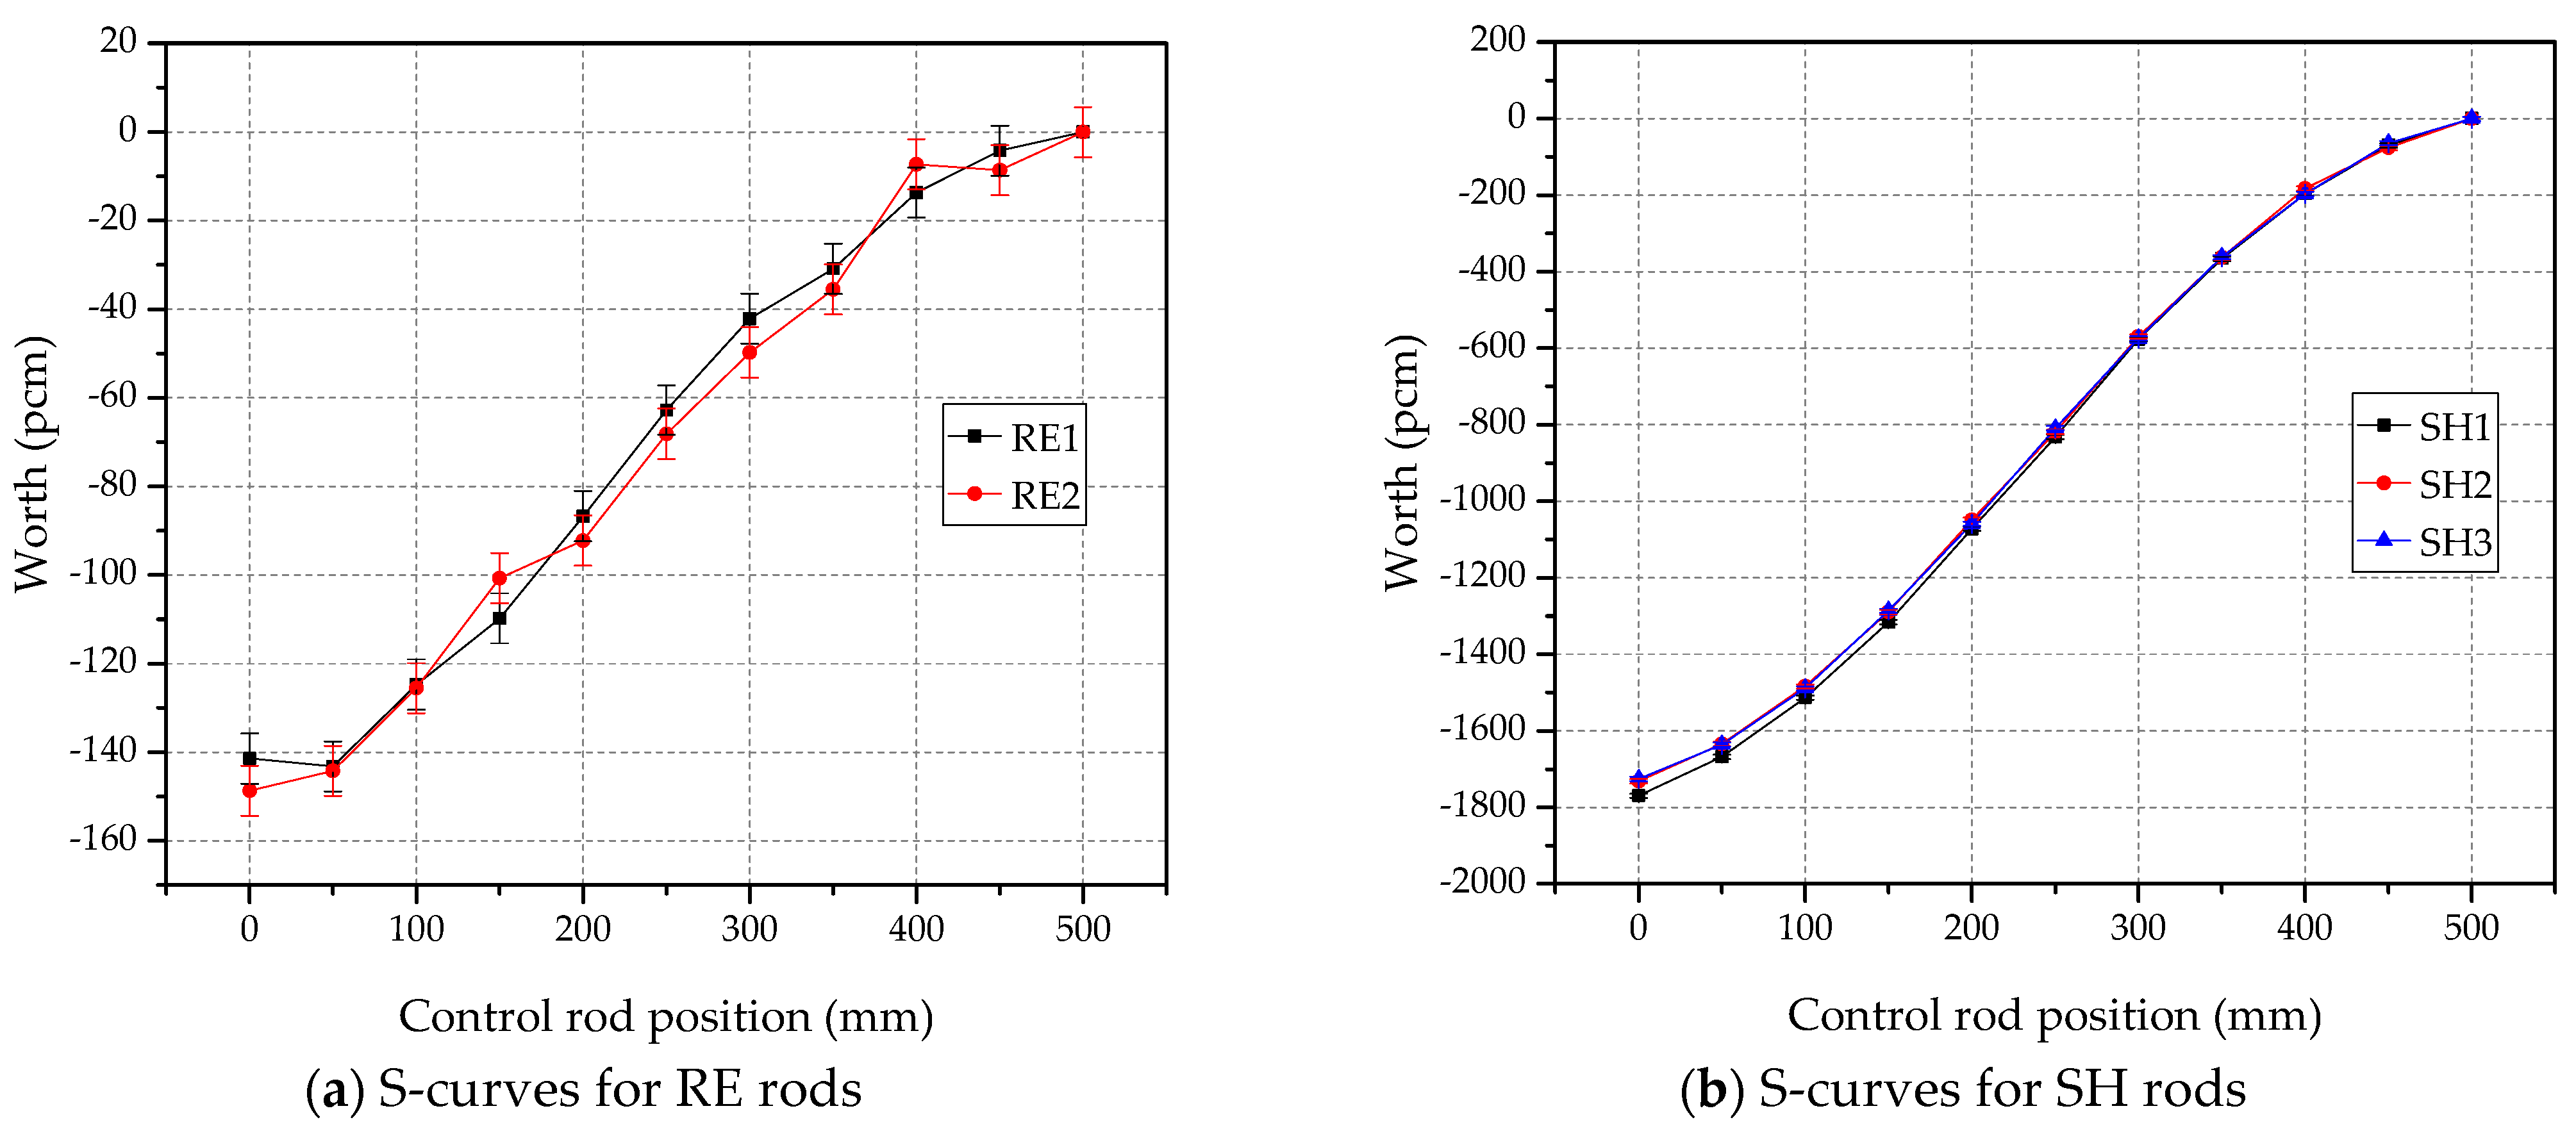
The estimated S-curves from McCARD MC simulation are plotted in
Figure 2. In the MC calculations, the S-curves were obtained by calculating the control rod worth at multiple axial position; a single control rod was inserted from 500 mm (the top of the active core) to 0 mm (the bottom of the active core) at a step size of 50 mm while the others were fully withdrawn. Note that the McCARD MC simulations were conducted under the condition of 100,000 histories/generation with 50 inactive and 250 active generations. The uncertainty of criticality was estimated to be about 4 pcm with the stated conditions. Because of the small rod worth of the RE rods, the statistical uncertainty hindered obtaining smooth S-curves, as plotted in
Figure 2a, while relatively smooth S-curves were obtained for the SH rods, as in
Figure 2b.
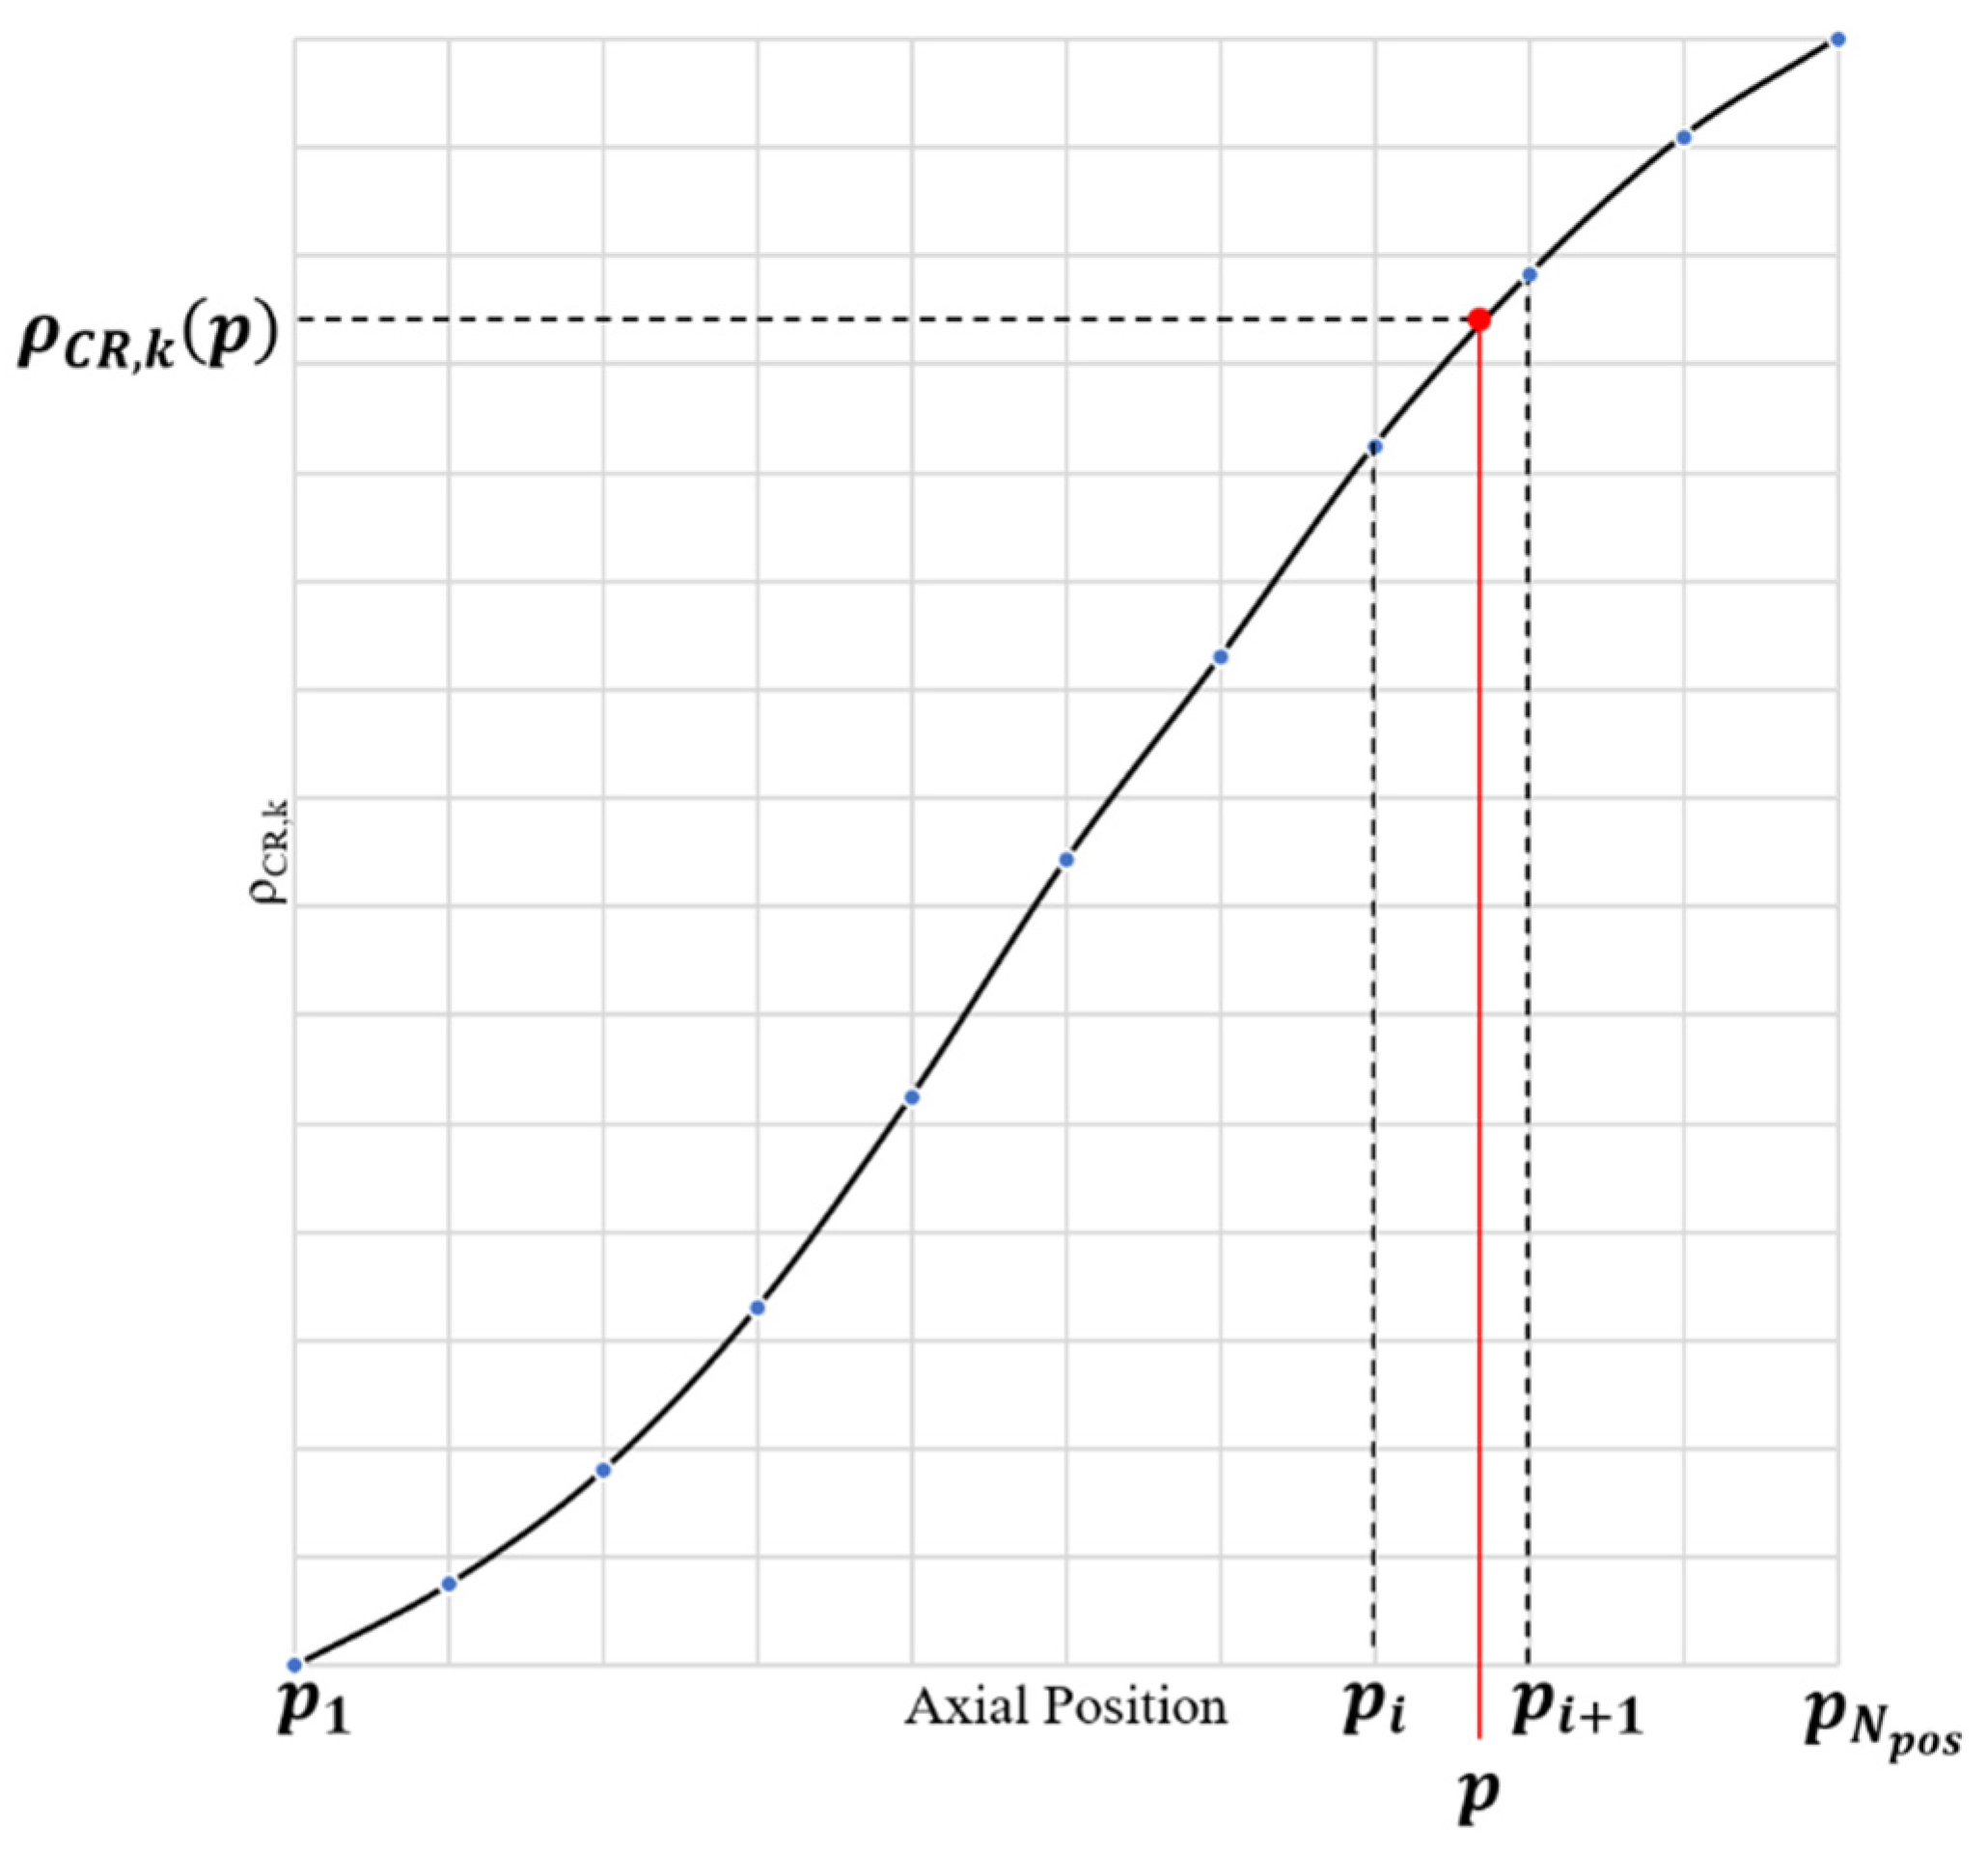
The rod worth at a certain rod position can simply be obtained from its S-curve as depicted in
Figure 3. With linear interpolation of the S-curve, the worth of the
k-th rod at axial position
can be formulated with weighting factors and the pre-obtained rod worth from the S-curve as:
where
and
are the weighting factors of linear interpolation, which are defined by:
Equation (5) can be generally rewritten as:
where
is the number of axial positions in the S-curve, and
is the rod worth from the S-curve at axial position
which equals
. Note that Equation (6) has only two non-zero weighting factors if linear interpolation is considered.
Assuming that
and
are the control rod positions at the basis and perturbed states of the core, the rod worth
can be expressed as:
and thus, the statistical uncertainty of the rod worth becomes as follows:
The rod worth
in Equations (8) and (9) stands for the reactivity compensation by a single rod. The total compensation and total uncertainty from all control rods can be expressed as follows:
It is important to note that while the RE rods have a smaller worth, their uncertainty contribution is the same as that from the SH rods, according to Equation (11). Therefore, minor reactivity adjustments by the RE rods in experiments can increase the statistical uncertainty of the calculation even though the actual reactivity adjustment is small.
2.3. Numerical Error of Control Rod Worth
Besides statistical uncertainties, the calculated rod worth includes possible error terms related to the cross-section library, approximations in geometry, simplified physics in the methodology, etc. The error between calculation and experimental results can be defined as:
In the CEFR start-up tests, the control rod worth measurement was conducted following the rod drop method for 14 different control rod configurations, including single rod worth measurements. The calculation results are summarized in
Table 1.
From the observations of errors in the control rod worth measurements, and considering that the relative errors are bounded by a certain error band, and the mean error is near zero for various control rod configurations, we made two assumptions: (1) the expectation of error is zero, (2) the error is proportional to the rod worth. From these assumptions, the uncertainties can be estimated as:
where
stands for the expected relative error. Note that
is an unknown parameter but can be estimated from multiple measurements of control rod worth with various control rod configurations. From the calculated errors in
Table 1, the expected relative error
can be estimated from the following equation:
where
is the number of control rod worth measurements, and the subscript
stands for the measurement index. In the McCARD MC calculations,
was estimated as 4.94% from the calculation results in
Table 1. Note that the estimated
in other MC results was 5.55% from MCS [
9], 5.09% from Serpent [
10], and 5.19% and 5.17% from OpenMC [
10,
11], demonstrating that a similar
can be obtained from various MC codes and models.
The adjusted uncertainty of
, which is the combined uncertainty of statistical uncertainty and numerical error, can be written as:
According to Equation (15), the numerical error is dominant if the control rod worth is as large as that in the control rod worth measurement experiments. On the other hand, if the worth is small enough to be negligible, the statistical uncertainty becomes the dominant error component.
Similarly, the uncertainty of
in Equation (9) can be rewritten with the numerical errror as:
Considering all the rods used for reactivity compensation, the total uncertainty can be calculated by
Finally, the adjusted uncertainty of reactivity can be formulated as:
In this manner, the uncertainty contribution from the control rod worth error can be quantified, and its impact on the reactivity measurements can be investigated.
2.4. Three-Step Method for Reactivity Estimation
In numerical analysis, the rod worth
can be simply estimated as:
where
is the criticality of the core in the basis state but with the rod positions of the perturbed state. This approach is called the three-step method since an additional step is provided between the basis and perturbed states to evaluate
. On the other hand, the estimation method via S-curves is called the experimental method since it follows the exact experimental procedure. Reactivity estimation following the three-step method (
can be simplified as:
and the uncertainty of the three-step method can be calculated as:
The three-step method is beneficial for reactivity calculations since the uncertainty from S-curves can be avoided, and accordingly, the statistical uncertainty can be reduced compared to the experimental method. Even though the three-step method may entail inevitable error by not following the exact experimental procedure, the three-step results can be used for measuring the numerical error of the rod worth in the S-curve approach.
3. Numerical Results
McCARD MC calculations were conducted with the ENDF/B-VII.0 continuous energy cross-section library for the numerical analysis of the CEFR start-up tests. The detailed MC calculation conditions were the same as those for the S-curve calculations. The calculation results with S-curves and their uncertainty are evaluated with Equations (10) and (19), respectively, and those for the three-step method are obtained from Equations (21) and (22). Note that the uncertainty of the measured reactivity was given from the benchmark as either absolute or relative values; in the present work, they are written as absolute values. The calculated results were compared with the measurements, and the relative error (C/E-1) was calculated by
while its uncertainty was calculated as:
3.1. Temperature Reactivity
The reactivity change according to temperature was measured for both temperature increasing and decreasing processes between 250 °C and 300 °C. According to the temperature changes, the core geometry and the material density were adjusted. The expansion coefficient and density formulation for sodium coolant were taken from the benchmark, and McCARD models were reconstructed according to those parameters.
As the core temperature changes, the critical rod positions are adjusted to keep the core critical. The critical rod positions are listed in
Table 2, along with the uncertainty components of the reactivity. For the increasing process, the SH rods were only slightly moved, while the RE rods were mainly used for reactivity compensation. The statistical errors were observed to be small, and a slightly increased rod worth error was observed as the temperature increased. Compared to
, which was only about 6 pcm in these simulations, the overall uncertainty was not significantly increased with other terms such as
and
. Considering that
and
represent the summation of the uncertainty contributions from all the control rods, the additional uncertainty from the S-curves is not a major concern in numerical analysis, even with multiple rods.
On the other hand, the uncertainty was observed to dramatically increase at 290 °C in the decreasing process mainly because of increased numerical error in the control rod worth as well as the corresponding statistical uncertainty. Since this is the first step in the temperature-decreasing process, the temperature reactivity is small compared to other steps, and so this large error from the control rods was not expected. However, the mystery can be solved when the reactivity compensation from each rod is considered, which is given in
Table 3. The reactivity compensation from each SH rod was estimated to be significantly large at this step because of the sudden position changes of the SH rods. The total reactivity compensation from the five different rods was only 25.3 pcm, while the compensation of each SH rod was 811.6 pcm, −429.5 pcm, and −441.8 pcm, indicating that the approximately 5% error from each SH rod is significantly greater than the total reactivity compensation. At the next measurement step, the SH rod positions were returned to the reference positions, and the large uncertainty disappeared.
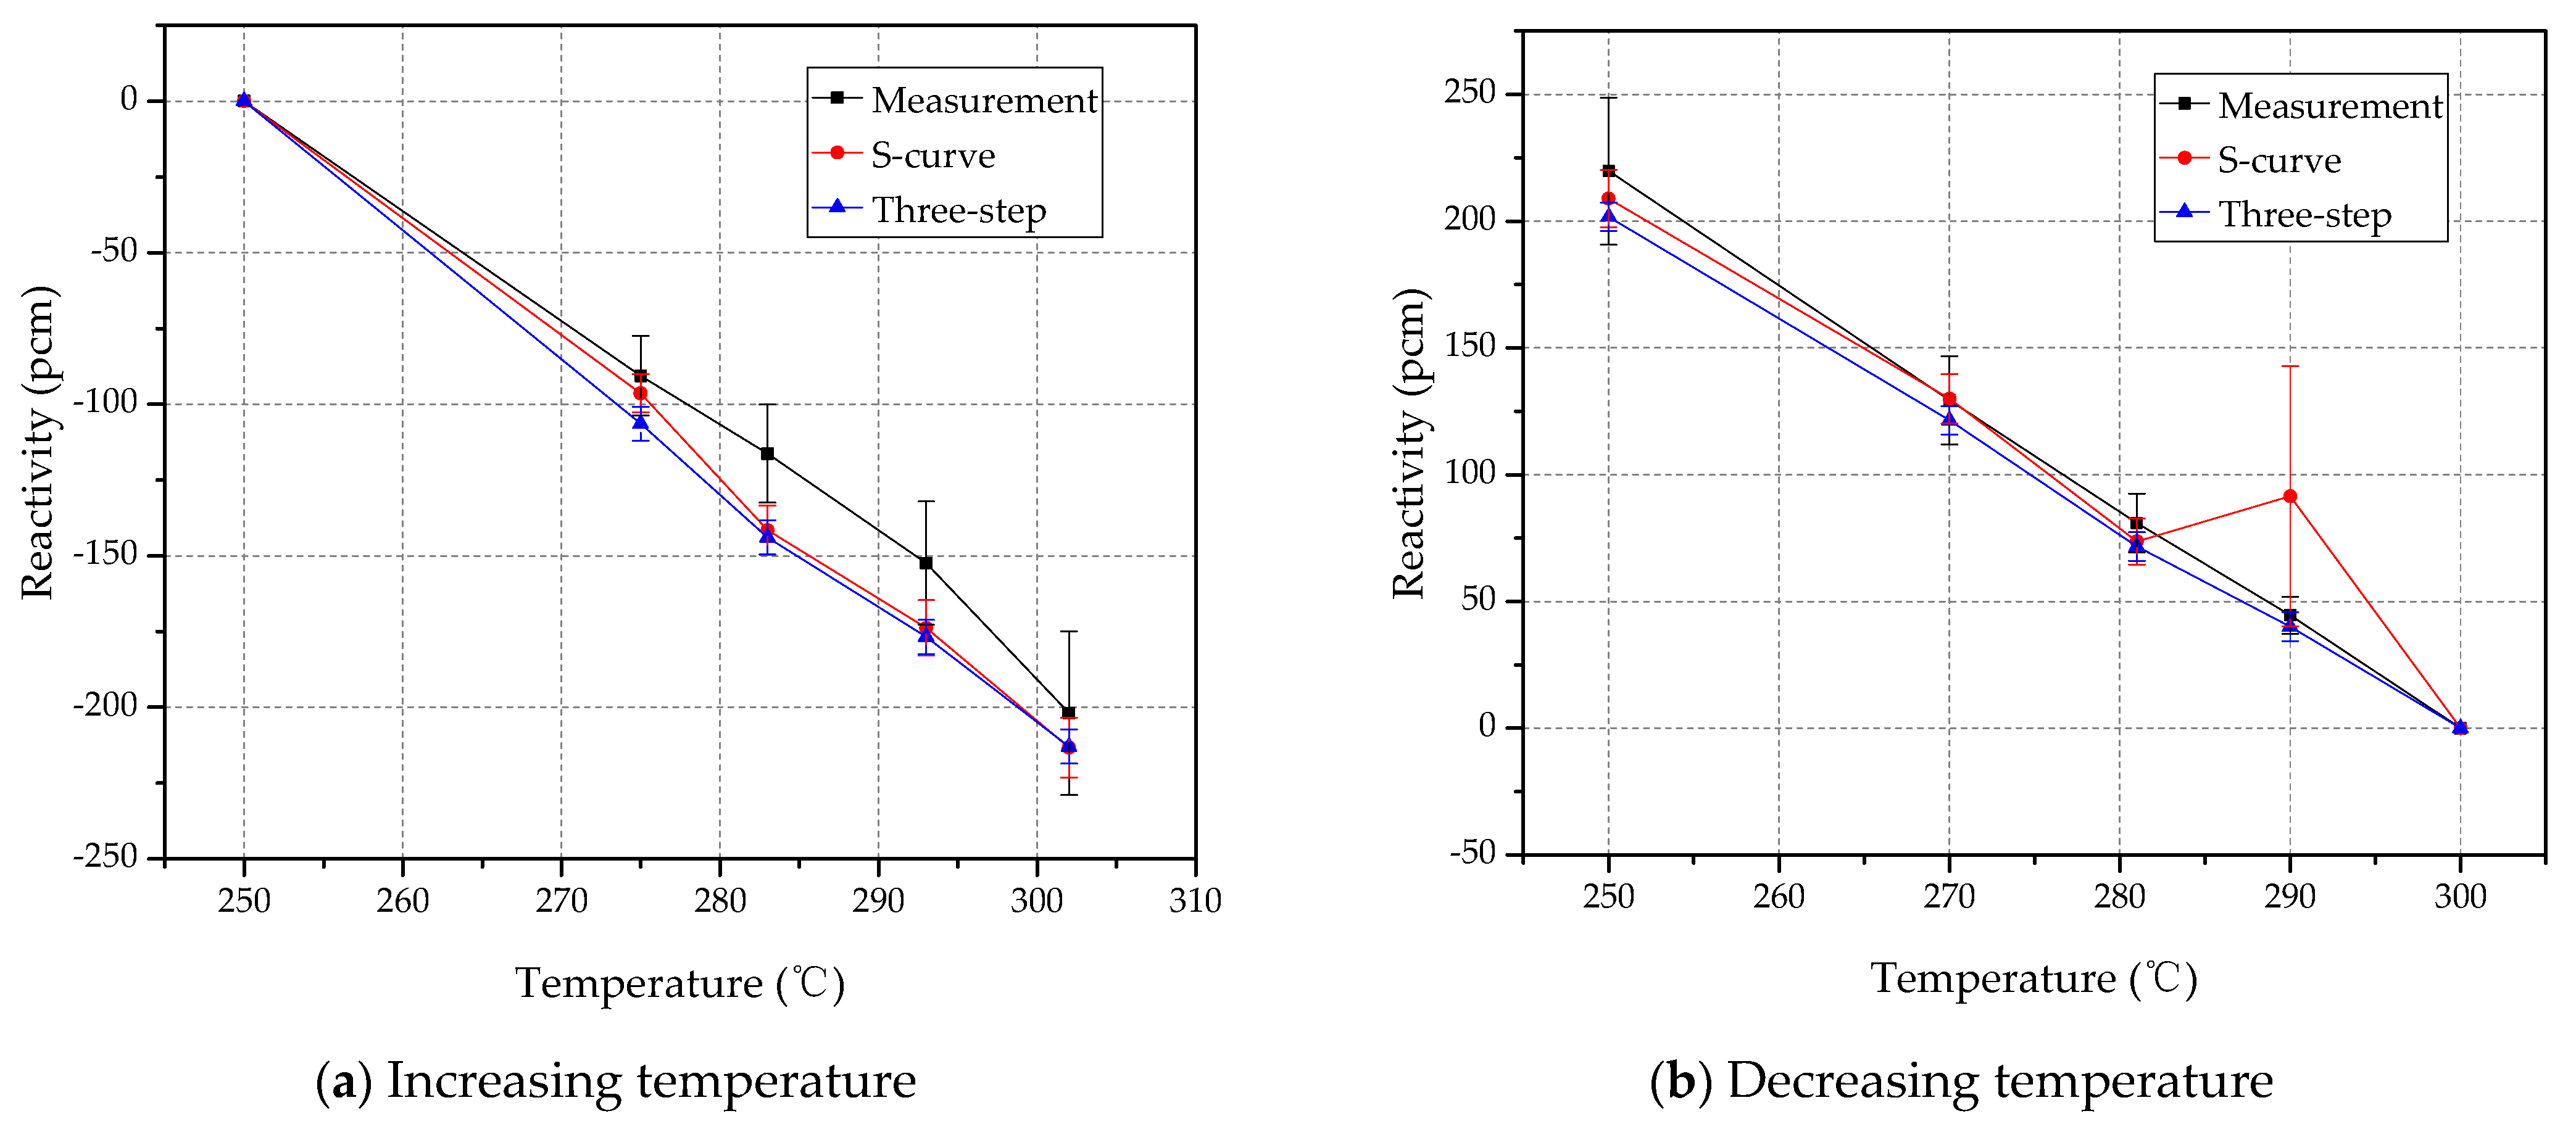
The temperature reactivity results are listed in
Table 4, and a visual comparison is plotted in
Figure 4. The largest error in the increasing process was observed at 283 °C, which is slightly greater than the uncertainty of the relative error, while other results showed a suitable agreement with the measurements. The three-step results showed a similar error behavior as the results from the S-curve approach, but the former had a slightly greater error. In the decreasing process, on the other hand, a very large error was observed at 290 °C, as expected from the extremely large estimated uncertainty. Except for the reactivity at 290 °C, a relatively small error was observed in the McCARD results with S-curves as the SH rod positions returned to the reference positions. Therefore, the measurement at 290 °C should be excluded from the analysis since the sudden change in control rod positions made the calculation results unreliable.
Meanwhile, the three-step method results agreed well with the measurements in the decreasing process. The calculated reactivity from the three-step method was similar to the ones from the S-curves, but in this case, the large error at 290 °C was not observed. Therefore, this provides evidence that the reactivity compensation from the S-curve approach is the main reason for the large error and that the error is strongly dependent on the control rod position changes. Additionally, this finding cannot be expected or explained by the statistical uncertainty of the MC calculations; the statistical uncertainties are significantly smaller than the error compared to the measurements.
3.2. Sodium Void Reactivity
In the second measurement considered here, the sodium void effect was measured by swapping a normal fuel cell with a voided fuel cell. Sodium void reactivity can be either positive or negative according to the competition between neutron spectrum hardening and increased neutron leakage through the voided area. Since the active core of the CEFR is small, neutron leakage is dominant, and so a negative reactivity was measured at all void positions. The measured locations can be found in
Figure 5. Note that as all the measurements were conducted with only a single assembly swap, the measured reactivity was small. Therefore, the SH rod positions were fixed in the experiments, while the positions of the two RE rods were smoothly adjusted for reactivity compensation.
The uncertainty of the calculated sodium void reactivity is summarized in
Table 5, where it can be seen that a generally small uncertainty was estimated for each measurement. Note that the statistical uncertainty of the S-curve approach is comparable with the uncertainty of the off-criticality, even though only two RE rods were used for reactivity compensation. Because of the small reactivity, the RE rods were moved slightly at each measurement step, and thus a small uncertainty could be obtained by Equation (8). Additionally, reactivity compensation was also small in this measurement, with
appearing smaller than the statistical uncertainty from the S-curves. Therefore, the major uncertainty factor in the calculation is the statistical terms coming from the S-curves as well as the off-criticality.
The calculated sodium void reactivity was then compared with the measurements; the results are listed in
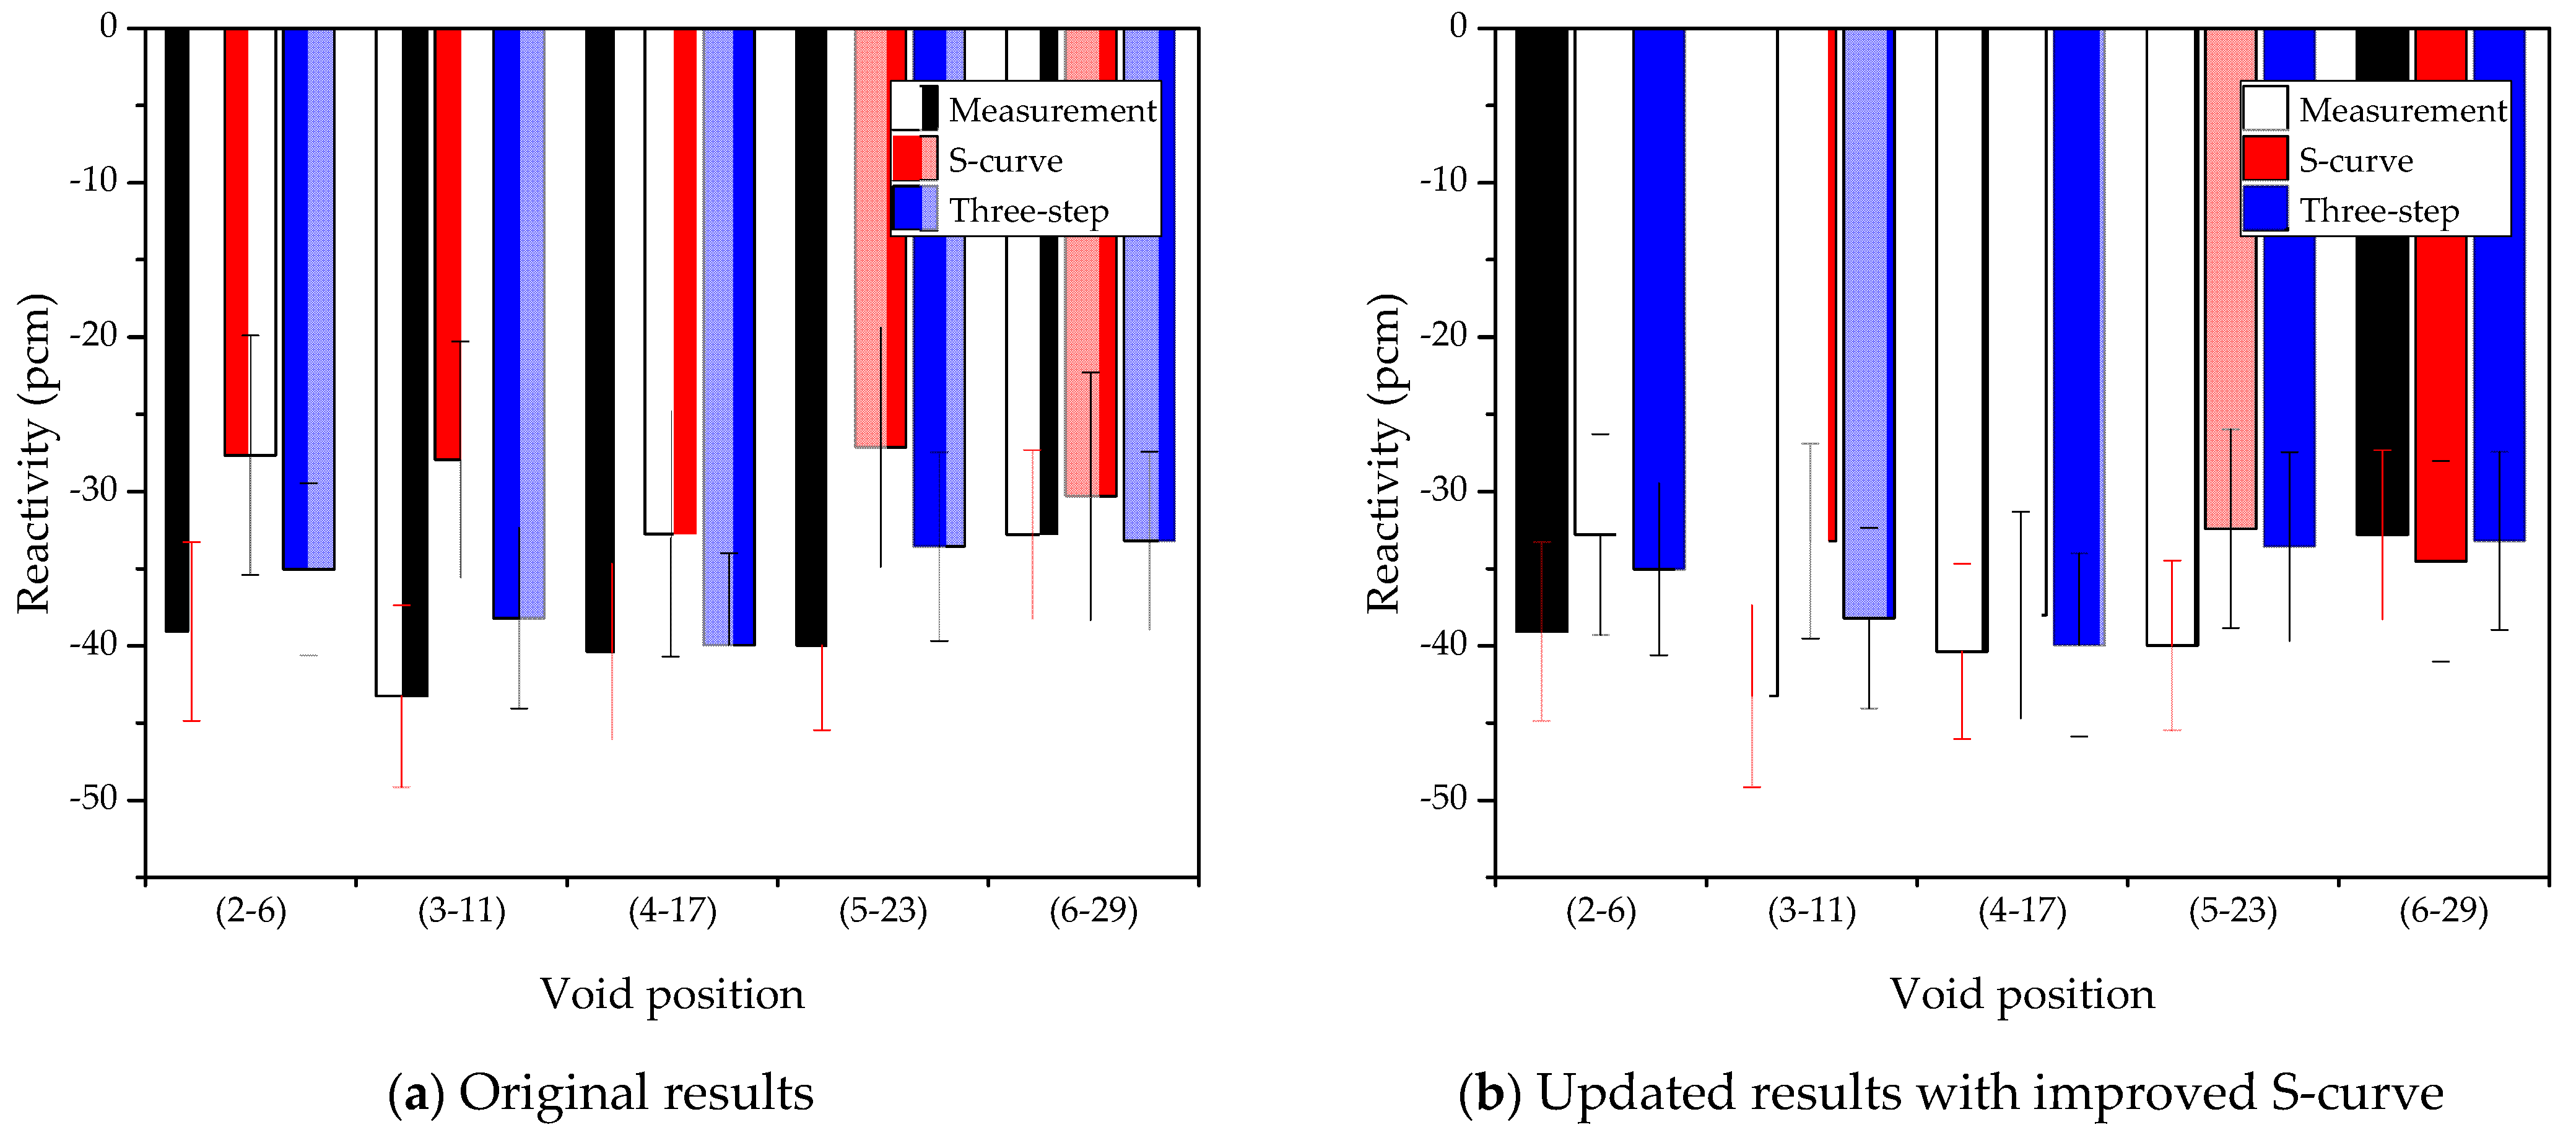
Table 6. The calculation results from the S-curve approach showed slightly underestimated reactivity for all void positions, while the results from the three-step method showed a suitable agreement with the measured results. This implies that the reactivity compensation from the S-curves is underestimated. However, this does not mean that the S-curve approach underestimates the sodium void reactivity all the time. The RE rod positions in the experiments were within the range of 250 mm and 350 mm, and thus the reactivity can be biased from the rod worth calculations of 250 mm, 300 mm, and 350 mm; the same statistical error in the S-curves leads to unidirectional error in sodium void reactivity calculations.
The statistical error can be simply mitigated by increasing the number of histories for the MC simulations. In order to avoid biased results, the RE rod worth calculations were conducted for three axial positions to obtain an improved S-curve in this domain with half statistical error. The reactivity results obtained from the new S-curve were consistently shifted compared to the original results, as listed in
Table 7. The two results are plotted together with the measurement and three-step results in
Figure 6, where a better agreement is observed with the updated results.
For both temperature reactivity and sodium void reactivity measurements, the reactivity compensation from the S-curves can introduce either significantly large uncertainty or unidirectional bias according to the choice of control rod positions between the basis state and perturbed state. Therefore, uncertainty should be carefully estimated and interpreted in the corresponding numerical analysis. In contrast, the three-step method provides relatively stable results because the reactivity compensation can be easily obtained, and the uncertainty from the S-curves is excluded. Therefore, the three-step results can provide a suitable reference solution to verify the reliability of the control rod worth estimated from S-curves.
3.3. Sub-Assembly Swap Reactivity
A potential fuel loading accident was simulated, and its impact was estimated in sub-assembly swap reactivity measurements. Here, only a single sub-assembly was swapped with another for a total of eight measurements. The measurement positions of (2–6), (3–11), (4–17), (5–23), (6–29), and (5–22) were designated for the measurement of the fuel-to-stainless steel (SS) assembly swap reactivity, while the positions of (7–31) and (5–19) were selected to measure the SS-to-fuel assembly swap reactivity. In the SS-to-fuel assembly measurement, a single SS assembly was initially loaded in the core to compensate for the positive reactivity that was introduced after the swap. The detailed positions for the measurements are shown in
Figure 7, and the sub-assemblies loaded after the swap are listed in
Table 8.
The control rod positions before and after the sub-assembly swap are summarized along with uncertainty components in
Table 9. Note that the ‘multiple rods’ refers to the reactivity calculations considering the control rod worth of all (multiple) SH rods, while only the SH3 rod was used for the ‘single rod’. The RE rods were moved in both measurements to control the minor excess reactivity in the core. The reactivity of the sub-assembly swap is greater than the temperature and sodium void reactivity, and
becomes the major uncertainty factor in the MC calculations as shown in
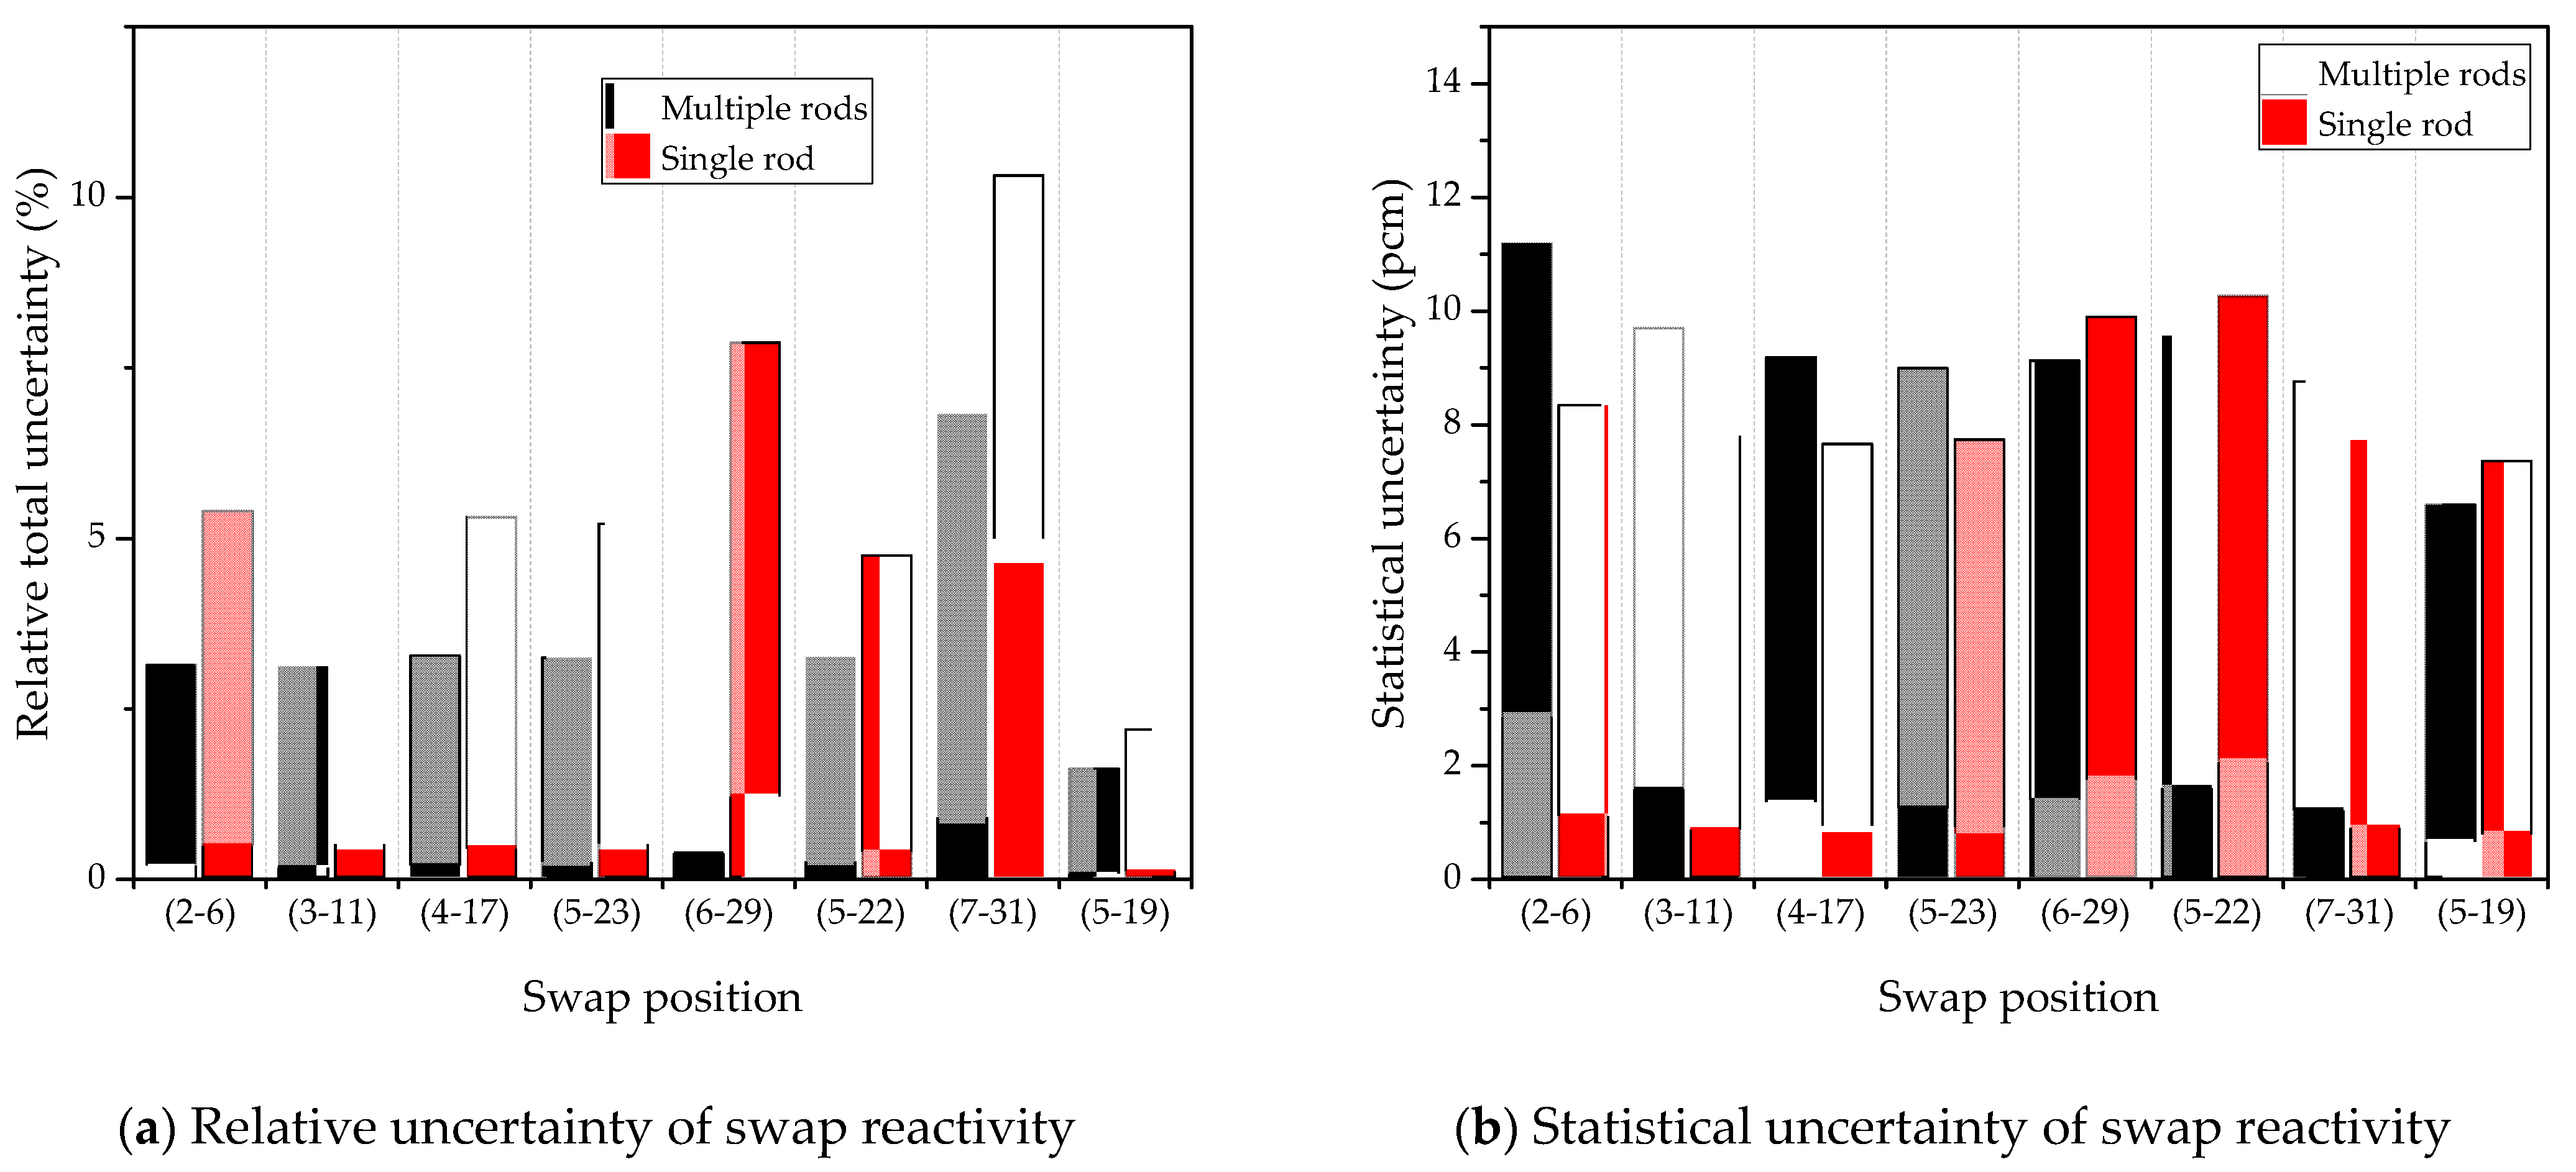
Table 9. One important observation is that the MC calculations of the single rod cases show greater uncertainty than those of multiple rod cases, as shown in
Figure 8a. Since
is the squared sum of each rod’s reactivity compensation, it becomes smaller when multiple rods share the reactivity compensation evenly. When the reactivity is controlled by a single SH rod, however, the squared sum will be the highest, and the uncertainty of the reactivity compensation increases accordingly. Therefore, smaller error can be expected in the multiple rod measurements.
Without the numerical error term
, the statistical error showed a different behavior, as seen in
Figure 8b. By excluding the uncertainty contribution from two SH rods, statistical uncertainty can be smaller in single measurements. However, greater statistical uncertainty was observed at (6–29), (5–22), and (5–19) because of the reactivity control by the RE rods. Even though the worth of the RE rods is small, their statistical uncertainties are as great as those of the SH rods, and the minor reactivity adjustments by the RE rods can result in greater statistical uncertainty.
The calculated results with corresponding errors are listed in
Table 10, and the results are compared in
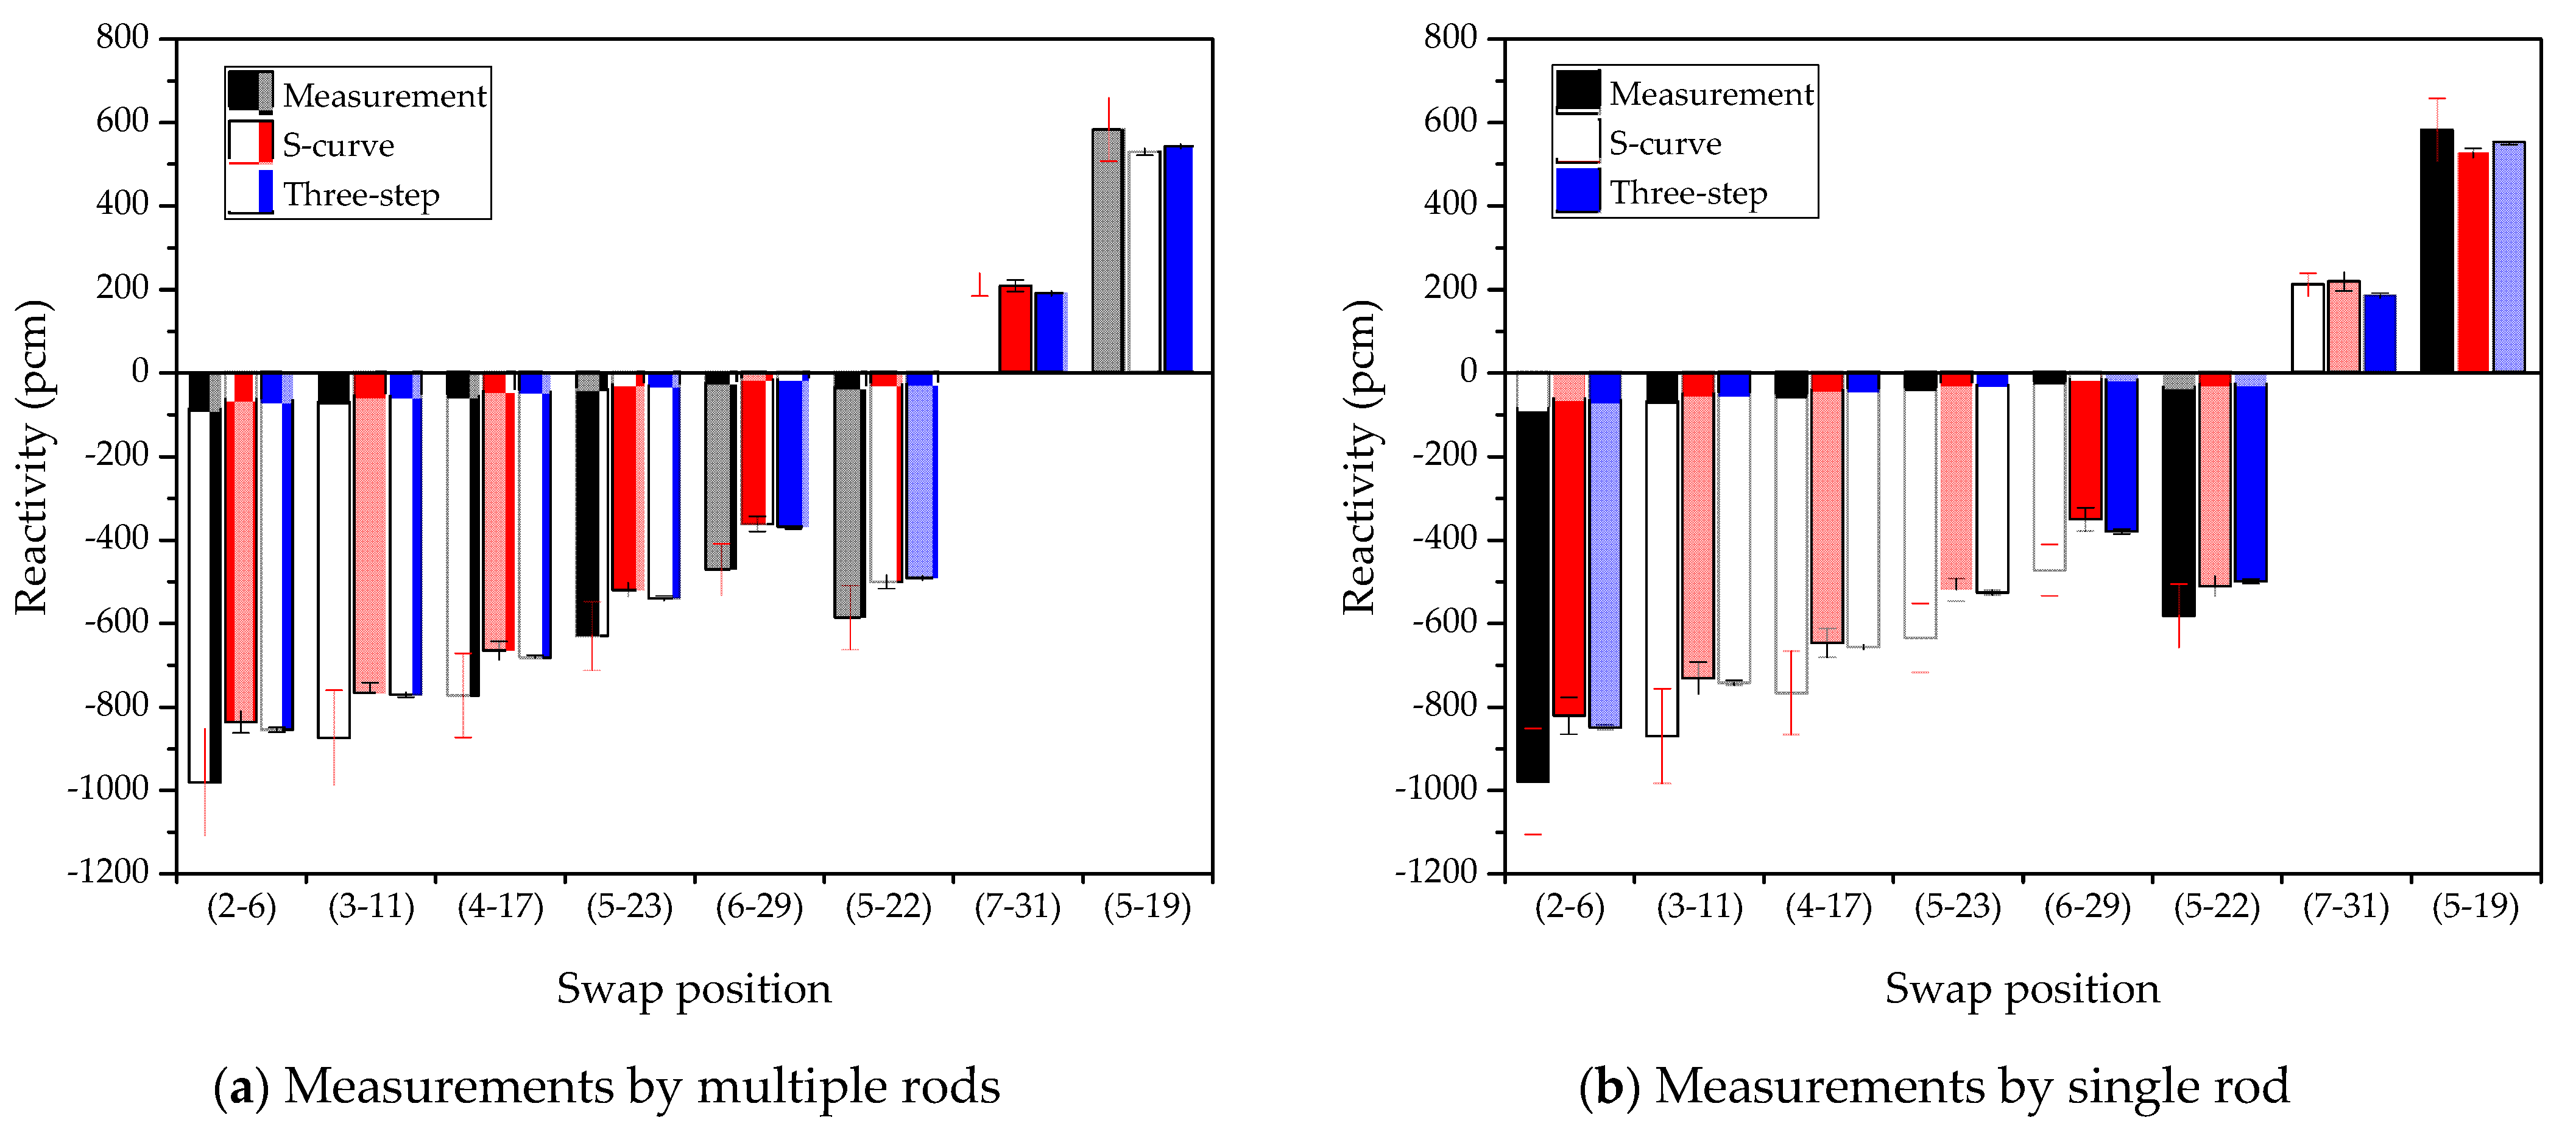
Figure 9. The largest error was observed at the measurement of position (6–29) for both S-curve and three-step methods. Note that (6–29) is located on the active core boundary, implying that the effects of a local perturbation at the core periphery were not well interpreted by the MC simulations. Slightly smaller errors were observed for the inner positions, but still, the MC calculations underestimated the swap reactivity. The error of reactivity was reduced for the measurements at (7–31) and (5–19), which are SS-to-fuel swap measurements. When comparing the calculation results between the measurements by multiple rods and single rod, the calculation with S-curves showed greater error in the single rod case, as the uncertainty, in this case, is greater than that in the measurements by multiple rods. On the other hand, the three-step method showed quite consistent results for both measurements. Except for the measurement at (6–29), the calculation results agreed well overall, as the maximum error was within
uncertainty for the measurements by both multiple rods and single rod.
Unlike the other reactivity measurements, a consistent underestimation of swap reactivity was observed for the fuel-to-SS swap experiments, as shown in
Figure 9. Even the calculation with the three-step method also underestimated the swap reactivity, implying that the uncertainty in the S-curve approach cannot be the main reason for the underestimated reactivity. Similar trends were observed in other MC calculations [
3,
9,
10,
11], but detailed explanations are out of the scope of this work.
4. Summary and Conclusions
In this work, a formulation was derived to estimate the uncertainty of the reactivity measured in the CEFR start-up tests. As the reactivity was measured via control rod worth, the uncertainty of the rod worth was properly formulated based on linearly interpolated S-curves. We found out that the uncertainty of the rod worth can differ at each measurement since the uncertainty can be represented as a function of the control rod positions and the statistical uncertainty of the S-curves. Therefore, the uncertainty of the reactivity is also sensitive to the control rod positions and movements.
In addition to the statistical uncertainty, the numerical error of the control rod worth was estimated from the control rod worth measurement experiments in the CEFR. The numerical error tends to increase for greater control rod worth cases, so the statistical error becomes negligible in estimations of the worth of the SH rods or multiple rods. By assuming that the numerical error is proportional to the worth, the experimental results of the control rod worth measurements were utilized to estimate the average relative error, and the uncertainty was adjusted to reflect the numerical error in calculations.
McCARD MC simulations with the ENDF/B-VII.0 continuous energy cross-section library were then conducted for CEFR start-up tests, and the reactivity and corresponding uncertainties were evaluated. In the temperature reactivity measurements, the calculated reactivity showed a suitable agreement with the measurements, as the measured errors were within uncertainty, but a large error was observed at 290 °C in the temperature-decreasing process. At this measurement, the SH rods were moved significantly, and large positive and negative reactivities ranging from −450 pcm to 800 pcm were provided by the SH rods, despite the resulting reactivity compensation being as small as 20 pcm. Since the numerical error of each SH rod worth was expected to be significantly large compared to the temperature reactivity, the uncertainty was estimated to increase dramatically, and the observed error reflects this.
Meanwhile, the calculated sodium void reactivity showed the importance of the statistical uncertainty of S-curves. Since the reactivity is small, only the RE rods were used for reactivity control, and thus the reactivity compensation from the control rods was also small, and the numerical error terms became negligible. Since the critical rod positions were similar among the five different measurements, the common error from the statistical uncertainty caused all the reactivities to look biased. The bias in reactivity can be mitigated via improved accuracy in the S-curves, especially for the rod worth around the control rod positions.
The error of the sub-assembly swap reactivity was greater than the estimated uncertainty, but the results can be considered acceptable regarding increased measurement uncertainty; the relative errors were observed mostly within uncertainty. We observed a consistent underestimation of reactivity in the fuel-to-SS swap cases, but we concluded that the cause is not related to the errors in the S-curves because the direct reactivity calculation via the three-step method also showed similar error trends. Nevertheless, the reliability of the estimated uncertainty was confirmed by the observed error behavior; smaller errors were observed in the multiple rod measurements, as expected by the smaller uncertainty compared to the single rod measurements.
In conclusion, the uncertainty formulation suggested in this work proves that it is appropriate to expect errors in reactivity calculations. Additionally, the quantified uncertainty components are useful for finding out the main error factor in reactivity estimations. The reason for the underestimated swap reactivity is still unknown and remains for future work.
Author Contributions
Conceptualization, M.J.L.; methodology, M.J.L.; software, M.J.L.; validation, M.J.L., J.-H.W. and J.C.; formal analysis, M.J.L.; investigation, M.J.L.; resources, M.J.L.; data curation, M.J.L.; writing—original draft preparation, M.J.L.; writing—review and editing, M.J.L., J.-H.W. and J.C.; visualization, M.J.L. and J.C.; supervision, M.J.L.; project administration, J.-Y.L.; funding acquisition, J.-Y.L. All authors have read and agreed to the published version of the manuscript.
Funding
This work was supported by a National Research Foundation of Korea (NRF) grant funded by the Korean government (MSIT) (No. NRF-2020 M2D4A1067573).
Data Availability Statement
Not applicable.
Acknowledgments
The data and information presented in the paper are part of an ongoing IAEA coordinated research project on “Neutronics Benchmark of CEFR Start-Up Tests” (I31032).
Conflicts of Interest
The authors declare no conflict of interest.
References
- IAEA. IAEA CRP: Neutronics Benchmark of CEFR Start-Up Tests (I31032). Available online: https://iaea.org/projects/crp/i31032 (accessed on 25 September 2022).
- Huo, X. Technical Specifications for Neutronics Benchmark of CEFR Start-up Tests. Presented at 2nd RCM of the IAEA CRP I31032 on Neutronics Benchmark of CEFR Start-up Tests, Beijing, China, October 2019. [Google Scholar]
- Choe, J.; Batra, C.; Kriventsev, V.; Torres, A.; Levchenko, A.; Balint, B.; Davis, U.; Won, J.H.; Lee, M.J.; Sciora, P.; et al. Comprehensive Compilations of Computation Results and Validations for Neutronics Start-Up Tests at China Experimental Fast Reactor. In Proceedings of the International Conference on the Physics of Reactors (PHYSOR 2022), Pittsburgh, PA, USA, 15–20 May 2022. [Google Scholar]
- MCNP. User Manual–Code Version 6.2; LA-UR-17-29981; Los Alamos National Security LLC: Los Alamos, MN, USA, 2017. [Google Scholar]
- Leppänen, J.; Pusa, M.; Viitanen, T.; Valtavirta, V.; Kaltiaisenaho, T. The Serpent Monte Carlo code: Status, development and applications in 2013. Ann. Nucl. Energy 2015, 82, 142–150. [Google Scholar] [CrossRef]
- Romano, P.K.; Horelik, N.E.; Herman, B.R.; Nelson, A.G.; Forget, B.; Smith, K. OpenMC: A state-of-the-art Monte Carlo code for research and development. Ann. Nucl. Energy 2015, 82, 90–97. [Google Scholar] [CrossRef] [Green Version]
- Lee, H.; Kim, W.; Zhang, P.; Lemaire, M.; Khassenov, A.; Yu, J.; Jo, Y.; Park, J.; Lee, D. MCS—A Monte Carlo particle transport code for large-scale power reactor analysis. Ann. Nucl. Energy 2020, 139, 107276. [Google Scholar] [CrossRef]
- Shim, H.J.; Han, B.-S.; Jung, J.-S.; Park, H.-J.; Kim, C.-H. McCARD: Monte Carlo Code for Advanced Reactor Design and Analysis. Nucl. Eng. Technol. 2012, 44, 161–176. [Google Scholar] [CrossRef] [Green Version]
- Tran, T.Q.; Choe, J.; Du, X.; Lee, H.; Lee, D. Neutronic simulation of China experimental fast reactor start-up tests–part II: MCS code Monte Carlo calculation. Ann. Nucl. Energy 2020, 148, 107710. [Google Scholar] [CrossRef]
- Choe, J.; Batra, C.; Kriventsev, V.; Lee, D. Neutronic Analysis of Start-Up Tests at China Experimental Fast Reactor. Energies 2022, 15, 1249. [Google Scholar] [CrossRef]
- Guo, H.; Huo, X.; Feng, K.; Gu, H. Verification of OpenMC for fast reactor physics analysis with China experimental fast reactor start-up tests. Nucl. Eng. Technol. 2022, 54, 3897–3908. [Google Scholar] [CrossRef]
- Lee, M.J.; Won, J.H.; Choe, J.; Lim, J. Evaluation of Rod Worth Uncertainty from S-Curve for Neutronics Start-up Tests at China Experimental Fast Reactor. In Proceedings of the International Conference on the Physics of Reactors (PHYSOR 2022), Pittsburgh, PA, USA, 15–20 May 2022. [Google Scholar]
- Chadwick, M.B.; Obložinský, P.; Herman, M.; Greene, N.M.; McKnight, R.D.; Smith, D.L.; Young, P.G.; MacFarlane, R.E.; Hale, G.M.; Frankle, S.C.; et al. ENDF/B-VII.0: Next Generation Evaluated Nuclear Data Library for Nuclear Science and Technology. Nucl. Data Sheets 2006, 107, 2931–3060. [Google Scholar] [CrossRef]
Figure 1.
Core layout of the CEFR for the start-up tests [
2].
Figure 1.
Core layout of the CEFR for the start-up tests [
2].
Figure 2.
S-curves for the (a) RE and (b) SH rods.
Figure 2.
S-curves for the (a) RE and (b) SH rods.
Figure 3.
Schematic for estimating the rod worth from an S-curve.
Figure 3.
Schematic for estimating the rod worth from an S-curve.
Figure 4.
Comparison of temperature reactivity for temperature (a) increasing and (b) decreasing processes.
Figure 4.
Comparison of temperature reactivity for temperature (a) increasing and (b) decreasing processes.
Figure 5.
Sodium void measurement positions.
Figure 5.
Sodium void measurement positions.
Figure 6.
Comparison of sodium void reactivity for two cases: (a) original results and (b) updated results.
Figure 6.
Comparison of sodium void reactivity for two cases: (a) original results and (b) updated results.
Figure 7.
Swap reactivity measurement positions.
Figure 7.
Swap reactivity measurement positions.
Figure 8.
(a) Relative uncertainty and (b) statistical uncertainty by swap reactivity measurement position.
Figure 8.
(a) Relative uncertainty and (b) statistical uncertainty by swap reactivity measurement position.
Figure 9.
Comparison of sub-assembly swap reactivity calculations for measurements by (a) multiple rods and (b) single rod.
Figure 9.
Comparison of sub-assembly swap reactivity calculations for measurements by (a) multiple rods and (b) single rod.
Table 1.
Experimental and calculation results of control rod worth measurement.
Table 1.
Experimental and calculation results of control rod worth measurement.
| Control Rod | Measurement | Calculation |
|---|
| Rod Worth (pcm) | Rod Worth (pcm) | Error (%) |
|---|
| RE1 | 150 ± 9 | 154.1 ± 5.9 | 2.7 ± 7.3 |
| RE2 | 149 ± 9 | 151.0 ± 5.9 | 1.4 ± 7.3 |
| SH1 | 2019 ± 250 | 1859.9 ± 5.9 | −7.9 ± 11.4 |
| SH2 | 1839 ± 225 | 1825.9 ± 6.4 | −0.7 ± 12.2 |
| SH3 | 1839 ± 226 | 1814.3 ± 5.8 | −1.3 ± 12.1 |
| SA1 | 945 ± 100 | 893.5 ± 5.8 | −5.5 ± 10.0 |
| SA2 | 911 ± 100 | 876.2 ± 5.8 | −3.8 ± 10.6 |
| SA3 | 946 ± 98 | 938.5 ± 5.9 | −0.8 ± 10.3 |
| 3*SH + 2*RE | 2877 ± 335 | 2988.2 ± 6.1 | 3.9 ± 12.1 |
| SH2 + SH1 + 2*RE | 881 ± 76 | 985.7 ± 5.7 | 11.9 ± 9.7 |
| 3*SA | 2981 ± 395 | 2850.2 ± 5.9 | −4.4 ± 12.7 |
| SA1 + SA2 | 1950 ± 226 | 1823.7 ± 6.3 | −6.5 ± 10.8 |
| 2*RE + 3*SH + 3*SA | 6079 ± 989 | 5948.7 ± 6.4 | −2.1 ± 15.9 |
| 2*RE + SH2 + SH3 + 3*SA | 3899 ± 551 | 3881.7 ± 6.2 | −0.4 ± 14.1 |
Table 2.
Uncertainty components of the temperature reactivity measurements.
Table 2.
Uncertainty components of the temperature reactivity measurements.
| Temperature (°C) | RE1/RE2 Rod
Positions (mm) | SH1/SH2/SH3
Rod Positions (mm) | Uncertainty (pcm) |
|---|
| | | Total |
|---|
Increasing
process | 250 | 207.2/207.7 | 247.9/247.7/248.0 | — |
| 275 | 212.3/212.9 | 253.6/253.1/253.8 | 2.4 | 1.0 | 5.8 | 6.4 |
| 283 | 239.7/239.3 | 253.4/253.1/254.0 | 2.6 | 5.0 | 5.9 | 8.1 |
| 293 | 282.8/283.4 | 253.4/253.0/253.7 | 3.3 | 6.1 | 5.9 | 9.1 |
| 302 | 307.5/307.0 | 254.7/254.6/255.9 | 4.2 | 6.9 | 5.8 | 9.9 |
Decreasing
process | 300 | 407.7/408.5 | 501.5/162.3/162.2 | — |
| 290 | 283.4/283.8 | 254.0/253.7/254.4 | 50.3 | 10.9 | 5.8 | 51.5 |
| 281 | 285.2/284.6 | 502.0/162.2/162.2 | 3.0 | 6.4 | 5.6 | 9.2 |
| 270 | 232.4/232.2 | 501.9/162.2/162.2 | 4.5 | 6.2 | 5.9 | 9.6 |
| 250 | 118.5/118.9 | 501.8/162.2/163.0 | 7.5 | 6.3 | 5.8 | 11.3 |
Table 3.
Reactivity compensation (pcm) by each rod in the temperature reactivity measurements.
Table 3.
Reactivity compensation (pcm) by each rod in the temperature reactivity measurements.
| Temperature (°C) | RE1 | RE2 | SH1 | SH2 | SH3 | Total |
|---|
| 275 | −2.4 | −2.5 | −28.5 | −26.1 | −27.9 | −87.3 |
| 283 | −15.6 | −15.2 | −27.4 | −26.1 | −28.8 | −113.1 |
| 293 | −34.1 | −32.7 | −27.4 | −25.6 | −27.4 | −147.1 |
| 302 | −42.8 | −40.8 | −34.1 | −33.6 | −37.7 | −188.9 |
| 290 | 36.8 | 48.2 | 811.6 | −429.5 | −441.8 | 25.3 |
| 281 | 36.1 | 47.9 | 0.0 | 0.5 | 0.0 | 84.4 |
| 270 | 59.0 | 69.2 | 0.0 | 0.5 | 0.0 | 128.7 |
| 250 | 107.0 | 108.7 | 0.0 | 0.5 | −3.6 | 212.5 |
Table 4.
Calculation results of temperature reactivity.
Table 4.
Calculation results of temperature reactivity.
| Temperature (°C) | Measurements | Calculation w/S-Curve | Calculation w/Three-Step Method |
|---|
| Reactivity (pcm) | Reactivity (pcm) | C/E-1 (%) | Reactivity (pcm) | C/E-1 (%) |
|---|
Increasing
process | 275 | −90.6 ± 13.1 | −96.4 ± 6.4 | 6.4 ± 16.9 | −106.5 ± 5.9 | 17.5 ± 18.2 |
| 283 | −116.3 ± 16.2 | −141.5 ± 8.1 | 21.7 ± 18.3 | −143.9 ± 5.8 | 23.7 ± 18.0 |
| 293 | −152.4 ± 20.4 | −173.8 ± 9.1 | 14.0 ± 16.4 | −176.8 ± 6.0 | 16.0 ± 16.0 |
| 302 | −201.9 ± 27.0 | −213.3 ± 9.9 | 5.6 ± 15.0 | −212.9 ± 5.8 | 5.5 ± 14.4 |
Decreasing
process | 290 | 44.6 ± 7.3 | 91.5 ± 51.5 | 105.1 ± 120.2 | 40.1 ± 5.6 | −10.2 ± 19.4 |
| 283 | 81.0 ± 11.5 | 73.7 ± 9.0 | −9.1 ± 17.1 | 71.7 ± 5.9 | −11.5 ± 14.5 |
| 293 | 129.3 ± 17.4 | 130.0 ± 9.7 | 0.6 ± 15.5 | 121.4 ± 5.8 | −6.1 ± 13.4 |
| 302 | 219.7 ± 29.0 | 208.9 ± 11.4 | −4.9 ± 13.6 | 201.7 ± 5.7 | −8.2 ± 12.4 |
Table 5.
Uncertainty components of the sodium void reactivity measurements.
Table 5.
Uncertainty components of the sodium void reactivity measurements.
| Void Position | RE Rod
Positions (mm) | Uncertainty (pcm) |
|---|
| | | Total |
|---|
| (2–4) | Original | 277.6/277.3 | 1.3 | 4.9 | 5.9 | 7.8 |
| Voided | 336.8/336.8 |
| (3–7) | Original | 278.0/277.4 | 1.3 | 5.1 | 5.6 | 7.7 |
| Voided | 337.9/337.9 |
| (4–9) | Original | 277.7/277.6 | 1.3 | 5.1 | 6.0 | 8.0 |
| Voided | 338.0/337.6 |
| (5–11) | Original | 278.4/276.2 | 1.3 | 5.1 | 5.8 | 7.8 |
| Voided | 338.0/337.5 |
| (6–13) | Original | 302.9/303.3 | 0.6 | 5.5 | 5.9 | 8.0 |
| Voided | 338.1/337.8 |
Table 6.
Calculation results of sodium void reactivity.
Table 6.
Calculation results of sodium void reactivity.
| Void Position | Measurements | Calculation w/S-Curve | Calculation w/Three-Step Method |
|---|
| Reactivity (pcm) | Reactivity (pcm) | C/E-1 (%) | Reactivity (pcm) | C/E-1 (%) |
|---|
| (2–4) | −39.2 ± 5.8 | −27.7 ± 7.8 | −29.2 ± 22.4 | −35.2 ± 5.6 | −10.3 ± 19.5 |
| (3–7) | −43.4 ± 5.9 | −28.0 ± 7.7 | −35.4 ± 19.7 | −38.3 ± 5.9 | −11.7 ± 18.1 |
| (4–9) | −40.5 ± 5.7 | −32.9 ± 8.0 | −18.9 ± 22.8 | −40.1 ± 6.0 | −1.0 ± 20.3 |
| (5–11) | −40.1 ± 5.5 | −27.2 ± 7.8 | −32.1 ± 21.5 | −33.7 ± 6.1 | −16.0 ± 19.2 |
| (6–13) | −32.9 ± 5.5 | −30.4 ± 8.0 | −7.6 ± 28.9 | −33.3 ± 5.8 | 1.2 ± 24.4 |
Table 7.
Calculated sodium void reactivity with improved RE rod S-curves.
Table 7.
Calculated sodium void reactivity with improved RE rod S-curves.
| Void Position | Reactivity (pcm) | C/E-1 (%) | Difference *
|
|---|
| (2–4) | −32.9 ± 6.5 | −16.1 ± 20.8 | −5.2 |
| (3–7) | −33.3 ± 6.3 | −23.2 ± 17.9 | −5.3 |
| (4–9) | −38.1 ± 6.7 | −5.8 ± 21.2 | −5.3 |
| (5–11) | −32.5 ± 6.5 | −18.9 ± 19.6 | −5.3 |
| (6–13) | −34.6 ± 6.5 | 5.3 ± 26.5 | −4.2 |
Table 8.
Sub-assemblies loaded after the swap.
Table 8.
Sub-assemblies loaded after the swap.
| Measurement Position | Sub-Assemblies Loaded after Swap |
|---|
| (2–6) | (3–11) | (4–17) | (5–23) | (6–29) | (5–22) | (7–31) | (5–19) |
|---|
| (2–6) | SS | Fuel | Fuel | Fuel | Fuel | Fuel | SS | SS |
| (3–11) | Fuel | SS | Fuel | Fuel | Fuel | Fuel | SS | SS |
| (4–17) | Fuel | Fuel | SS | Fuel | Fuel | Fuel | SS | SS |
| (5–23) | Fuel | Fuel | Fuel | SS | Fuel | Fuel | SS | SS |
| (6–29) | Fuel | Fuel | Fuel | Fuel | SS | Fuel | SS | SS |
| (5–22) | Fuel | Fuel | Fuel | Fuel | Fuel | SS | SS | SS |
| (7–31) * | Fuel | Fuel | Fuel | Fuel | SS | Fuel | Fuel | SS |
| (5–19) * | Fuel | Fuel | Fuel | SS | Fuel | Fuel | SS | Fuel |
Table 9.
Control rod positions and uncertainty components of sub-assembly swap reactivity measurements with multiple rods and single rod.
Table 9.
Control rod positions and uncertainty components of sub-assembly swap reactivity measurements with multiple rods and single rod.
| | Swap Position | RE1/RE2 Rod
Positions (mm) | SH1/SH2/SH3
Rod Positions (mm) | Uncertainty (pcm) |
|---|
| | | Total |
|---|
| Measurements by multiple rods | (2–6) | Before | 267.2/267.3 | 241.2/242.0/241.4 | 23.7 | 9.7 | 5.5 | 26.2 |
| After | 326.7/325.2 | 297.6/297.2/299.0 |
| (3–11) | Before | 257.6/257.1 | 241.5/241.7/242.0 | 21.8 | 7.8 | 5.8 | 23.9 |
| After | 258.2/260.4 | 293.3/293.4/294.5 |
| (4–17) | Before | 258.9/257.2 | 241.6/241.5/241.3 | 19.8 | 6.8 | 6.2 | 21.8 |
| After | 257.1/257.7 | 288.2/288.9/288.7 |
| (5–23) | Before | 257.7/257.1 | 241.1/241.1/241.3 | 14.3 | 7.1 | 5.5 | 16.9 |
| After | 293.4/292.9 | 275.7/275.0/275.0 |
| (6–29) | Before | 258.8/258.9 | 241.0/242.2/241.8 | 15.2 | 7.3 | 5.4 | 17.7 |
| After | 317.9/317.0 | 277.7/277.2/278.5 |
| (5–22) | Before | 319.1/317.2 | 277.7/277.2/278.6 | 13.2 | 7.7 | 5.7 | 16.3 |
| After | 230.0/229.4 | 247.1/246.6/247.0 |
| (7–31) | Before | 258.1/259.7 | 241.4/241.2/242.0 | 11.0 | 6.4 | 5.9 | 14.1 |
| After | 295.2/294.5 | 267.6/267.4/268.7 |
| (5–19) | Before | 295.2/294.5 | 267.6/267.4/268.7 | 5.2 | 2.4 | 6.1 | 8.4 |
| After | 295.2/294.6 | 255.3/255.2/255.8 |
| Measurements by single rod | (2–6) | Before | 267.7/267.5 | 287.1/286.4/150.9 | 43.6 | 6.0 | 5.8 | 44.4 |
| After | 238.5/237.6 | 286.6/286.4/341.8 |
| (3–11) | Before | 258.2/257.7 | 267.4/267.4/188.9 | 37.4 | 5.2 | 5.7 | 38.2 |
| After | 258.9/258.4 | 267.2/267.4/353.4 |
| (4–17) | Before | 257.8/257.2 | 267.3/267.4/188.4 | 33.6 | 4.6 | 6.1 | 34.5 |
| After | 258.3/257.8 | 267.5/268.4/333.9 |
| (5–23) | Before | 258.2/257.7 | 265.2/265.6/193.3 | 26.1 | 5.2 | 5.7 | 27.2 |
| After | 258.2/257.1 | 265.1/265.6/303.1 |
| (6–29) | Before | 257.1/259.6 | 266.8/266.2/190.3 | 26.0 | 8.1 | 5.6 | 27.8 |
| After | 298.5/297.5 | 266.8/266.8/299.5 |
| (5–22) | Before | 298.4/299.6 | 266.8/266.8/299.6 | 22.1 | 8.6 | 5.6 | 24.3 |
| After | 229.6/230.3 | 266.5/266.2/207.5 |
| (7–31) | Before | 258.2/257.7 | 262.3/262.6/197.5 | 21.0 | 5.0 | 5.8 | 22.4 |
| After | 257.4/257.2 | 262.1/262.2/285.2 |
| (5–19) | Before | 257.4/257.2 | 262.1/262.2/285.2 | 8.7 | 3.9 | 6.2 | 11.4 |
| After | 257.6/257.4 | 262.2/262.7/247.8 |
Table 10.
Calculation results of sub-assembly swap reactivity.
Table 10.
Calculation results of sub-assembly swap reactivity.
| | Swap Position | Measurements | Calculation w/S-Curve | Calculation w/Three-Step Method |
|---|
| Reactivity (pcm) | Reactivity (pcm) | C/E-1 (%) | Reactivity (pcm) | C/E-1 (%) |
|---|
| Measurements by multiple rod | (2–6) | −986.0 ± 128.2 | −841.3 ± 26.2 | −14.7 ± 11.4 | −860.3 ± 5.6 | −12.7 ± 11.4 |
| (3–11) | −879.6 ± 114.3 | −771.0 ± 23.9 | −12.3 ± 11.7 | −776.1 ± 5.9 | −11.8 ± 11.5 |
| (4–17) | −777.3 ± 101.0 | −669.7 ± 21.8 | −13.8 ± 11.5 | −686.8 ± 6.0 | −11.6 ± 11.5 |
| (5–23) | −634.2 ± 82.5 | −523.9 ± 16.9 | −17.4 ± 11.1 | −543.8 ± 5.7 | −14.3 ± 11.2 |
| (6–29) | −474.1 ± 61.6 | −365.6 ± 17.7 | −22.9 ± 10.7 | −371.8 ± 5.7 | −21.6 ± 10.3 |
| (5–22) | −590.2 ± 76.7 | −504.4 ± 16.3 | −14.5 ± 11.4 | −495.3 ± 5.7 | −16.1 ± 11.0 |
| (7–31) | 209.7 ± 27.3 | 206.9 ± 14.1 | −1.3 ± 14.5 | 189.0 ± 5.9 | −9.9 ± 12.0 |
| (5–19) | 582.2 ± 75.7 | 529.2 ± 8.4 | −9.1 ± 11.9 | 542.3 ± 5.7 | −6.9 ± 12.1 |
| Measurements by single rod | (2–6) | −984.4 ± 128.0 | −826.4 ± 44.4 | −16.1 ± 11.8 | −854.4 ± 5.9 | −13.2 ± 11.3 |
| (3–11) | −875.1 ± 113.8 | −736.0 ± 38.2 | −15.9 ± 11.8 | −747.0 ± 6.1 | −14.6 ± 11.1 |
| (4–17) | −771.6 ± 100.3 | −651.5 ± 34.5 | −15.6 ± 11.8 | −661.3 ± 5.7 | −14.3 ± 11.2 |
| (5–23) | −639.5 ± 83.1 | −523.4 ± 27.2 | −18.1 ± 11.5 | −530.5 ± 5.8 | −17.0 ± 10.8 |
| (6–29) | −476.4 ± 61.9 | −353.9 ± 27.8 | −25.7 ± 11.3 | −383.3 ± 5.9 | −19.5 ± 10.5 |
| (5–22) | −585.8 ± 76.2 | −514.9 ± 24.3 | −12.1 ± 12.2 | −503.2 ± 5.8 | −14.1 ± 11.2 |
| (7–31) | 209.9 ± 27.3 | 217.2 ± 22.4 | 3.5 ± 17.2 | 183.5 ± 5.7 | −12.6 ± 11.7 |
| (5–19) | 581.9 ± 75.6 | 526.3 ± 11.4 | −9.6 ± 11.9 | 552.4 ± 6.2 | −5.1 ± 12.4 |
| Publisher’s Note: MDPI stays neutral with regard to jurisdictional claims in published maps and institutional affiliations. |
© 2022 by the authors. Licensee MDPI, Basel, Switzerland. This article is an open access article distributed under the terms and conditions of the Creative Commons Attribution (CC BY) license (https://creativecommons.org/licenses/by/4.0/).


