Article

Maximum Power Point Tracking for Photovoltaic Systems Operating under Partially Shaded Conditions Using SALP Swarm Algorithm

1
School of Computing, Gachon University, 1342 Seongnamdaero, Seongnam 13120, Korea
2
Faculty of Electrical and Computer Engineering, Babol Noushirvaniy University of Technology, Babol 4714873113, Iran
3
Department of Electrical Engineering, Sahand University of Technology, Tabriz 5513351996, Iran
4
Electrical Engineering Departments, Zanjan University, Zanja 387914537, Iran
*
Authors to whom correspondence should be addressed.
Energies 2022, 15(21), 8210; https://doi.org/10.3390/en15218210
Submission received: 28 September 2022 / Revised: 24 October 2022 / Accepted: 28 October 2022 / Published: 3 November 2022

Abstract

:
This article presents a new method based on meta-heuristic algorithm for maximum power point tracking (MPPT) in photovoltaic systems. In this new method, the SALP Swarm Algorithm (SSA) is used instead of classic methods such as the Perturb and Observe (P&O) method. In this method, the value of the duty cycle is optimally determined in an optimization problem by SSA in order to track the maximum power. The objective function in this problem is maximizing the output power of the photovoltaic system. The proposed method has been applied on a photovoltaic system connected to the load, taking into account the effect of partial shade and different atmospheric conditions. The SSA method is compared with the Particle Swarm Optimization (PSO) algorithm and P&O methods. Additionally, we evaluated the effect of changes in temperature and radiation on solving the problem. The results of the simulation in the MATLAB/Simulink environment show the optimal performance of the proposed method in tracking the maximum power in different atmospheric conditions compared to other methods. To validate the proposed algorithm, it is compared with four important indexes: ISE, ITSE, IAE, and ITAE.

1. Introduction

The absence of an environmental footprint, the simplicity of maintenance, and the free accessibility of sunlight have made photovoltaic-based power generation systems the most popular renewable energy resource in the new era [1,2,3]. On the other hand, the high costs of installing photovoltaic systems and their low efficiency during rapid changes in weather conditions may limit their widespread use [4,5]. Therefore, it is important to take into account MPPT while designing solar systems, especially in light of climate change [6,7].
Photovoltaic systems have low efficiency that should be investigated [8,9]. One of the most economical ways to improve the efficiency photovoltaic systems is to guarantee performance at the maximum power point (MPP) regardless of weather conditions [10,11]. Obtaining the MPP from photovoltaic systems has a significant role in increasing efficiency. This can be achieved by connecting the MPP tracker controller (typically a chopper) [12] to adjust the duty cycle to match the load. The electrical power provided by solar systems depends on the temperature insulation and the amount of radiation. Solar cells have an optimal operating point that is found by a tracking controller. When making a direct connection between the load and the source, the output of the photovoltaic module is rarely at maximum power and the operating point is not optimal. To solve this problem, an MPPT controller with a DC/DC converter between the load and the source is used to compensate the output voltage of the solar panel and keep the voltage constant at a value that maximizes the output power.
Through the development of new algorithms for MPPT, many efforts have been made to improve the performance of photovoltaic systems. The P&O method [13] and the Hill Climbing (H&C) method [14] have been widely used for MPPT because they are easy to implement and require fewer sensors. Photovoltaic arrays can track the MPP of their systems using the Incremental Conductance ( IncCond ) algorithm [15], which compares incremental and instantaneous conductance. Ripple Correlation Control (RCC) [16] causes a ripple in the control strategy with the help of MPPT control converter switching. It works well in high sunlight, but the tracking efficiency drops in low sunlight. It is possible to determine the current and voltage at the MPP of the solar system using short-circuit current (SCC) [17] and open-circuit voltage (OCV) [18]. As photovoltaic sources can be integrated into power systems [19], their design, performance analysis, and efficiency optimization are hot topics in the power industry [20]. Various MPPT algorithms based on the use of fuzzy or evolutionary methods are mentioned in [21]. Regarding the implementation of these methods using FPGA chips, a comparison has been made between them in terms of complexity, efficiency, speed, and required memory space. Fuzzy logic and Artificial Neural Networks (ANNs) are used to maximize photovoltaic power. MPPTs based on complexity, speed, and oscillation around the maximum power point have been implemented in these methods [22]. The PSO algorithm is used to reach the maximum power point in [23].
However, under low-irradiance conditions, the photovoltaic profile gradient becomes a source of instability, and gradient-based algorithms can be trapped by local points of maximum power under non-uniform irradiation or partial shading [24]. GWO optimization is employed instead of general MPPT in [25].
Population-based algorithms use many random parameters such as population size, mutation rate, and combination probability in GA [26], and inertia weight and weight coefficients in PSO algorithms [27]. These parameters are chosen randomly and their values must be adjusted carefully so that the algorithm converges. Furthermore, any change in the photovoltaic characteristics will affect the performance of the MPPT algorithm, and these parameters must be readjusted to regain convergence. Moreover, the ability of stochastic MPPTs to converge to the general MPP does not guarantee that the general MPP will be achieved when the PV system experiences partial shading. This can be easily illustrated by the fact that generic search algorithms are mainly used in offline optimization problems and need to be run many times before concluding that the best answer is the generic answer.
The effect of partial shade is a major area of interest within the field of MPPT problems of the photovoltaic system and has been investigated by many researchers. Studies have shown that conventional methods have poor tracking performance, and most of them fail to track the correct MPP under partial shade. A number of stochastic algorithms and artificial intelligence methods have been developed to overcome the disadvantages of conventional MPPT algorithms. Based on nature and biology, these MPPT algorithms maximize the output power of photovoltaic arrays. Genetic Algorithm (GA) and PSO are two prominent examples of these methods. Under partial shade conditions, PSO and GA optimization methods are computationally simple and produce the global peak. However, in partial shade conditions, the presented methods are trapped in the local optimum, which has presented a challenge in solving the MPPT problem. We used the novel SSA to achieve the MPP of the photovoltaic panel in this paper. We examine our solution in various scenarios, such as standard conditions, solar radiation and temperature variation, and partial shade patterns from different angles. Additionally, we compare our solution with the P&O method and the PSO algorithm, particularly the efficiency and speed of convergence. The contents of the paper are as follows: photovoltaic system modeling, SALP Swarm Algorithm (SSA), problem-solving based on the SSA algorithm, simulation results, simulation results in standard conditions, simulation results in variable radiation conditions, simulation results in variable temperature conditions, simulation results in shade pattern conditions 1, simulation results in shade pattern conditions 2, and conclusions. After examining the uncertainty, the proposed algorithm is compared with four important indicators: ISE, ITSE, IAE, and ITAE. According to the information given in the introduction, it can be concluded that the effect of changing the radiation on the current is greater than that of changing the voltage, in such a way that reducing the amount of radiation reduces the current more than the voltage and ultimately leads to a decrease in power. Moreover, the decrease in temperature has a greater effect on the voltage, so with the increase in temperature, the voltage decreases more than the current, and this also causes a decrease in power. Under partial shade conditions, on the other hand, the output characteristic of solar cells has several maxima. Therefore, in the exploitation of photovoltaic cells, an algorithm should be used (we suggest the SSA algorithm) that guarantees the maximum power point in the conditions of changes in the working point.

2. Photovoltaic System Modeling

Photovoltaic cell technology combines the behavior of voltage and current sources based on the operating point. This behavior can be achieved by connecting a sunlight-sensitive current source to the p–n junction of a semiconductor material sensitive to sunlight and temperature. The equivalent circuit of this photovoltaic cell model is presented in Figure 1.
The photovoltaic I–V curve is specified with Equation (1), in which series resistance (Rs), parallel resistance (Rsh), the number of cells connected in the series (Ns), q electric charge, k Boltzmann’s constant, and the parallel of the equivalent panel (NP) are included [28].
I = Np I pv Is e q V + IR S α N s KT 1 V + IR S R sh
where coefficient α represents the ideality degree of the diode, which may be optionally chosen in the range (1, 1.5). Photovoltaic cell current generated through light radiation (Ipv) is linearly related to the amount of radiation and is affected by temperature as follows:
Ipv = G G STC ( Ipvn + K i T T STC
where Ki is the coefficient of short-circuit current temperature, T is the temperature in Kelvin, and   T STC is the cell reference temperature. The second term IS in Equation (1) is the diode current, which is a function of the voltage and current coefficients given by Equation (3).
Is = I scn + KI Δ T e v ocn + Kv Δ T α Vt
where Vt is the thermal voltage of the photovoltaic cell and Iscn is the rated short-circuit current or the maximum current available at the terminals of the practical device in nominal conditions. Ipvn is the rated current generated by light in standard conditions (1 kW/m2, 25 °C), determined by Equation (4). It is noted that the standard test condition includes standard radiation condition (GSTC) equal to 1 kW/m2 and standard temperature (TSTC) equal to 25 °C [29]:
Ipvn = R s + R sh R sh I scn
According to Figure 1 and the studied equations, our target function is the output voltage and current, whose values are applied to the MPPT controller (Figure 2a).
Finally, the MPPT output is connected to the boost converter. The structure of this controller is shown in Figure 2.
The controllers used in the photovoltaic system measure the maximum power point of the voltage and current at the output of the solar panel, and then apply the power to the input of this controller. The controller tests the output power of the photovoltaic system for each sample and it determines the changes in the power ratio in terms of voltage ( dp dv ). If dp dv is positive, it is continued in the same direction until it reaches a point where dp dv is zero. Otherwise, it should be continued in the opposite direction.

3. SALP Swarm Algorithm

The SSA algorithm belongs to the Salpidae   family, which has a transparent and tubular body [30,31]. Their body texture is identical to jellyfish, and they move similarly to them. In this way, water is pumped through the body to provide forward thrust. Figure 3 delineates the Salp shape.
SSA models the Salp’s social and chain-like behavior for better movement by using coordinated rapid changes in the pursuit of food. A Salp chain is mathematically modeled by dividing the population into two groups: leaders and followers. The group leader is the Salp at the front of the chain, and other Salps are considered followers. The leader directs and leads the group, and the followers follow each other (and the leader directly or indirectly). Similar to other collective methods, the Salp’s position is defined in an n-dimensional search space, where n is the number of variables in the problem. A two-dimensional matrix called x stores the positions of all Salps. Additionally, a food source called F is assumed to be the target of collection in the search space. The following equation is used to update the leader’s position:
x j 1 = F j + c 1 ub j lb j c 2 + lb j C 3 0 F j c 1 ub j lb j c 2 + lb j C 3 < 0
where   x j 1 represents the first Salp position (leader) in the jth dimension, Fj is the food source location in the jth dimension, ubj represents the jth dimension’s upper limit, lbj represents the jth dimension’s lower limit, and c1, c2, and c3 are random numbers. A leader updates its position only relative to the food source, as shown by Equation (5). In the SSA algorithm, coefficient c1 is critical because it provides a trade-off between search and exploitation:
C 1 = 2 e 4 l L 2
where l   is the current iteration and L is the total number of iterations. Random numbers c2 and c3 are generated uniformly within the interval [1, 0]. The direction of the jth dimension’s next position movement to positive or negative infinity and step size are determined by c2 and c3. Newton’s motion low is used to update the follower’s position according to Equation (7).
x j i = 1 2 at 2 + v 0 t
where i ≥ 2, x j i is the ith follower position in the jth dimension, t denotes time, v0 is initial velocity, and a = v final v 0 is established in which we have v = x x 0 t .
Since time is constant in iterations, the difference between them is 1, resulting in Equation (7) being simplified as follows, considering v0 = 0.
x j i = 1 2 at 2 + v 0 t
where   i   2 , and x j i indicates the ith follower Salps position in the jth dimension. We simulate Salps chains by Equations (5) and (8). Figure 4 gives the SSA algorithm pseudocode.
The transient response of the system is characterized by two important factors: the speed of the response and the closeness of the output to the input reference (desired). The error signal is expressed by the following equation:
e t = u t y t
In order to better represent the superior performance of the proposed strategy (SSA) to PSO and P&O, we used the following four performance indices: (a) ISE (Integral of Squared Error), (b) ITSE (Integral of Time-Squared Error), (c) IAE (Integral of Absolute Error), and (d) ITAE (Integral of Time-Absolute Error) [32].
IAE = 0 tss e t d t
ISE = 0 tss e 2 t d t
ITAE = 0 tss t e t d t
ITSE = 0 tss te 2 d t
where tss is the time at which the response reaches the steady state.

4. Case Study Based on the SSA Algorithm

The MPPT system consists of an array of photovoltaic panels, a DC–DC converter, and the load, as shown in Figure 5. The best converter should be chosen to transfer the maximum power from the solar cell to the load. Due to the low output voltage of the photovoltaic system, it is necessary to use a booster converter (voltage booster) at the output of this system so that the output voltage reaches the desired value.
The MPPT algorithm is applied after measuring photovoltaic voltage and current and multiplying them with the help of a multiplier. Based on the SSA algorithm, the MPPT algorithm activates the DC–DC converter after generating a duty ratio d. As part of the proposed optimization algorithm, duty ratio d determines the position of each   Salp , and output power indicates the compatibility value of each Salp. Therefore, the proposed algorithm identifies the optimal duty cycle for a typical work point.
In this study, KC200GT photovoltaic module data and specifications of the panel used in this study are presented in Table 1, and the selected boost converter information is presented in Table 2. In Figure 6, the I–V and P–V characteristics of the photovoltaic module considered in this study are shown at different temperatures. Both characteristics indicate that the array output is nonlinear. Under full irradiation conditions, there is only one peak in the P–V characteristic. However, when partial shading occurs, the photovoltaic characteristic changes, and therefore, there will be multiple peaks.

5. Simulation Results

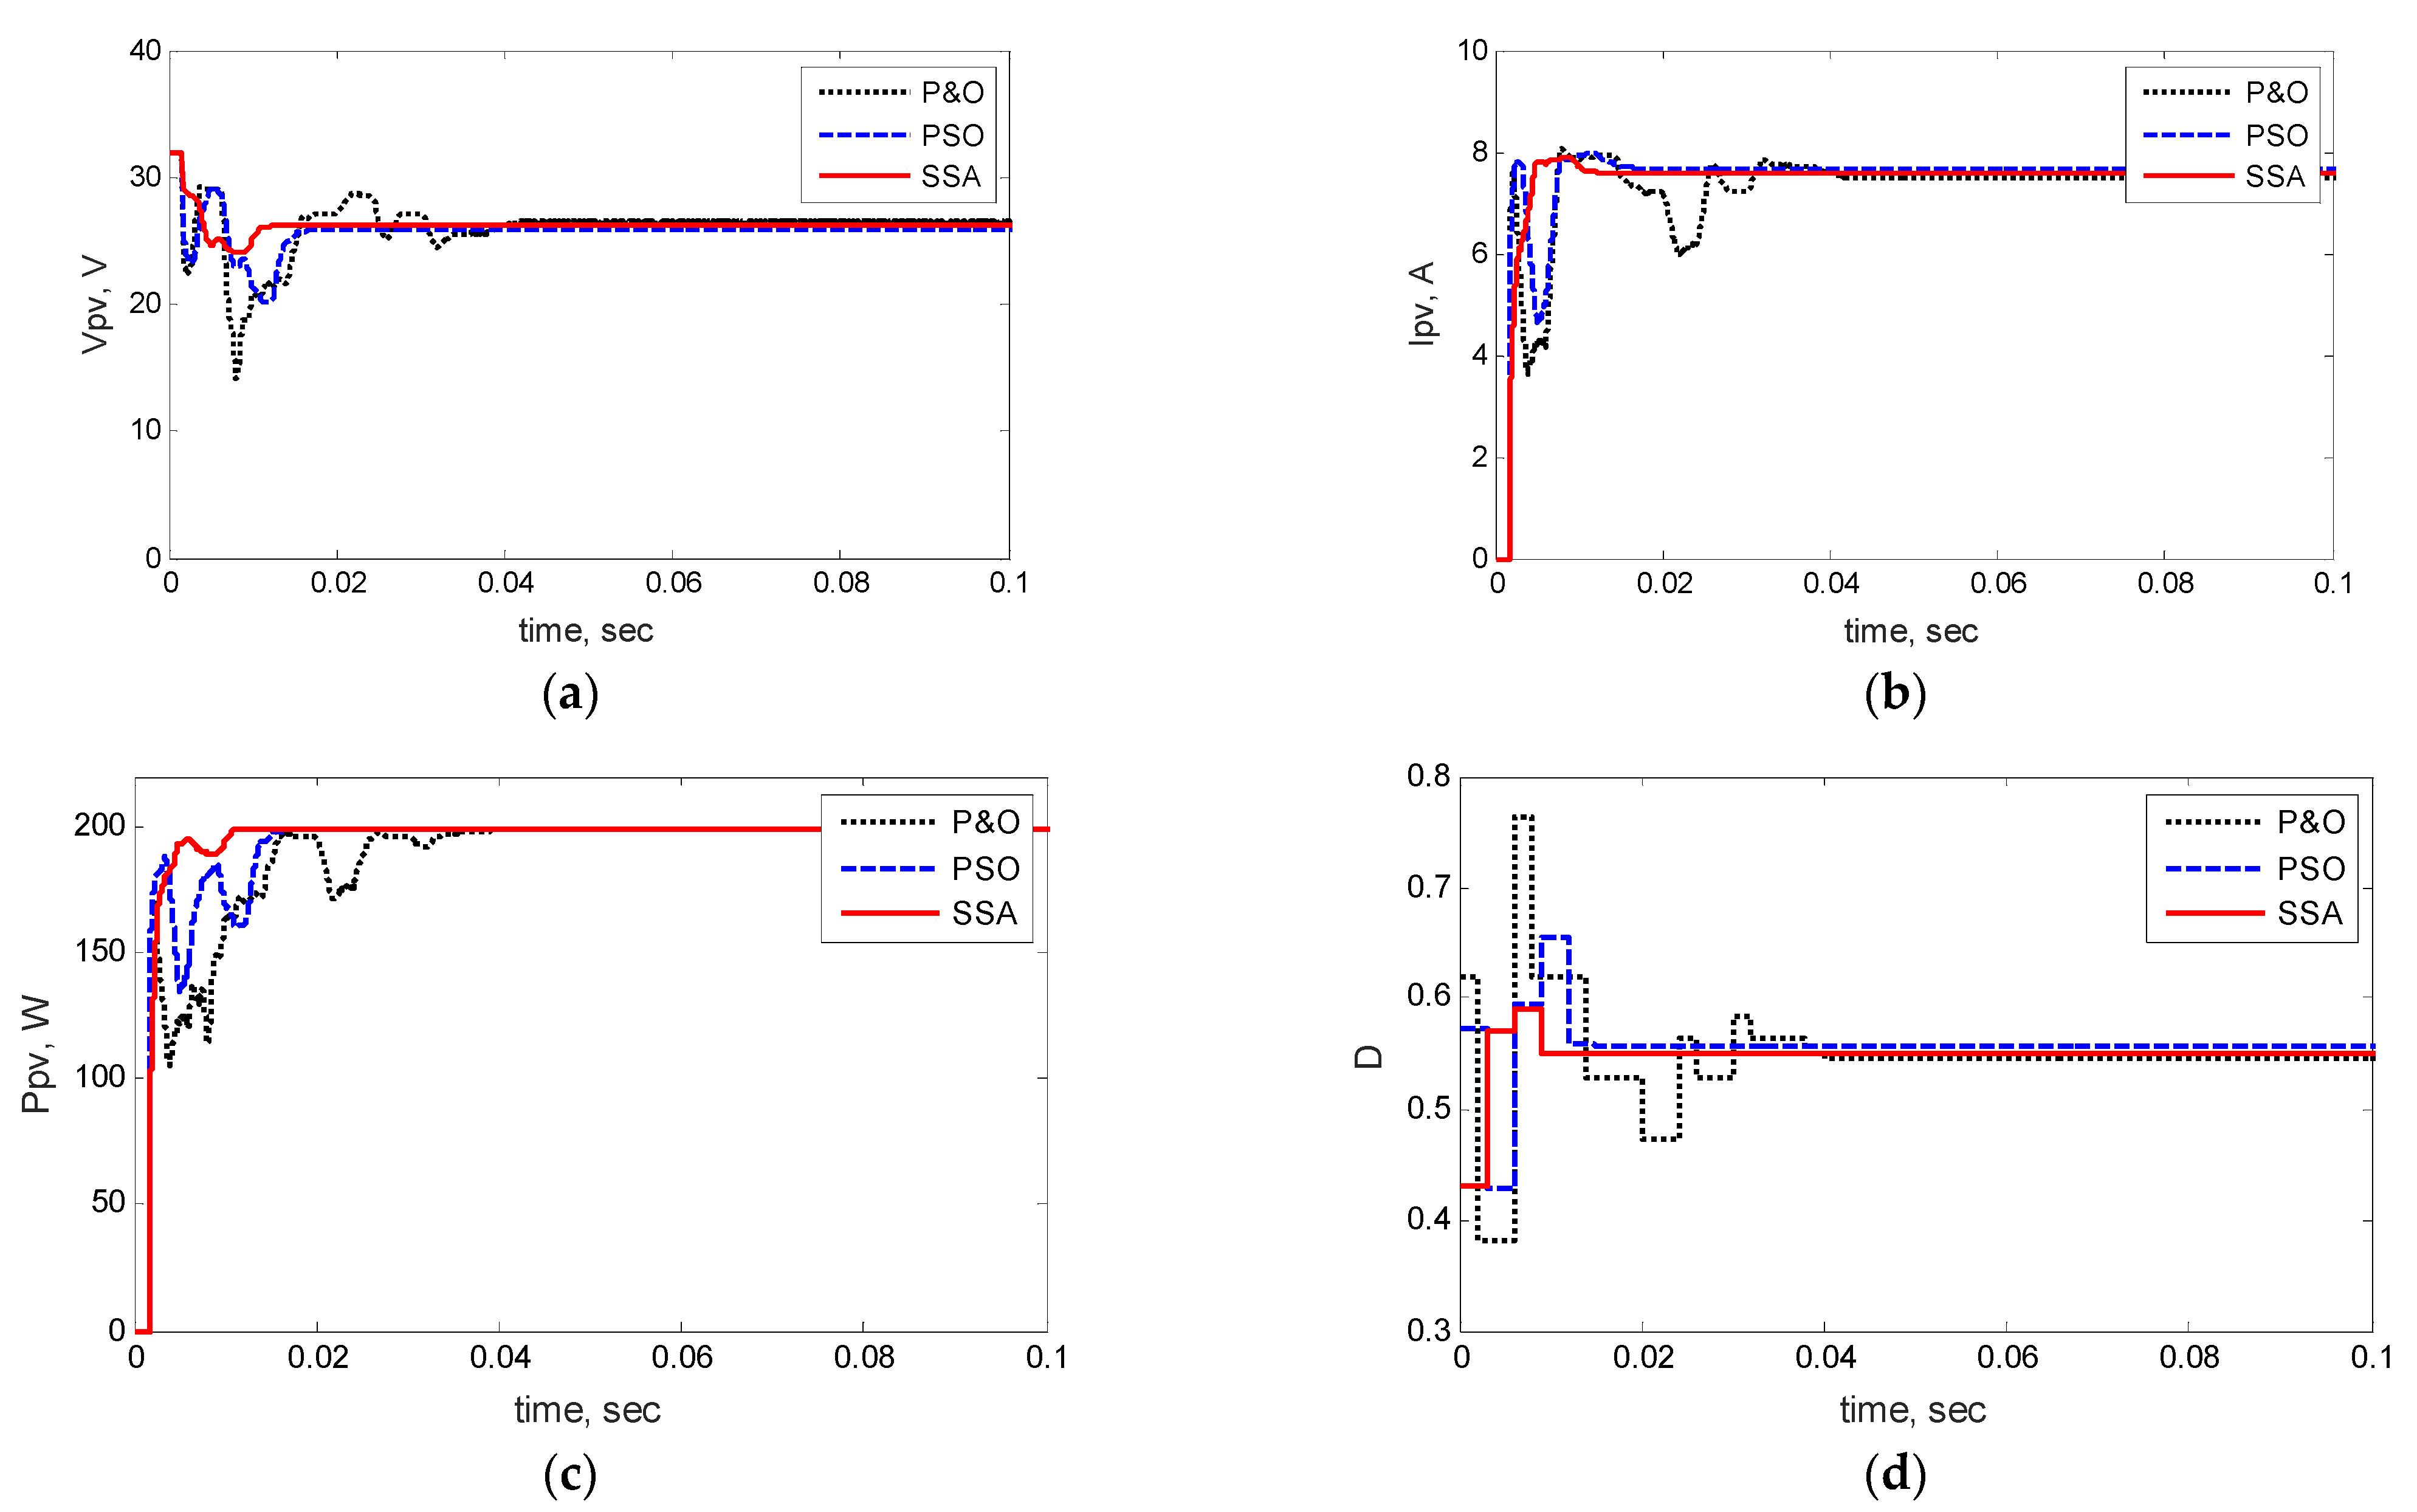
5.1. Simulation Results in Standard Conditions

This section examines solving MPPT with SSA under Standard Conditions (STC), G = 1000 W/m2, and T = 25. To evaluate the capability of the proposed SSA-based method, we compared its performance to the P&O and PSO. Figure 7 shows the current, voltage, and photovoltaic panel power curves along with the converter duty cycle. The proposed method has less fluctuation and reaches the GMPP point faster than the other methods, as shown in Figure 6. When the SSA method converges to the MPP, the solar panel voltage and current are kept constant, without any fluctuations. As a result, the duty point of the steady state of SSA is about 0.01 s, while the P&O and PSO methods reach it in about 0.016 and 0.039 s, respectively, confirming its high convergence speed. Under standard conditions, peak power equals 200.143 W, while steady-state power equals 198.9 W for each method.

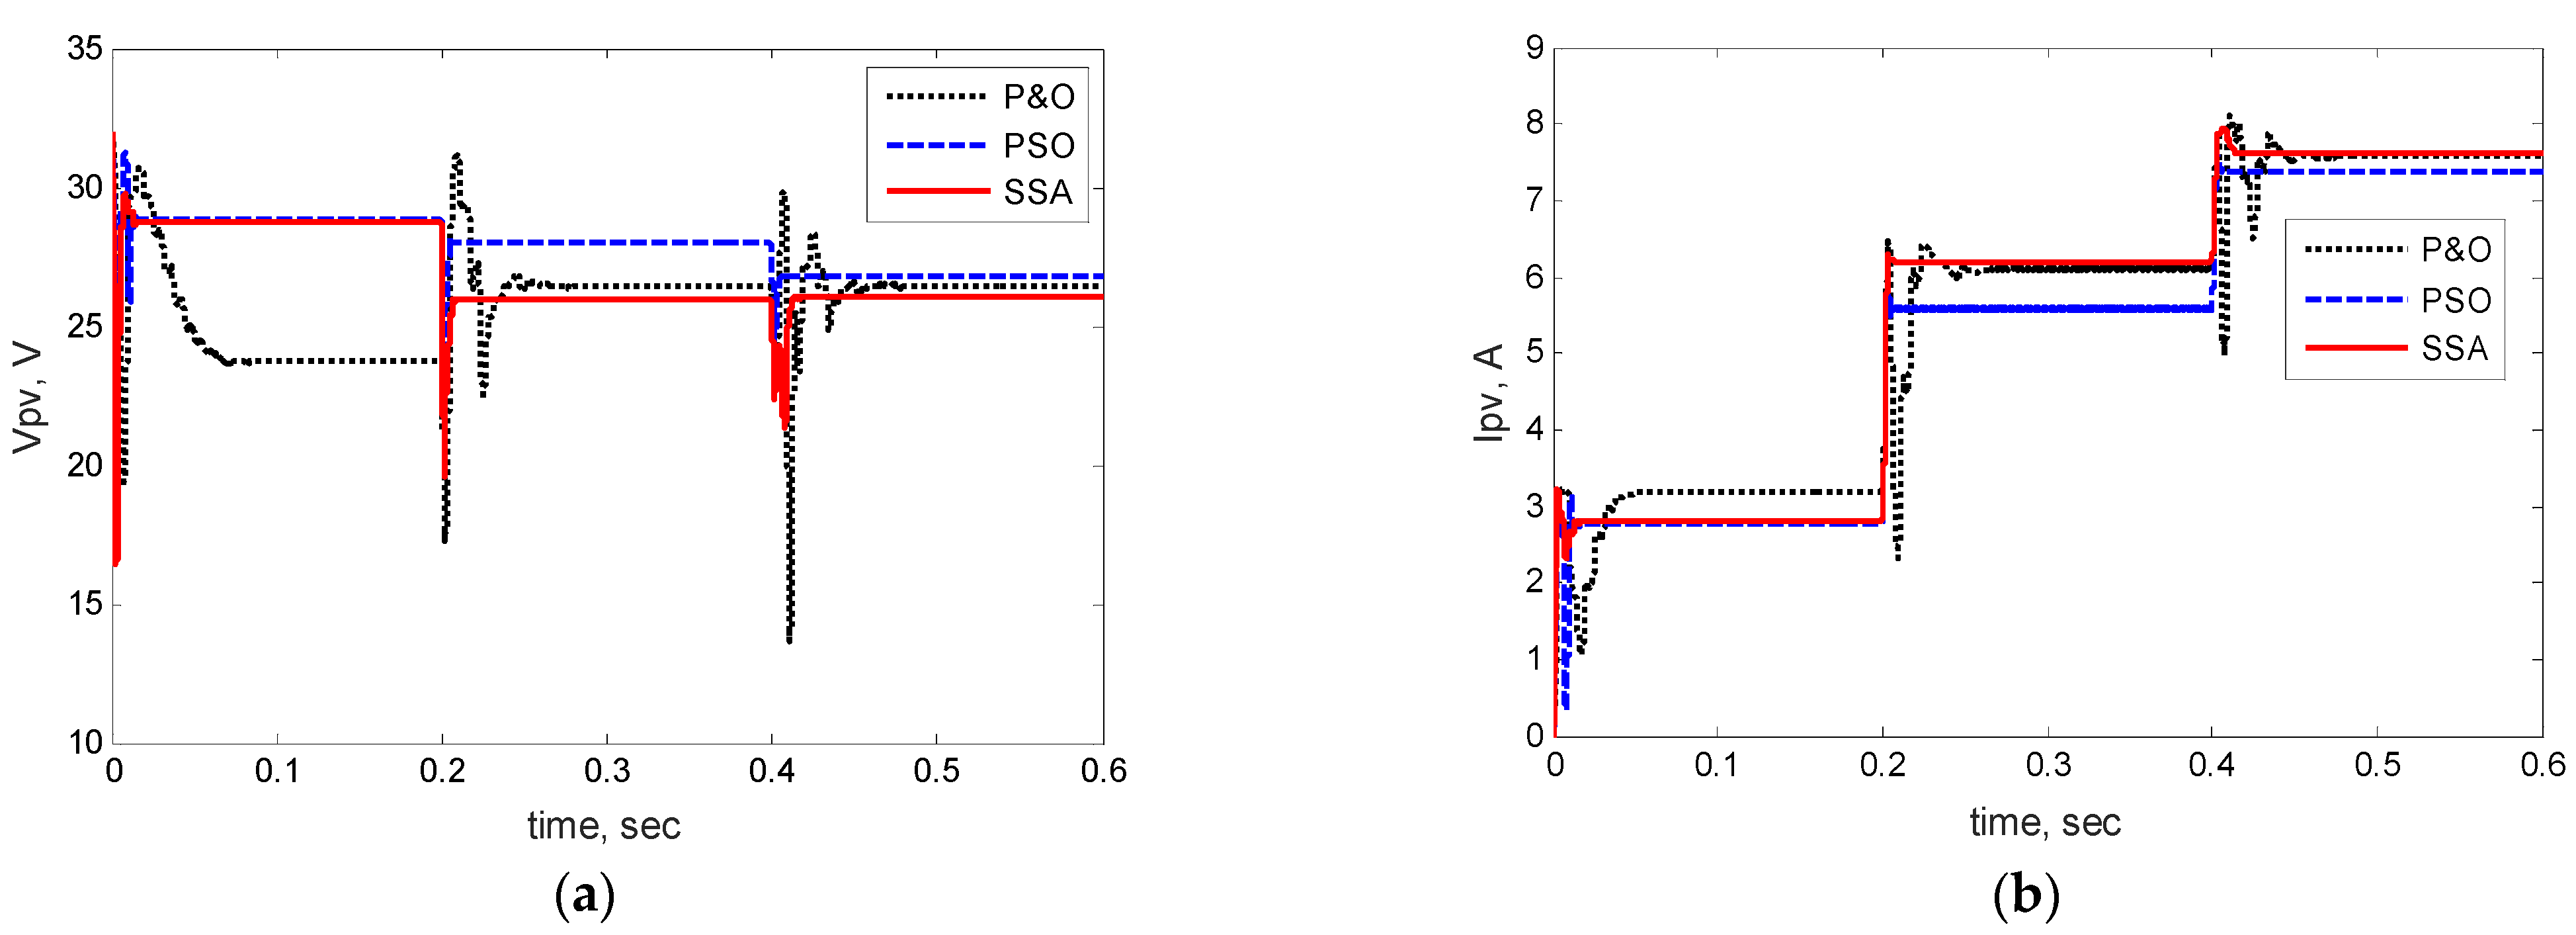
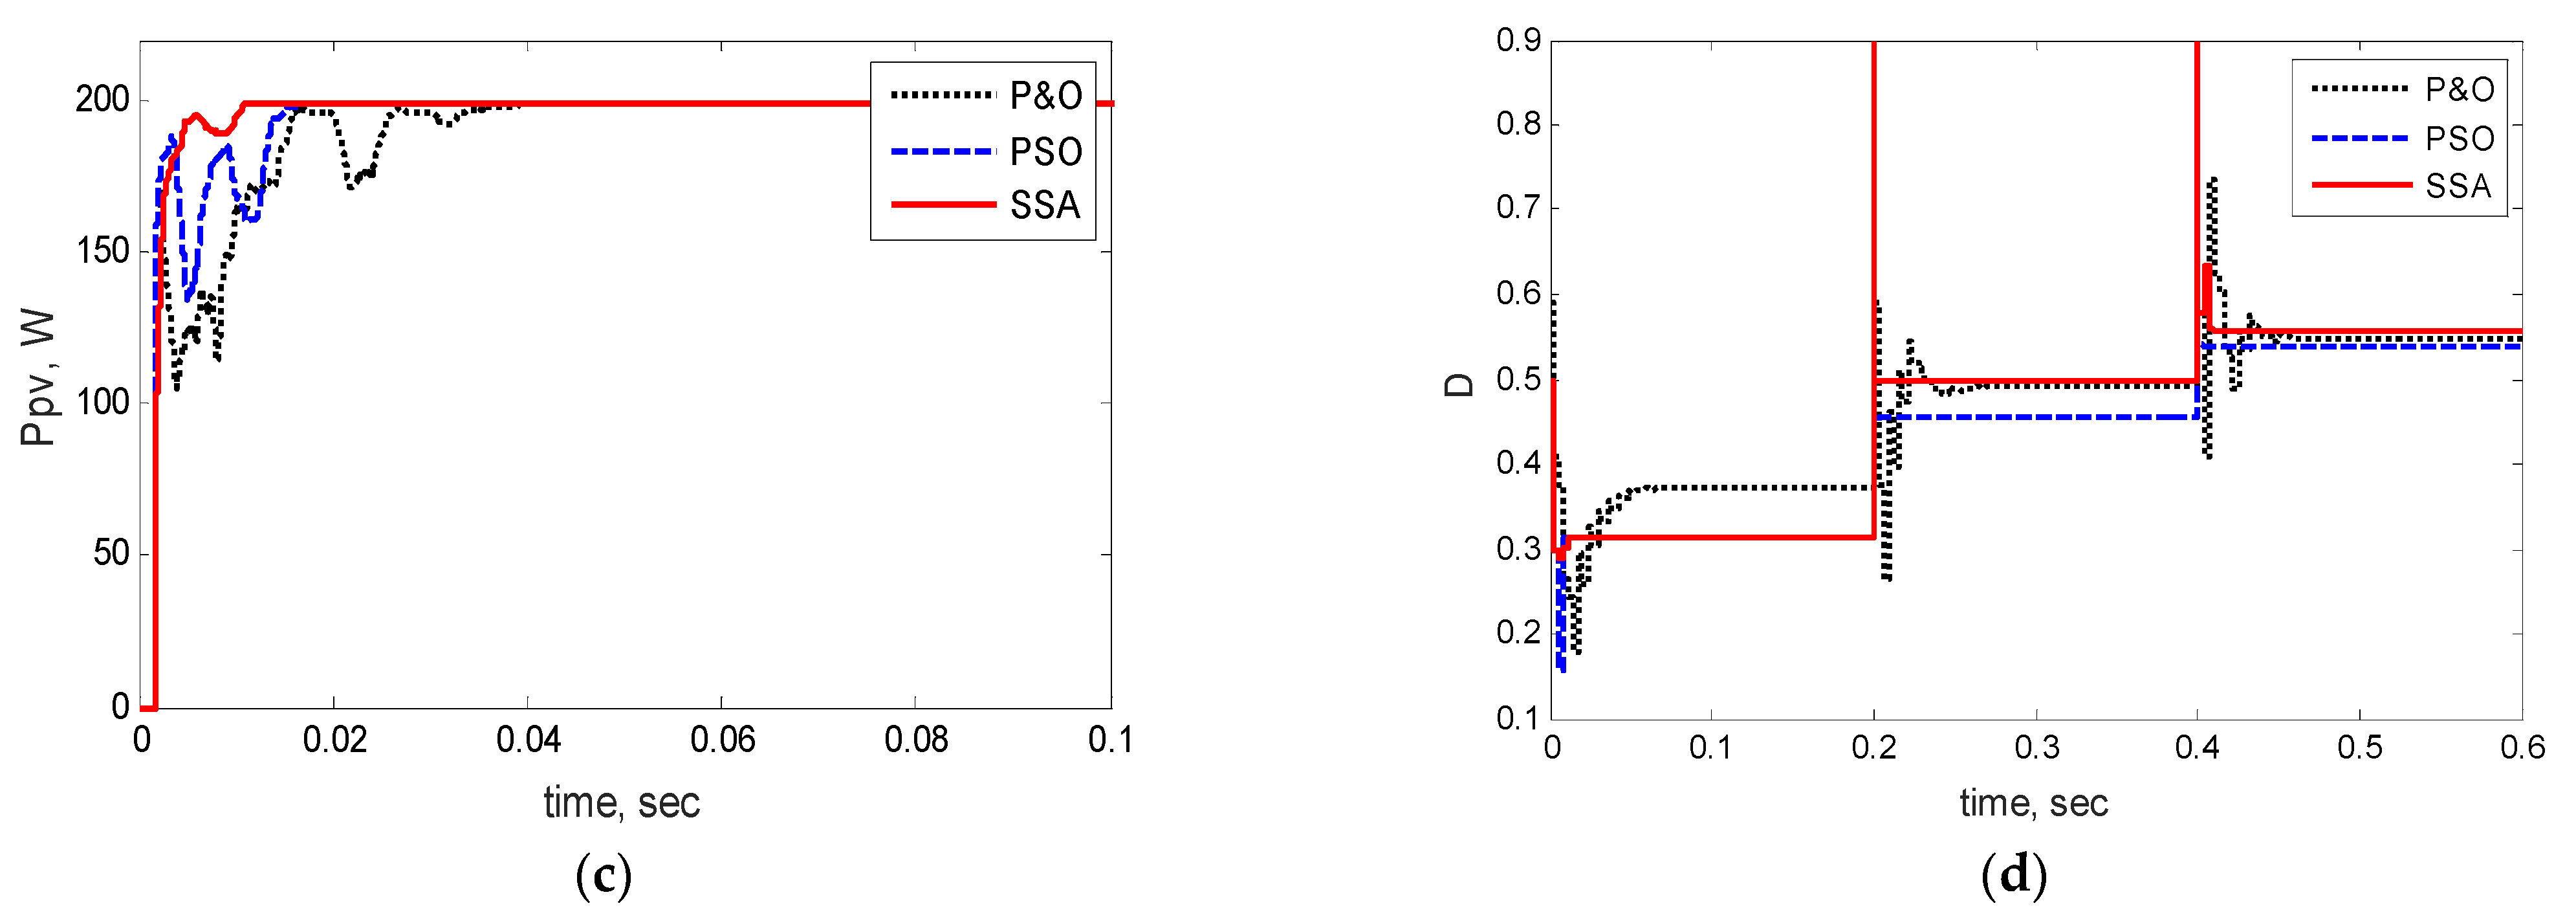
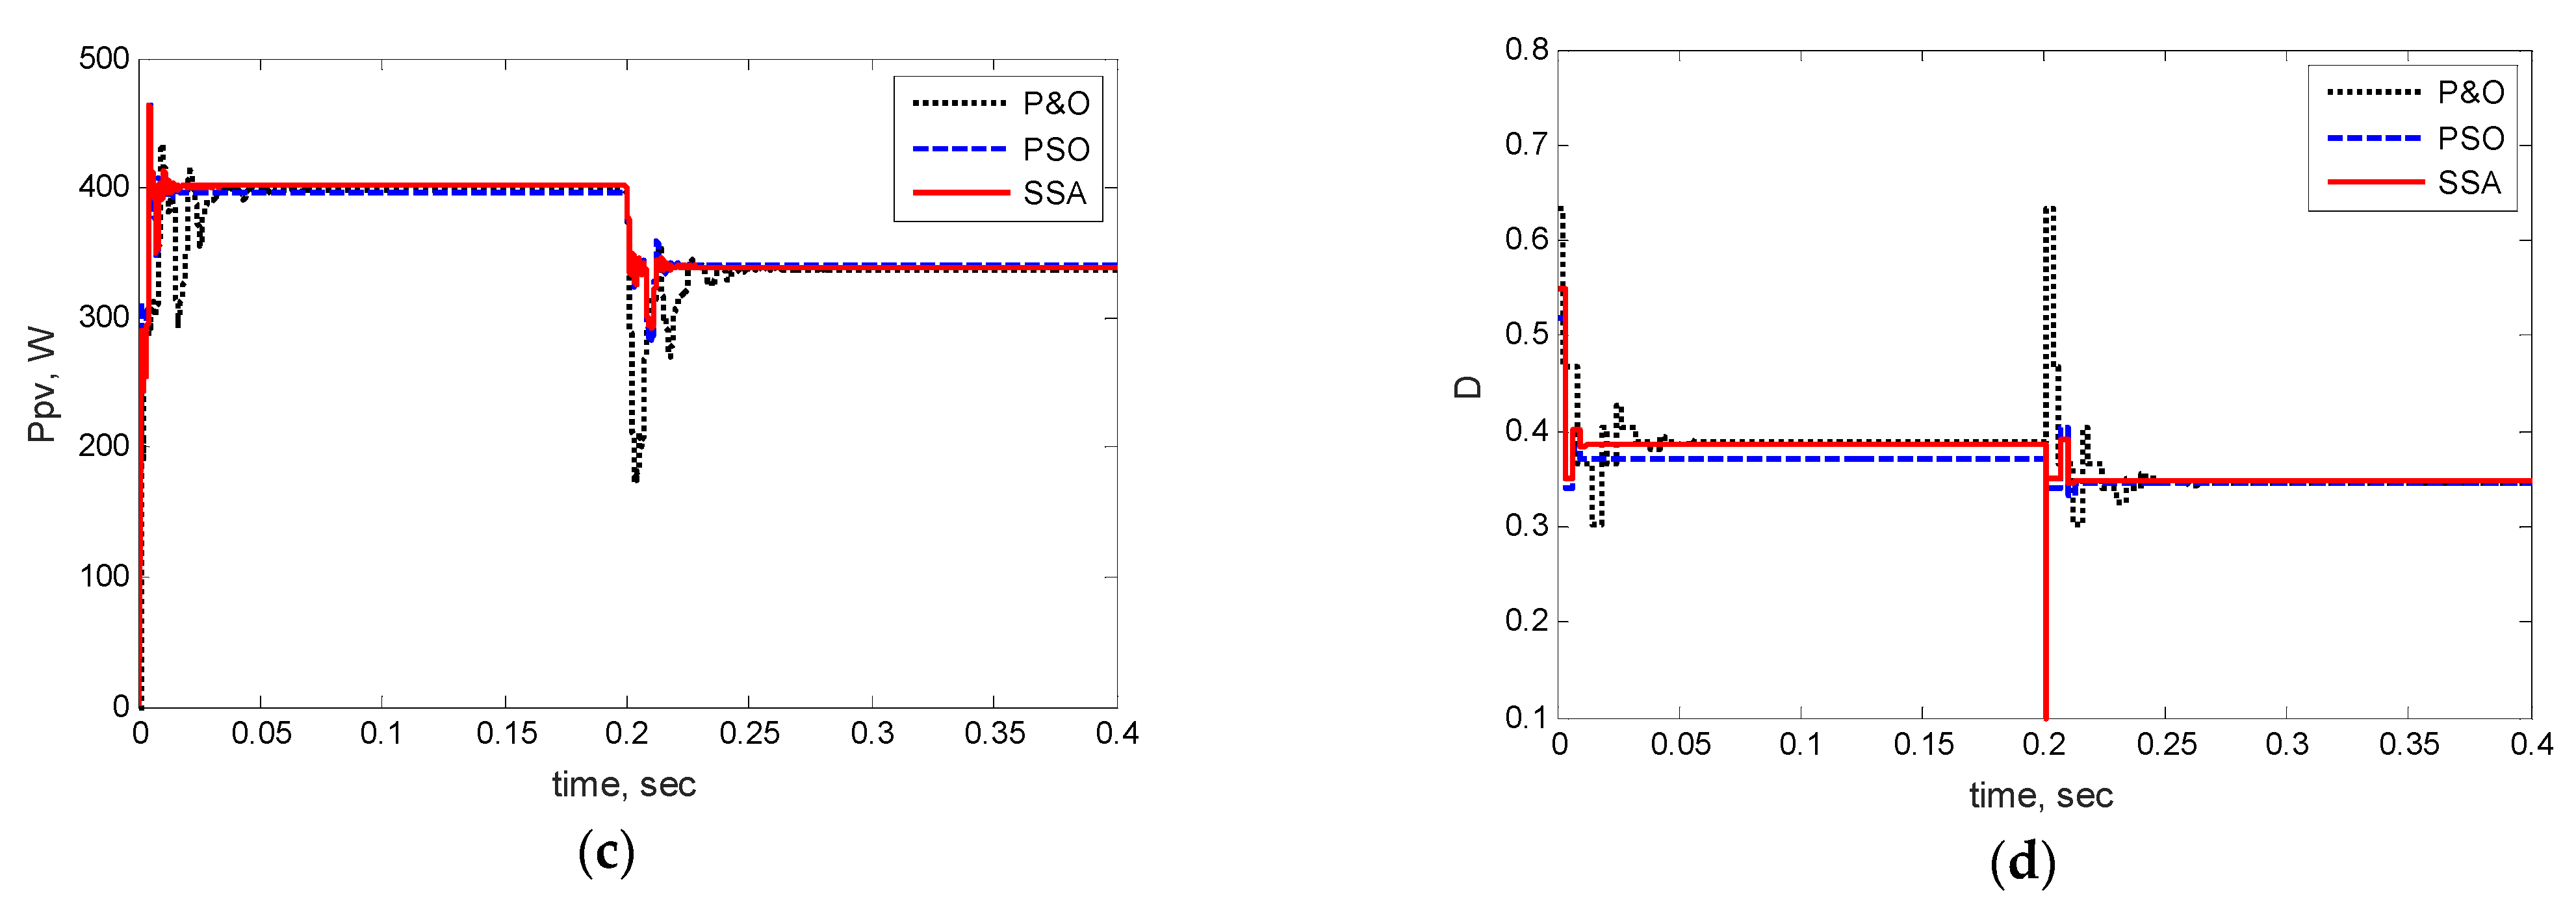
5.2. Simulation Results in Variable Radiation Conditions

We represent the effect of radiation changes on solving the MPPT problem using the proposed method in this section. During the simulation, the temperature is considered constant at T = 25. The radiation changes in 0.2 s so that the initial radiation is equal to 400 W/m2, reaching the value of 800 W/m2 in the period of 0.2 to 0.4 s; finally, its value will be 1000 W/m2 in the period of 0.4 to 0.6 s. The results of solving the MPPT problem using different methods in variable radiation conditions are shown in Figure 8.
Figure 8 reveals that the performance of the SSA method compared to other methods in achieving the maximum power of the photovoltaic system was much higher in terms of convergence speed and accuracy, so few transient fluctuations were observed in the SSA method. Moreover, the results showed that the increase in radiation resulted in a decrease in the voltage and an increase in the current, increasing the PV panel’s output power. Due to this, the proposed method is more responsive to variable radiation conditions than P&O and PSO.

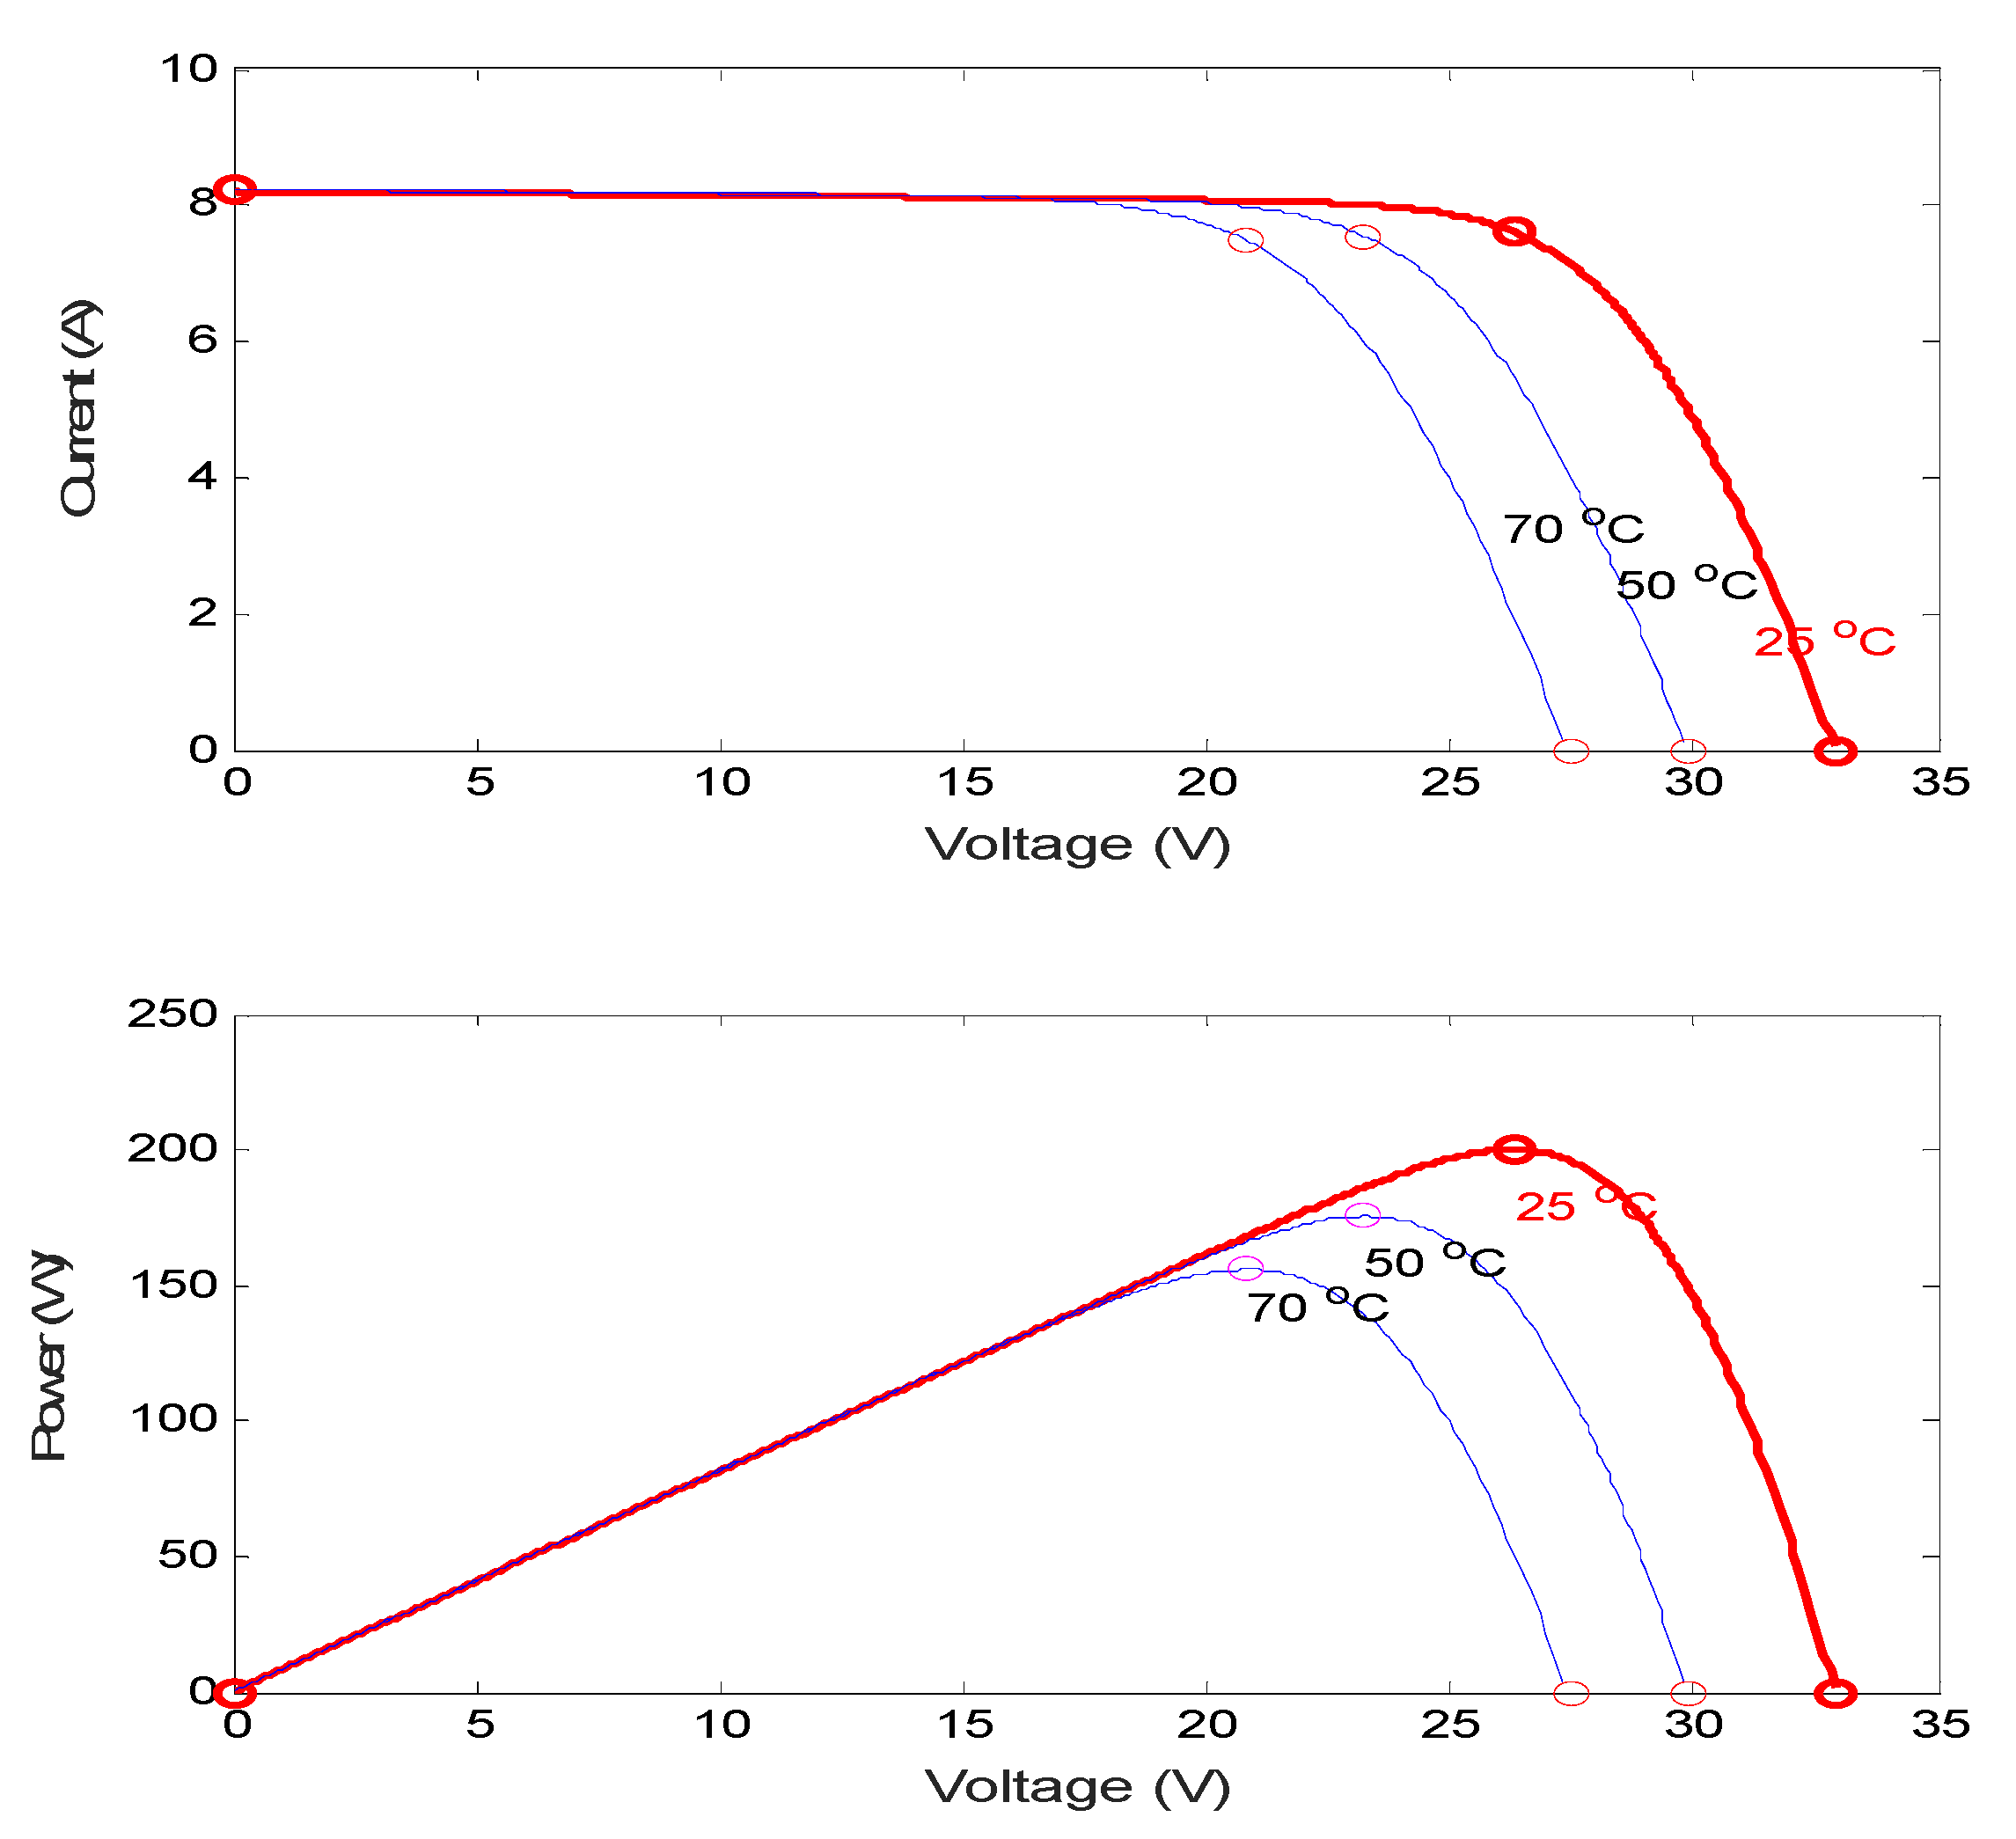
5.3. Simulation Results in Variable Temperature Conditions

This section evaluates the effect of change in temperature on applying the proposed method to the MPPT problem. Here, the radiation intensity is considered constant at 1000 W/m2. The temperature changes occur in steps of 0.2 s, with each step’s values being 25, 50, and 70. Figure 9 displays the outcomes of the techniques employed to resolve the MPPT issue under changing temperature settings. This figure represents SSA performance in comparison with other methods. The results show that the increase in temperature lowers the panel’s voltage level and, therefore, reduces the solar panel output power. In addition, the SSA method has fewer transient fluctuations in solving the MPPT problem and converges at a higher speed than other methods.

5.4. Simulation Results in Shade Pattern Conditions 1

In this section, the performance of the proposed method in partially shaded conditions is investigated. In this way, two photovoltaic panels are connected in series. Considering that in standard conditions, the peak power is 400 W, and in shadow conditions, the maximum peak power is 340 W, first, the photovoltaic panels work under STC conditions; then, partial shading occurs in 0.2 s and the radiation of a panel is reduced from 1000 to 800 W/m2. Figure 10 shows the simulation results of a photovoltaic system using the SSA algorithm and P&O and PSO methods. With uniform radiation and standard temperature, the photovoltaic array produced 398.9 W in a time interval of 0 to 0.2 s. At t = 0.2, one of the panels receives a radiation amount of 800 W/m2, which causes the photovoltaic array to be partially shaded; in this case, the P–V characteristic of the photovoltaic has two peaks, and the General MPPT (GMPP) is equal to 340 W. The results showed that the SSA algorithm quickly converged to the appropriate voltage, which led to the MPP of 339.5 W in shaded conditions, taking into account the losses of the switches. In this situation, all the algorithms have reached the MPP, and the important difference between them is their speed of convergence and reaching the MPP point, of which the performance of the SSA method is better.

5.5. Simulation Results in Shade Pattern Conditions 2

We linked two solar panels in series to simulate the effect of partial shade conditions on our method. To this end, one of the photovoltaic panels has a radiation of 800 W/m2 and the other has a radiation of 1000 W/m2, and the temperature is considered stable at 25 °C. The simulation results obtained from the second shading arrangement are shown in Figure 11. As can be seen, the MPPT based on the SSA algorithm does not get caught in the local maximum power point (LMPP) and meet the GMPP accurately. The response provided by the SSA approach, as can be observed, has fewer power variations and achieves a steady state more quickly. The proposed, P&O, and PSO methods converge in 0.02, 0.034, and 0.043 s, respectively. Therefore, in the condition of partial shade 2, as in other simulations, the performance of the SSA method was better than the P&O and PSO methods, confirming the superiority of the proposed method.

5.6. Uncertainty Results

To evaluate the performance of the proposed algorithm for Section 5.2, we consider the load change. We changed the load value from 1 Ohm to 1.7 Ohm. As can be seen, the proposed algorithm has a better result when keeping the radiation intensity and the temperature constant and when changing the load (Figure 12).
As we applied the load changes for Section 5.2, we tested the uncertainty by applying a fault to the system at 0.3 s. As shown, the proposed algorithm provides improved results in stability at the fault time (Figure 13).
Using the four criteria mentioned in Equations (10) to (13), a comparison was made between the step response of these four criteria and the proposed method, which shows the result of the SSA method (Figure 14 and Figure 15) [35,36,37].

6. Conclusions

In this article, a new approach for solving the MPPT problem in photovoltaic systems under standard and partially shaded conditions based on the SSA algorithm is presented. In order to evaluate the performance of the proposed method, the MPPT problem was also performed with P&O and PSO methods, and the results were compared. The proposed method had advantages such as high convergence speed and efficiency with high convergence accuracy in low repetitions compared to the other methods.
In the first stage, the standard mode was considered. The value of peak power in standard conditions was equal to 200.143 w, and the steady-state value of PV power was 198.9 w in each of the methods. In this case, the SSA algorithm had better results than the other methods in terms of convergence. In the second and third stages, changes in radiation and temperature were considered. The SSA method had fewer transient fluctuations in solving the MPPT problem. In the following stages, shadow conditions were applied to the model. Two photovoltaic modules were connected in series. In standard conditions, the peak power was 400 w, and in shadow conditions, the maximum peak power was 340 w.
The results of the proposed SSA method were compared to other methods, and the simulation results show that the proposed algorithm has a higher convergence rate and less error in calculations than the other methods. The results indicate the superiority of the SSA method in achieving a higher convergence speed than other methods.

Author Contributions

Conceptualization, L.T. and S.M.; methodology, F.Z.; software, L.T.; validation, F.Z., J.Y. and N.S.; investigation, L.T., S.M. and F.Z.; resources, J.Y.; data curation, L.T.; writing—original draft preparation, L.T., S.M. and F.Z.; writing—review and editing, L.T., S.M. and F.Z.; visualization, N.S.; supervision, J.Y.; project administration, J.Y.; funding acquisition, J.Y. All authors have read and agreed to the published version of the manuscript.

Funding

This work was supported in part by the National Research Foundation of Korea (NRF) grant funded by the Korea government (MSIT) (NRF-2021R1F1A1063640).

Data Availability Statement

The data used in this study are reported in the paper’s figures and tables.

Conflicts of Interest

The authors declare no conflict of interest.

References

  1. Li, G.; Li, J.; Yang, R.; Chen, X. Performance analysis of a hybrid hydrogen production system in the integrations of PV/T power generation electrolytic water and photothermal cooperative reaction. Appl. Energy 2022, 323, 119625. [Google Scholar] [CrossRef]
  2. Bollipo, R.B.; Mikkili, S.; Bonthagorla, P.K. Hybrid, optimal, intelligent and classical PV MPPT techniques: A review. CSEE J. Power Energy Syst. 2021, 7, 2720. [Google Scholar] [CrossRef]
  3. González-Castaño, C.; Restrepo, C.; Revelo-Fuelagán, J.; Lorente-Leyva, L.L.; Peluffo-Ordóñez, D.H. A Fast-Tracking Hybrid MPPT Based on Surface-Based Polynomial Fitting and P&O Methods for Solar PV under Partial Shaded Conditions. Mathematics 2021, 9, 2732. [Google Scholar] [CrossRef]
  4. Wang, R.; Hasanefendic, S.; Von Hauff, E.; Bossink, B. The cost of photovoltaics: Re-evaluating grid parity for PV systems in China. Renew. Energy 2022, 194, 101. [Google Scholar] [CrossRef]
  5. Wang, H. The Optimal Allocation and Operation of an Energy Storage System with High Penetration Grid-Connected Photovoltaic Systems. Sustainability 2020, 12, 6154. [Google Scholar] [CrossRef]
  6. Sangwongwanich, A.; Blaabjerg, F. Mitigation of Interharmonics in PV Systems with Maximum Power Point Tracking Modification. IEEE Trans. Power Electron. 2019, 34, 2880. [Google Scholar] [CrossRef] [Green Version]
  7. Deepak, V. Maximum power point tracking (MPPT) techniques: Recapitulation in solar photovoltaic systems. Renew. Sustain. Energy Rev. 2016, 54, 68. [Google Scholar] [CrossRef]
  8. Zhou, B.; Pei, J.; Calautit, J.K.; Zhang, J.; Yong, L.X.; Pantua, C.A.J. Analysis of mechanical response and energy efficiency of a pavement integrated photovoltaic/thermal system (PIPVT). Renew. Energy 2022, 194, 90. [Google Scholar] [CrossRef]
  9. Mi, P. Study on energy efficiency and economic performance of district heating system of energy saving reconstruction with photovoltaic thermal heat pump. Energy Convers. Manag. 2021, 247, 114677. [Google Scholar] [CrossRef]
  10. Ali, K.; Khan, L.; Khan, Q.; Ullah, S.; Ahmad, S.; Mumtaz, S.; Karam, F.W. Robust Integral Backstepping Based Nonlinear MPPT Control for a PV System. Energies 2019, 12, 3180. [Google Scholar] [CrossRef]
  11. Bisht, R.; Sikander, A. An improved method based on fuzzy logic with beta parameter for PV MPPT system. Optik 2022, 259, 168939. [Google Scholar] [CrossRef]
  12. Vavilapalli, S.; Umashankar, S.; Sanjeevikumar, P.; Fedák, V.; Mihet-Popa, L.; Ramachandaramurthy, V.K. A Buck-Chopper Based Energy Storage System for the Cascaded H-Bridge Inverters in PV Applications. Energy Procedia 2018, 145, 78. [Google Scholar] [CrossRef]
  13. Sundareswaran, K.; Vigneshkumar, V.; Sankar, P.; Simon, S.P.; Nayak, P.S.R.; Palani, S. Development of an Improved P&O Algorithm Assisted Through a Colony of Foraging Ants for MPPT in PV System. IEEE Trans. Ind. Inform. 2016, 12, 2502428. [Google Scholar] [CrossRef]
  14. Liu, Y.; Liu, X.; Shi, D.; Zhang, Y.; Wu, Q.; Zhu, Z.; Lin, X. An MPPT Approach Using Improved Hill Climbing and Double Closed Loop Control. In Proceedings of the 2019 IEEE 46th Photovoltaic Specialists Conference (PVSC), Chicago, IL, USA, 16–21 June 2019. [Google Scholar] [CrossRef]
  15. Zou, Y.; Yu, Y.; Zhang, Y.; Lu, J. MPPT Control for PV Generation System Based on an Improved Inccond Algorithm. Procedia Eng. 2012, 29, 677. [Google Scholar] [CrossRef] [Green Version]
  16. Kimball, J.W.; Krein, P.T. Discrete-Time Ripple Correlation Control for Maximum Power Point Tracking. IEEE Trans. Power Electron. 2008, 23, 2001913. [Google Scholar] [CrossRef]
  17. Husain, M.A.; Tariq, A.; Hameed, S.; Arif, M.S.B.; Jain, A. Comparative assessment of maximum power point tracking procedures for photovoltaic systems. Green Energy Environ. 2017, 2, 1. [Google Scholar] [CrossRef]
  18. Montecucco, A.; Knox, A.R. Maximum Power Point Tracking Converter Based on the Open-Circuit Voltage Method for Thermoelectric Generators. IEEE Trans. Power Electron. 2015, 30, 231394. [Google Scholar] [CrossRef]
  19. Tightiz, L.; Yang, H. Resilience Microgrid as Power System Integrity Protection Scheme Element With Reinforcement Learning Based Management. IEEE Access 2021, 9, 83963–83975. [Google Scholar] [CrossRef]
  20. Ganjei, N.; Zishan, F.; Alayi, R.; Samadi, H.; Jahangiri, M.; Kumar, R.; Mohammadian, A. Designing and Sensitivity Analysis of an Off-Grid Hybrid Wind-Solar Power Plant with Diesel Generator and Battery Backup for the Rural Area in Iran. J. Eng. 2022, 2022, 4966761. [Google Scholar] [CrossRef]
  21. Abbes, H.; Loukil, K.; Abid, H.; Abid, M.; Toumi, A. Implementation of a Maximum Power Point Tracking fuzzy controller on FPGA circuit for a photovoltaic system. In Proceedings of the 2015 15th International Conference on Intelligent Systems Design and Applications (ISDA), Marrakech, Morocco, 14–16 December 2015. [Google Scholar] [CrossRef]
  22. Ali, M.N.; Mahmoud, K.; Lehtonen, M.; Darwish, M.M. Promising MPPT methods combining metaheuristic, fuzzy-logic and ANN techniques for grid-connected photovoltaic. Sensors 2021, 21, 1244. [Google Scholar] [CrossRef]
  23. Priyadarshi, N.; Padmanaban, S.; Holm-Nielsen, J.B.; Blaabjerg, F.; Bhaskar, M.S. An Experimental Estimation of Hybrid ANFIS–PSO-Based MPPT for PV Grid Integration Under Fluctuating Sun Irradiance. IEEE Syst. J. 2020, 14, 1218–1229. [Google Scholar] [CrossRef]
  24. Sarwar, S.; Javed, M.Y.; Jaffery, M.H.; Ashraf, M.S.; Naveed, M.T.; Hafeez, M.A. Modular Level Power Electronics (MLPE) Based Distributed PV System for Partial Shaded Conditions. Energies 2022, 15, 4797. [Google Scholar] [CrossRef]
  25. Mohanty, S.; Subudhi, B.; Ray, P.K. A Grey Wolf-Assisted Perturb & Observe MPPT Algorithm for a PV System. IEEE Trans. Energy Convers. 2017, 32, 340–347. [Google Scholar] [CrossRef]
  26. Badis, A.; Mansouri, M.N.; Boujmil, M.H. A genetic algorithm optimized MPPT controller for a PV system with DC-DC boost converter. In Proceedings of the 2017 International Conference on Engineering & MIS (ICEMIS), Monastir, Tunisia, 8–10 May 2017; pp. 1–6. [Google Scholar] [CrossRef]
  27. Miyatake, M.; Veerachary, M.; Toriumi, F.; Fujii, N.; Ko, H. Maximum Power Point Tracking of Multiple Photovoltaic Arrays: A PSO Approach. IEEE Trans. Aerosp. Electron. Syst. 2011, 47, 367–380. [Google Scholar] [CrossRef]
  28. Mahmoud, M.F.; Mohamed, A.T.; Swief, R.A.; Said, L.A.; Radwan, A.G. Arithmetic optimization approach for parameters identification of different PV diode models with FOPI-MPPT. Ain. Shams Eng. J. 2022, 13, 7. [Google Scholar] [CrossRef]
  29. Shah, M.L.; Dhaneria, A.; Modi, P.S.; Khambhadiya, H. Fuzzy Logic MPPT for Grid Tie Solar Inverter. In Proceedings of the 2020 IEEE International Conference for Innovation in Technology (INOCON), Bangluru, India, 6–8 November 2020. [Google Scholar] [CrossRef]
  30. Castelli, M.; Manzoni, L.; Mariot, L.; Nobile, M.S.; Tangherloni, A. Salp Swarm Optimization: A critical review. Expert Syst. Appl. 2022, 189, 116029. [Google Scholar] [CrossRef]
  31. Abualigah, L.; Shehab, M.; Alshinwan, M.; Alabool, H. Salp swarm algorithm: A comprehensive survey. Neural Comput. Appl. 2020, 32, 11195–11215. [Google Scholar] [CrossRef]
  32. Sahib, M.A.; Ahmed, B.S. A new multiobjective performance criterion used in PID tuning optimization algorithms. J. Adv. Res. 2016, 7, 125–134. [Google Scholar] [CrossRef] [PubMed] [Green Version]
  33. Soufyane Benyoucef, A.; Chouder, A.; Kara, K.; Silvestre, S. Artificial bee colony based algorithm for maximum power point tracking (MPPT) for PV systems operating under partial shaded conditions. Appl. Soft Comput. 2015, 32, 47. [Google Scholar] [CrossRef] [Green Version]
  34. Kheldoun, A.B.R.B.; Bradai, R.; Boukenoui, R.; Mellit, A. A new Golden Section method-based maximum power point tracking algorithm for photovoltaic systems. Energy Convers. Manag. 2016, 111, 39. [Google Scholar] [CrossRef]
  35. Ali, K.; Khan, Q.; Ullah, S.; Khan, I.; Khan, L. Nonlinear robust integral backstopping based MPPT control for stand-alone photovoltaic system. PLoS ONE 2020, 15, e0231749. [Google Scholar] [CrossRef]
  36. Ali, K.; Khan, L.; Khan, Q.; Ullah, S.; Ali, N. Neurofuzzy robust backstepping based MPPT control for photovoltaic system. Turk. J. Electr. Eng. Comput. Sci. 2021, 29, 27. [Google Scholar] [CrossRef]
  37. Khan, R.; Khan, L.; Ullah, S.; Sami, I.; Ro, J.-S. Backstepping Based Super-Twisting Sliding Mode MPPT Control with Differential Flatness Oriented Observer Design for Photovoltaic System. Electronics 2020, 9, 1543. [Google Scholar] [CrossRef]
Figure 1. Equivalent model of series and parallel connected solar cells.
Energies 15 08210 g001
Figure 2. (a) Controller model; (b) P–V curve.
Energies 15 08210 g002
Figure 3. Single Salp   (a); a group of Salps (b) [31].
Energies 15 08210 g003
Figure 4. Pseudocode of SSA algorithm.
Energies 15 08210 g004
Figure 5. Block diagram for MPPT based on SSA method.
Energies 15 08210 g005
Figure 6. I–V and P–V characteristics of the photovoltaic module.
Energies 15 08210 g006
Figure 7. Photovoltaic panel tracking curves using the proposed method and P&O and PSO methods in STC conditions: (a) Vpv, (b) Ipv, (c) Ppv, (d) duty cycle.
Energies 15 08210 g007
Figure 8. Photovoltaic panel tracking curves using the proposed method and P&O and PSO methods in variable radiation conditions: (a) Vpv, (b) Ipv, (c) Ppv, (d) duty cycle.
Energies 15 08210 g008aEnergies 15 08210 g008b
Figure 9. Photovoltaic panel tracking curves using the proposed method and the P&O and PSO methods in variable temperature conditions: (a) Vpv, (b) Ipv, (c) Ppv, (d) duty cycle.
Energies 15 08210 g009aEnergies 15 08210 g009b
Figure 10. Photovoltaic panel tracking curves using P&O, PSO and SSA methods in the condition of shade pattern 1: (a) Vpv, (b) Ipv, (c) Ppv, (d) duty cycle.
Energies 15 08210 g010aEnergies 15 08210 g010b
Figure 11. Photovoltaic panel tracking curves using P&O, PSO, and SSA methods in the condition of shade pattern 2: (a) Vpv, (b) Ipv, (c) Ppv, (d) duty cycle.
Energies 15 08210 g011aEnergies 15 08210 g011b
Figure 12. Load change from 1 Ohm to 1.7 Ohm, holding radiation intensity and temperature steady. (a) Vpv, (b) Ipv, (c) Ppv, (d) duty cycle.
Energies 15 08210 g012
Figure 13. PV array output: (a) Vpv, (b) Ipv, (c) Ppv, (d) duty cycle (under the applied fault and confirming the proposed method during the uncertainty).
Energies 15 08210 g013
Figure 14. Simulink model and testing the results of ISE, IAE, ITAE, ITSE, and SSA.
Energies 15 08210 g014
Figure 15. A comparison between unit-step response with four criteria and the proposed method.
Energies 15 08210 g015
Table 1. Photovoltaic module parameters [33,34].
ParameterValue
Pmax200 W
Voc32.9 V
Vmax26.3 V
Isc8.21 Ω
Imax7.61 A
Table 2. Boost converter parameters [33,34].
ParameterValue
Switching frequency (fs)50 kHz
Capacitor (C)470 μF
Inductor (L) 1/812 mH
Load1 Ω
Internal resistance of the inductor (rL)0.394 Ω
Publisher’s Note: MDPI stays neutral with regard to jurisdictional claims in published maps and institutional affiliations.

