
Classical and Process Intensification Methods for Acetic Acid Concentration: Technical and Environmental Assessment
Abstract
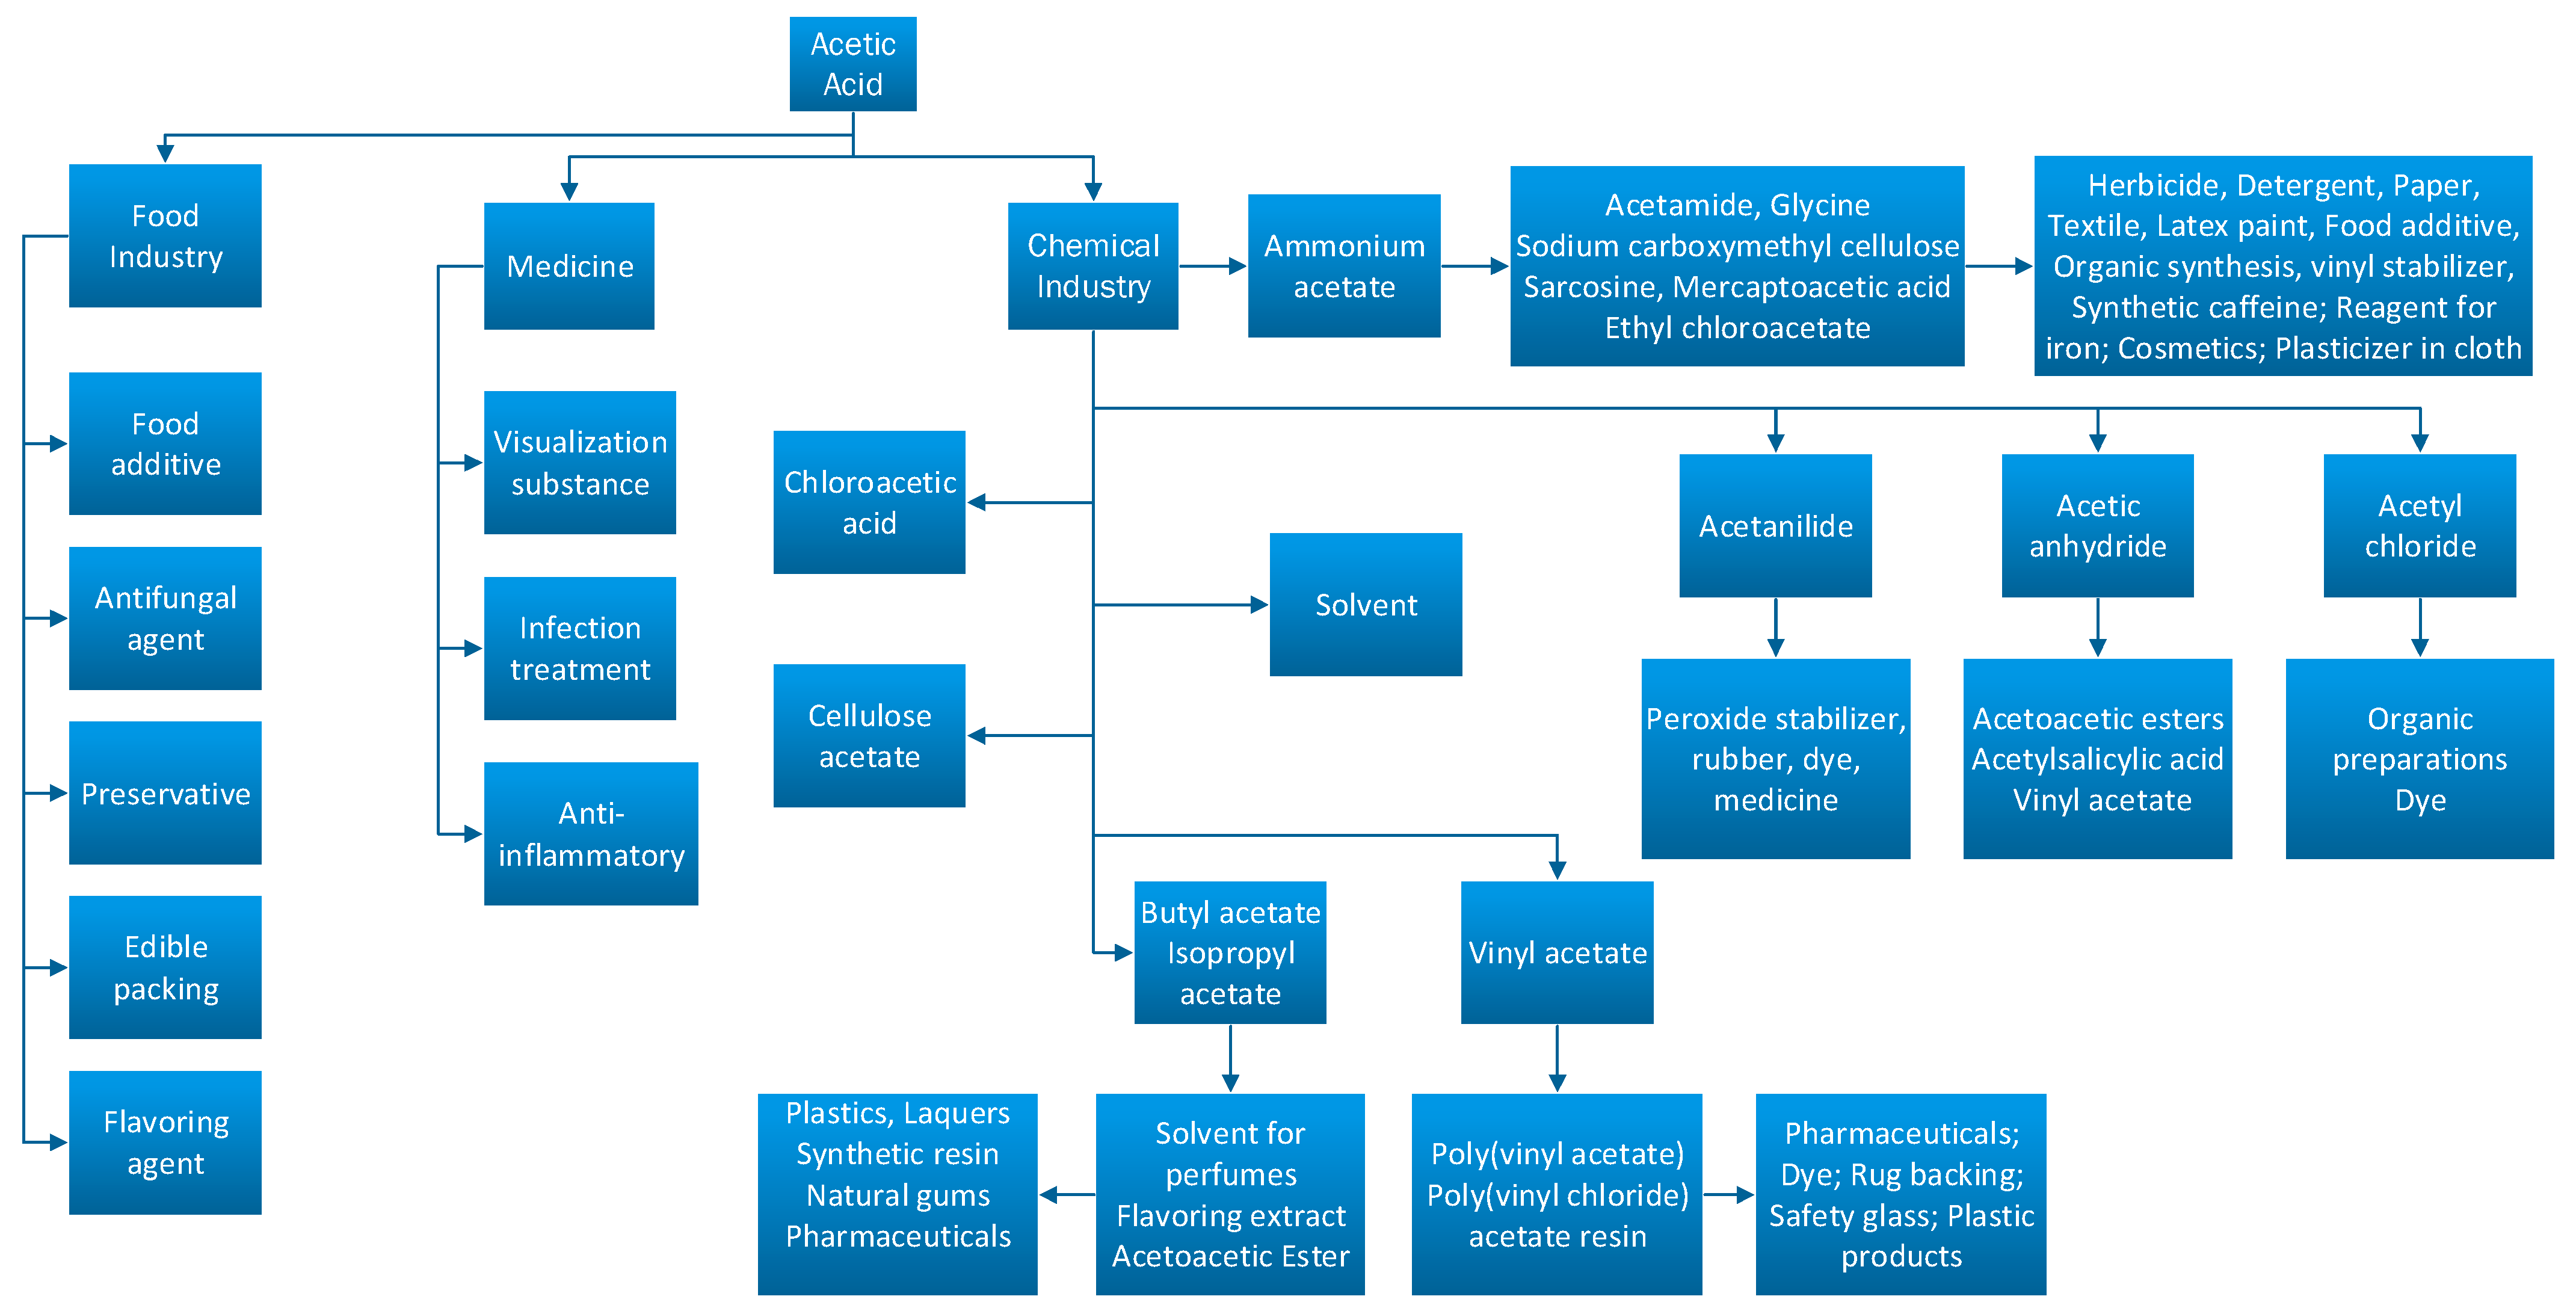
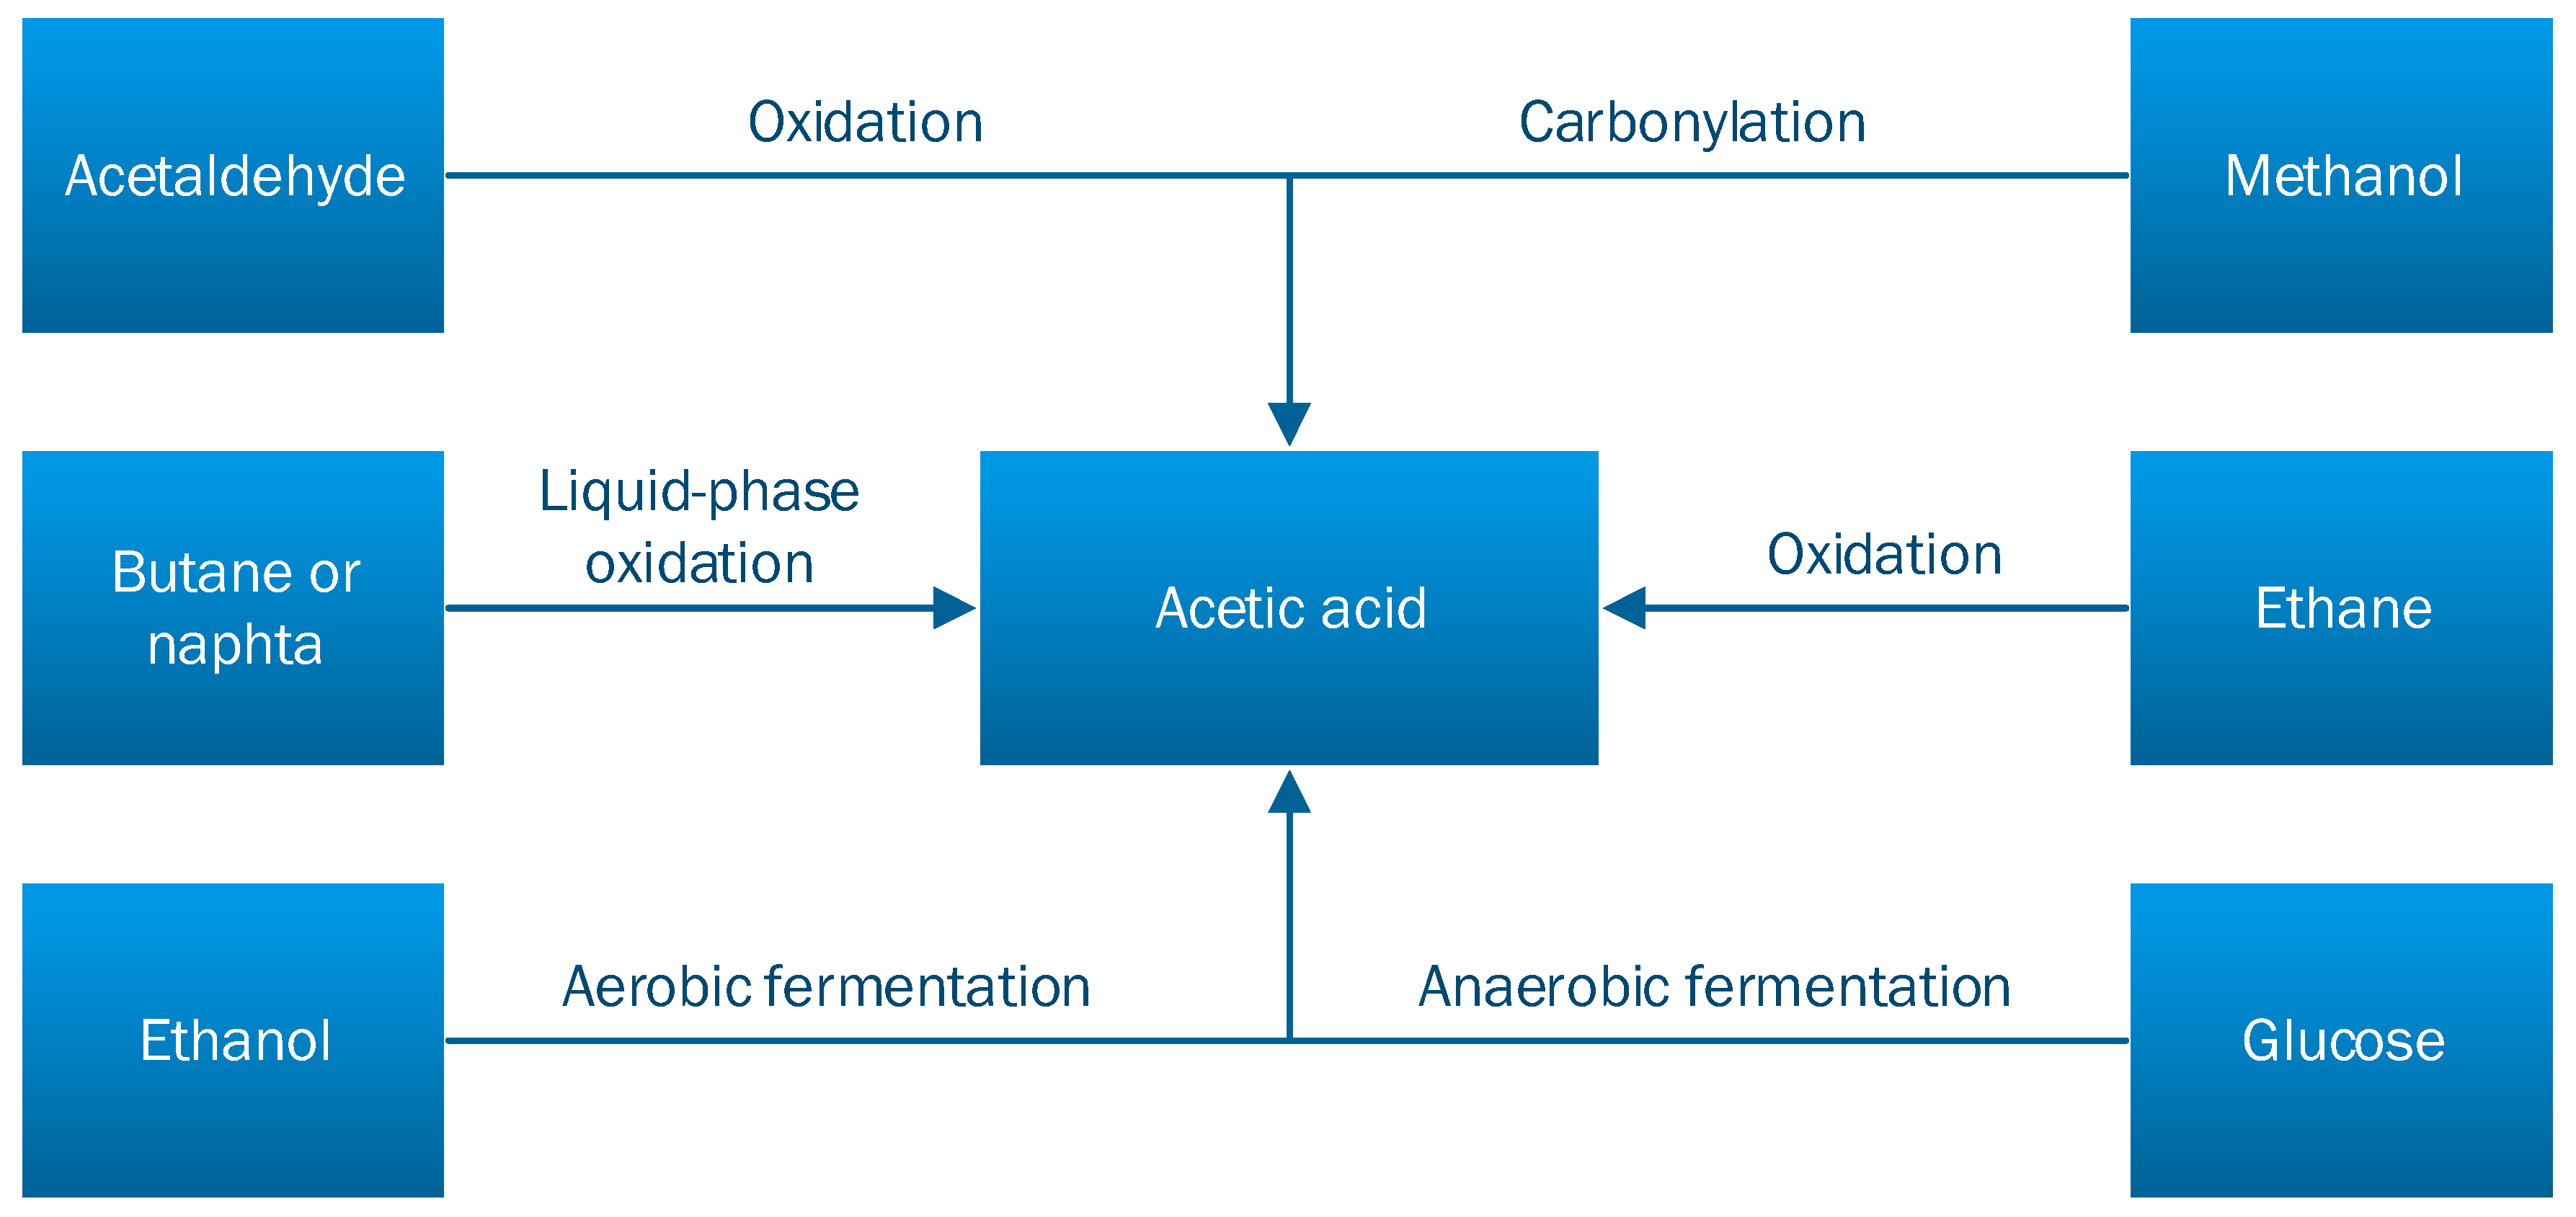
:1. Introduction
2. Material and Methods
- (i)
- Perform the simulations for the various extractants (i.e., ethyl acetate, isopropanol, and an isopropyl acetate—isopropanol mixture);
- (ii)
- Calculate the technical key performance indicators (i.e., acetic acid recovery, acetic acid purity, extractant quantity, power consumption, energy consumption) based on the material and energy balances derived from simulations;
- (iii)
- Screening of the best solvent, from the solvents listed in step (i), based on the results obtained in step (ii);
- (iv)
- Apply process intensification techniques (thermally coupling and double effect distillation) for the solvent with the best technical key performance indicators (solvent decided in step (iii));
- (v)
- Perform the environmental evaluation, using a cradle-to-gate LCA, on the cases decided on step (iv);
- (vi)
- Investigate, from environmental point of view, different scenarios for various steam generation sources (i.e., hard coal, heavy fuel oil, light fuel oil, natural gas and biomass);
- (vii)
- Discuss the obtained results and draw the conclusions.
2.1. Process Modelling and Simulation
- Case 1—Acetic acid concentration using ethyl acetate;
- Case 2—Acetic acid concentration using isopropyl acetate;
- Case 3—Acetic acid concentration using isopropyl acetate and isopropanol mixture;
- Case 4—Acetic acid concentration using isopropyl acetate and isopropanol mixture by TC;
- Case 5—Acetic acid concentration using isopropyl acetate and isopropanol mixture by DED.
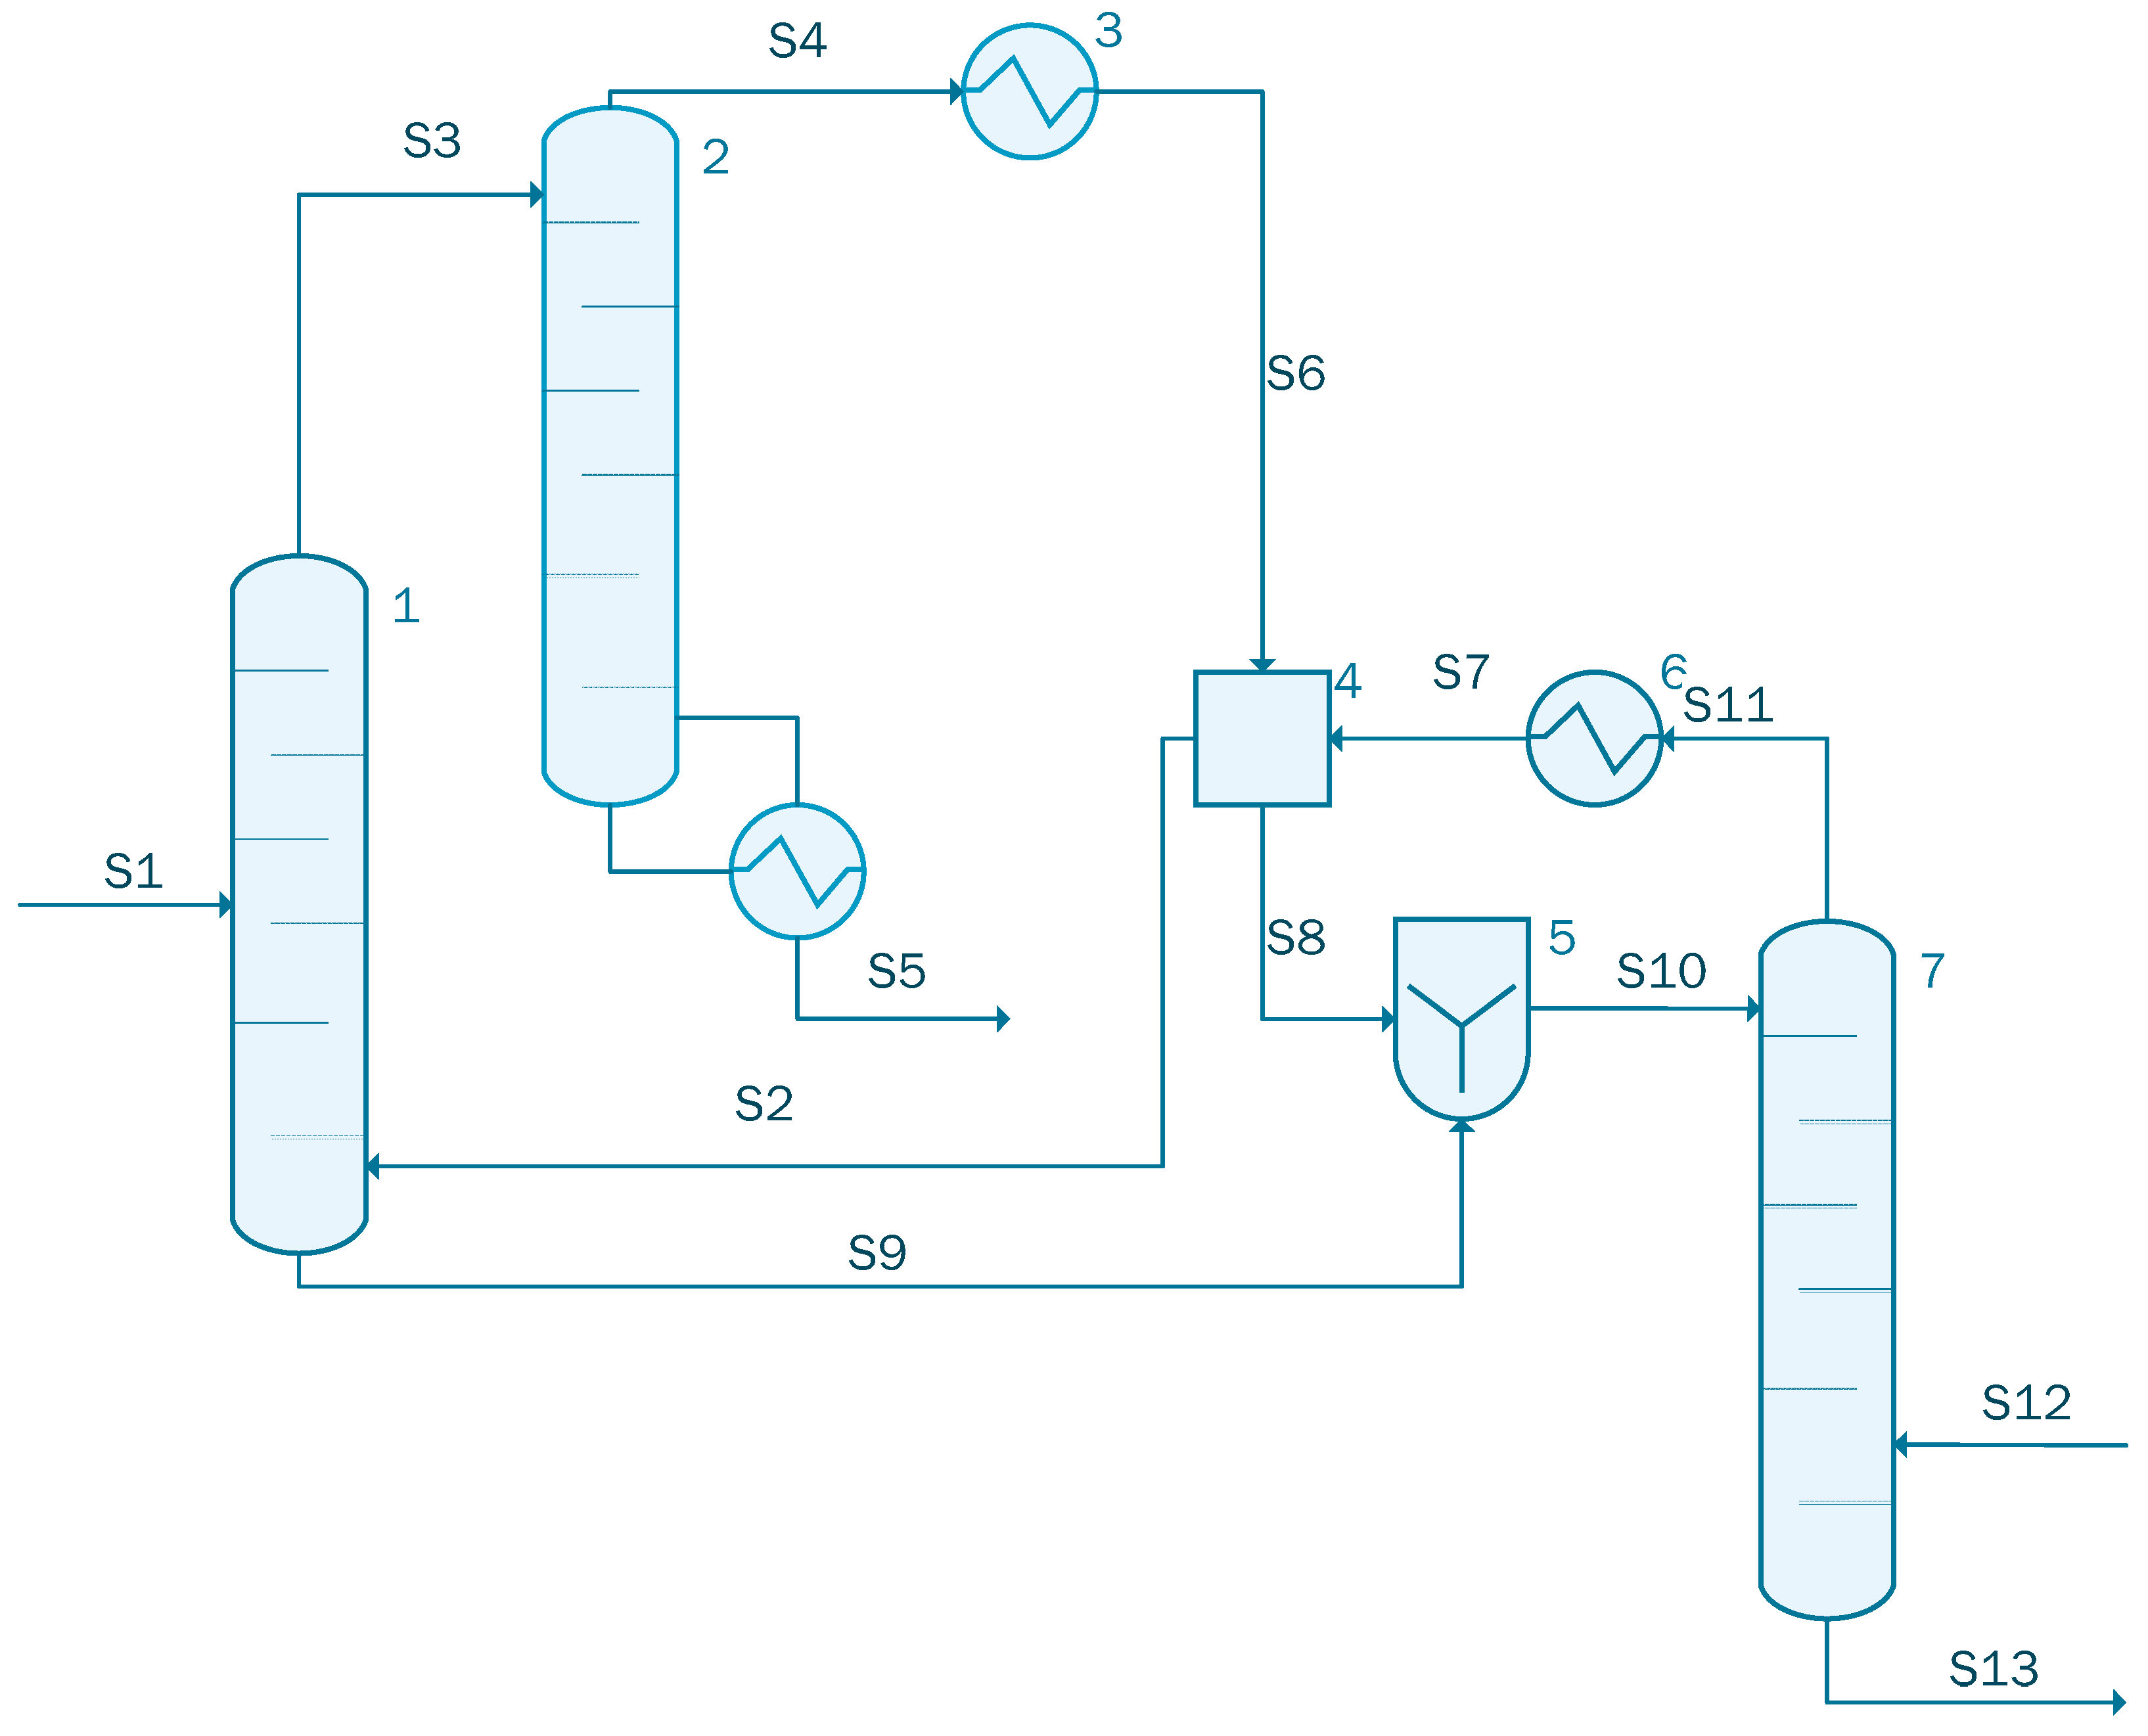
2.1.1. Case 1—Acetic Acid Concentration Using Ethyl Acetate
2.1.2. Case 2—Acetic Acid Concentration Using Isopropyl Acetate
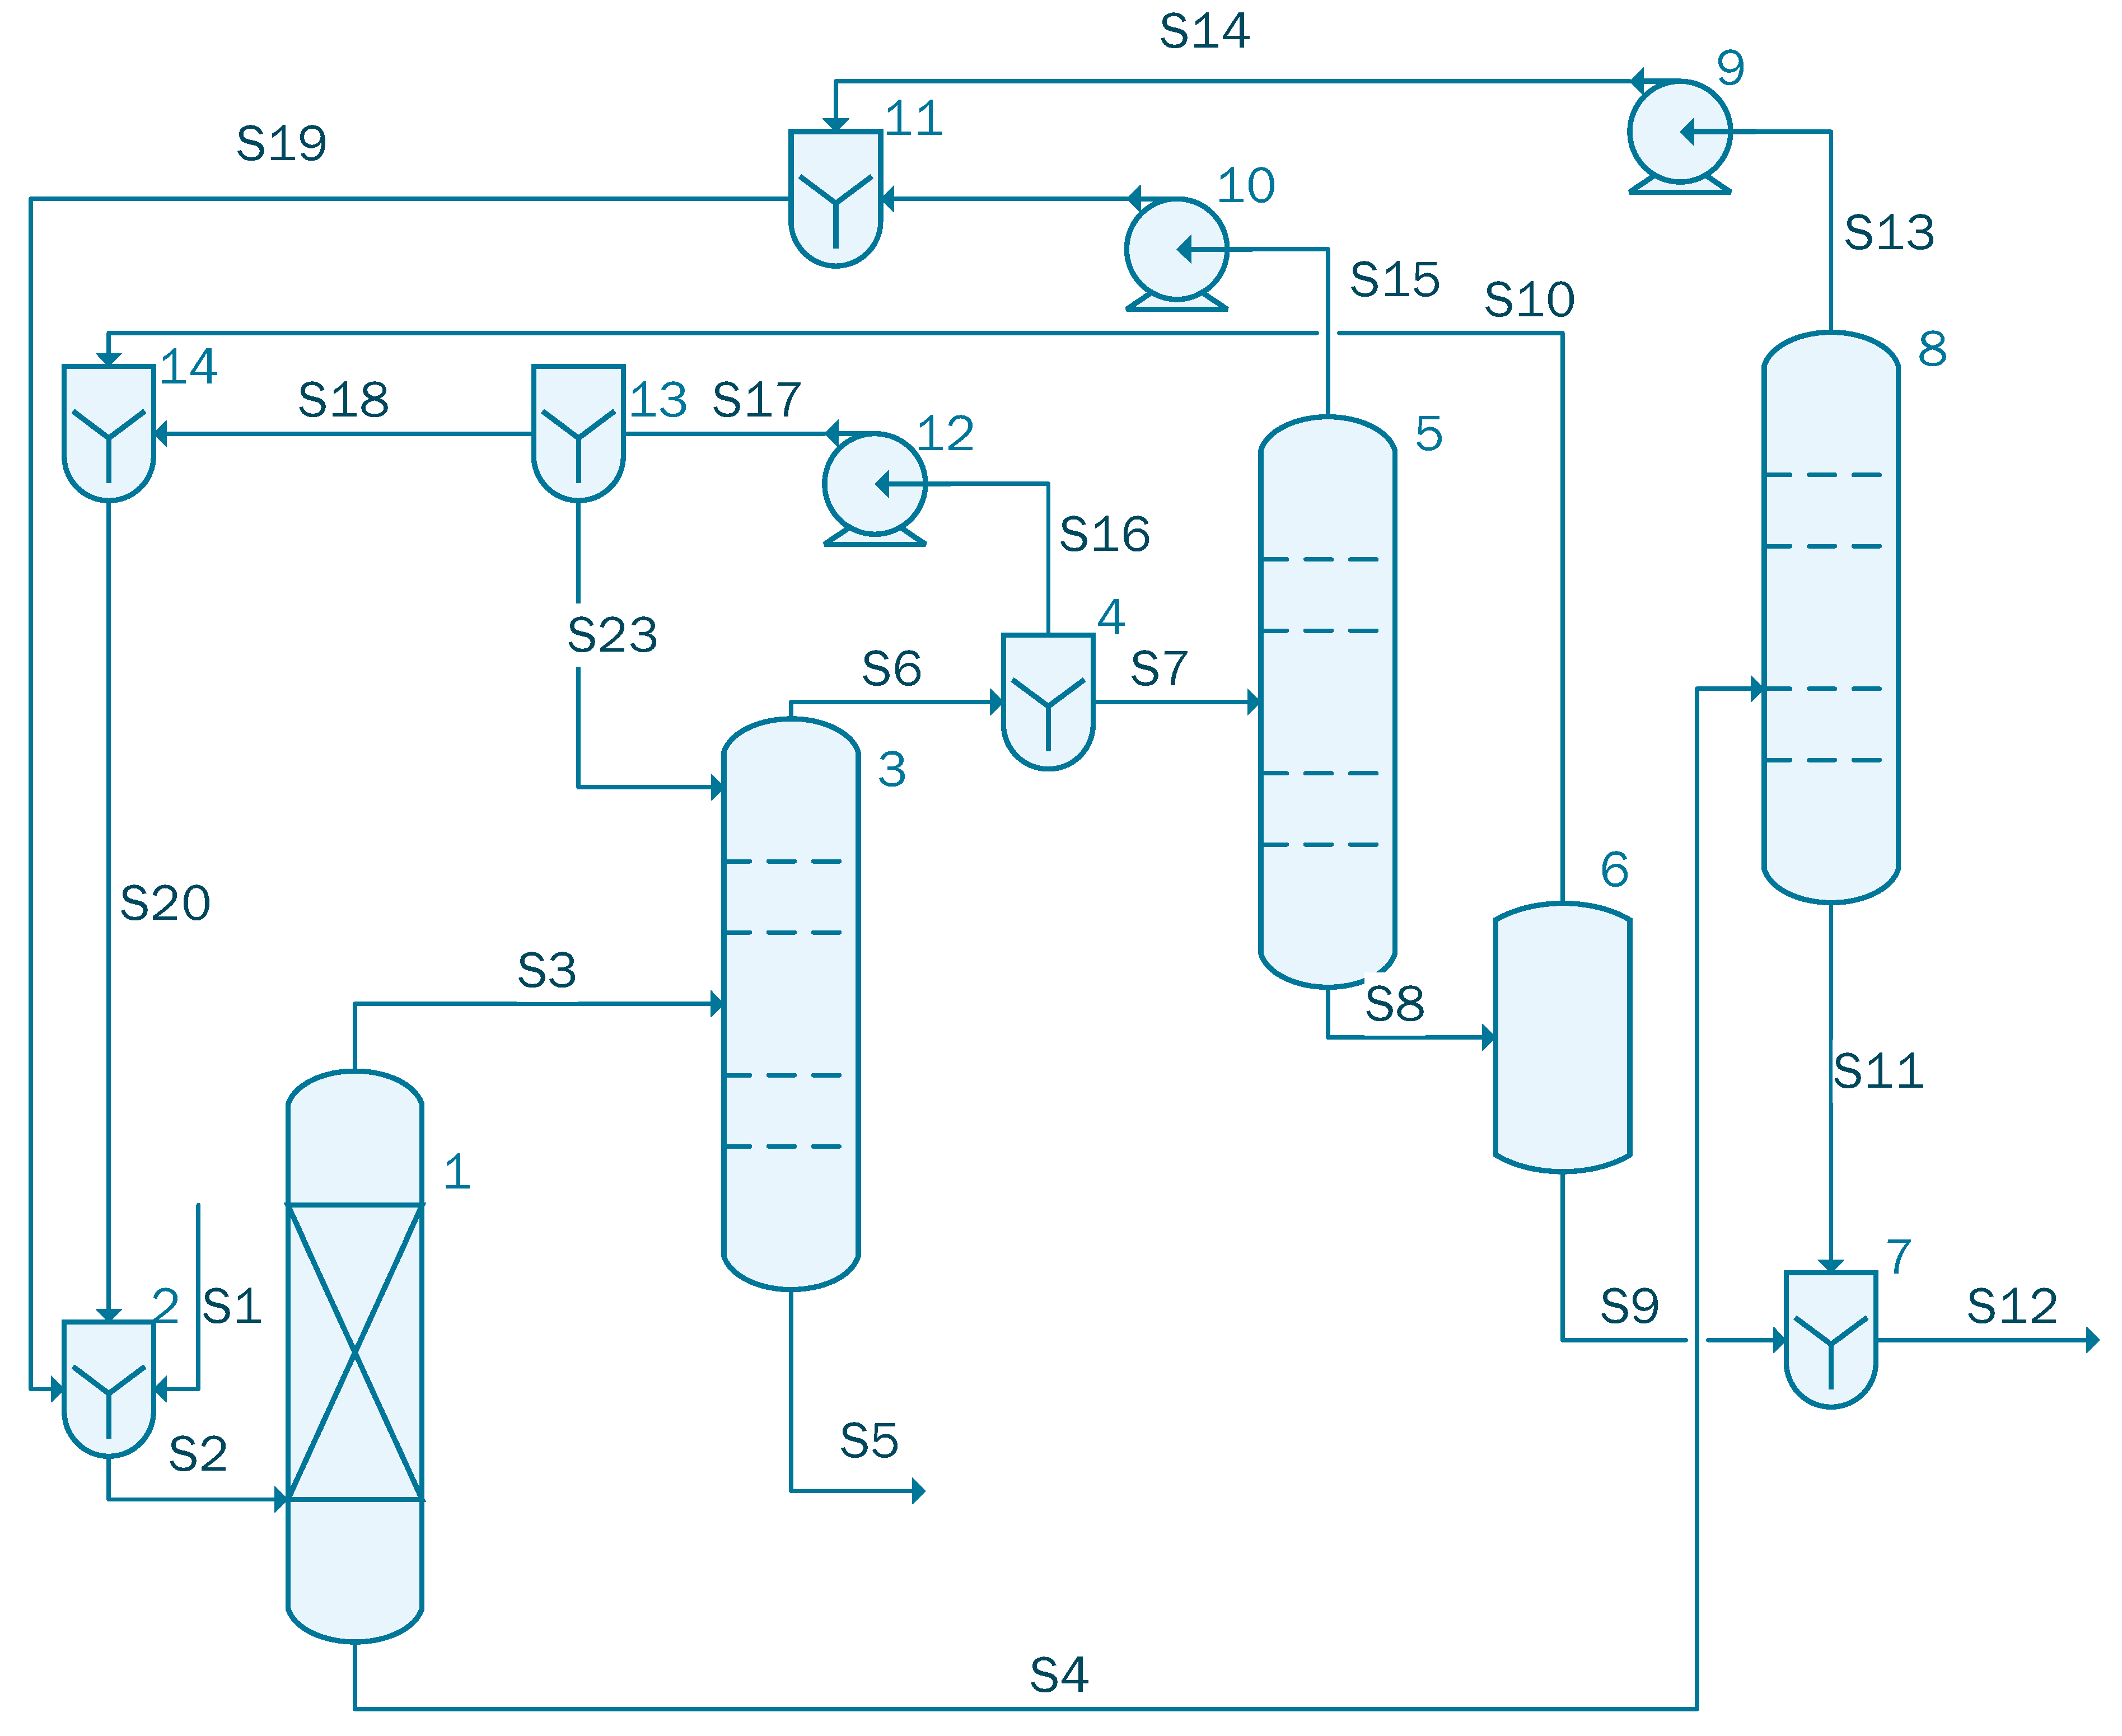
2.1.3. Case 3—Acetic Acid Concentration Using Isopropyl Acetate and Isopropanol Mixture
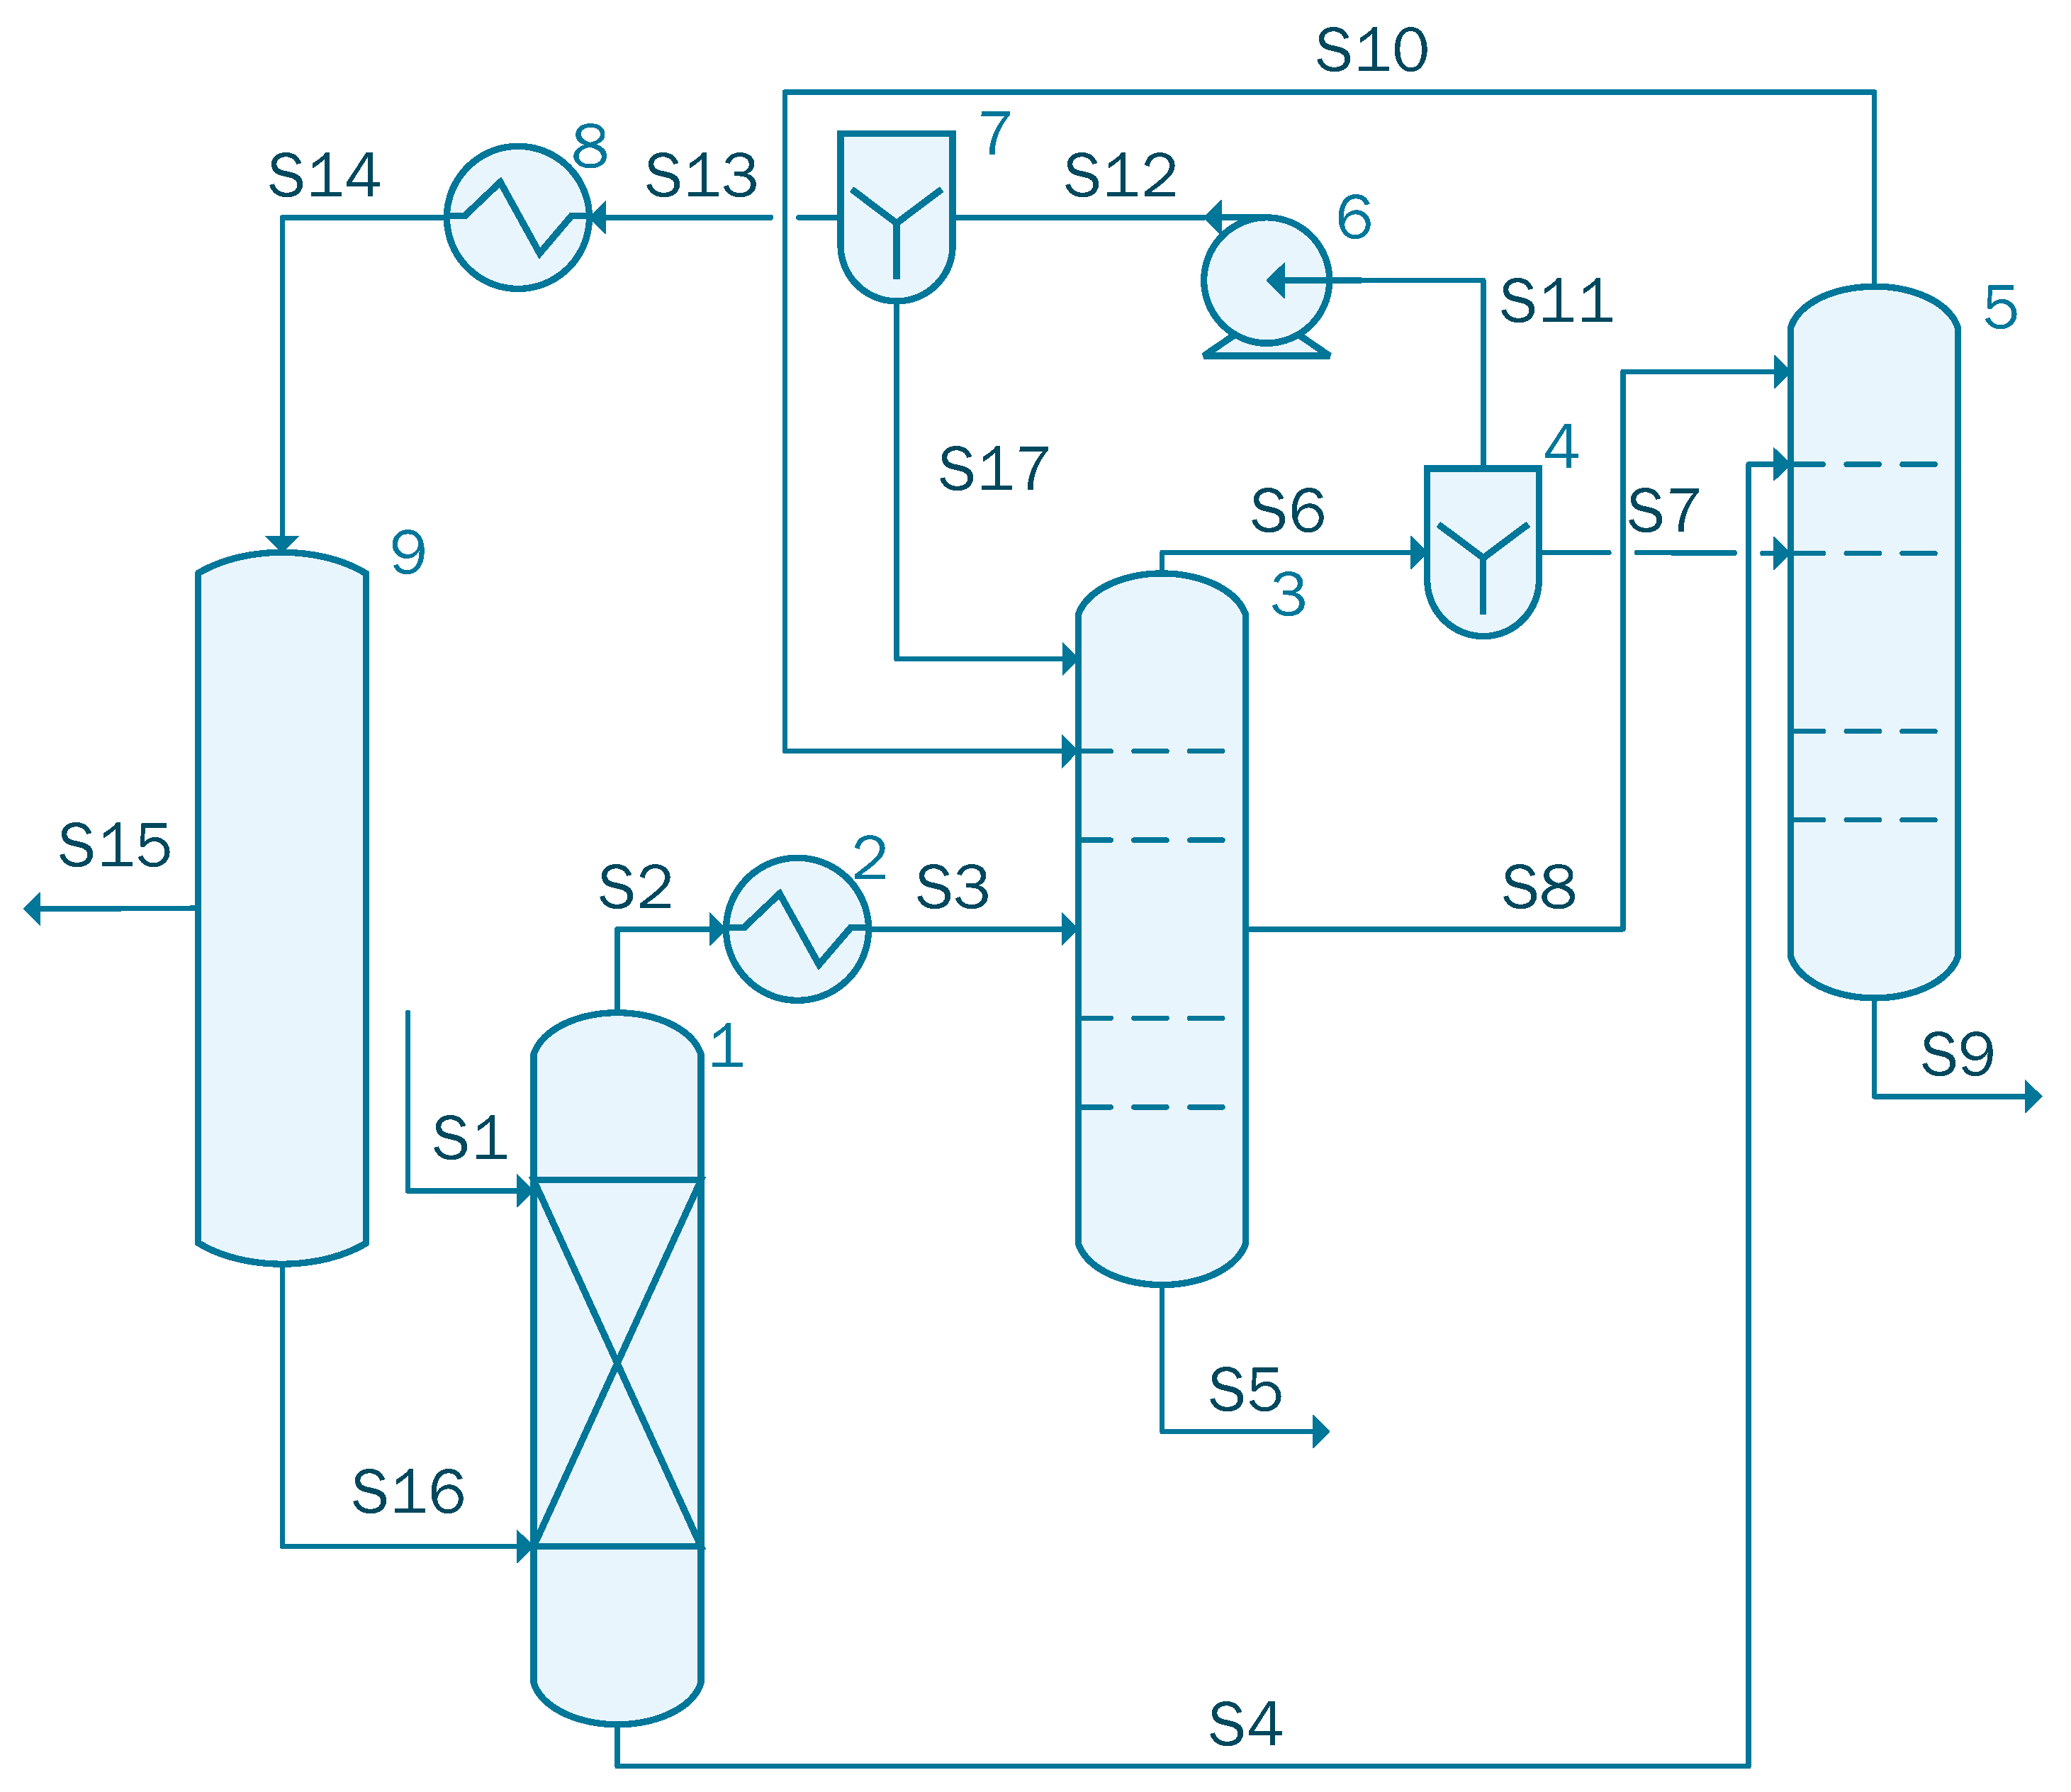
2.1.4. Case 4—Acetic Acid Concentration Using Isopropyl Acetate and Isopropanol Mixture by TC
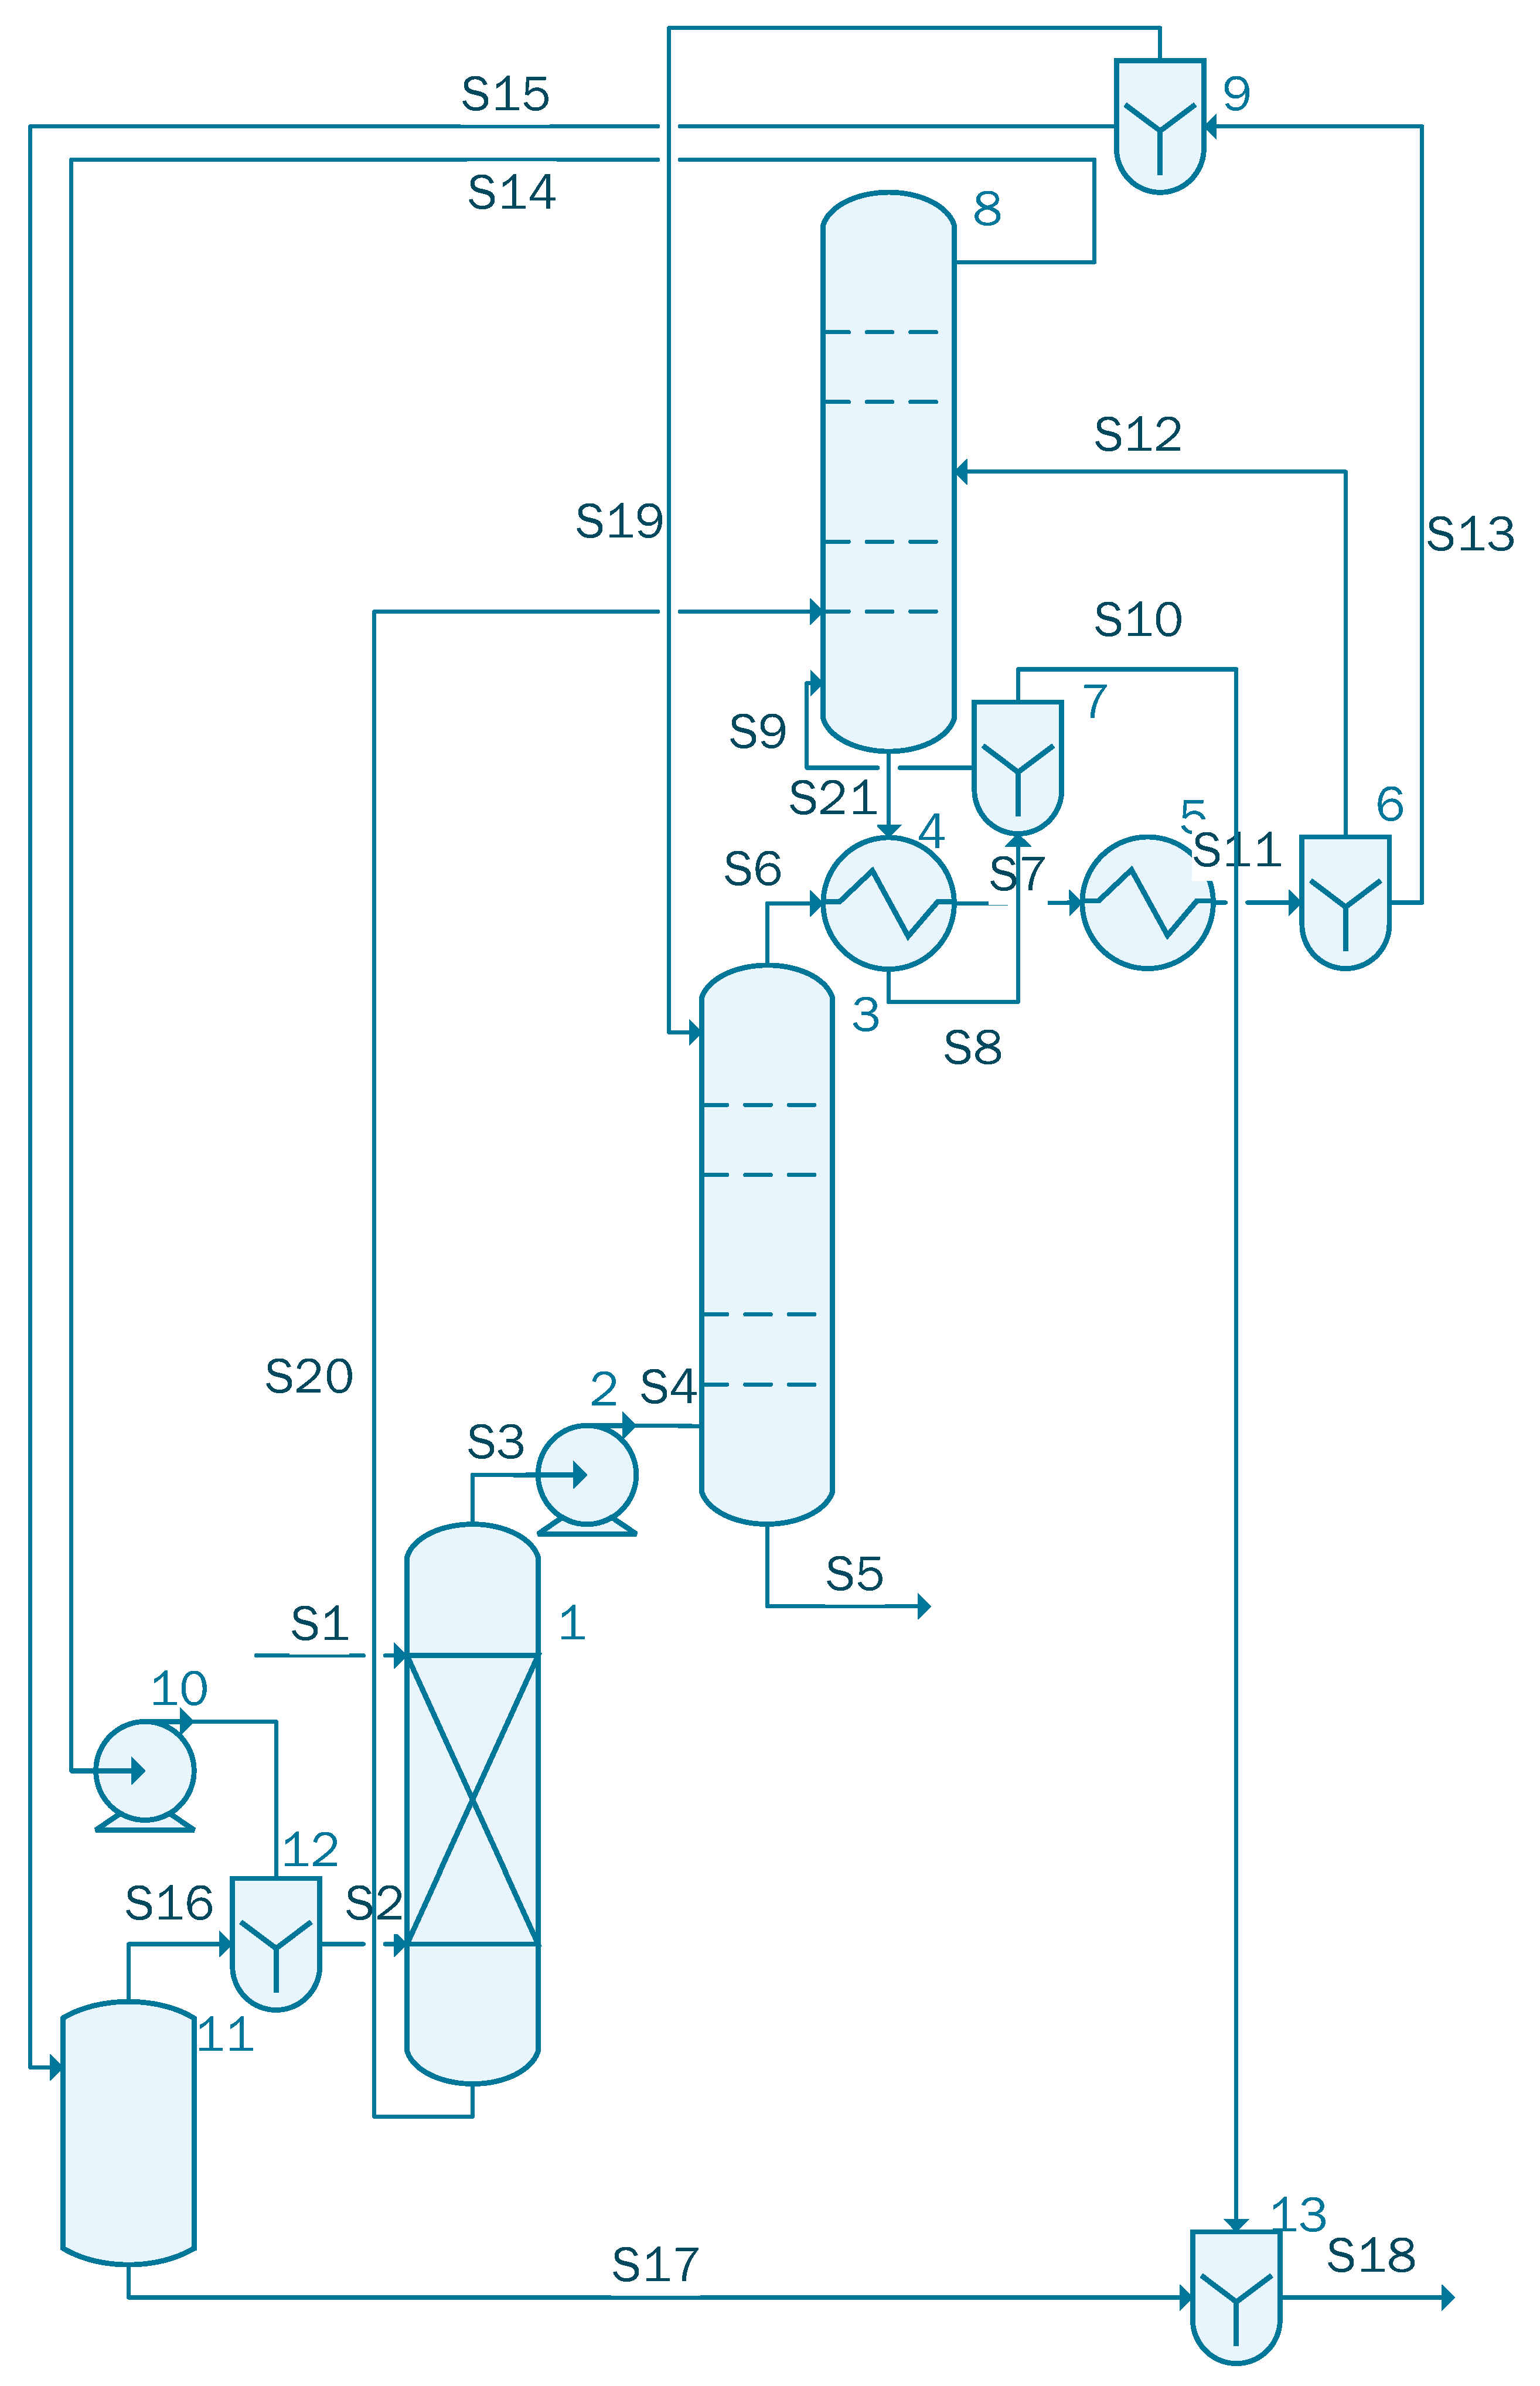
2.1.5. Case 5—Acetic Acid Concentration Using Isopropyl Acetate and Isopropanol Mixture by DED
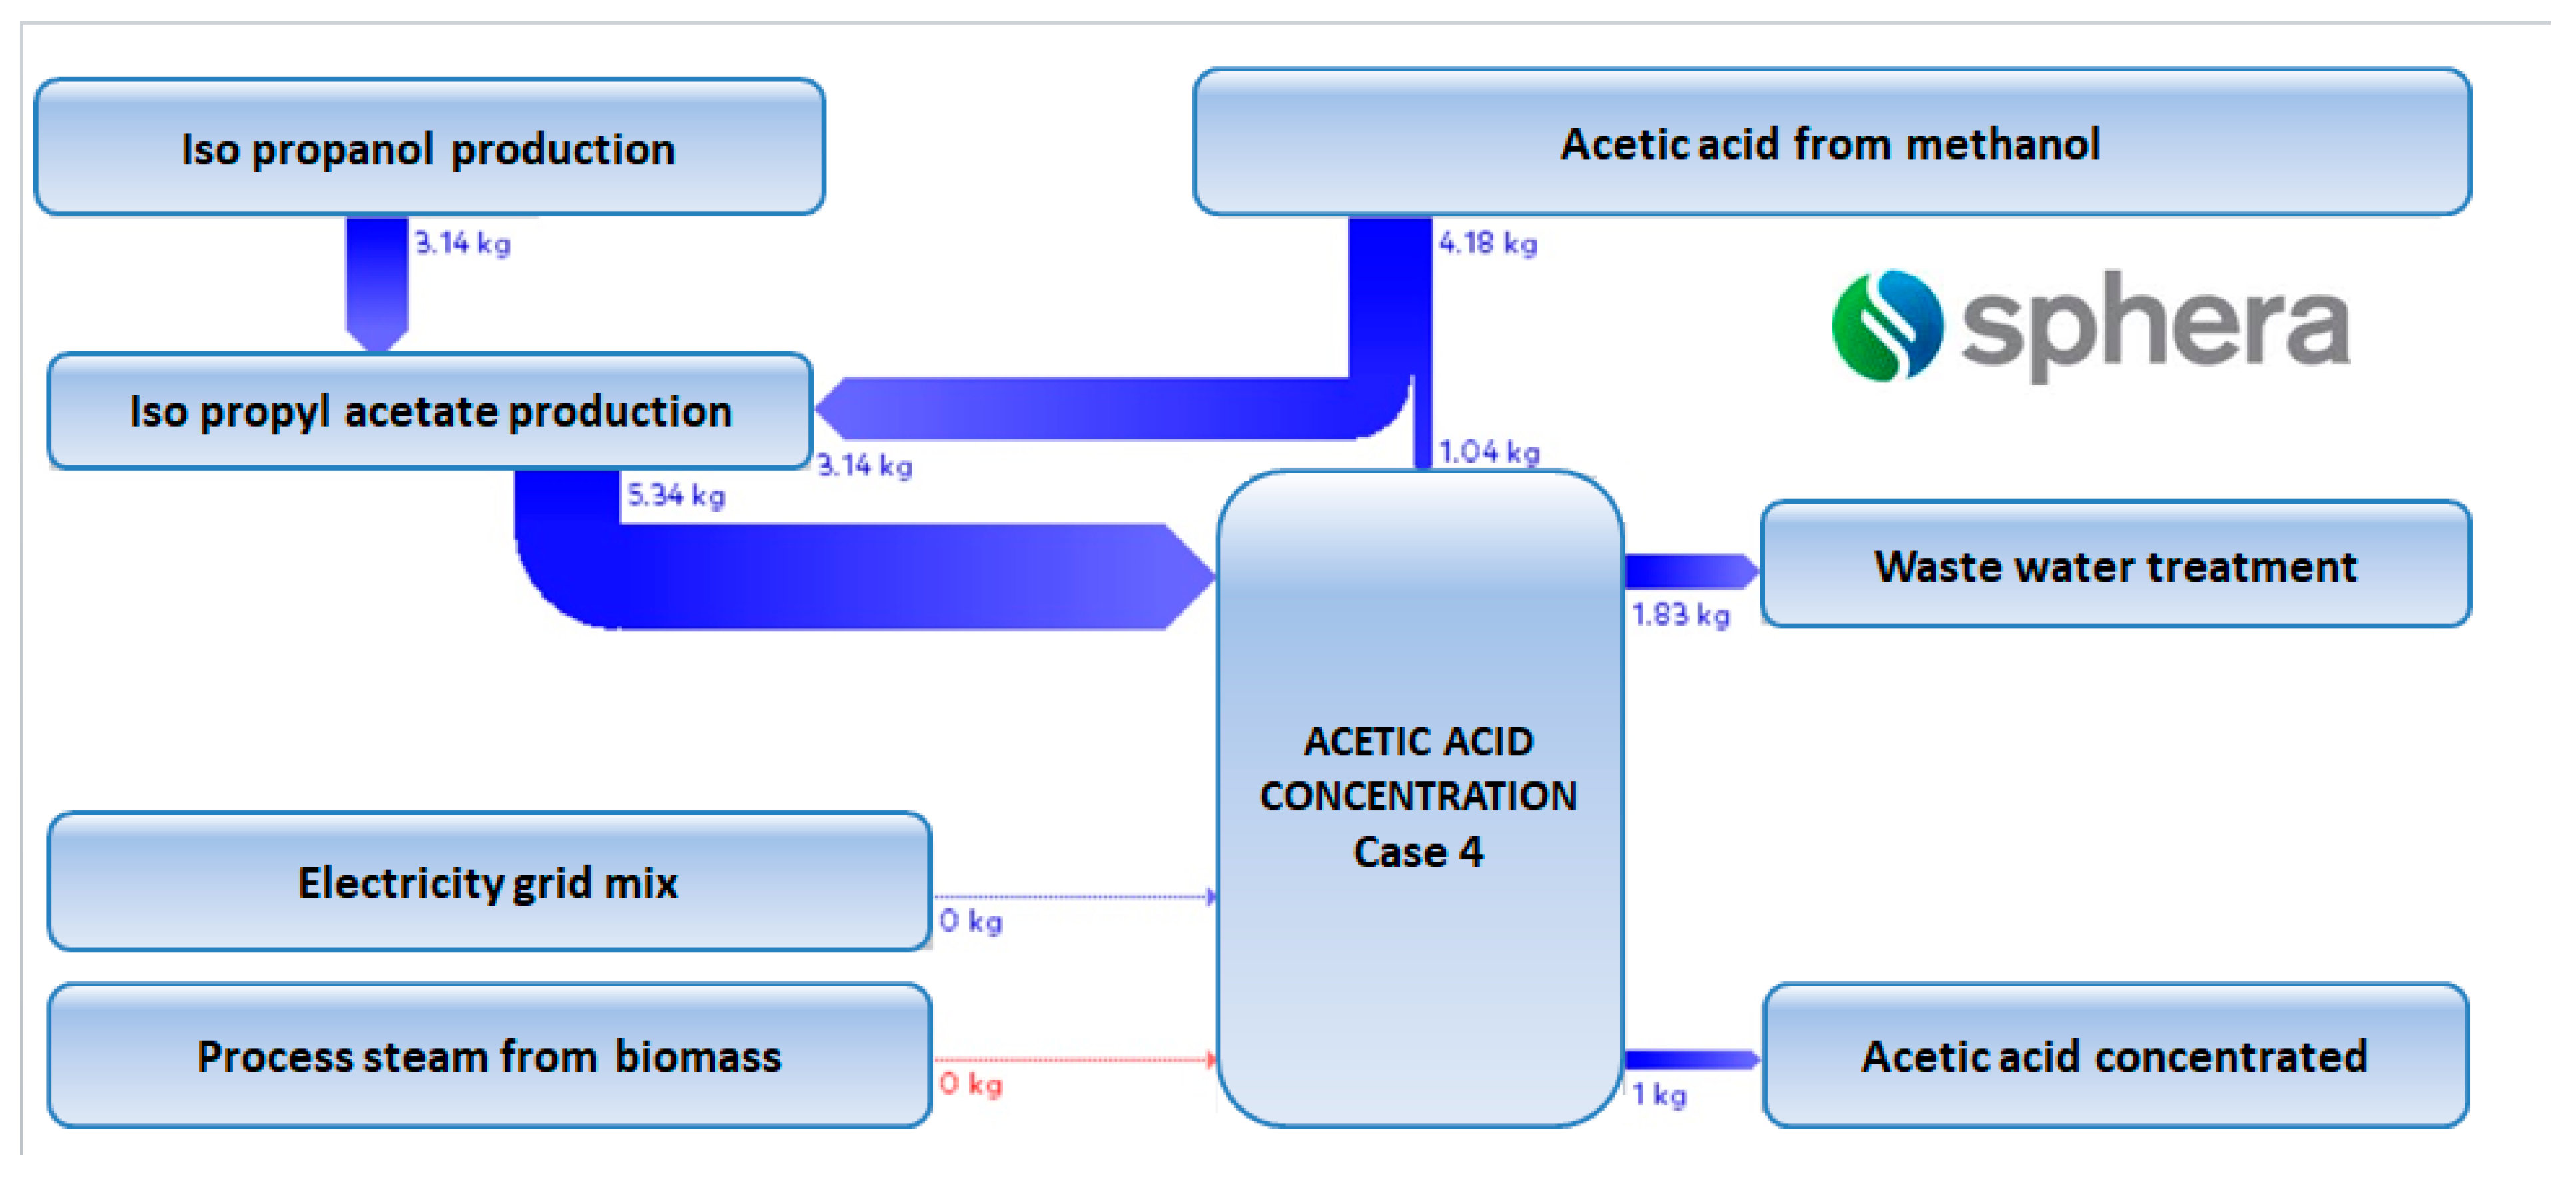
2.2. Life Cycle Assessment
3. Results and Discussion
3.1. Results and Discussions on Process Modelling and Simulation
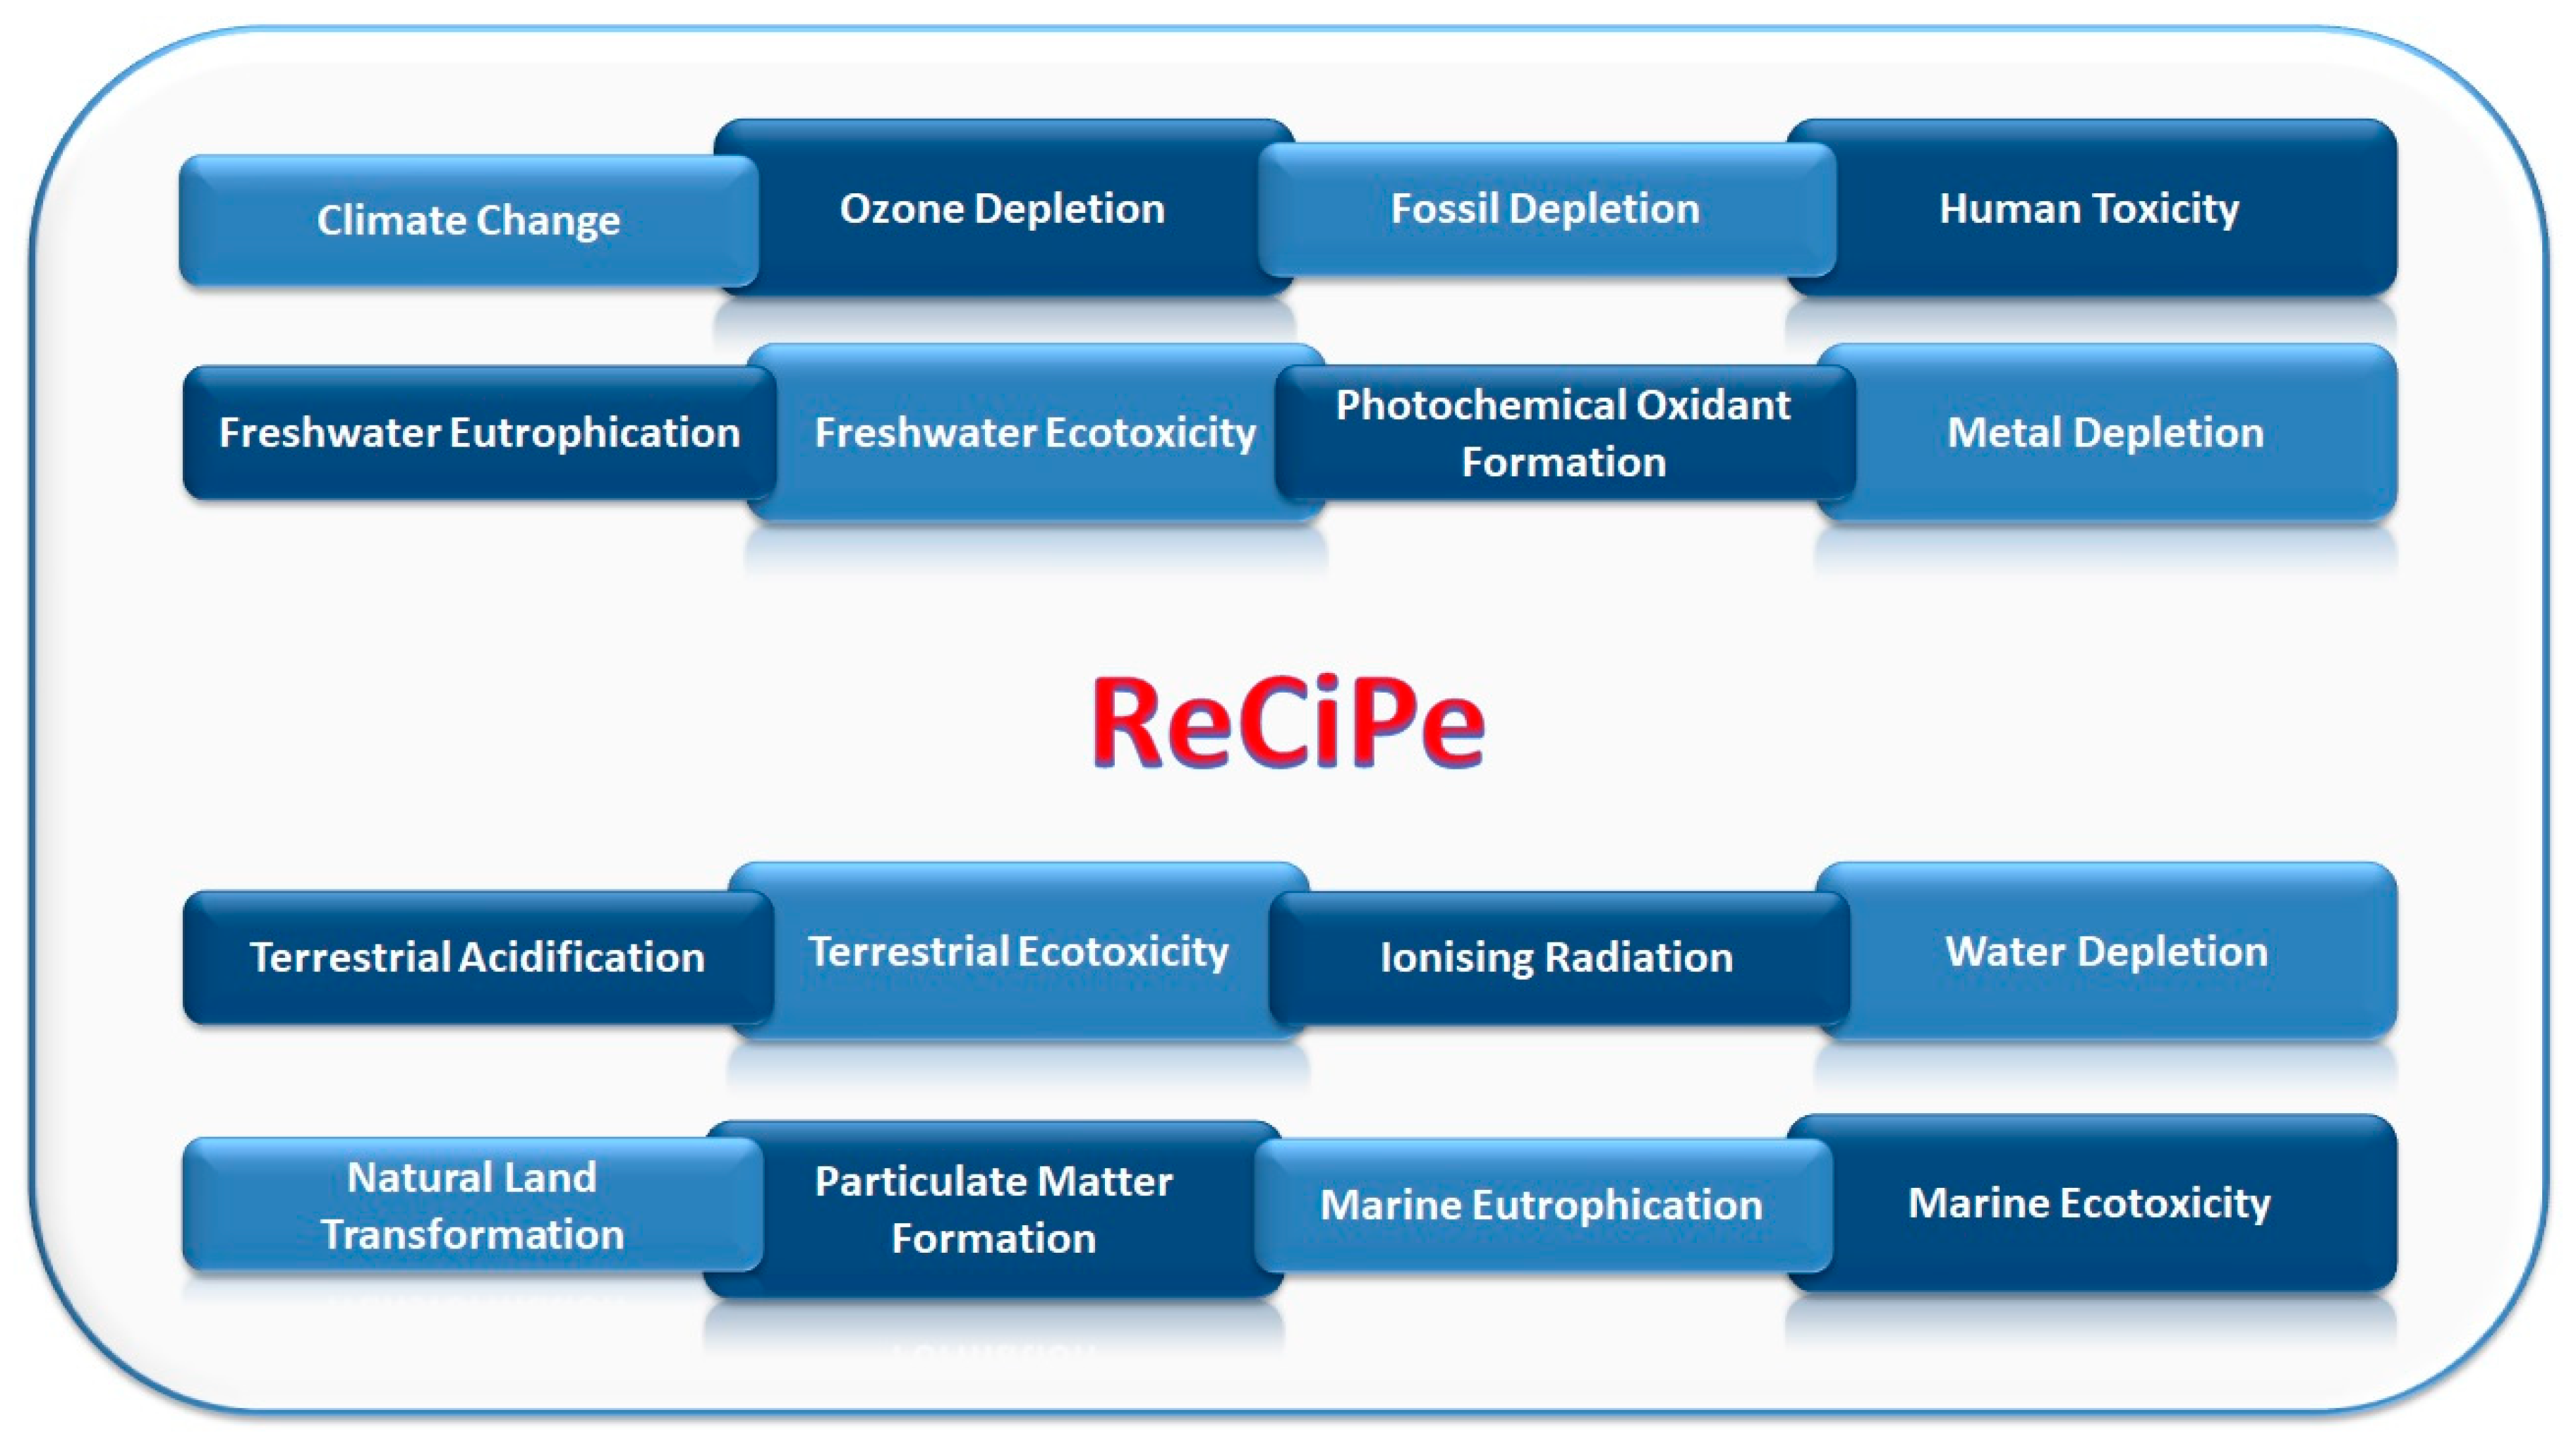
3.2. Results and Discussion on LCA
4. Conclusions
- (i)
- The technical comparison leads to the conclusion that the highest quantity of acetic acid is obtained in case 5. The purity is 0.94 in case 1, while for the rest of the cases it reaches 0.99. For properly comparing the three simulations, the energy consumption should be taken into consideration. In terms of energy consumption, case 5 is the optimum consumer, followed by case 1 and case 4. Even if the energy consumption in case 1 is low, the other technical KPIs (i.e., acetic acid flow-rate, acetic acid purity, quantity of extractant used) are the highest and do not support this scenario.
- (ii)
- The environmental comparison, based on the ReCiPe impact assessment method leads to the conclusion that the most environmentally friendly process is the DED coupled with steam generation from biomass.
Supplementary Materials
Author Contributions
Funding
Data Availability Statement
Conflicts of Interest
Abbreviations
| CHP | Combined Heat and Power |
| DED | Double Effect Distillation Process |
| FDP | Fossil Depletion Potential |
| FEP | Freshwater Eutrophication Potential |
| FETP | Freshwater Ecotoxicity Potential |
| GWP | Global Warming Potential |
| HTP | Human Toxicity Potential |
| IRP | Ionizing Radiation Potential |
| ISO | International Standard Organization |
| LCA | Life Cycle Assessment |
| LCI | Life Cycle Inventory |
| LCIA | Life Cycle Impact Assessment |
| MEP | Marine Eutrophication Potential |
| METP | Marine Ecotoxicity Potential |
| MDP | Metal Depletion Potential |
| NLT | Natural Land Transformation |
| ODP | Ozone Depletion Potential |
| POFP | Photochemical Oxidant Formation Potential |
| PI | Process Intensification |
| PMF | Particulate Matter Formation |
| Sx | Stream no x |
| TAP | Terrestrial Acidification Potential |
| TC | Thermally Coupled Process |
| WDP | Water Depletion Potential |
References
- Deshmukh, G.; Manyar, H. Production Pathways of Acetic Acid and Its Versatile Applications in the Food Industry; Basso, T.P., Ed.; IntechOpen: Rijeka, Croatia, 2020. [Google Scholar] [CrossRef]
- Lee, E.J.; Kim, Y.H. Energy saving in acetic acid process using an azeotropic distillation column with a side stripper. Chem. Eng. Commun. 2018, 205, 1311–1322. [Google Scholar] [CrossRef]
- Available online: https://www.chemanalyst.com/industry-report/acetic-acid-market-609 (accessed on 23 April 2022).
- Available online: https://ihsmarkit.com/products/acetic-acid-chemical-economics-handbook.html (accessed on 23 April 2022).
- Cheung, H.; Tanke, R.S.; Torrence, G.P. Acetic Acid. Ullmann’s Encyclopedia of Inustrial Chemistry; Wiley Online Library: Hoboken, NJ, USA, 2020; pp. 1–20. [Google Scholar] [CrossRef]
- Malveda, M.; Funada, C. “Acetic Acid”. Chemicals Economic Handbook; SRI International: Menlo Park, CA, USA, 2003; p. 602.5000. [Google Scholar]
- Saka, S.; Minami, E.; Rabemanolontsoa, H.; Kawamoto, H. Advanced biotethanol production process with acetic acid fermentation from lignocellulosics. In Proceedings of the 2014 Grand Renewable Energy International Conference, P-Bm-2014, Tokyo, Japan, 27 July–1 August 2014; pp. 1–9. Available online: https://www.researchgate.net/publication/264894561_Advanced_bioethanol_production_process_with_acetic_acid_fermentation_from_lignocellulosics (accessed on 10 April 2022).
- Wiranarongkorn, K.; Im-orb, K.; Panpranot, J.; Maréchal, F.; Arpornwichanop, A. Exergy and exergoeconomic analyses of sustainable furfural production via reactive distillation. Energy 2021, 226, 120339. [Google Scholar] [CrossRef]
- Lucia, A.; Amale, A.; Taylor, R. Energy efficient Hybrid Separation Processes. Ind. Chem. Res. 2006, 45, 8319–8328. [Google Scholar] [CrossRef]
- Javed, A.; Hassan, A.; Babar, M.; Azhar, U.; Riaz, A.; Mujahid, R.; Ahmad, T.; Mubashir, M.; Lim, H.R.; Show, P.L.; et al. A Comparison of the Exergy Efficiencies of Various Heat-Integrated Distillation Columns. Energies 2022, 15, 6498. [Google Scholar] [CrossRef]
- De Figueiredo, M.F.; Brito, K.D.; Ramos, W.B.; Sales Vasconcelos, L.G.; Brito, R.P. Effect of Solvent Content on the Separation and the Energy Consumption of Extractive Distillation Columns. Chem. Eng. Commun. 2014, 202, 1191–1199. [Google Scholar] [CrossRef]
- Garwin, L.; Hutchison, K.E. Separation of Acetic Acid and Water by Distillation. Effect of Calcium Chloride Addition. Ind. Eng. Chem. 1950, 42, 727–730. [Google Scholar] [CrossRef]
- Kalaichelvi, P.; Perumalsamy, M.; Arunagiri, A.; Sofiya, K. Synergistic Extraction of Acetic Acid from Its Aqueous Solution. J. Univ. Chem. Technol. Metall. 2007, 42, 291–294. [Google Scholar]
- Huang, X.; Zhong, W.; Du, W.; Qian, F. Thermodynamic Analysis and Process. Simulation of an Industrial Acetic Acid Dehydration System via Heterogeneous Azeotropic Distillation. Ind. Eng. Chem. Res. 2013, 52, 2944–2957. [Google Scholar] [CrossRef]
- Wang, S.-J.; Huang, K. Design and control of acetic acid dehydration system via heterogeneous azeotropic distillation using p-xylene as an entrainer. Chem. Eng. Process. Process Intensif. 2012, 60, 65–76. [Google Scholar] [CrossRef]
- Keil, F.J. Process Intensification. Rev. Chem. Eng. 2017, 34, 135–200. [Google Scholar] [CrossRef] [Green Version]
- Becht, S.; Franke, R.; Geißelmann, A.; Hahn, H. An industrial view of process intensification. Chem. Eng. Process. Process Intensif. 2009, 48, 329–332. [Google Scholar] [CrossRef]
- Raghavan, K.V.; Reddy, B.M. Industrial Catalysis and Separations: Innovations for Process Intensification; Apple Academic Press: Waretown, NJ, USA, 2014. [Google Scholar]
- Caballero, J.A. Thermally Coupled Distillation. Comp. Aided Chem. Eng. 2009, 27, 59–64. [Google Scholar] [CrossRef]
- Yue, J. Green process intensification using microreactor technology for the synthesis of biobased chemicals and fuels. Chem. Eng. Process. Process Intensif. 2022, 177, 109002. [Google Scholar] [CrossRef]
- Pahija, E.; Golshan, S.; Blais, B.; Boffito, D.C. Perspectives on the process intensification of CO2 capture and utilization. Chem. Eng. Process. Process Intensif. 2022, 176, 108958. [Google Scholar] [CrossRef]
- Humphrey, J.L. Separation technologies: An. opportunity for energy savings. Chem. Eng. Progress 1992, 88, 32–42. [Google Scholar]
- Sholl, D.S.; Lively, R.P. Seven chemical separations to change the world. Nature 2016, 532, 435–437. [Google Scholar] [CrossRef] [PubMed] [Green Version]
- Saidur, R.; Elcevvadi, E.T.; Mekhilef, S.; Safari, A.; Mohammed, H.A. An overview of different distillation methods for small scale applications. Renew. Sustain. Energy Rev. 2011, 15, 4756–4764. [Google Scholar] [CrossRef]
- Kong, Z.Y.; Sánchez-Ramírez, E.; Yang, A.; Shen, W.; Segovia-Hernández, J.G.; Sunarso, J. Process intensification from conventional to advanced distillations: Past, present, and future. Chem. Eng. Res. Des. 2022, 188, 378–392. [Google Scholar] [CrossRef]
- Chen, Y.-Y.; Kong, Z.Y.; Yang, A.; Lee, H.-Y.; Sunarso, J. Design and control of an energy intensified side-stream extractive distillation for binary azeotropic separation of nhexane and ethyl acetate. Sep. Purif. Technol. 2022, 294, 121176. [Google Scholar] [CrossRef]
- Park, J.; Jeong, Y.; Han, M. Process intensification of reactive distillation using improved RCMs: Acetic acid production. Chem. Eng. Process. Process Intensif. 2020, 157, 108136. [Google Scholar] [CrossRef]
- Shah, V.H.; Agrawal, R. A matrix method for multicomponent distillation sequences. AIChE J. 2009, 56, 1759–1775. [Google Scholar] [CrossRef]
- Kiss, A.A.; Smith, R. Rethinking energy use in distillation processes for a more sustainable chemical industry. Energy 2020, 203, 117788. [Google Scholar] [CrossRef]
- Kiss, A.A.; Olujic, Z. A review on process intensification in internally heat-integrated distillation columns. Chem. Eng. Process. 2014, 86, 125–144. [Google Scholar] [CrossRef]
- Cui, C.; Sun, J.; Li, X. A hybrid design combining double-effect thermal integration and heat pump to the methanol distillation process for improving energy efficiency. Chem. Eng. Process. Process Intensif. 2017, 119, 81–92. [Google Scholar] [CrossRef]
- Gao, X.; Yang, Y.; Chen, M.; Cheng, Q.; Lu, K. Novel heat pump reactive distillation and dividing-wall column reactive distillation processes for synthesizing isopropyl acetate to save TAC and reduce CO2 emissions. Chem. Eng. Process. Process Intensif. 2022, 171, 108746. [Google Scholar] [CrossRef]
- Chemstations. ChemCAD, Chemical Process Simulation Software. Available online: www.chemstations.com (accessed on 20 September 2022).
- Available online: www.cocosimulator.org (accessed on 20 September 2022).
- Caxiano, I.N.; Junqueira, P.G.; Mangili, P.V.; Prata, D.M. Eco-efficiency analysis and intensification of the acetic acid purification process. Chem. Eng. Process. Process Intensif. 2019, 147, 107784. [Google Scholar] [CrossRef]
- ISO 14040:2006; Environmental Management—Life Cycle Assessment—Principles and Framework. ISO—The International Organization for Standardization: Geneva, Switzerland, 2006.
- ISO 14044:2006; Environmental Management—Life Cycle Assessment—Requirements and Guidelines. International Organization for Standardization: Geneva, Switzerland, 2006.
- Sphera, GaBi Software. Available online: www.sphera.com (accessed on 15 September 2022).
- Maranghi, S.; Brondi, C. Life Cycle Assessment in the Chemical Product Chain, Challenges, Methodological Approaches and Applications; Springer: Berlin/Heidelberg, Germany, 2020. [Google Scholar]
- Agrawal, R. Multieffect distillation for thermally coupled configurations. AIChE J. 2000, 46, 2211–2224. [Google Scholar] [CrossRef]


| Unit No. | Equipment Role | Design Assumptions |
|---|---|---|
| 1 | Extraction column | Solvent used: ethyl acetate acetate Number of stages: 15 Working pressure: 101.33 kPa |
| 2 | Distillation column | Number of stages: 50 Bottom product flow-rate: 113 kmol/h Feed tray for stream S3: 1 Equilibrium column |
| 3 | Heat exchanger | Temperature out: 25 °C |
| 4 | Decanter | Flash separator Working temperature: 25 °C |
| 5 | Mixer | Pressure out: 101.325 kPa |
| 6 | Heat exchanger | Temperature out: 78 °C |
| 7 | Distillation column | Number of stages: 50 Ethyl acetate recovery: 0.999 Feed tray for stream S3: 1 Equilibrium column |
| Unit No. | Equipment Role | Design Assumptions |
|---|---|---|
| 1 | Extraction column | Solvent used: isopropyl acetate Number of stages: 10 Working pressure: 200 kPA |
| 2 | Mixer | Output pressure: 110 kPa |
| 3 | Azeotropic distillation column | Top pressure: 110 kPa No of stages: 37 Feed tray for stream 23: 1 Feed tray for stream 3: 18 Bottom component mole fraction: 0.999 acetic acid |
| 4 | Divider | Output stream 7: 0.72 Flow ratio |
| 5 | Distillation column | No of stages: 36 Feed stage for stream 7: 15 Reflux ratio R/D: 2 Bottom component fraction recovery: 0.995 water |
| 6 | Component separator | Pressure out: 110 kPa Split fractions: Acetic acid: 0.999 Isopropanol: 0.999 Isopropyl acetate: 0.999 |
| 7 | Mixer | Pressure out: 110 kPa |
| 8 | Distillation column | No of stages: 46 Feed stage for stream 4: 29 Bottom comp fraction recovery: 0.975 water |
| 9 10 12–14 | Pumps | Outlet pressure: 250 kPa Efficiency: 0.75 |
| 11 | Mixer | Pressure out: 250 kPa |
| 13 | Divider | Output stream 18: 0.5 Flow ratio |
| Unit No. | Equipment Role | Design Assumptions |
|---|---|---|
| 1 | Component separator | Pressure out: 152 kPa Split fractions: Water: 0.28 Acetic acid: 0.97 Isopropanol: 0.65 Isopropyl acetate: 0.98 |
| 2 | Mixer | Output pressure: 110 kPa |
| 3 | Azeotropic distillation column | Top pressure: 110 kPa No of stages: 37 Feed tray for stream 23: 1 Feed tray for stream 3: 18 Condenser duty, negative: −33,786 MJ/h Bottom component mole fraction: 0.999 Acetic Acid |
| 4 | Divider | Output stream 7: 0.72 Flow ratio |
| 5 | Distillation column | No of stages: 36 Feed stage for stream 7: 15 Reflux ratio: 2 Bottom mole rate of one component: 97.83 kmol/h Water |
| 6 | Component separator | Pressure out: 110 kPa Split fractions: Acetic acid: 0.999 Isopropanol: 0.999 Isopropyl acetate: 0.999 |
| 7 | Mixer | Pressure out: 110 kPa |
| 8 | Distillation column | No of stages: 46 Feed stage for stream 4: 29 Condenser duty, negative: −10,796.70 MJ/h Bottom comp fraction recovery: 0.99 Water |
| 9 10 12 14 | Pumps | Outlet pressure: 250 kPa Efficiency: 0.75 |
| 11 | Mixer | Pressure out: 250 kPa |
| 13 | Divider | Output stream 18: 0.5 Flow ratio |
| Unit No. | Equipment Role | Design Assumptions |
|---|---|---|
| 1 | Liquid/Liquid extractor | No of stages: 20 Top pressure: 200 kPa Feed tray for stream S1: 1 Feed tray for stream S16: 20 |
| 2 | Heat exchanger | Temperature of stream S3: 92.11 °C |
| 3 | Azeotropic distillation column | No of stages: 42 Feed tray for stream 17: 1 Feed tray for stream 10: 14 Feed tray for stream 3: 22 Condenser duty, negative: −34,358 MJ/h Bottom component fraction recovery (acetic acid): 0.92 S8 stage 14, liquid mole flow 180 kmol/h |
| 4 | Divider | Split based on molar flow rate Output stream S7: 75 flow rate kmol/h |
| 5 | Distillation column | No of stages: 39 Feed stage for stream 8: 1 Feed stage for stream 7: 23 Feed stage for stream 4: 17 Bottom mole flow rate: 823.17 kmol/h |
| 6 | Pump | Outlet pressure: 200 kPa Efficiency: 0.8 |
| 7 | Divider | Output stream S17: 0.3 flow ratio |
| 8 | Heat exchanger | Temperature of S14: 70 °C |
| 9 | Component separator | Split fractions Water: 0.576 Acetic acid: 1 Isopropanol: 1 Isopropyl acetate: 1 |
| Unit No. | Equipment | Design Assumptions |
|---|---|---|
| 1 | Liquid/Liquid extractor | No of stages: 10 Top pressure: 100 kPa Feed tray for stream S1: 1 Feed tray for stream S12: 10 |
| 2 | Pump | Outlet pressure: 340 kPa Efficiency: 0.85 |
| 3 | Azeotropic distillation column | No of stages: 37 Feed tray for stream 4: 1 Feed tray for stream 19: 18 Bottom mole flow-rate: 136 kmol/h |
| 4 | Heat exchanger | Heat duty: −16,153 MJ/h |
| 5 | Heat exchanger | Heat duty: 13,672 MJ/h |
| 6 | Divider | Output stream S12: 270 flow rate kmol/h |
| 7 | Divider | Output stream S9: 0.24766 flow rate kmol/h |
| 8 | Distillation column | Reflux pump press: 110 kPa No of stages: 40 Feed stage for stream 20: 21 Feed stage for stream 12: 23 Feed stage for stream 9: 40 Distillate mole flow rate 200 kmol/h |
| 9 | Divider | Output stream S19: 0.5034 flow ratio |
| 10 | Pump | Outlet pressure: 250 kPa Efficiency: 0.85 |
| 11 | Component separator | Split fractions Water: 0.6631 |
| Case Name | Electricity Source | Steam Source |
|---|---|---|
| Case 4 | ||
| Sub-case 4.1 | Grid mix | Hard Coal |
| Sub-case 4.2 | Grid mix | Heavy fuel oil |
| Sub-case 4.3 | Grid mix | Light fuel oil |
| Sub-case 4.4 | Grid mix | Natural Gas |
| Sub-case 4.5 | Grid mix | Biomass |
| Case 5 | ||
| Sub-case 5.1 | Grid mix | Hard Coal |
| Sub-case 5.2 | Grid mix | Heavy fuel oil |
| Sub-case 5.3 | Grid mix | Light fuel oil |
| Sub-case 5.4 | Grid mix | Natural Gas |
| Sub-case 5.5 | Grid mix | Biomass |
| Assumptions | |
|---|---|
| Acetic acid production | Low-pressure methanol carbonylation in one step is considered. Methanol and carbon monoxide are continuously fed into the stirred reactor in which the reaction is conducted at 200 °C and 35 bars. Most noticeable by-products (however produced in very little quantities) are propionic acid, carbon dioxide, and hydrogen. The catalyst preparation is done in a separate reactor to ensure proper dissolving. In this process a rhodium catalyst is used. |
| Isopropanol production | Isopropanol is manufactured by propene by indirect hydrogenation in two steps: esterification of sulphate acid with propene and hydrogenation of the formed sulphate esters with steam. The product is neutralized by caustic soda solution and purified in a refining column. The by-products (di iso-propyl ether and others) are recovered and recycled to the process. |
| Iso-propyl acetate production | Isopropyl acetate was generated from acetic acid and isopropanol according to the following chemical reaction: CH3COOH + C3H8O → C5H10O2 + H2O Stoichiometric quantities of materials have been considered in the LCA. |
| Electricity from grid mix | The national or regional specific electricity consumption mix is provided by the conversion of the different energy carriers to electricity and imports from neighboring countries. The electricity is either produced in energy carrier specific power plants and/or combined heat and power plants (CHP). Moreover, the national and regional specific technology standards of the power plants are considered with regard to efficiency, firing technology, flue-gas desulphurization, NOx removal, and de-dusting. The fossil power plant models combine emission data from the literature with calculated values for non-measured emissions. Combustion residues from solid fuels, such as gypsum, bottom ash, or fly ash are assumed to be reused. Waste treatment for these substances is not considered. The supply chain is modelled in specific national/regional energy carrier consumption mixes (i.e., domestic production and imports), and considers national/regional average energy carrier properties (i.e., elemental composition and energy content). |
| Steam generation | The process steam is produced in specific heat plants using hard coal, heavy fuel oil, heavy fuel oil, light fuel oil, natural gas or biomass. The national and regional specific technology standards of the heat plants are also considered with regard to efficiency, firing technology, flue-gas desulphurization, NOx removal and de-dusting. Only single fuels are considered; their combination was not investigated in the present research. The power plant models combine emission data from the literature with calculated values for non-measured. Combustion residues from solid fuels, such as gypsum, bottom ash, or fly ash are assumed to be reused. The supply chain of the raw-material used for steam generation is also considered from exploration, production, processing, and transport of the fuels to the heat plants. |
| Parameter | Unit of Measure | Case 1 | Case 2 | Case 3 | Case 4 | Case 5 |
|---|---|---|---|---|---|---|
| Acetic acid total stream | kmol/h | 113.39 | 135.06 | 135.54 | 134.07 | 136.00 |
| Acetic acid purity | mole fraction | 0.94 | 0.99 | 0.99 | 0.99 | 0.99 |
| Acetic acid flow-rate | kmol/h | 106.34 | 134.93 | 135.41 | 134.05 | 135.86 |
| Acetic acid recovery | % | 76.50 | 97.07 | 97.42 | 96.44 | 97.74 |
| Extractant quantity | kmol/h | 938.65 | 395.49 | 400.00 | 490.23 | 344.21 |
| Water | mole fraction | 0.19 | 0.13 | 0.13 | 0.13 | 0.54 |
| Acetic Acid | 0.02 | 7.72 × 10⁻⁵ | 7.63 × 10⁻⁵ | 7.63 × 10⁻⁵ | 1.11 × 10⁻³ | |
| Ethyl Acetate | 0.79 | 0.00 | 0.00 | 0.00 | 0.00 | |
| Isopropanol | 0.00 | 0.00 | 0.01 | 0.01 | 0.07 | |
| Isopropyl Acetate | 0.00 | 0.87 | 0.86 | 0.86 | 0.39 | |
| No. of equipment | Columns | 3 | 3 | 3 | 2 | 2 |
| Additional equipment * | 4 | 11 | 11 | 7 | 11 | |
| Power consumption | [kW] | - | 2.77 | 2.80 | 0.06 | 5.11 |
| Energy consumption | [MJ/h] | 39,798 | 43,843 | 43,896 | 40,646 | 33,640 |
| Sub-Case | ||||||
|---|---|---|---|---|---|---|
| Parameter | Unit | 4.1 | 4.2 | 4.3 | 4.4 | 4.5 |
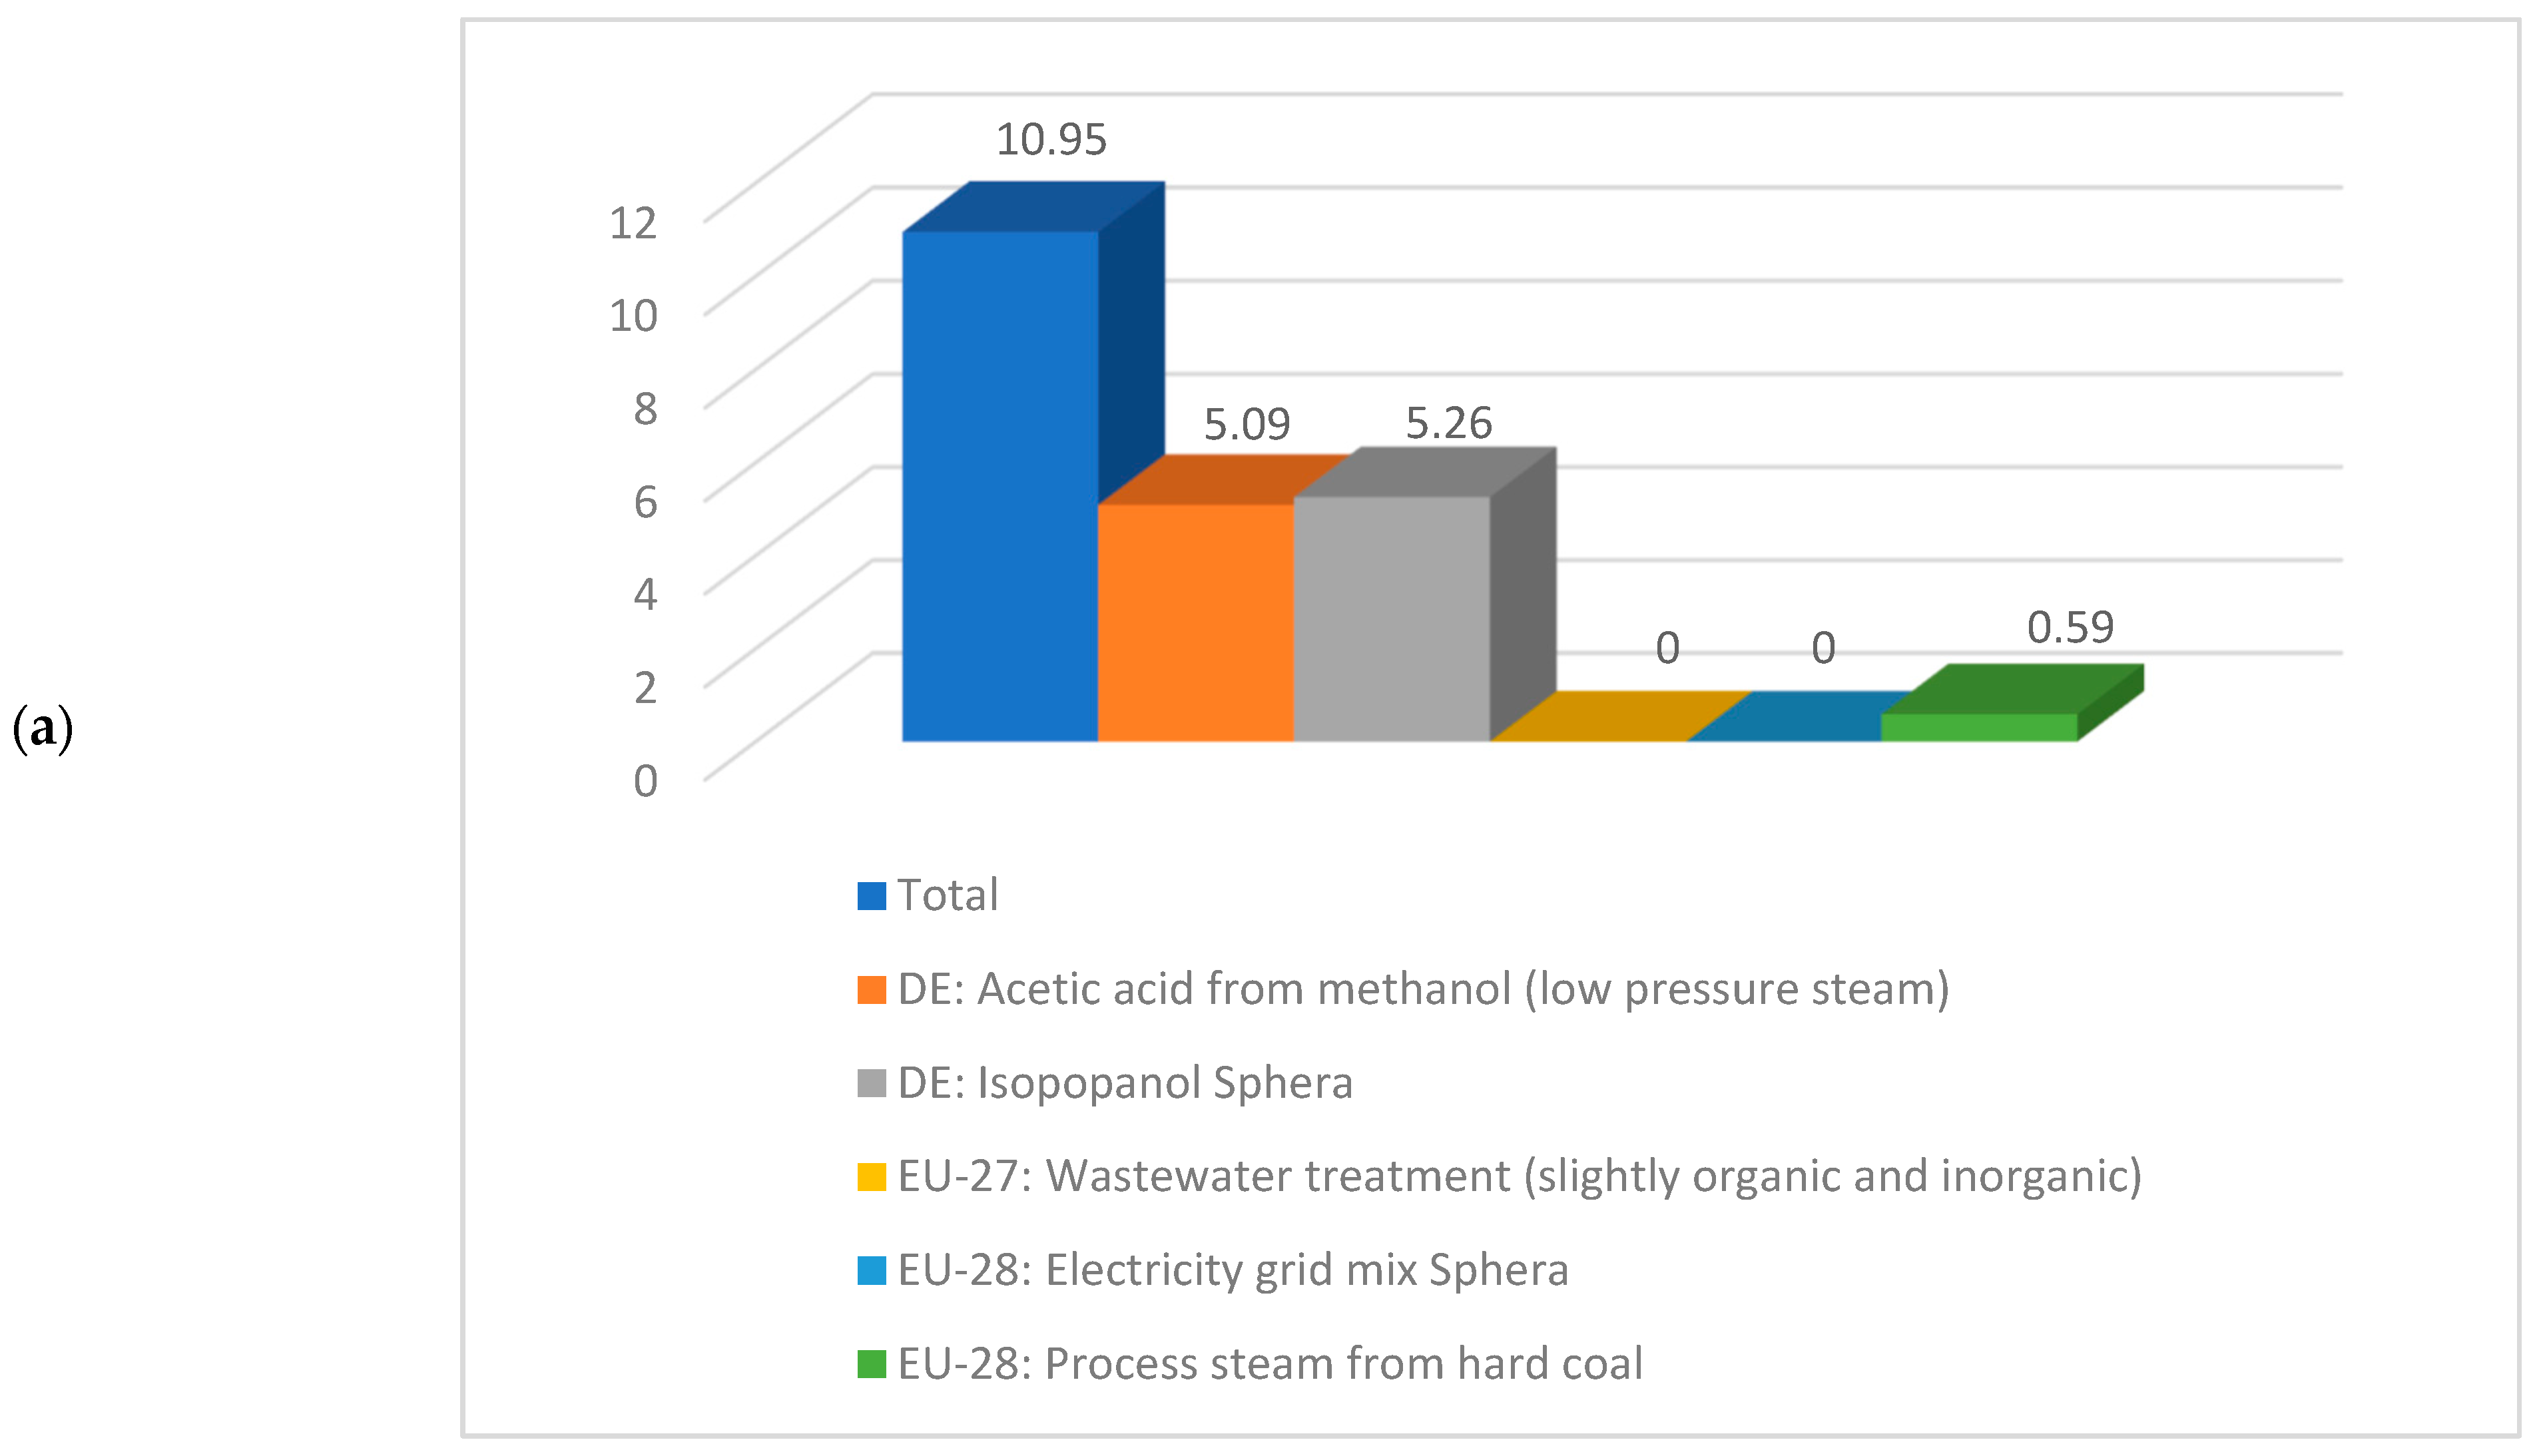
| GWP | kg CO2 eq./kg acetic acid | 10.95 | 10.88 | 10.92 | 10.80 | 10.38 |
| FEP | 10−5 × kg P eq./kg acetic acid | 1.07 | 1.63 | 1.63 | 1.62 | 2.16 |
| ODP | 10−12 × kg CFC-11 eq./kg acetic acid | 2.71 | 2.71 | 2.71 | 2.71 | 2.71 |
| FDP | kg oil eq./kg acetic acid | 8.37 | 8.39 | 8.45 | 8.45 | 8.23 |
| FETP | 10−3 × kg 1,4-DB eq./kg acetic acid | 3.74 | 3.77 | 3.78 | 3.75 | 3.78 |
| HTP | kg 1,4-DB eq./kg acetic acid | 0.68 | 0.69 | 0.69 | 0.68 | 0.68 |
| MDP | 10−2 × kg Fe eq./kg acetic acid | 6.49 | 6.40 | 6.44 | 6.57 | 6.41 |
| POFP | 10−2 × kg NMVOC eq./kg acetic acid | 2.17 | 2.18 | 2.18 | 2.13 | 2.15 |
| TETP | 10−4 × kg 1,4-DB eq./kg acetic acid | 6.66 | 6.74 | 6.76 | 6.76 | 6.65 |
| WDP | 10−2 × m3/kg acetic acid | 5.09 | 5.10 | 5.14 | 5.23 | 6.45 |
| METP | 10−3 × kg 1,4-DB eq./kg acetic acid | 1.61 | 1.65 | 1.67 | 1.61 | 1.62 |
| MEP | 10−3 × kg N eq./kg acetic acid | 4.72 | 4.71 | 4.71 | 4.54 | 4.76 |
| Sub-Case | ||||||
|---|---|---|---|---|---|---|
| Parameter | Unit | 5.1 | 5.2 | 5.3 | 5.4 | 5.5 |
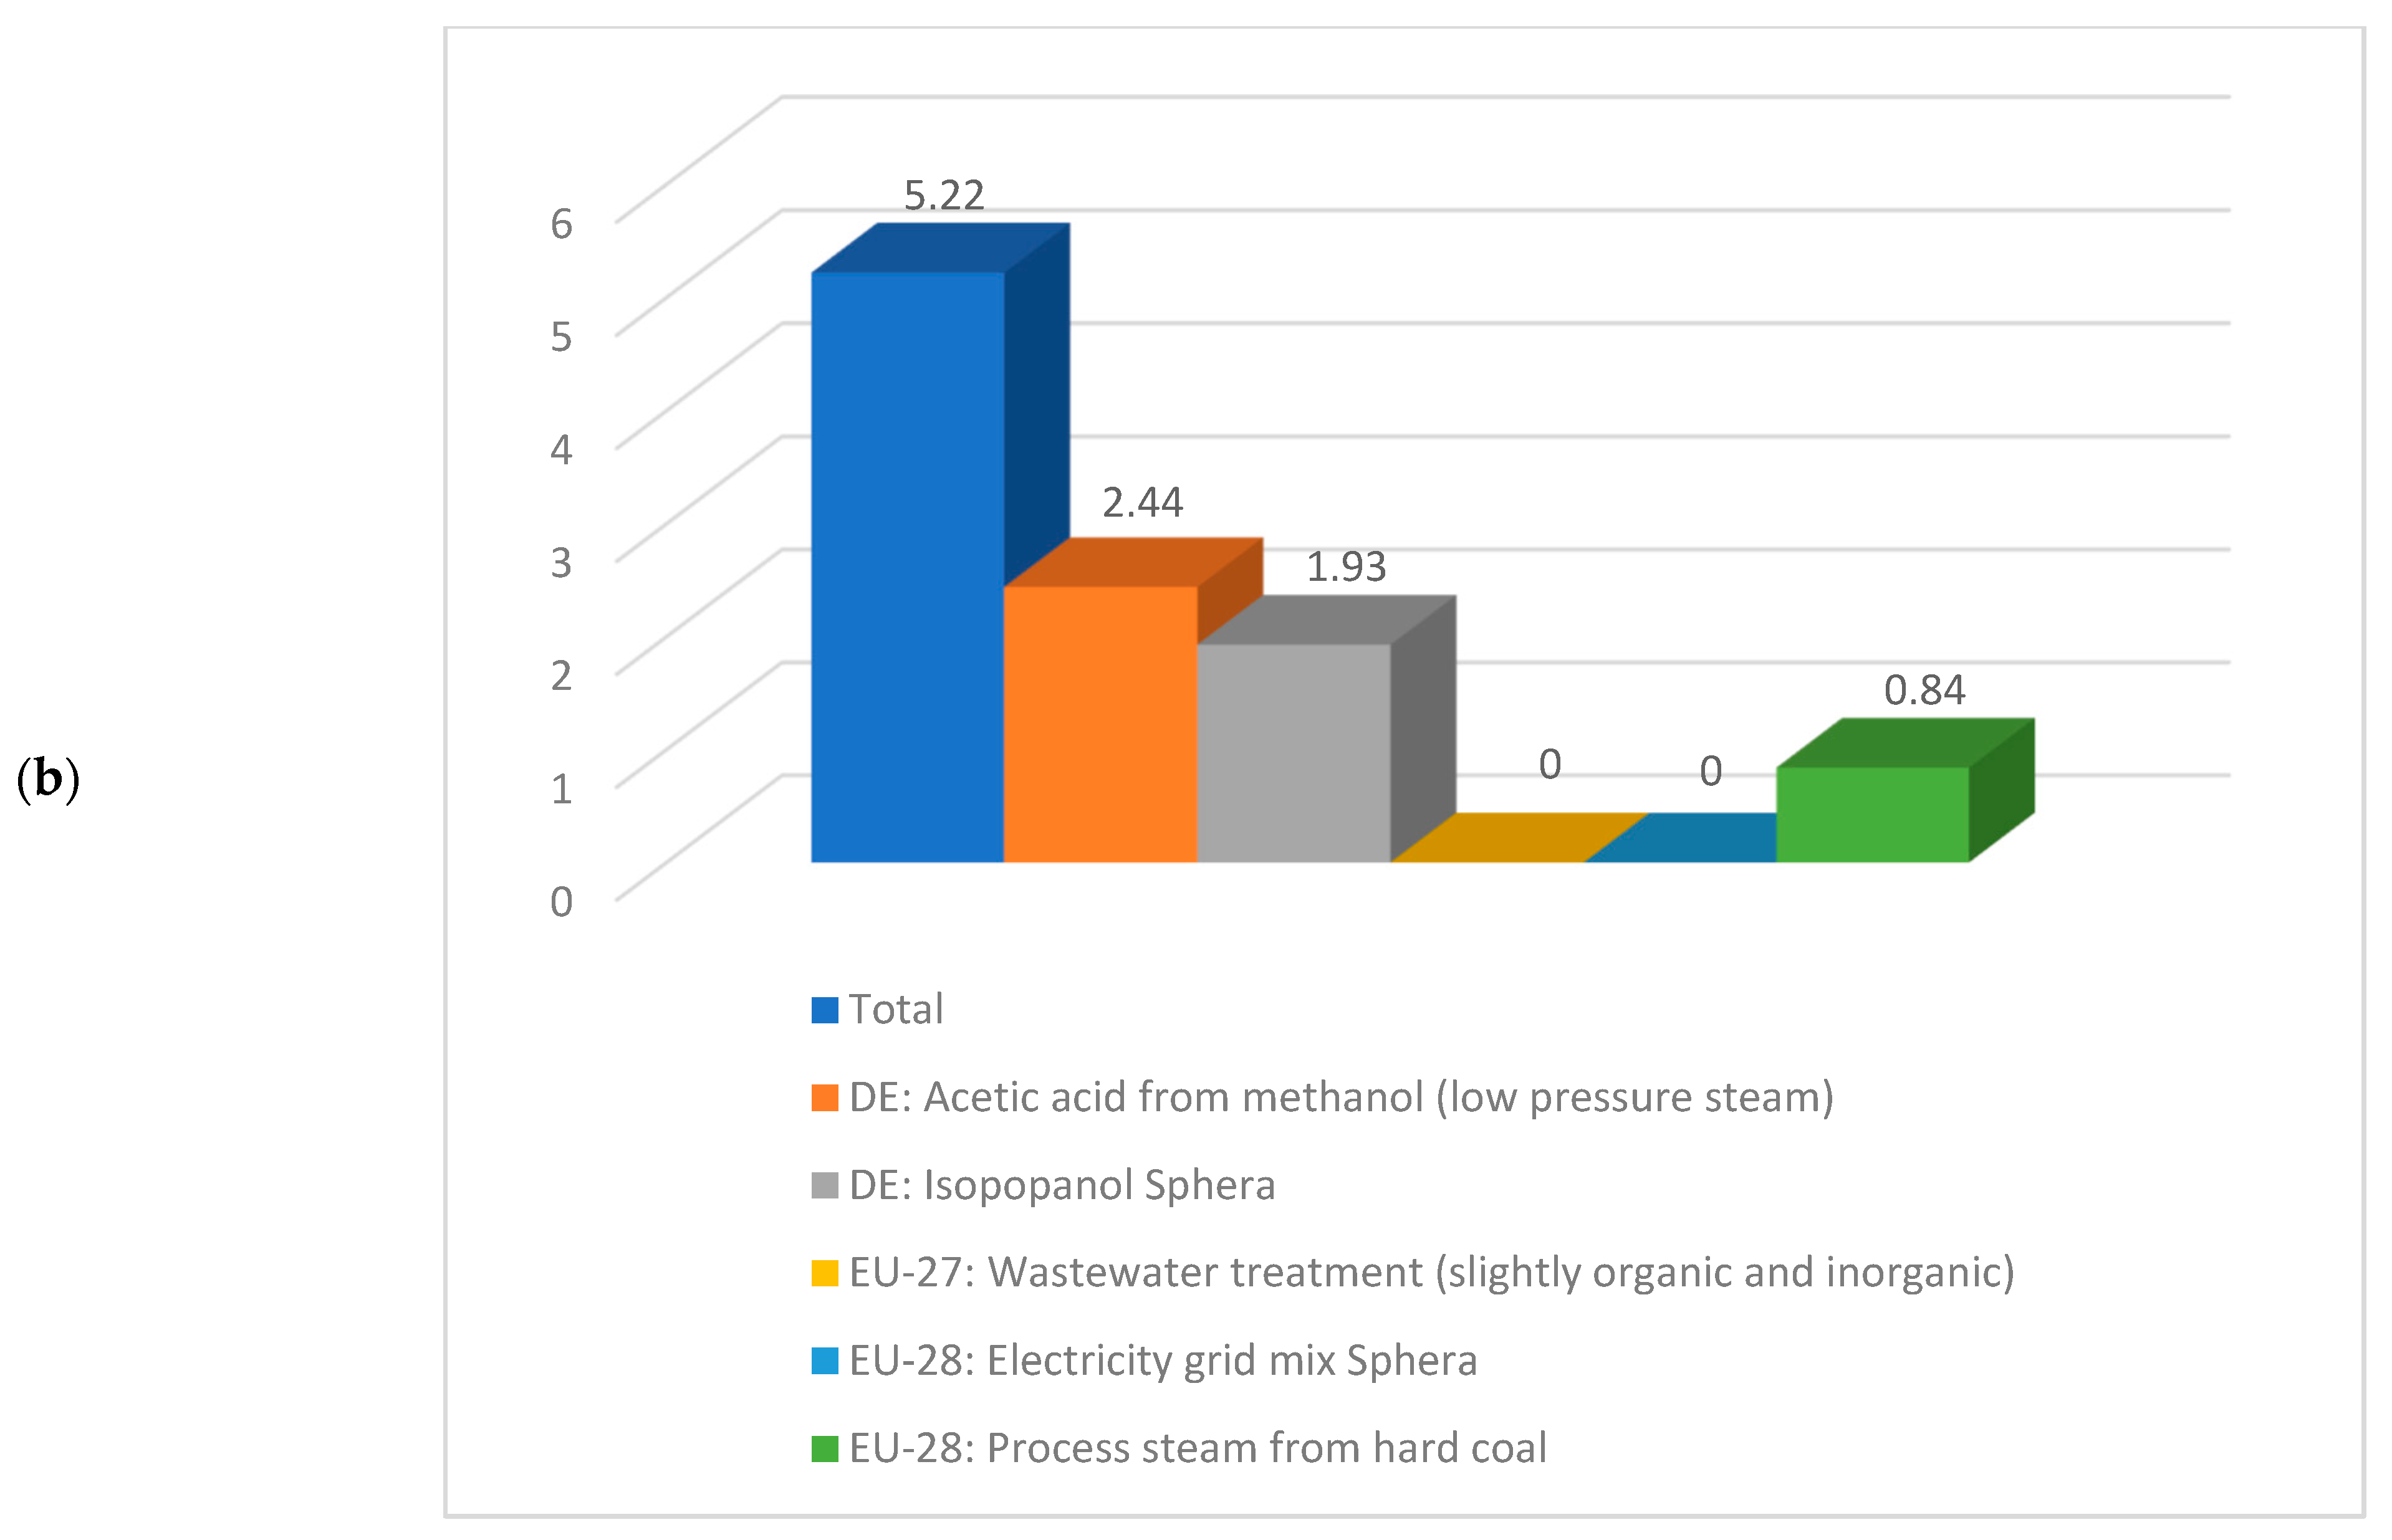
| GWP | kg CO2 eq./kg acetic acid | 5.22 | 5.12 | 5.12 | 4.93 | 4.41 |
| FEP | 10−5 × kg P eq./kg acetic acid | 0.84 | 0.86 | 0.85 | 0.84 | 1.66 |
| ODP | 10−12 × kg CFC-11 eq./kg acetic acid | 2.89 | 2.89 | 2.89 | 2.89 | 2.89 |
| FDP | kg oil eq./kg acetic acid | 3.66 | 3.69 | 3.71 | 3.71 | 3.46 |
| FETP | 10−3 × kg 1,4-DB eq./kg acetic acid | 2.13 | 2.17 | 2.17 | 2.12 | 2.19 |
| HTP | kg 1,4-DB eq./kg acetic acid | 0.29 | 0.31 | 0.30 | 0.29 | 0.29 |
| MDP | 10−2 × kg Fe eq./kg acetic acid | 2.94 | 2.81 | 2.81 | 3.01 | 2.83 |
| POFP | 10−2 × kg NMVOC eq./kg acetic acid | 0.96 | 0.97 | 0.96 | 0.89 | 0.94 |
| TETP | 10−4 × kg 1,4-DB eq./kg acetic acid | 2.88 | 2.99 | 2.97 | 2.96 | 2.86 |
| WDP | 10−2 × m3/kg acetic acid | 2.34 | 2.35 | 2.35 | 2.49 | 4.37 |
| METP | 10−3 × kg 1,4-DB eq./kg acetic acid | 0.66 | 0.72 | 0.73 | 0.64 | 0.67 |
| MEP | 10−3 × kg N eq./kg acetic acid | 2.31 | 2.29 | 2.28 | 2.02 | 2.40 |
Publisher’s Note: MDPI stays neutral with regard to jurisdictional claims in published maps and institutional affiliations. |
© 2022 by the authors. Licensee MDPI, Basel, Switzerland. This article is an open access article distributed under the terms and conditions of the Creative Commons Attribution (CC BY) license (https://creativecommons.org/licenses/by/4.0/).
Share and Cite
Petrescu, L.; Cormos, C.-M. Classical and Process Intensification Methods for Acetic Acid Concentration: Technical and Environmental Assessment. Energies 2022, 15, 8119. https://doi.org/10.3390/en15218119
Petrescu L, Cormos C-M. Classical and Process Intensification Methods for Acetic Acid Concentration: Technical and Environmental Assessment. Energies. 2022; 15(21):8119. https://doi.org/10.3390/en15218119
Chicago/Turabian StylePetrescu, Letitia, and Codruta-Maria Cormos. 2022. "Classical and Process Intensification Methods for Acetic Acid Concentration: Technical and Environmental Assessment" Energies 15, no. 21: 8119. https://doi.org/10.3390/en15218119