Article

Inhibition Mechanism of EMIM-Cl to Methane Gas Hydrate by Molecular Dynamics Simulation

1
School of Petroleum Engineering, China University of Petroleum (East China), Qingdao 266580, China
2
CNOOC, Offshore Oil Engineering, Co., Ltd., Tianjin 300451, China
*
Author to whom correspondence should be addressed.
Energies 2022, 15(21), 7928; https://doi.org/10.3390/en15217928
Submission received: 30 September 2022 / Revised: 18 October 2022 / Accepted: 21 October 2022 / Published: 25 October 2022
(This article belongs to the Special Issue Novel Approaches for Natural Gas Hydrate)

Abstract

:
Deep-water gas well testing is a key technology for obtaining reservoir production and physical property parameters. However, gas hydrates could easily form and cause blockage in the low-temperature and high-pressure environment on the seafloor. Therefore, it is extremely important to inhibit hydrate growth in deep-water operations. Ionic liquid is a type of hydrate inhibitor with both thermodynamic and kinetic effects. However, its intrinsic inhibiting mechanism is still unclear. By using molecular dynamics simulation, the growth process of methane hydrate in the 1-ethyl-3-methylimidazole chloride (EMIM-Cl)-containing system at the pressure of 15 MPa and temperature of 273.15 K was studied. The system energy and angular order parameters (AOP) were extracted as the evaluation indicators. It was found that the time for the complete growth of methane hydrate in the EMIM-Cl-containing system was about 10 ns, longer than that in the pure water, indicating that EMIM-Cl showed an obvious inhibition effect to hydrate growth. The results also implied that the joint action of hydrogen bond and steric hindrance might be the inhibition mechanism of EMIM-Cl. Some six-membered rings in hydrate crystal large cage structures evolved from five-membered rings under the effect of EMIM, which partly contributed to the delay of hydrate formation.

1. Introduction

Deep-water testing is necessary for offshore oil and gas development [1]. Under the high pressure and low temperature of deep-water wellbore, natural gas hydrate can easily form in large quantities during the gas well testing process, which may directly block important positions such as underwater wellheads and safety valves [2]. Generally, the principle of the thermodynamic inhibitor is to change the thermodynamic equilibrium of the hydrate phase, so that the pressure required for hydrate formation is higher or the temperature is lower, which makes it more difficult for hydrate formation and thus achieves the purpose of hydrate inhibition. Common thermodynamic inhibitors, such as methanol, are injected excessively to achieve hydrate prevention, and the inhibitor amount sometimes even exceeds 60% of wellbore water content [3,4]. The great quantity of inhibitor injection is accompanied by problems including high cost, great difficulty, and many restrictive factors may also destroy the original marine environment. Another common hydrate inhibitor is kinetic inhibitor; kinetic inhibitors do not change the phase equilibrium conditions of hydrate formation, but avoid hydrate blockage mainly by prolonging the induction time of hydrate nucleus formation and reducing the growth rate of gas hydrate. The kinetic inhibitors, also known as low-dosage inhibitors (LDHIs), have the advantages of a small dosage (0.1–1.0 wt%) and good effect [5,6], but it is extremely easy to fail in the deep-water wellbore and low-temperature environment [7]. Therefore, it is of great significance to optimize the type and injection scheme of the hydrate inhibitor economically, efficiently and environmentally, to ensure smooth promotion of deep-water oil and gas testing.
In recent years, ionic liquid has been regarded as a new kind of hydrate inhibitor [8]. Generally, the cation is an organic ion, and the anion is an ion with greater electronegativity, such as [N(CN)2]−, BF4−, NO3−, Cl−, etc. Ionic liquid not only has thermodynamic inhibition characteristics that can change the phase equilibrium of gas hydrate and make hydrate formation more difficult, but also has kinetic inhibition properties that can delay the growth of natural gas hydrate crystal. In order to explore its comprehensive inhibitory effect, a series of experimental tests were carried out for a variety of ionic liquids. Bavoh [9] summarized the effects of ionic liquids used as gas hydrate inhibitors and discussed all the modeling studies and prediction accuracy of hydrate phase behavior related to ionic liquids. Studies showed that the cation, anion and chain length characteristics of ionic liquids had inhibitory effects on gas hydrate. The inhibition effect on hydrate is more obvious when the liquid ion concentration is 10 wt%. Ul Haq [10] studied that N-ethyl-n-methylmorpholinium bromide, 1-ethyl-3-methyl imidazolium, and 1-ethyl-3-methyl-imidazolium Chloride plasma liquid inhibit methane hydrate and carbon dioxide hydrate. Imidazole ionic liquid has a good inhibitory effect on carbon dioxide and methane hydrate. Asiah [11] was used to evaluate the methane hydrate inhibition performance of three amino acid ionic liquids by differential scanning calorimetry at pressures ranging from 5 to 15 MPa. In addition, amino acid-based ionic liquids can be used as a thermodynamic (THI) and kinetic (KHI) hydrate inhibitor. Menezes [12] studied the 1-butyl-3-methylimidazolium-based ionic liquids inhibiting gas hydrates under different concentrations with an experimental pressure as high as 100 MPa. It is found that [BMIM][Cl] is more effective than [BMIM][Br] and methanol in equimolar aqueous solution. Yasmine [13] studied the influence of EMIM-Cl as an additive on drilling fluid performance, and confirmed the feasibility of applying ionic liquid water-based mud to reduce drilling risks for hydrate deposits in certain degrees. Zare [14] measured methane hydrate phase equilibrium curves of five ionic liquid solutions and compared the inhibitory impression of different ionic liquids on hydrates. Khan [15] studied the interfacial behavior of carbon dioxide hydrate in three ammonium salt-type ionic liquids of 1 wt%, 5 wt% and 10 wt%, respectively, and measured the phase equilibrium conditions under corresponding situations, finding that inhibitory performance on CO2 hydrate was enhanced with increasing concentration of ionic liquids. Richard [16] studied EMIM-Cl inhibitory performance on methane hydrate under the pressure range of 10–20 MPa, finding that inhibitory influence of EMIM-Cl single-component solution might exceed the suppression effect of MEG at high concentrations.
Ionic liquids (ILs) have attracted the substantial attention of researchers owing to high thermal stability, high chemical stability and negligible vapour pressure, which can resolve the volatile and flammable problem of conventional solvent [11]. An increasing number of scholars have proved that ionic liquids have a good inhibitory effect on the growth of gas hydrates through experiments due to their characteristics of thermodynamic and kinetic inhibitors. However, the corresponding inhibition mechanism is still unclear. Molecular dynamics simulation (MD) is a common method to study the microscopic mechanism of interaction between molecules, which is incomparable to conventional experimental methods. Meanwhile, the effects of ionic liquids on hydrate growth by molecular dynamics simulation are rarely studied. Understanding the microscopic mechanism of ILs and hydrate crystal growth by MD is essential for developing desirable ionic liquids hydrate inhibitors. Understanding the microscopic mechanism of inhibitors can provide a necessary reference for the commercial design or selection of hydrate inhibitors. Taking a typical ionic liquid, 1-ethyl-3-methylimidazole chloride (EMIM-Cl), as the research subject, methane hydrate growth process in the pure water and EMIM-Cl-containing system were simulated, respectively, by means of a LAMMPS (Large-scale Atomic/Molecular Massively Parallel Simulator). The mechanism by which EMIM-Cl restrained hydrate growth was revealed through comparison and analysis of system energy, angular order parameters (AOP), and the number of five-membered and six-membered rings.

2. Molecular Model and Simulation Method

Dividing initial configuration into hydrate layer, liquid water layer and methane gas layer during modeling could achieve ideal simulation results [17]. The hydrate phase consists of SI crystal structure. The model contained 1296 molecules, including 1104 water molecules that were described by the TIP4P-EW model [18,19], and 192 methane molecules that were described by the OPLA-AA model [20,21]. The ratio of the two numbers was 5.75, conformed to methane hydrate of SI with full-filling cavities. An EMIM-Cl molecular structure could also be described by the OPLA-AA model, as shown in Figure 1.
We applied the Lennard-Jones potential [22,23,24] to describe interaction between water molecules and methane molecules, as well as the Lorentz–Berthelot mixing rule [25] for interaction parameters. The specific interaction parameters between the molecules [26] are shown in Table 1.
Among them, the reseda ball represented chloride, dark blue represented nitrogen, dark grey represented Carbon, and white represented hydrogen atom.
When the hydrate unit cell structure was constructed, the initial position of the oxygen atom was determined according to X-ray single-crystal diffraction experiment data [27,28,29], and automatically added hydrogen atoms conforming to the rule of Bernal–Fowler [30]. The Velocity–Verlet algorithm was employed to integrate molecule movement [31,32,33,34]. Meanwhile, the water molecule bond length and angle were controlled as 0.9512 Å and 104.52° through the SHAKE algorithm [35]. The truncation radius was set as 9.5 Å [36], and periodic boundary conditions were applied [37,38]. There is one EMIM-Cl molecular unit in the simulation cell.

3. Results and Discussion

3.1. Methane Hydrate Formation under Inhibition Effect of EMIM-Cl

The whole simulation cycle of the methane hydrate growth period in the EMIM-Cl-containing system was 41.2 ns at the pressure of 15 MPa and temperature of 273.15 K. The whole simulation process is divided into two parts: a methane gas dissolution process and hydrate growth process. The process of dissolving gas molecules into the interface between clathrate hydrates and water molecules through liquid water was described in detail, and the process of methane and water molecules from disorder to order at the solid–liquid interface were also recorded, as shown in Figure 2. It was observed that dissolution of methane gas molecules followed the whole simulation cycle. Driven by the concentration difference, methane molecules continued to dissolve into water molecules. The methane molecules that dissolved first were trapped by water molecule cages to form hydrate crystals. Finally, methane molecules and water molecules diffused into each other until they were evenly distributed, and the gas–liquid interface disappeared.
Among them, red represented hydrogen, yellow represented chloride, dark blue represented nitrogen, blue represented methane molecule, and the red lines represented hydrogen bonds. Methane hydrate from 0 ns began to grow. They entered into the rapid growth period from 33.4 ns and kept forming until 41.2 ns. It was believed that the diffusion effect could promote a gradual increase of methane concentration between water molecules, which blurred the gas–liquid interface at the macro level and enhanced the gas–liquid contact at the micro level. Combining with the previous findings that guest molecule concentration was a key factor driving hydrate nucleation and significantly affected the nucleation rate [39], the mechanism of hydrate rapid growth in this time difference of 7.8 ns could be explained.
The formation process of methane hydrate was simulated in a pure water system under the same conditions. The average growth rate of gas hydrate is the total length of hydrate cell growth divided by the total length of hydrate growth time. It was found that the average growth rate of gas hydrate was 6.92 Å/ns in the pure water system, and 4.49 Å/ns in the EMIM-Cl-containing system, indicating that the addition of EMIM-Cl could meaningfully reduce the methane hydrate cell growth rate.

3.2. System Energy Variations

The formation process of gas hydrate released heat to reduce system energy, while the dissociation process of gas hydrate absorbed heat to increase system energy [40,41,42]. Therefore, energy system changes could be used to reflect the hydrate phase transition to a certain extent. Along with the proceeding of simulation, system potential energy gradually decreased, indicating that gas hydrate continued to form. The greater the reduce slope was, the faster the hydrate formation was. Eventually, the system energy tended to be flat, suggesting that the hydrate growth was stagnant and the methane hydrates almost completely formed [43].
The system energy changed during the growth of methane hydrate in the pure water system and the EMIM-Cl-containing system, as shown in Figure 3. Two fitting curves generally tended to decrease, indicating that gas hydrate crystal was formed in both systems. The system energy in the pure water system declined steadily in 0–23 ns and then became steep, proving that the hydrate formation rate was relatively small at first but increased sharply at 23 ns. Similarly, the steep drop time point of system energy in the EMIM-Cl-containing system was 33 ns, indicating that the starting time of methane hydrate rapid formation in the EMIM-Cl-containing system was about 10 ns, later than that in the pure water system under the same conditions. Thus, it was confirmed that the addition of EMIM-Cl significantly prolonged the beginning time of hydrate rapid formation.

3.3. AOP Variations of Water Molecular

Hydrate formation was a process of water and methane molecules from disorder to order, which could be characterized by the order parameter of water molecule. The AOP [44,45] values (Angular Order Parameter) were used to distinguish the liquid and solid phases, which is:
AOP = ∑[(|cosθ| cosθ) + cos2 (109.47°)]2
where θ refers to the angle formed between the oxygen atom of the central water molecule and the oxygen atoms of any two nearby water molecules, °. The cutoff range from the center oxygen atom to the other two atoms is 3.5 Å.
The AOP value of water was 0.8 in the liquid phase, 0.1 in the hydrate phase, and about 0.4 at the interface [46,47]. Therefore, we could use AOP to determine the position of the solid–liquid interface. Generally, hydrate growth rates of two systems could be compared by monitoring the hydrate–water interface movement rate in the Z-axis direction. Accordingly, the hydrate growth area was monitored to characterize the hydrate development rate so as to solve potential problems caused by two hydrate–water interfaces and express the growth of hydrate more accurately, as shown in Figure 4.
Figure 4 shows the variation of methane hydrate growth area with time in the pure water system and the EMIM-Cl-containing system. Both of them gradually increased over time and finally reached the same level, indicating that the final generation amount of gas hydrate was uniform. In the pure water system, the methane hydrate area rose slowly over the period of 6 ns to 23 ns, then quickly over the period of 23 ns to 28 ns, while in the system with EMIM-Cl, methane hydrate area rose slowly over the period of 6 ns to 33 ns, then quickly over the period of 33 ns to 40 ns. As can be seen from the hydrate area curve in Figure 4, the growth process of hydrate in a pure water system is completed within 28 ns, while the growth process of hydrate in a EMIM-Cl-containing system is completed in around 40 ns. The results implied that whether in the stage of a slowly rising hydrate area or quickly rising hydrate area, the period length of a EMIM-Cl- containing system was longer than a pure water system, verifying that EMIM-Cl could extend the methane gas hydrate growth time.

3.4. Inhibition Mechanism of EMIM-Cl to Hydrate Cage Structure

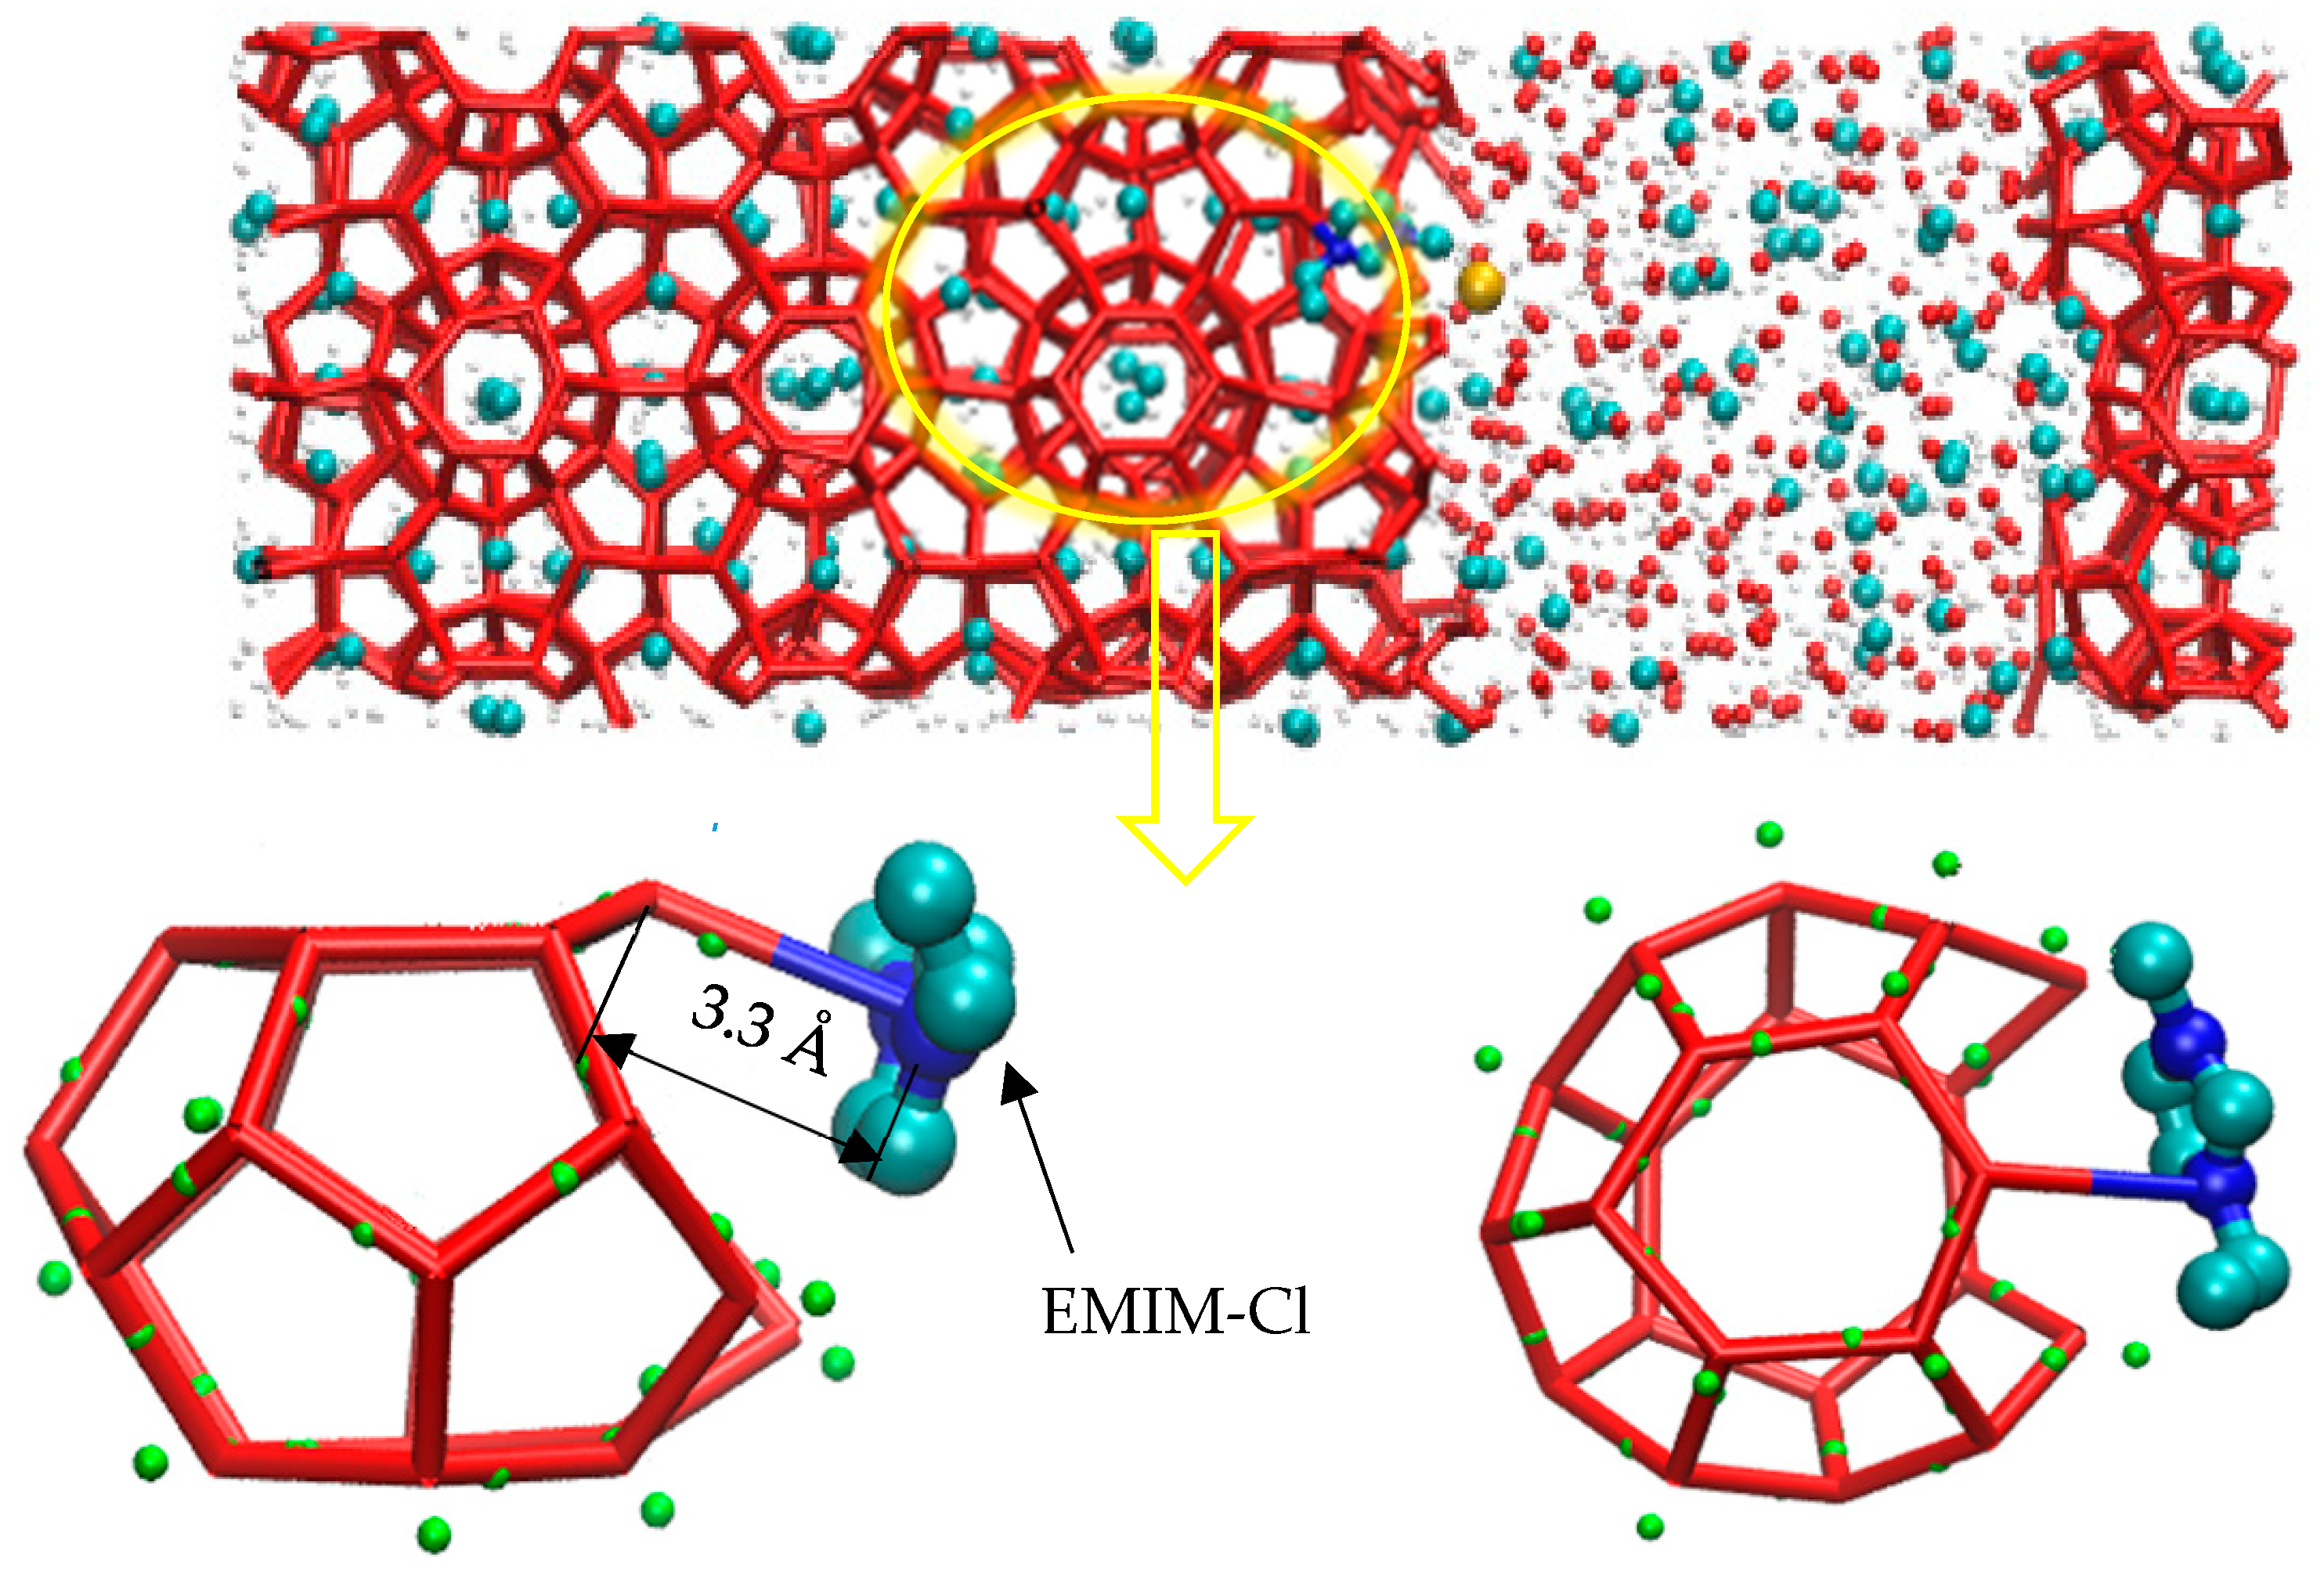
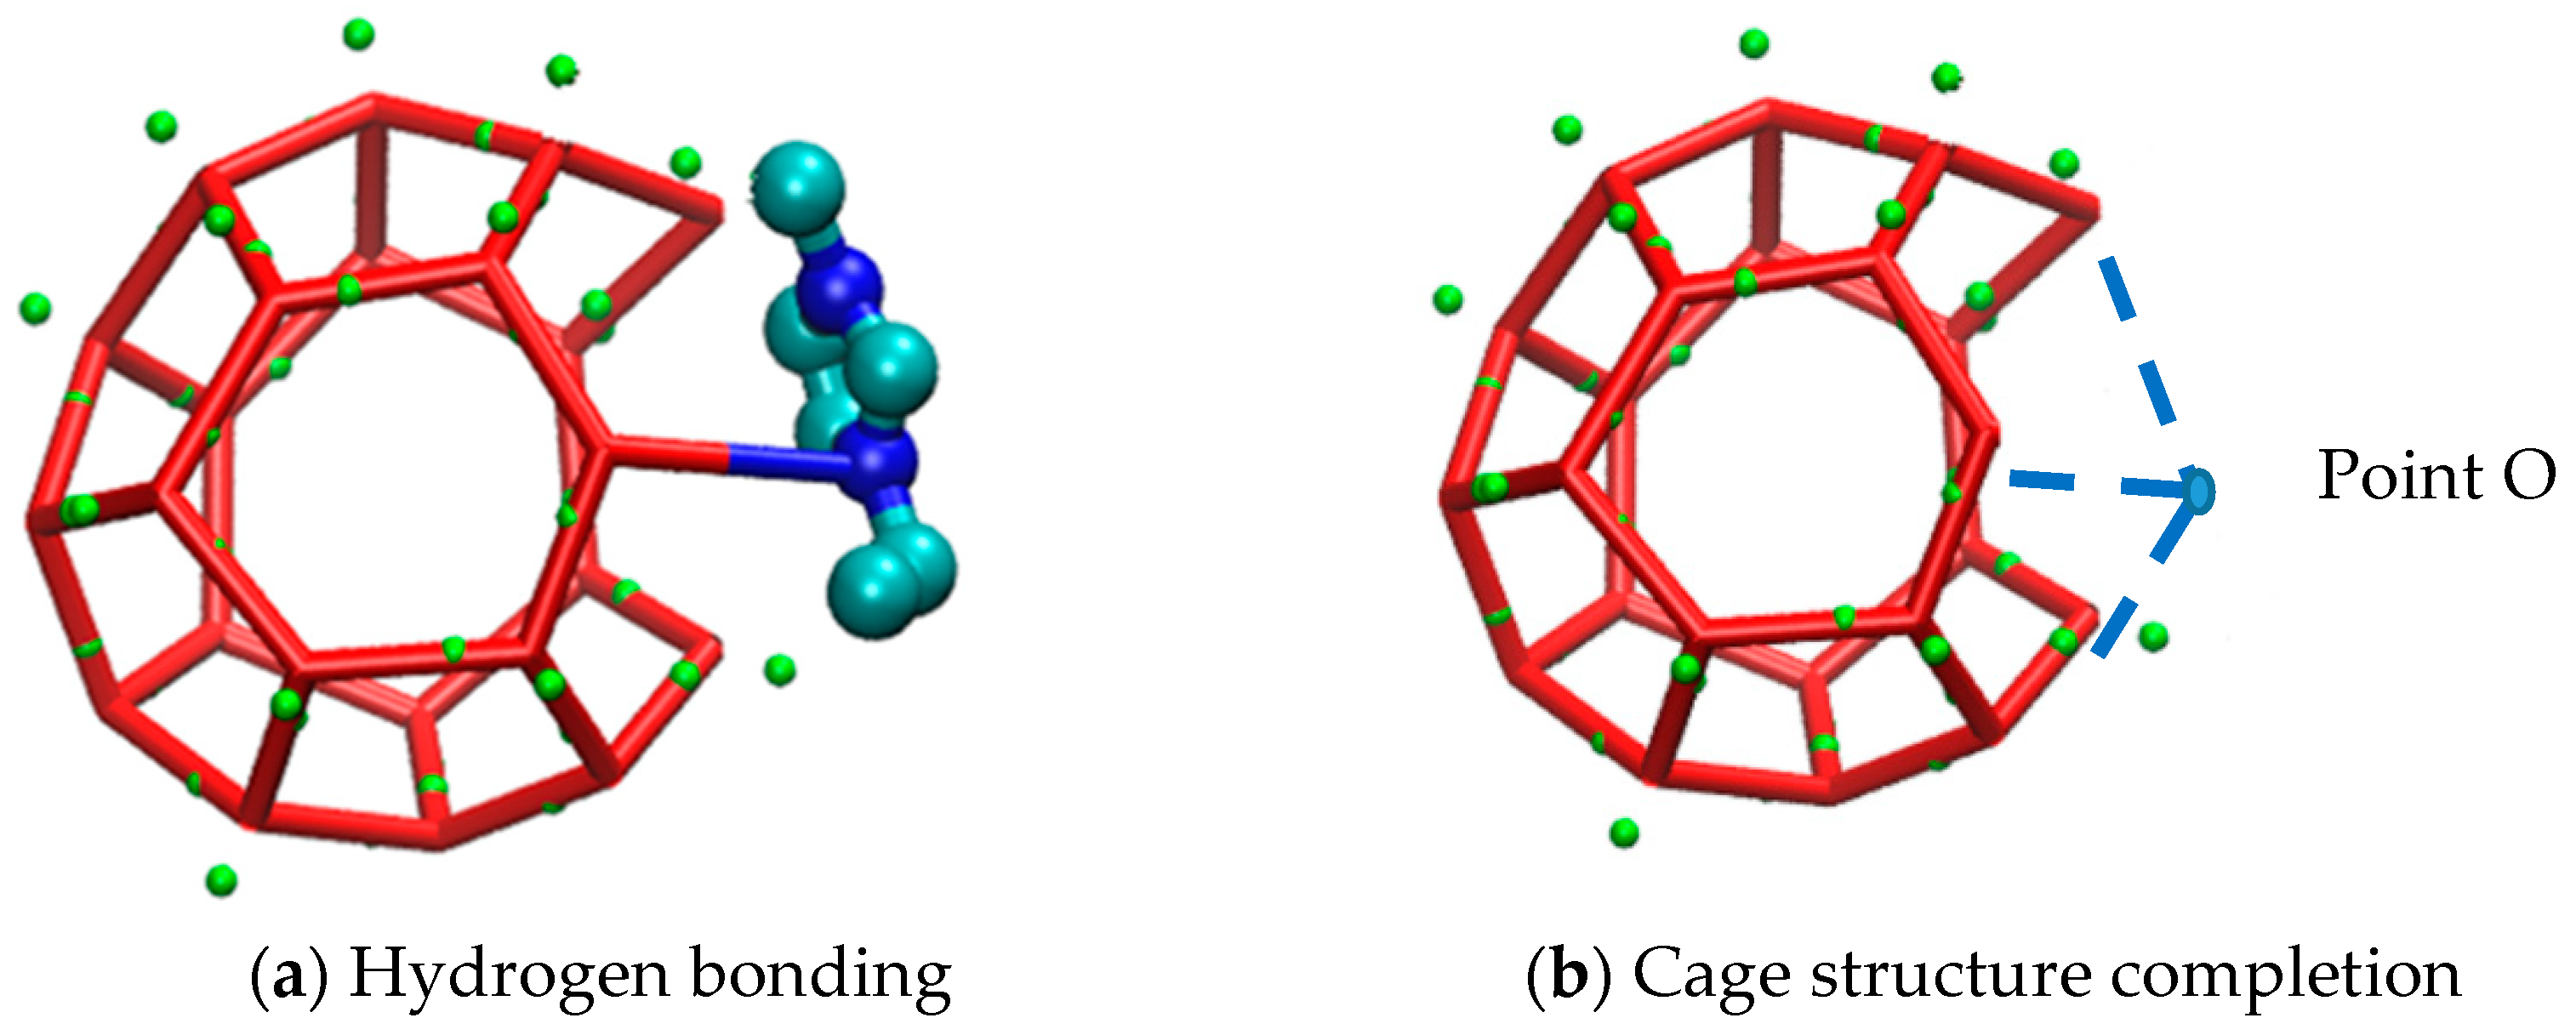
3.4.1. Destruction of Cages by Hydrogen Bonding

According to the study of Luzar [48], the hydrogen bond is defined as the distance between two atoms with greater electronegativity less than 3.5 Å, and the hydrogen bond between nitrogen atoms and water molecules can also be formed by atoms with greater equal electronegativity, such as O-H…N. As shown in Figure 5, molecular dynamics simulation revealed that the hydrogen bond between N-O atoms was 3.3 Å (blue-red key). The N atom on the inhibitor forms a hydrogen bond with the H-O of a water molecule involved in the constituting cage structure. The formation of the hydrogen bond disrupted the hydrogen bond network between water molecules that originally constituted the cage structure, causing local network structure of water and guest molecules to be disordered.
Meanwhile, after the water molecule developed a O-H…N hydrogen bond with an inhibitor molecule, the water molecule cannot form a hydrogen bond with other water molecules through a O-H bond due to the hydrogen bond saturation. Therefore, the hydrate cage would never grow into the complete structure, as shown in Figure 6b. In addition, because of the existence of a O-H…N hydrogen bond, one of the water molecules consisting of a six-membered ring surface in methane hydrate clathrate structure was shifted, as shown in Figure 6c. Although the molecule departed from the horizontal plane of the original six-membered ring at an angle of about 28°, it could still form a hydrogen bond network with other water molecules, participating in the composition of a nearby multiple-cage structure. Since the displacement of this water molecule could lead the related hydrogen bonds length to irregular shapes, correspondingly, the surrounding cage structures deformed at the same time. Therefore, it is believed that hydrogen bond could alter the positions of water molecules and delayed the progress from disorder to order, suppressing the growth of methane gas hydrate to some extent.

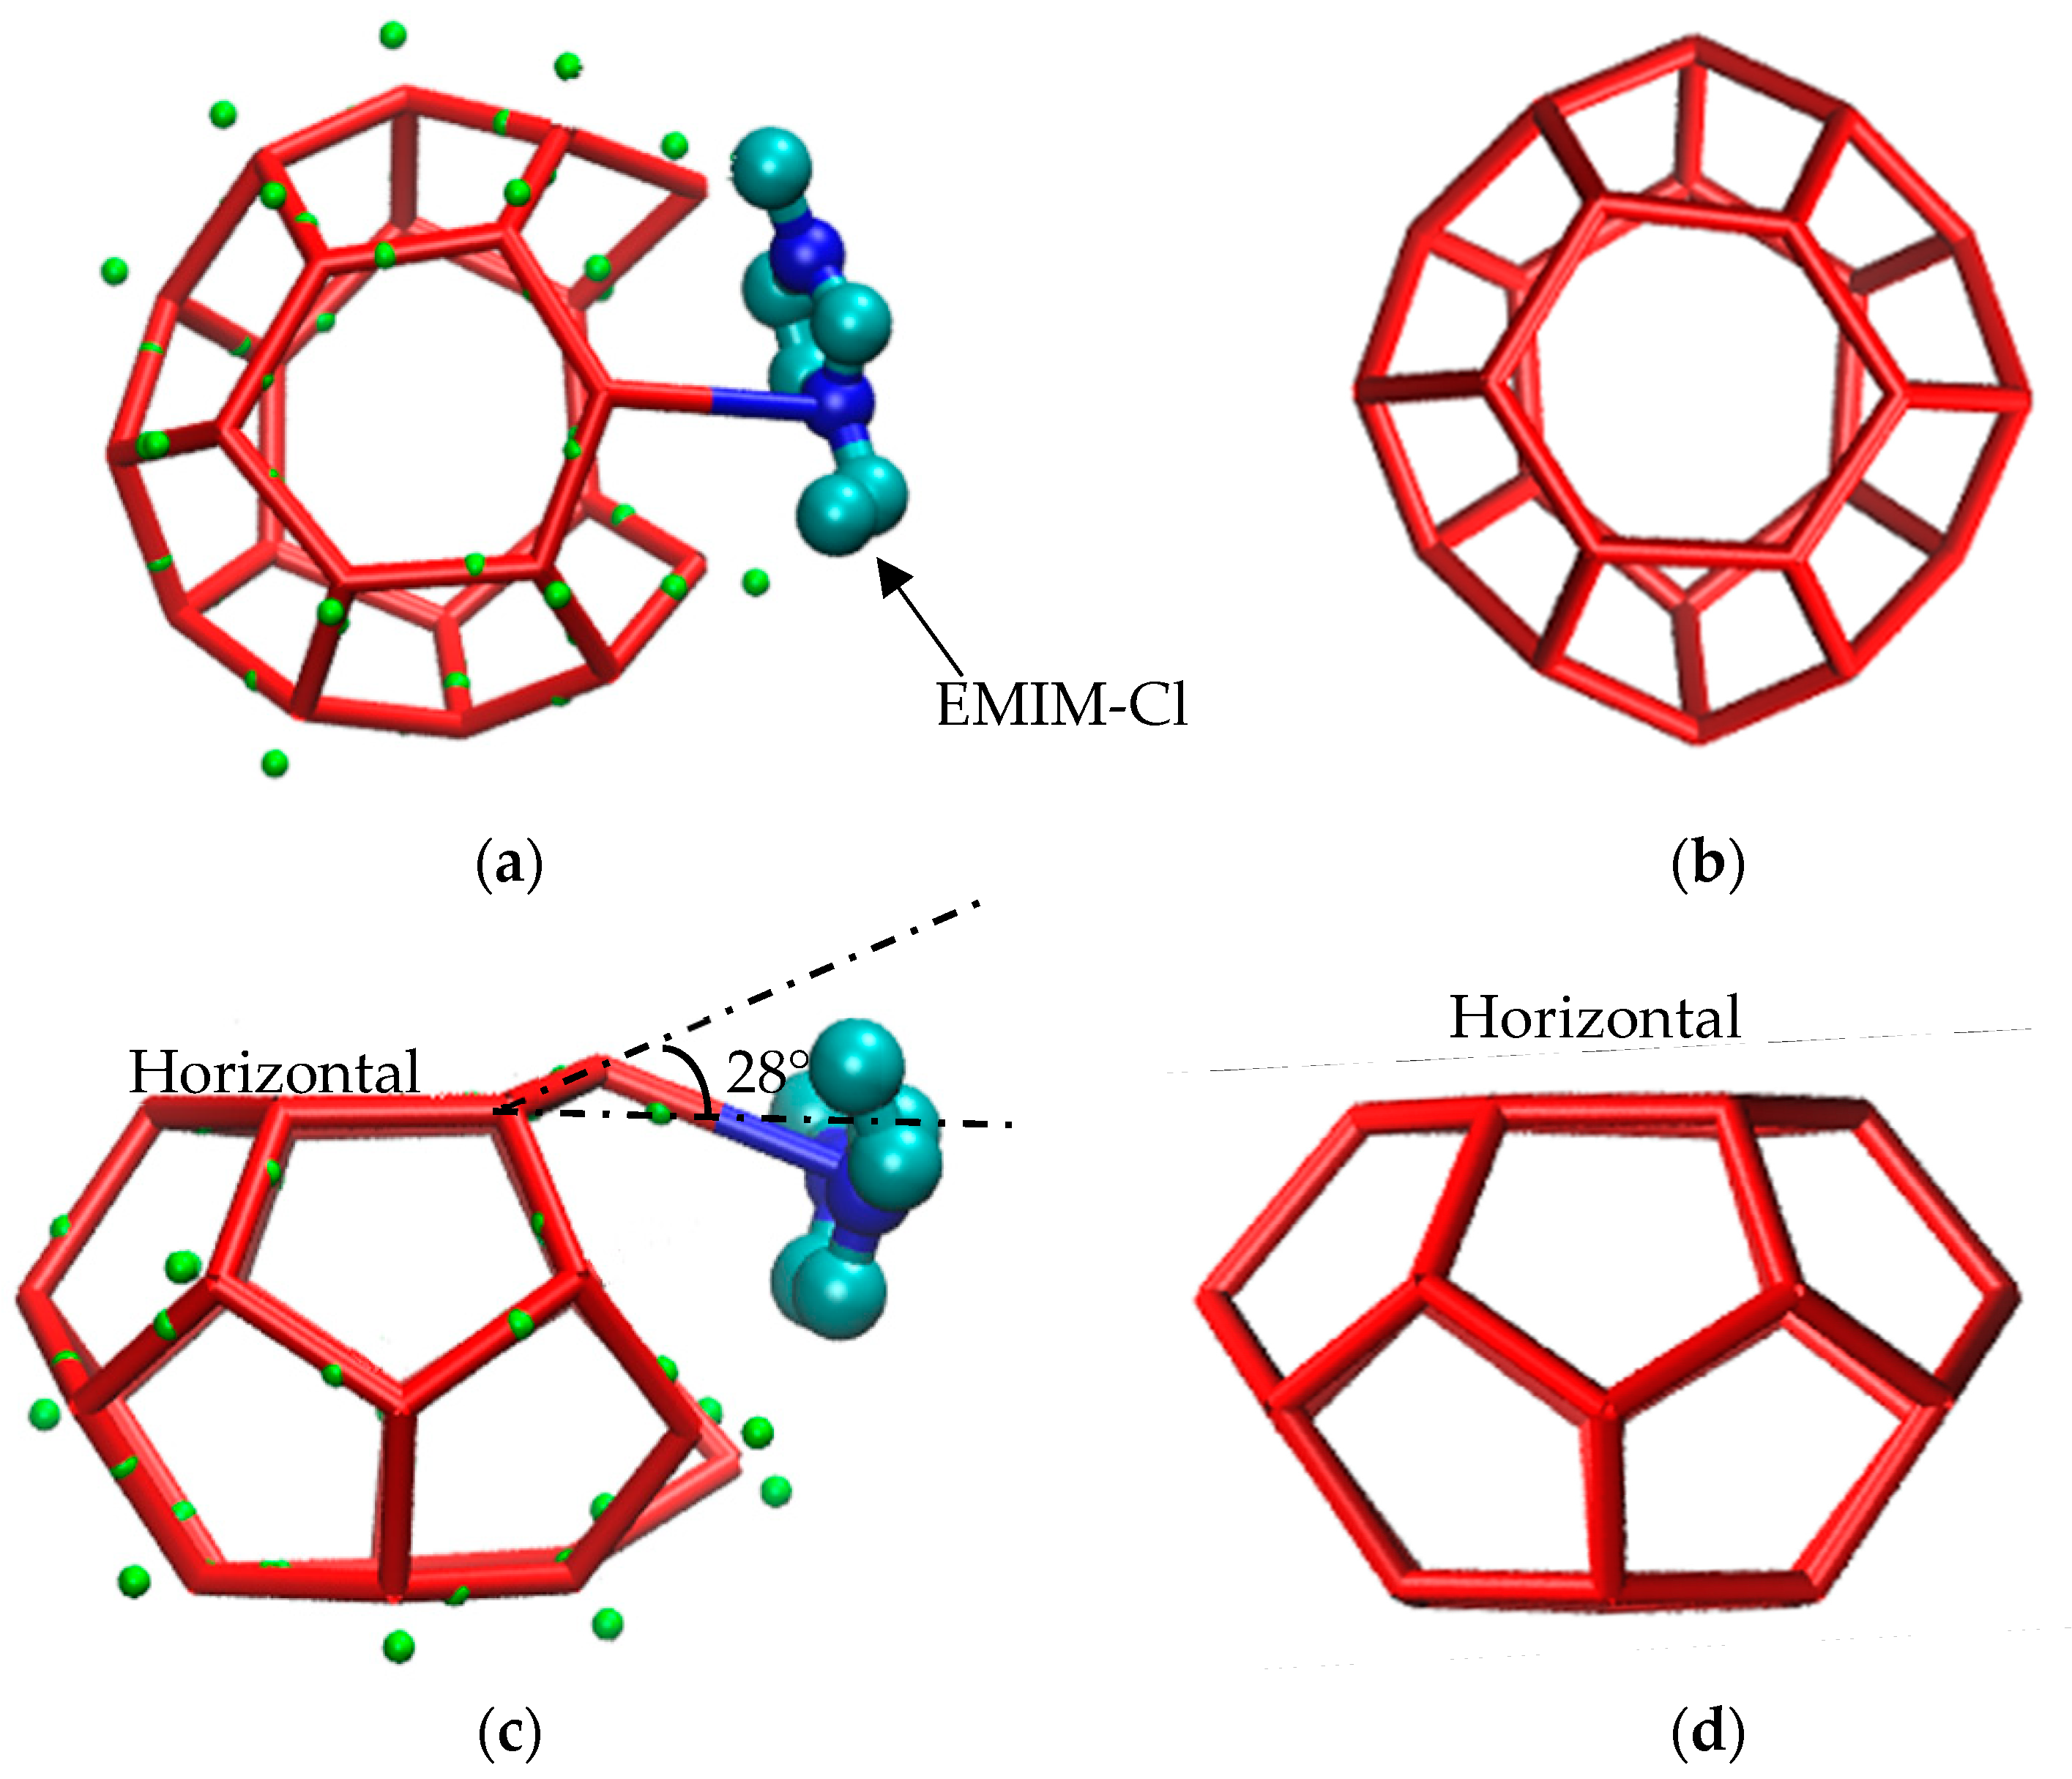
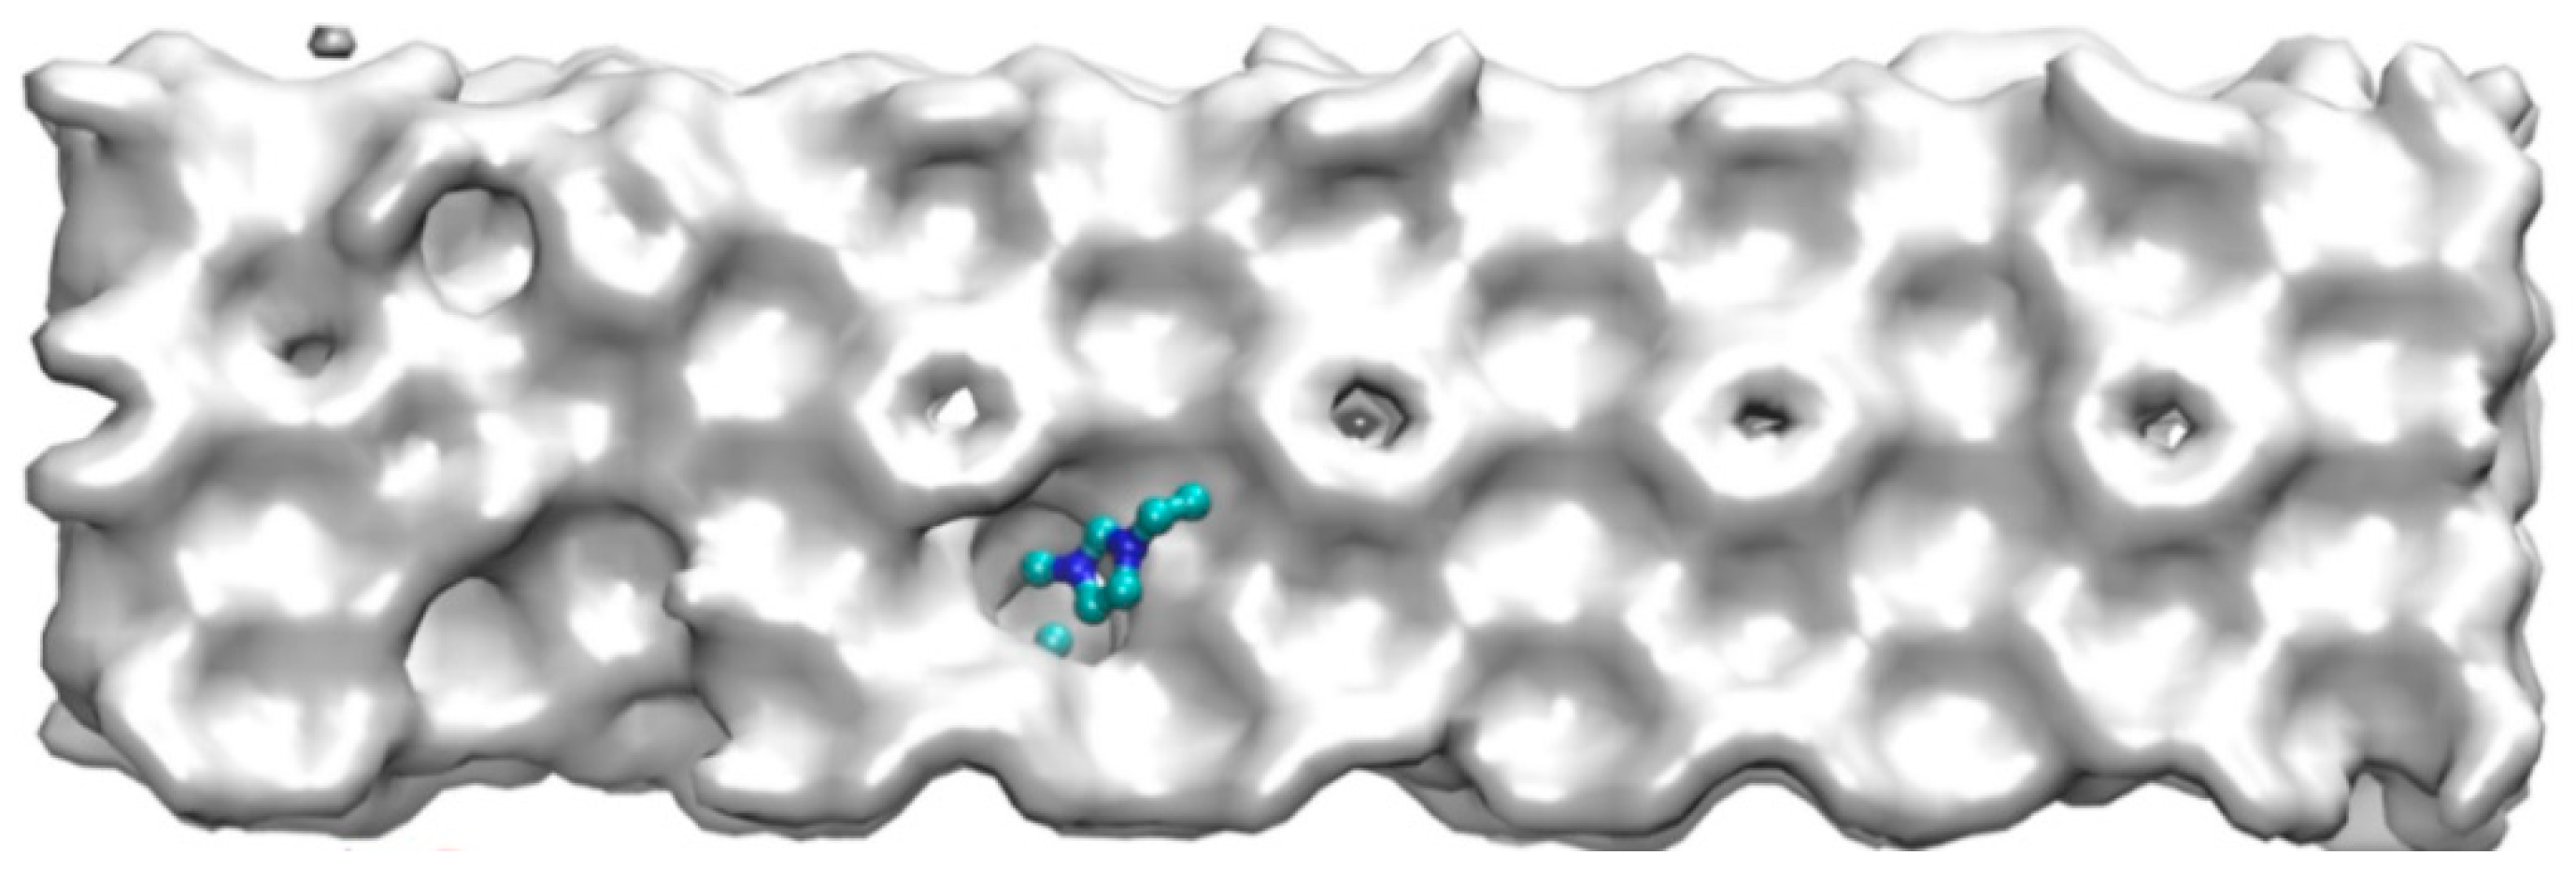
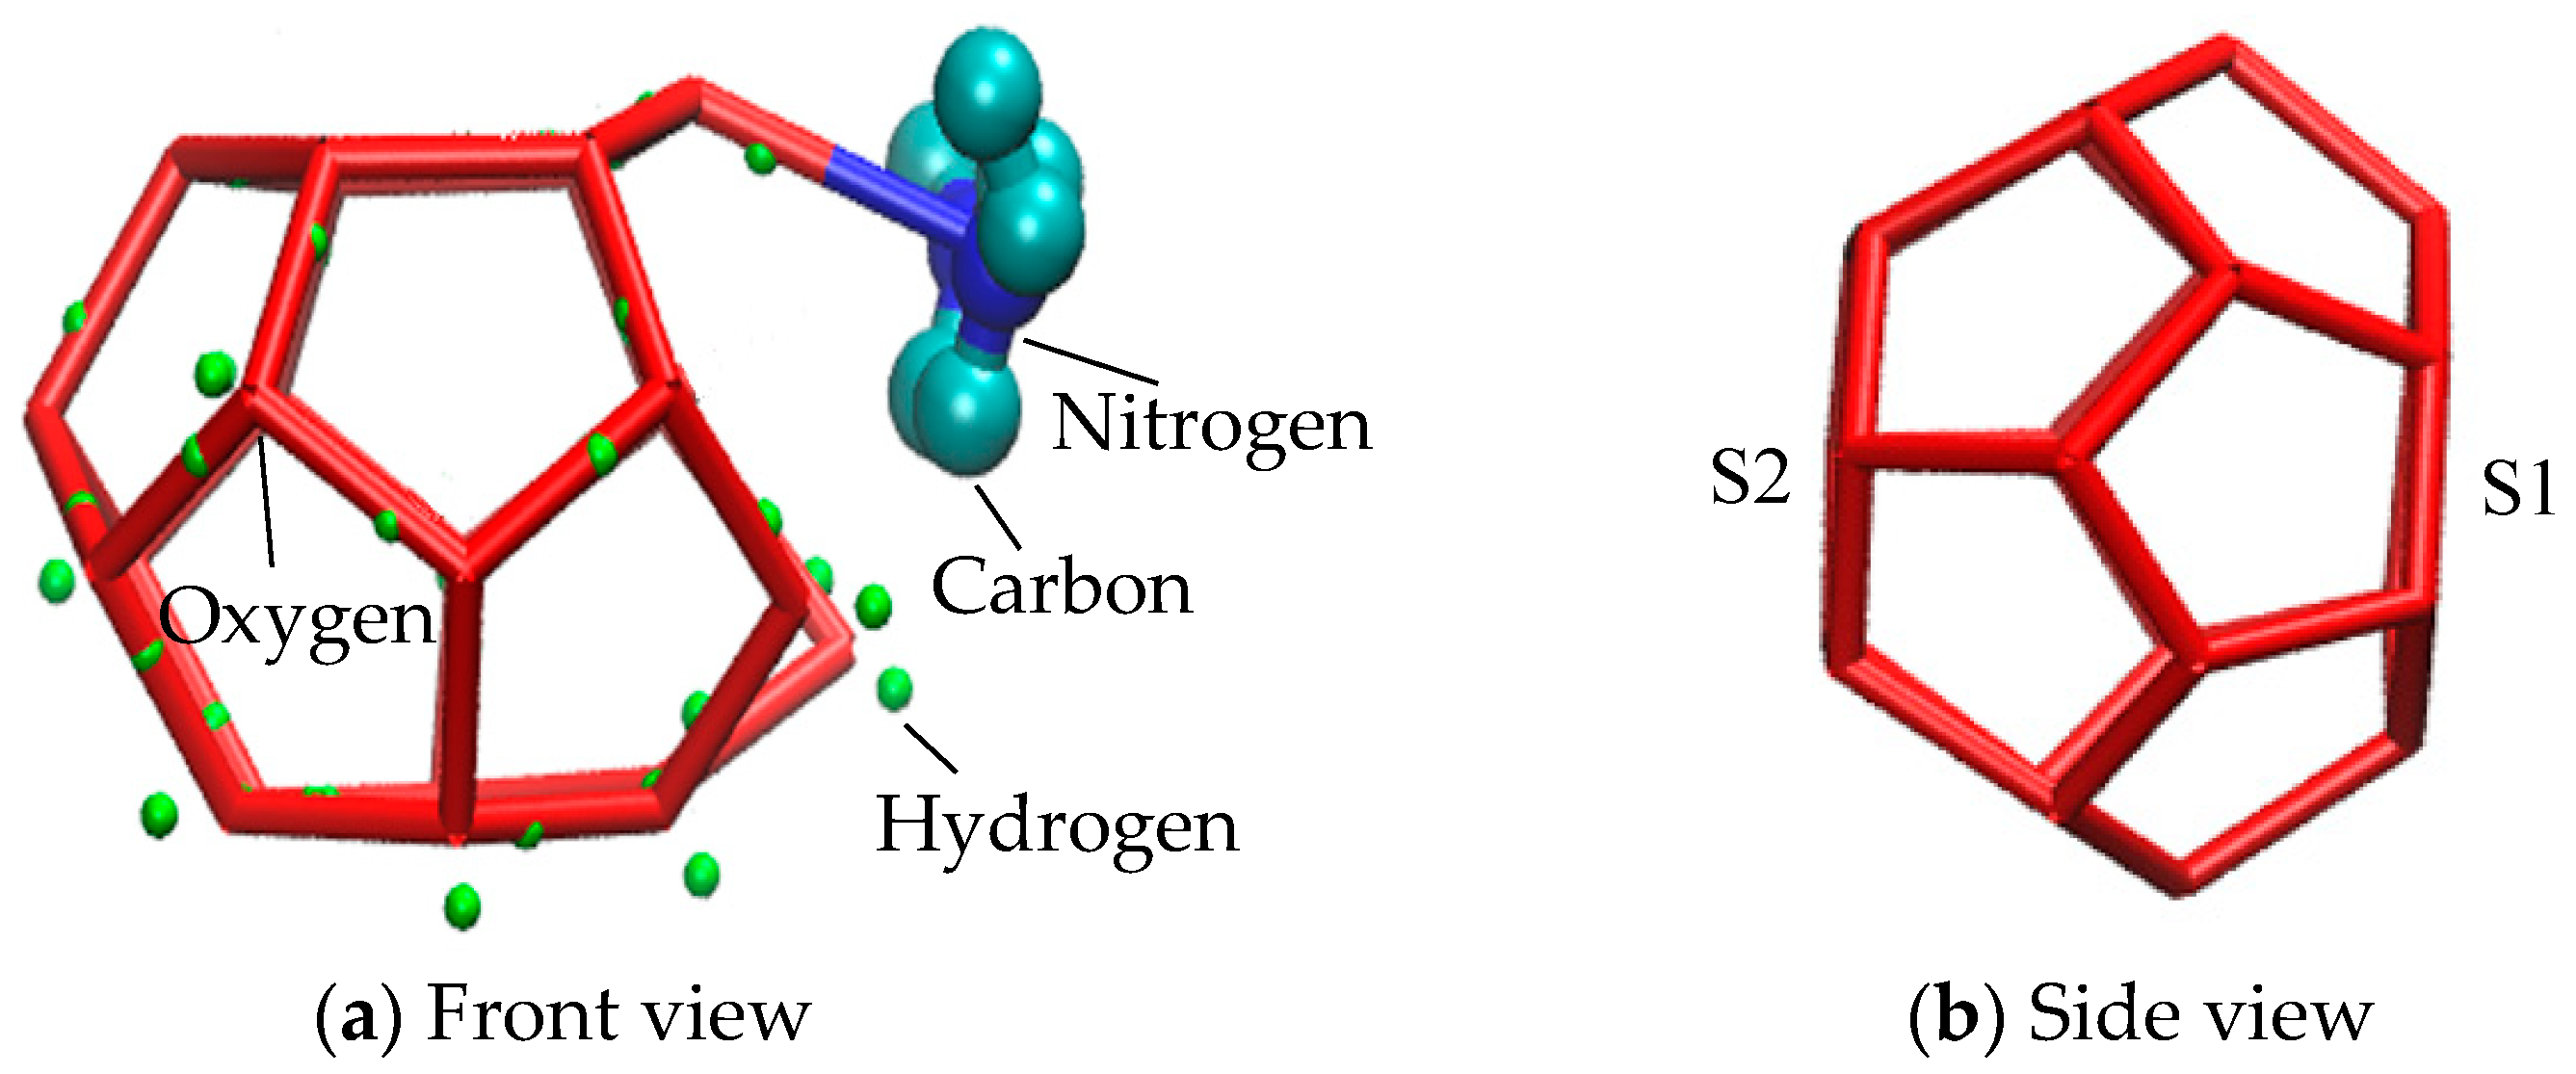
3.4.2. Steric Hindrance Effects of EMIM-Cl

Except from the hydrogen bond destruction mentioned above, EMIM-Cl itself, as a kind of macromolecule, could not enter into the cavities of hydrate cages due to its large molecular volume. Zhang [49] studied organic exclusion during CO2 hydrate growth by molecular dynamics simulation and magnetic resonance imaging observations, and also demonstrated that organic macromolecules (like sodium dodecyl sulfonate) would not enter the caged cavity of the hydrate. Therefore, due to the obstruction of EMIM-Cl molecular volume in the growth process of methane hydrate, the further growth of hydrate is delayed, and steric hindrance is formed. The corresponding macroscopic effect is shown in Figure 7. Meanwhile, the site that prevented water molecules from entering the cage structure would cause cage structure to be incomplete. The corresponding microstructure is shown in Figure 8a.
Figure 8b shows the complete state of the damaged cage structure in Figure 8a. Point O represents the oxygen atom of a water molecule, and the blue dotted lines represent hydrogen bonds. Comparing Figure 8a,b, EMIM-Cl molecule was found to occupy the site (O point) originally belonging to a water molecule. Because of the existence of van der Waals forces between molecules, it was difficult for water molecules to get close to the EMIM-Cl molecule, that is, water molecules could never enter the O point and the cage structure could never be closed due to the presence of EMIM-Cl. In addition, the absence of one water molecule at O point might result in the incompleteness of the surrounding multiple cage structures. As the EMIM-Cl molecule was so large that numerous surrounding sites were occupied like O point, and each deficiency site could simultaneously cause fragmentary of more cage structures, a three-dimensional cavity would appear near the position of inhibitor, which reflected the destruction of EMIM-Cl to surrounding hydrate cages. Due to the large volume of EMIM-Cl, the formation of complete cage-shaped hydrate around EMIM-Cl is also one of the reasons for the slow growth of hydrate.

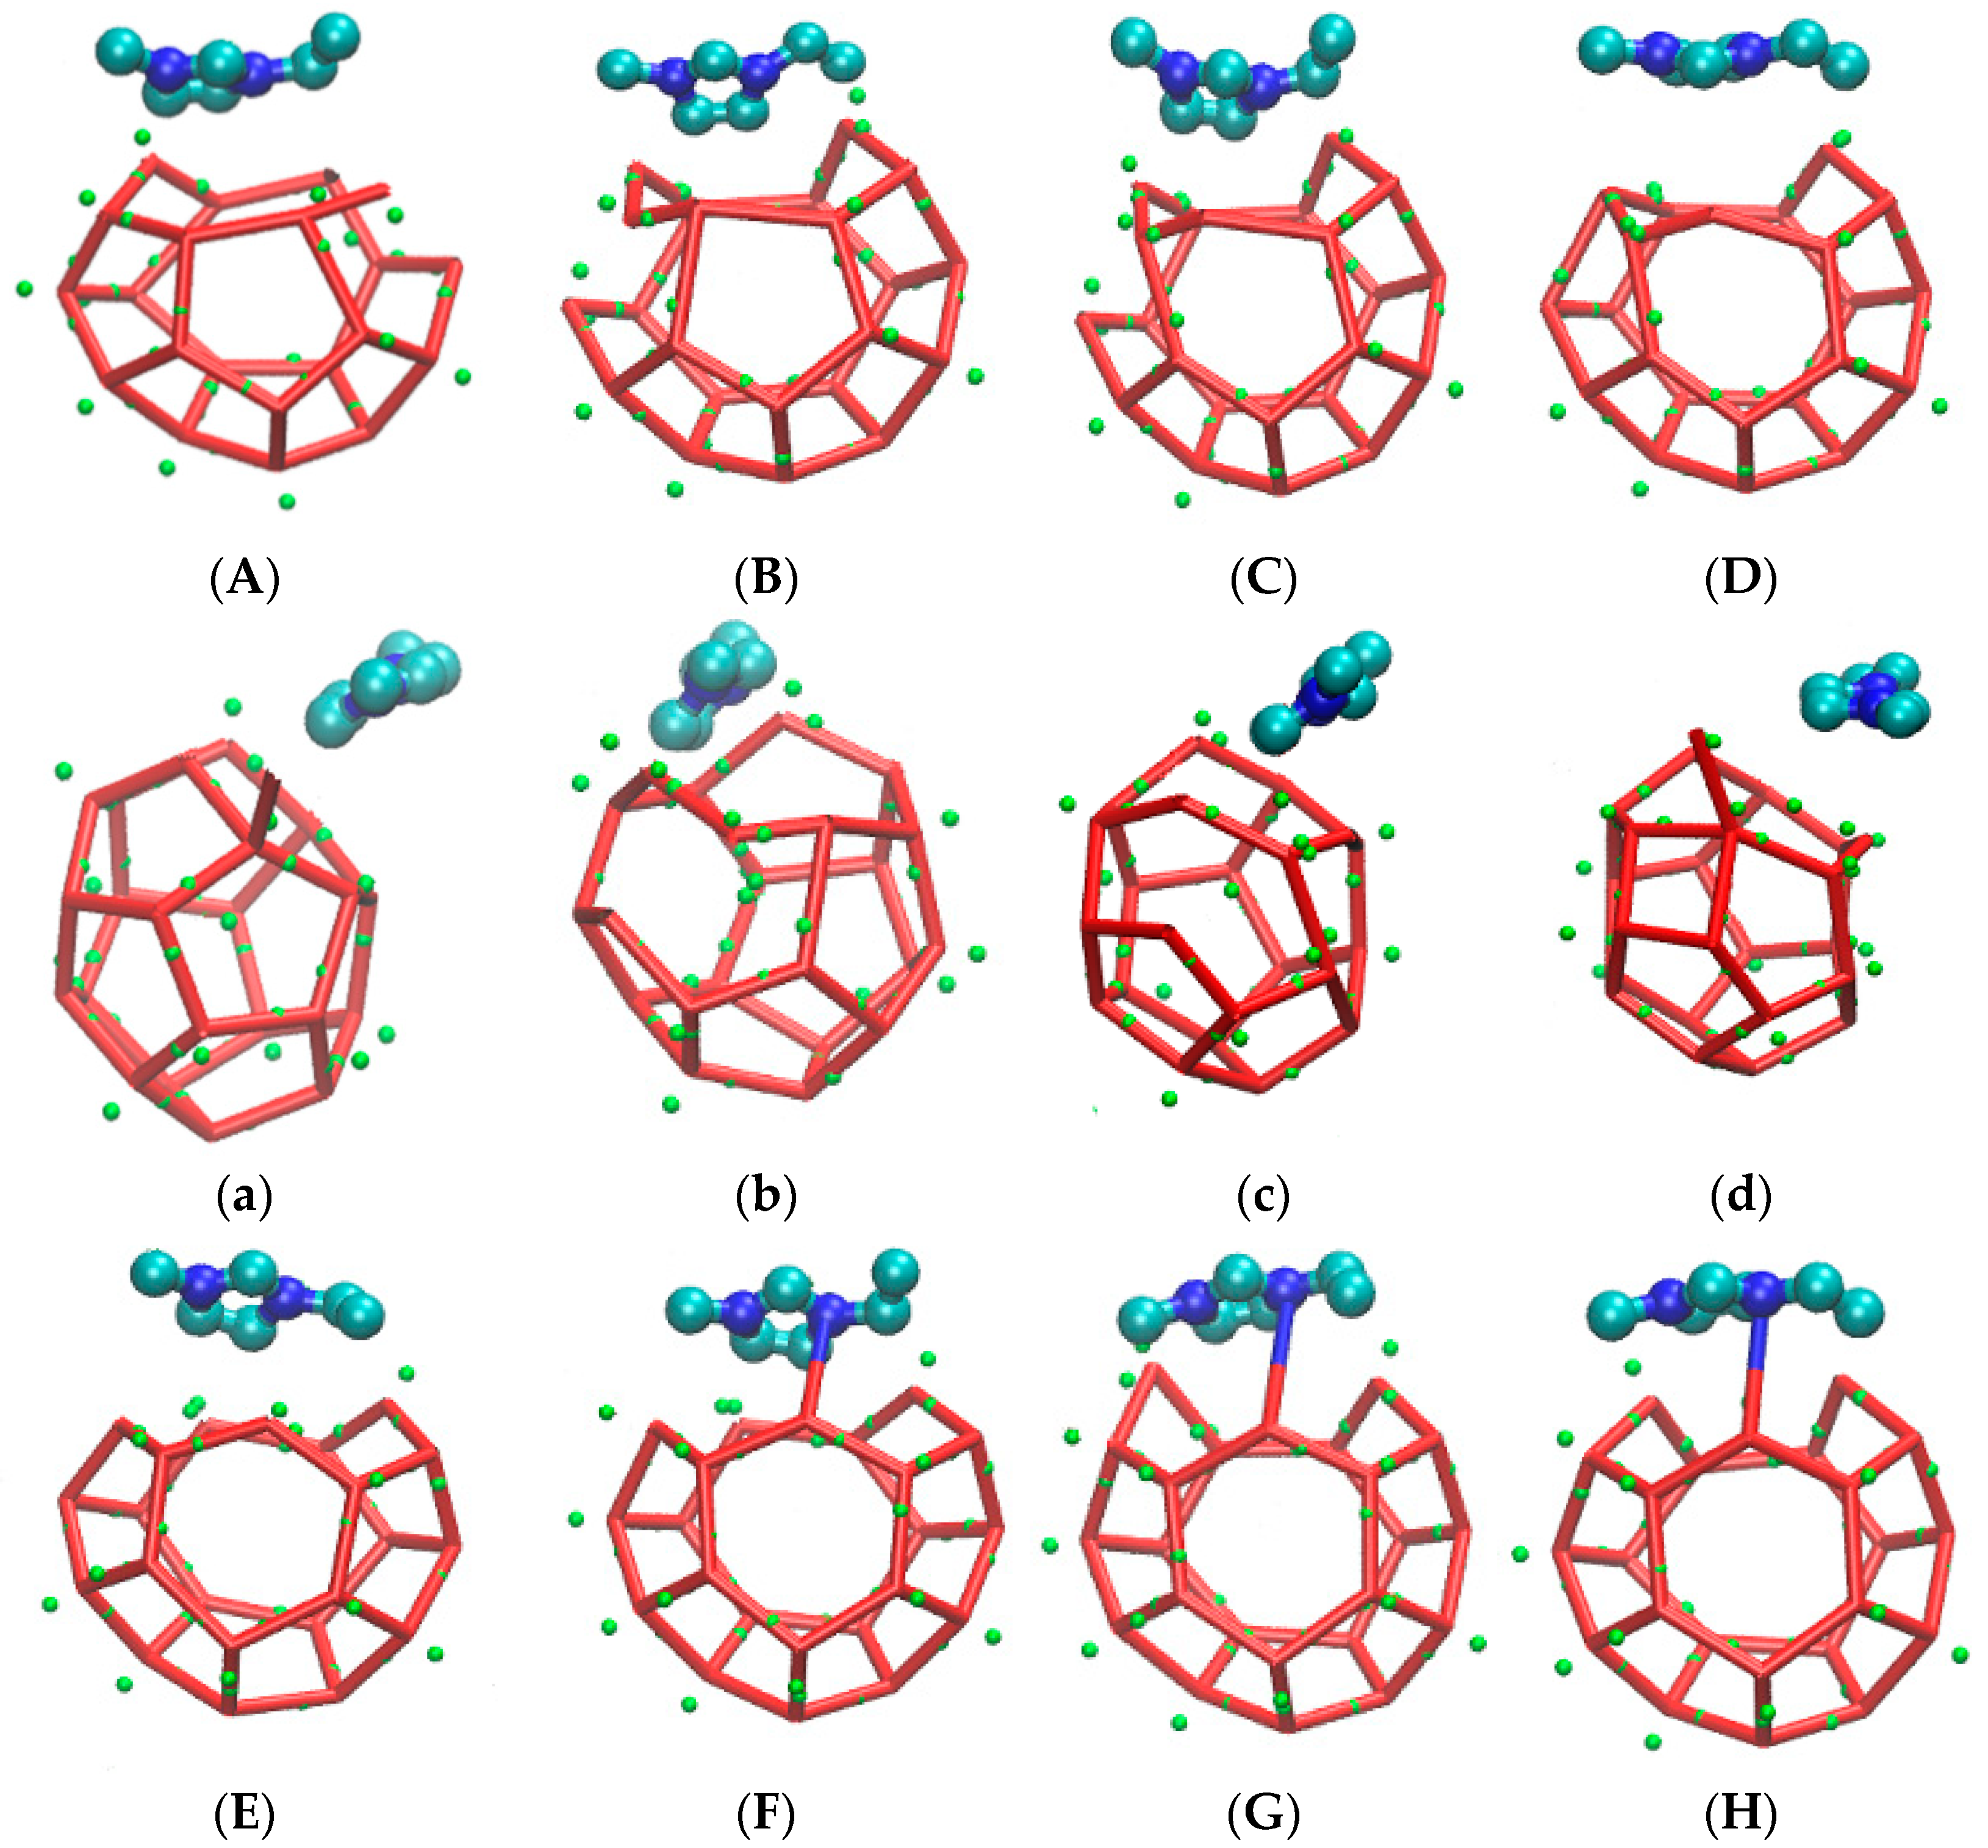
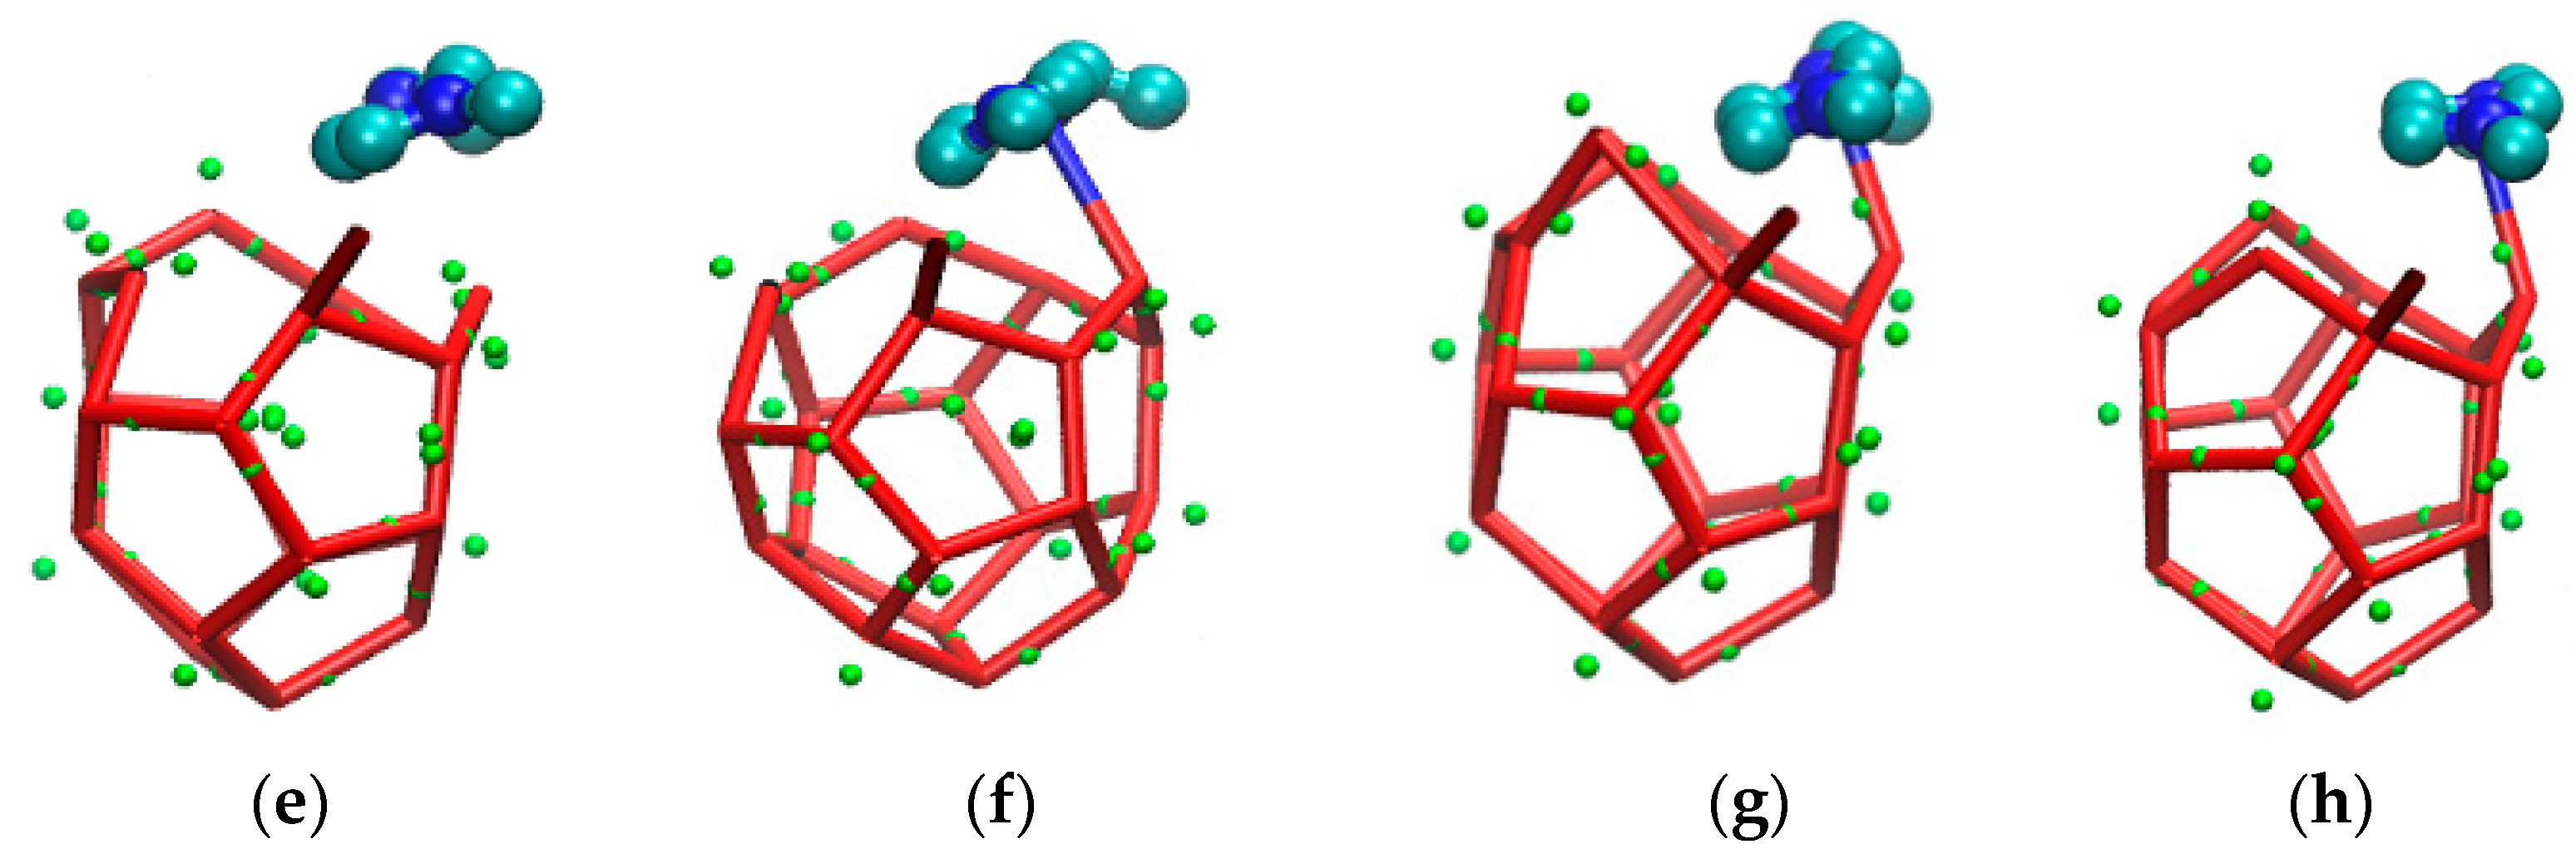
3.4.3. Evolution of Hydrate Incomplete Cage with EMIM-Cl

Methane gas hydrate cell of SI is composed of 512 small cages and 51262 large cages [50,51]. Each large cage structure consists of twelve five-membered rings and two six-membered rings. Two six-membered rings are located on the opposite side of a large cage structure, as shown in Figure 9. In the process of molecular dynamics simulation, it was found that partial six-membered rings of large clathrate structure in the EMIM-Cl-containing system evolved from five-membered rings. In order to conveniently describe the evolution of five-membered rings into six-membered rings, we respectively defined two six-membered rings as S1 and S2, as shown in Figure 9b.
The incompleteness of a large cage structure was mainly performed in two aspects. On the one hand, as mentioned above, one side of a large cage structure closer to the inhibitor was incomplete due to the combined action of hydrogen bond and steric hindrance. On the other hand, a five-membered ring was found at the opposite side of a six-membered ring in the methane gas hydrate clathrate cavity of SI. The specific evolution process from 51361 to 51262 is recorded in Figure 10.
Figure 10 is the evolution diagram of an incomplete 51262 cage structure of methane gas hydrate under the influence of an inhibitor over the corresponding period of 33.2 ns to 37.3 ns, in which A-H are front views and a-h are side views. Theoretically, the opposite face of a six-membered ring in the large cage structure of SI methane gas hydrate should also be a six-membered ring. However, through molecular dynamics simulation, it was found that in the EMIM-Cl-containing system, a five-membered ring was formed at the opposite side of the six-membered ring, leading to the incomplete structure, as shown in Figure 10 A with the front view and Figure 10a with the side view. In the first step of evolution, a hydrogen bond connected by two original five-membered rings broke and became an irregular eight-membered ring, as shown in Figure 10B,b. Secondly, a hydrogen bond of the five-membered ring on plane S1 broke and then connected with one edge of the irregular eight-membered ring to form a twisted six-membered ring, while the original irregular eight-membered ring turned into an irregular seven-membered ring, as shown in Figure 10C,c. By the following period, water molecules constantly adjusted position and angle in the newly formed six-membered ring on plane S1 with the passage of time. Hydrogen bonds became more regular, and the irregular seven-membered ring regenerated hydrogen bonds to form an irregular four-member ring and an irregular five-member ring. Meanwhile, the four-membered ring is repeatedly formed and broke due to irregular hydrogen bonds, as shown in Figure 10D,d-G,g. Finally, the six-membered ring on plane S1 became regular, and the four-membered ring also turned into a regular five-membered ring, as shown in Figure 10H,h. It totally took 4.1 ns to achieve the whole deformation process from a five-membered ring to a six-membered ring, which also played a role in delaying hydrate formation time to some extent.

4. Conclusions

This research took EMIM-Cl as a typical ionic liquid for gas hydrate inhibition and respectively simulated the methane hydrate growth process in the pure water system and EMIM-Cl-containing system by molecular dynamics simulation method. Then, the following conclusions could be obtained after the analysis and discussion:
(1)
By molecular dynamics simulation to calculate the average generation rate in the presence of hydrate inhibitor system, the results show that gas hydrates in the pure water system average growth rate of 4.49 Å /ns, and in systems containing inhibitors gas hydrate growth rate of 6.92 Å /ns, after joining this inhibitor can obviously reduce the hydrate crystal cell growth rate.
(2)
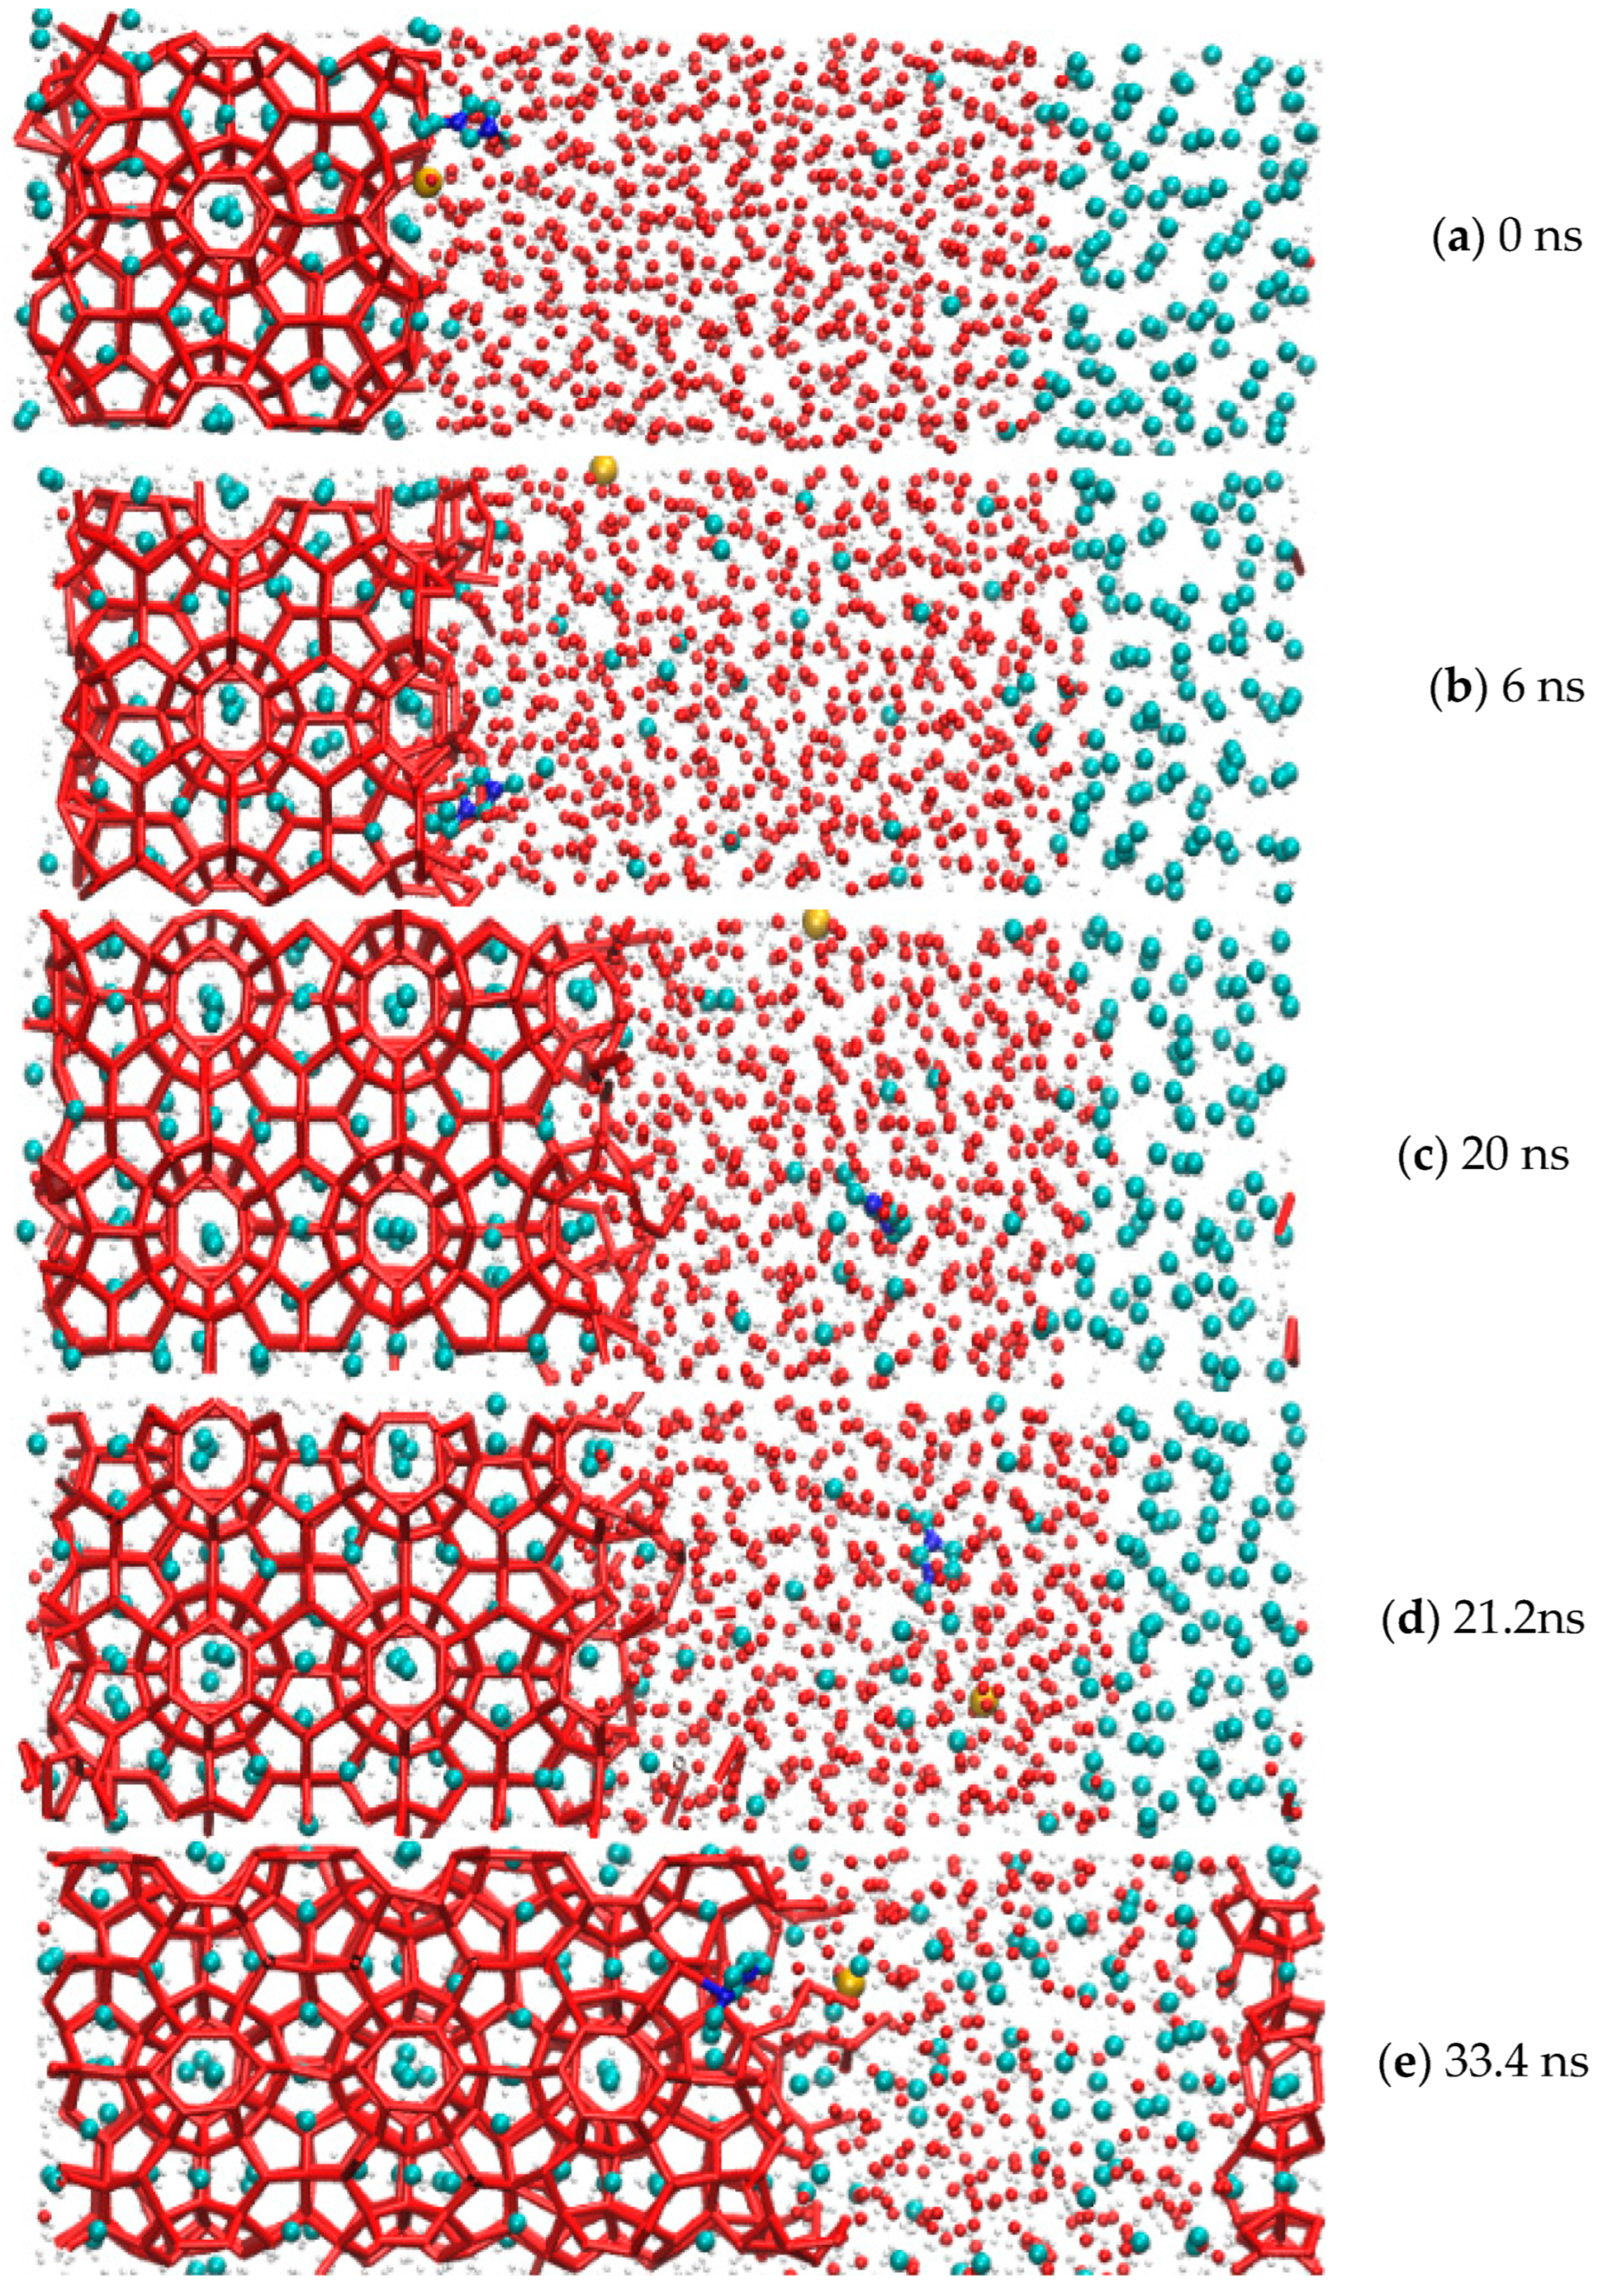
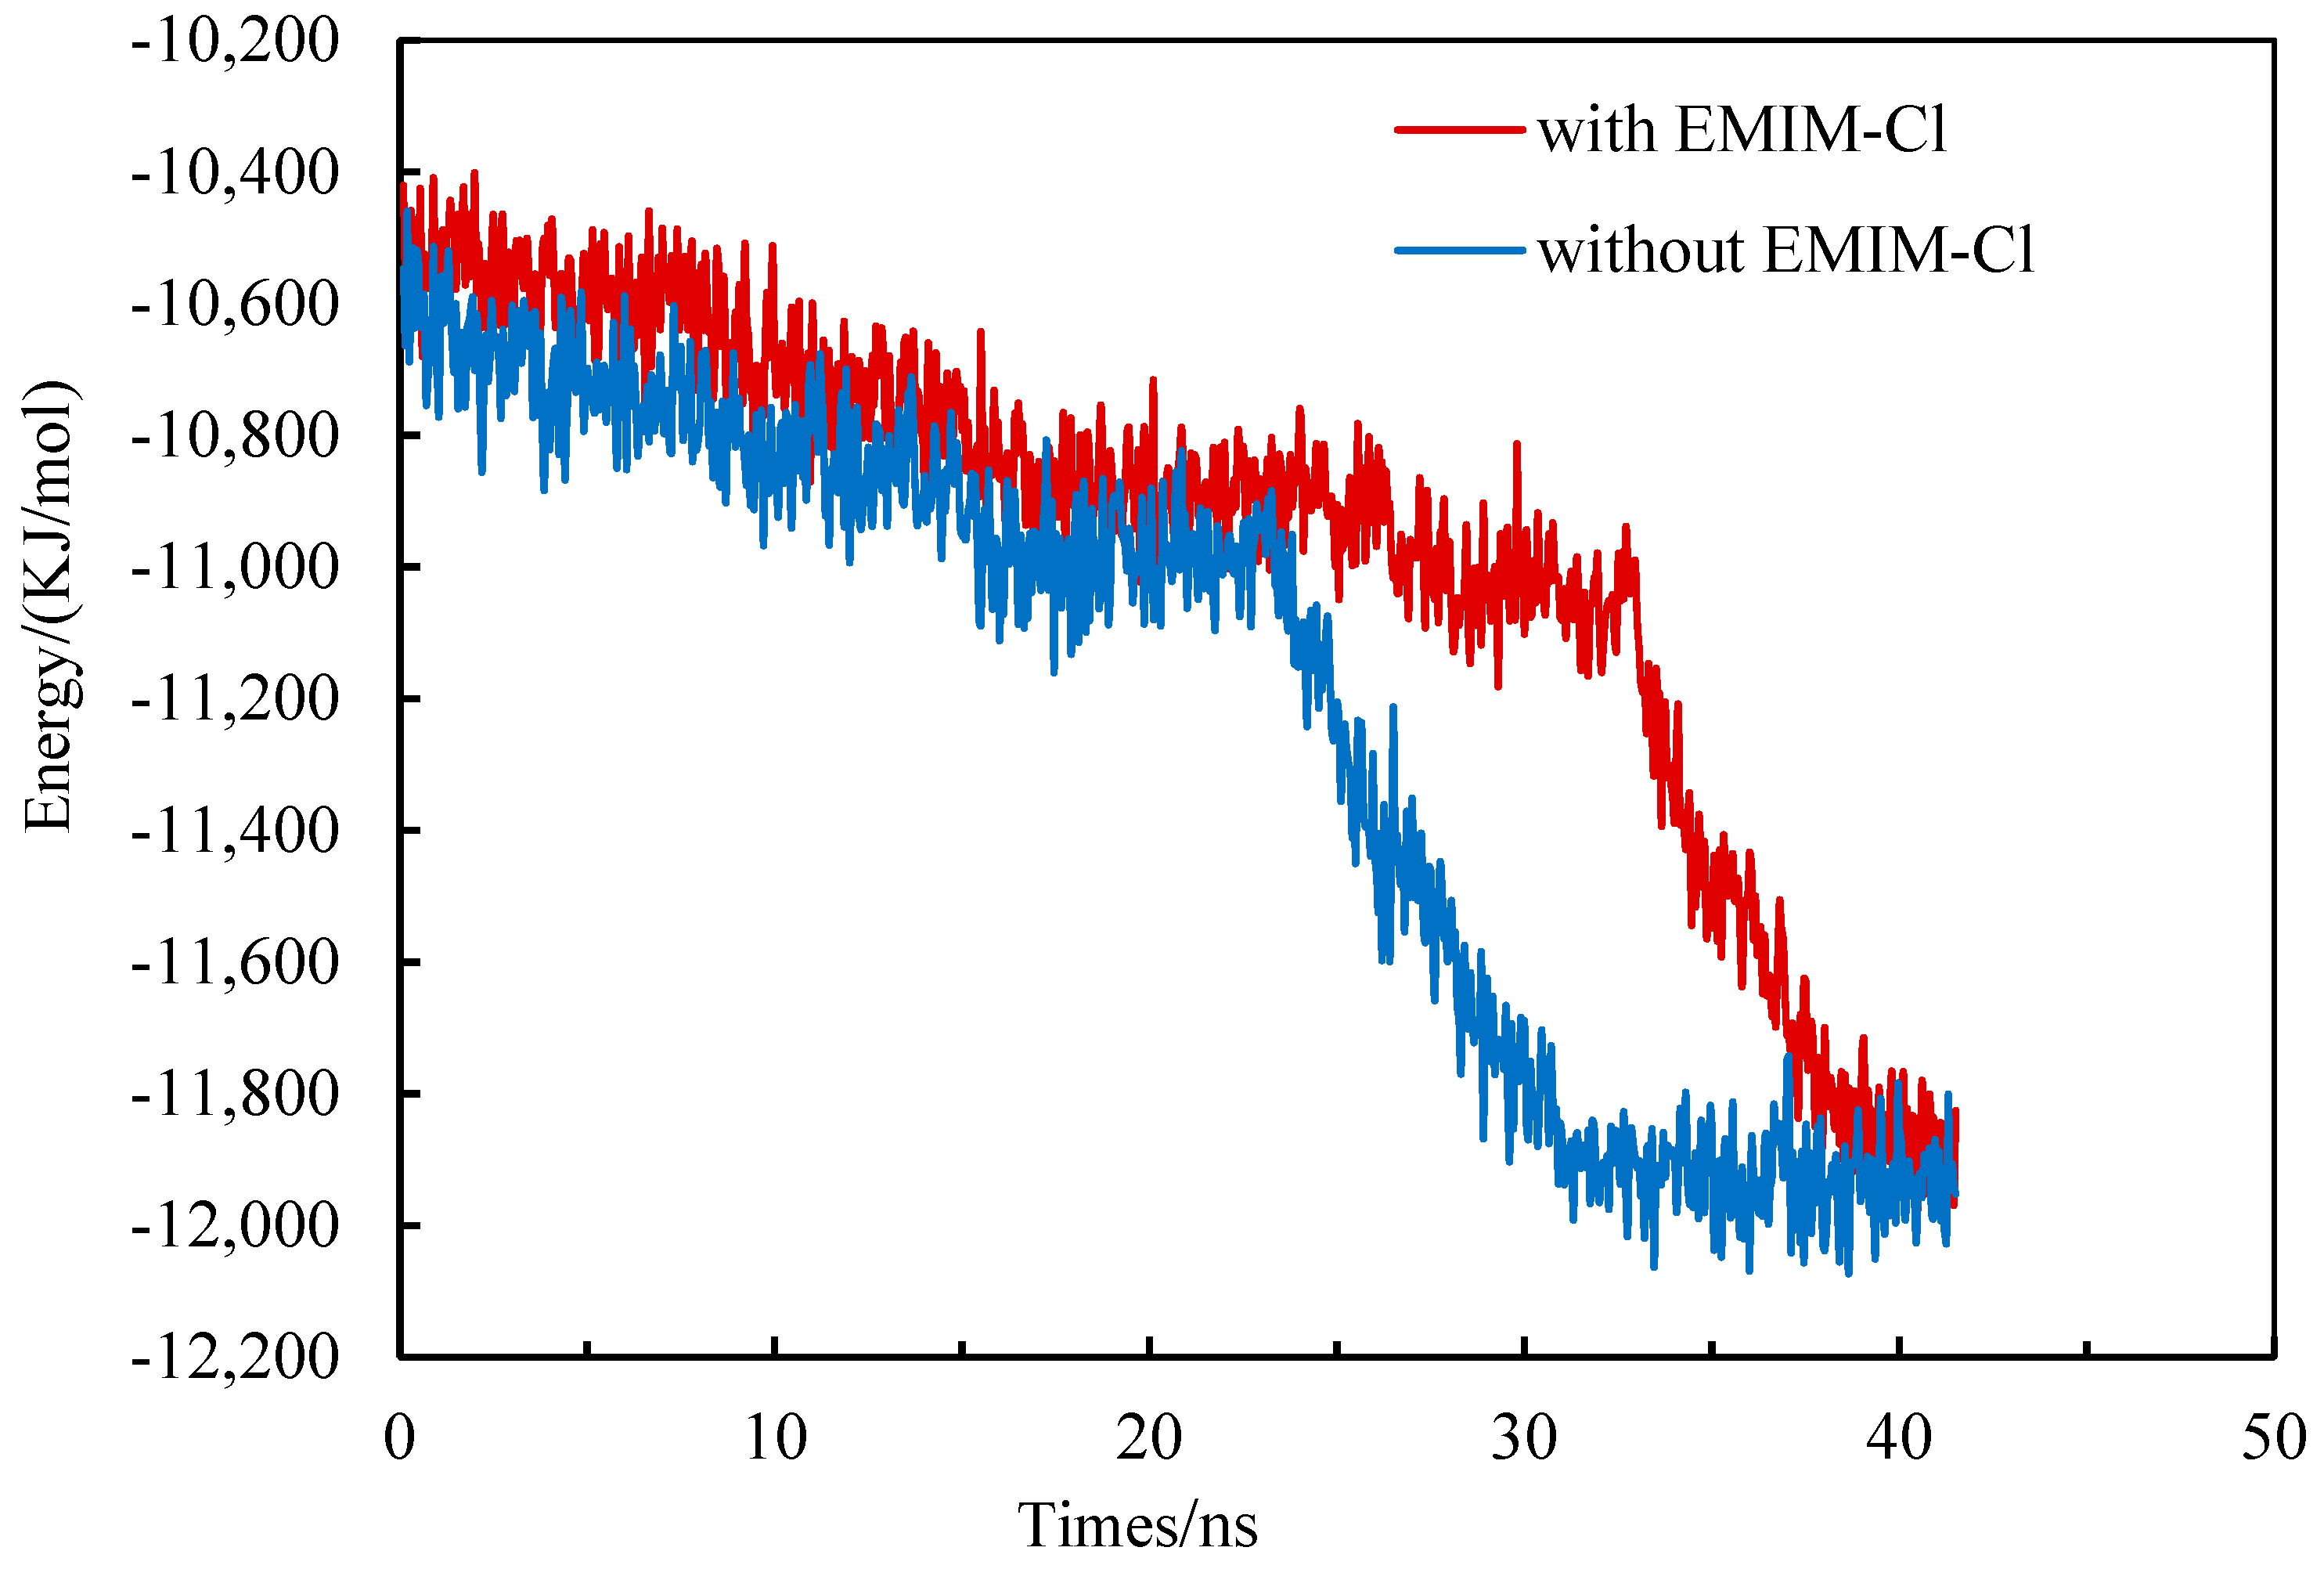
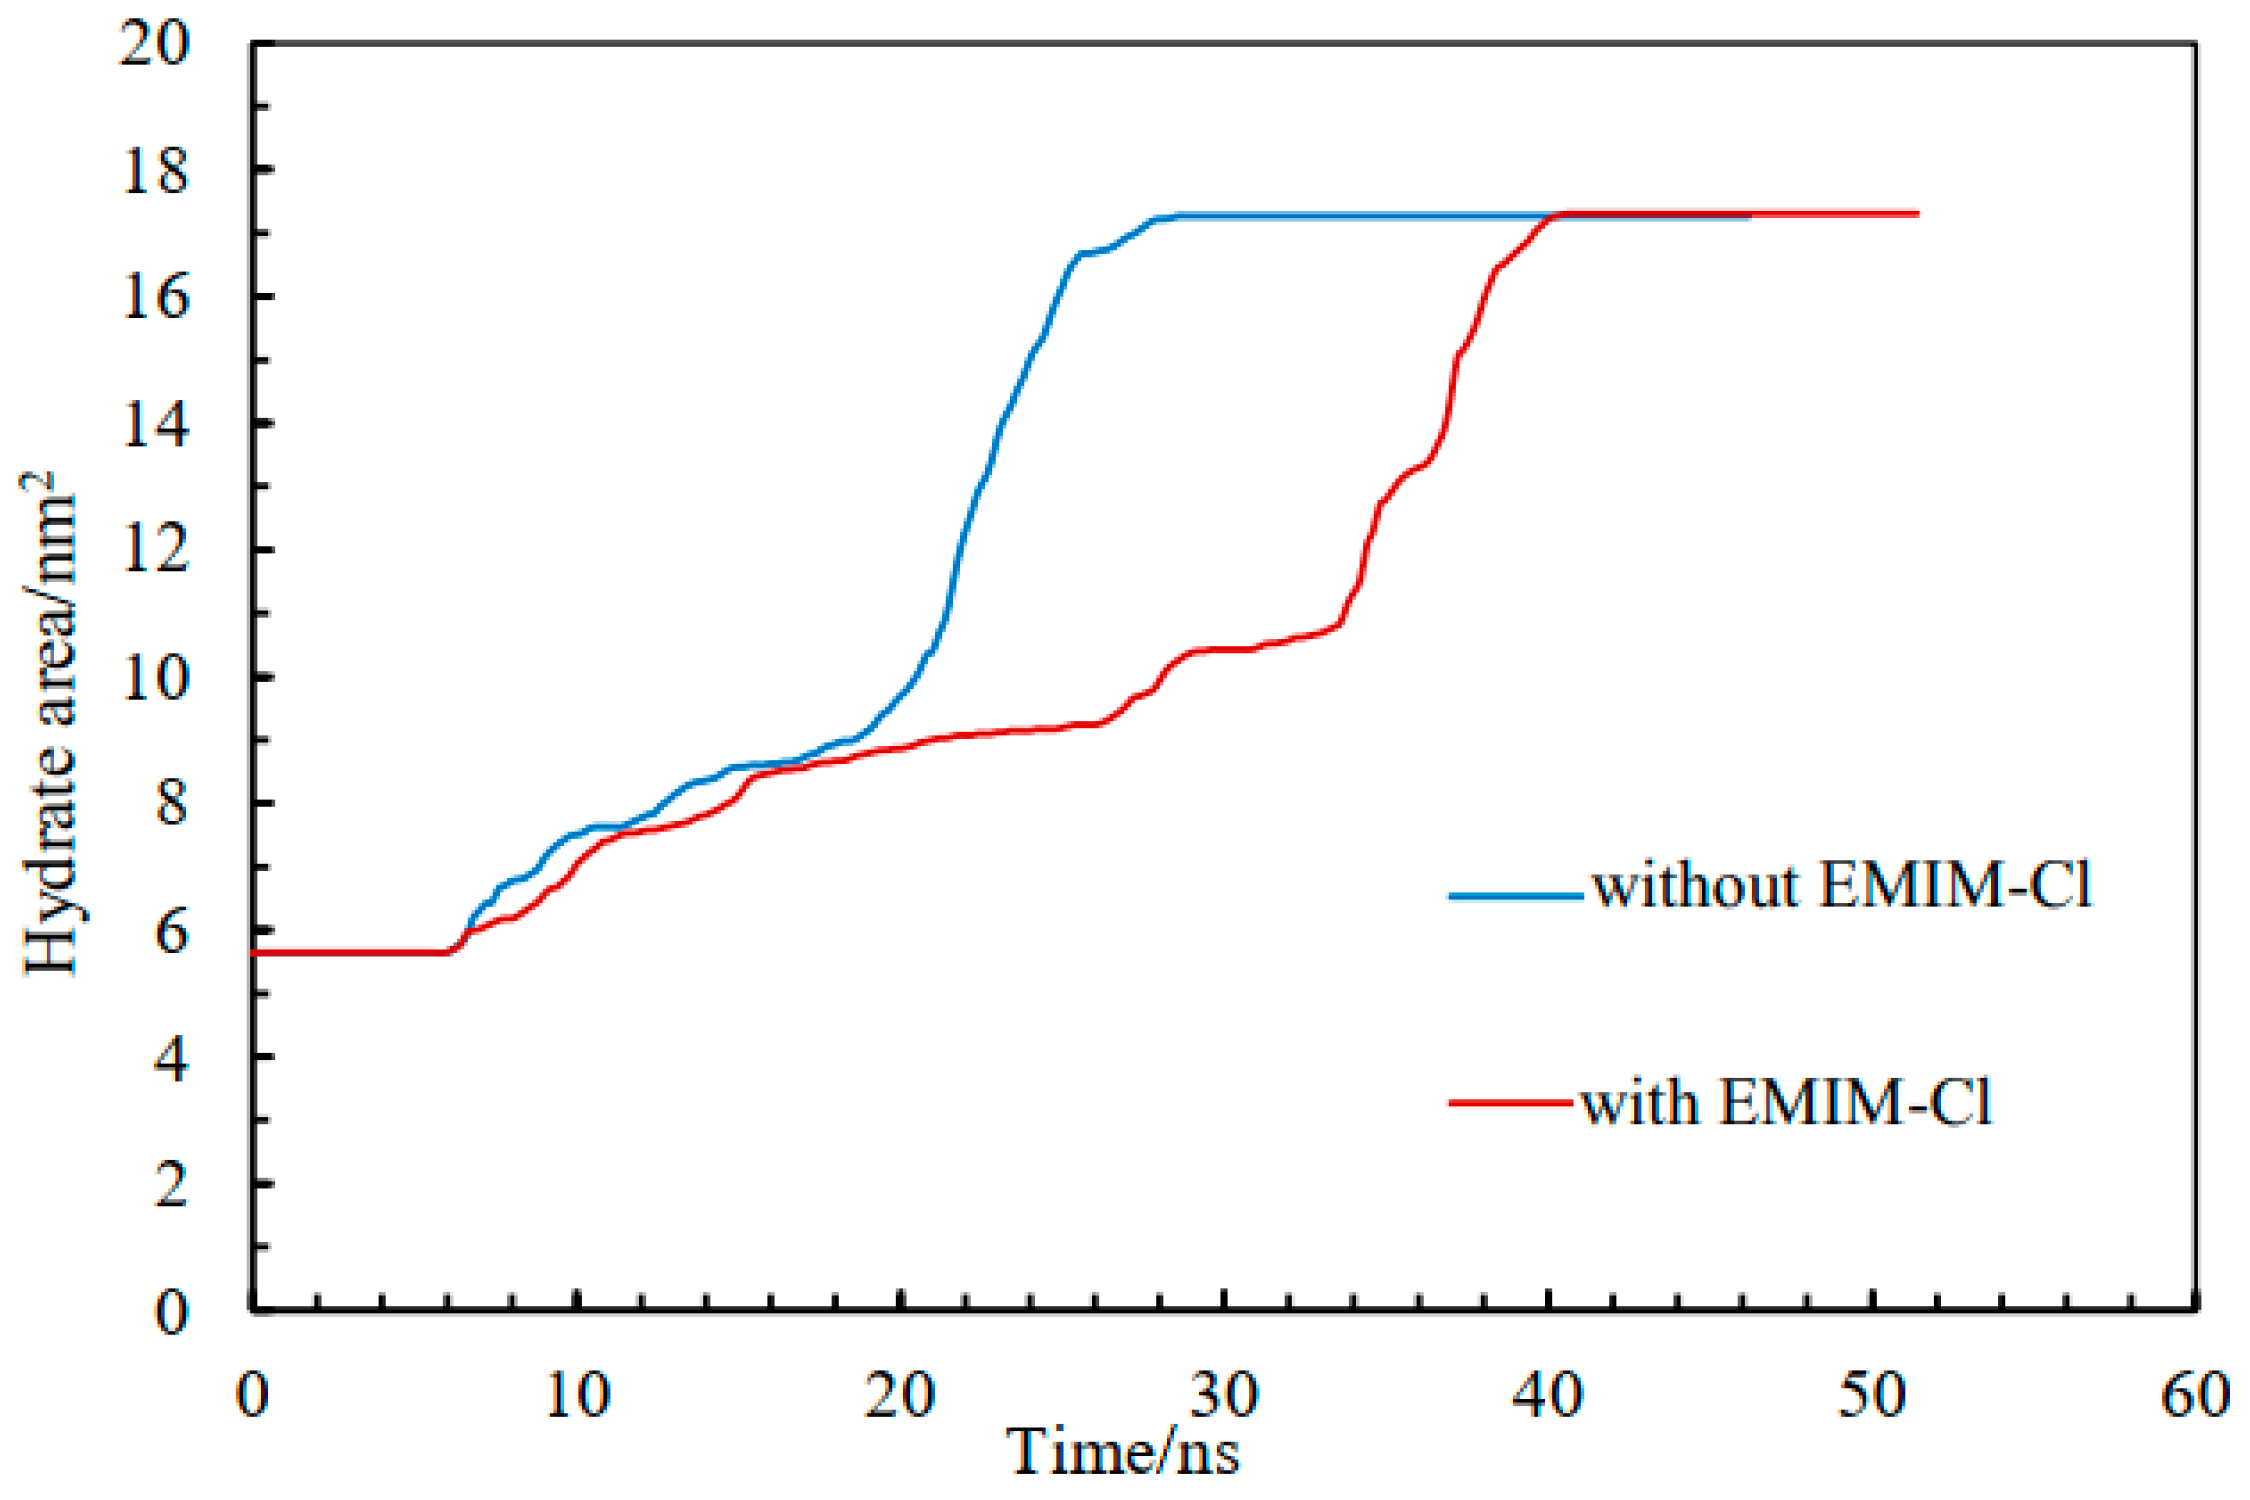
Compared with a pure water system, the growth of hydrate in a EMIM-Cl-containing system was delayed by about 10 ns by the analysis of total energy of the growth system, methane hydrate growth area, which confirmed that the EMIM-Cl-containing system exhibited a significant inhibition effect on hydrate growth and could be used as a type of potential hydrate inhibitor for offshore oil and gas development.
(3)
According to the molecular simulation results, it was believed that the inhibition mechanism of EMIM-Cl on hydrates was due to the combined effect of hydrogen bonds and steric hindrance, in which hydrogen bond could cause local disorder of cage structure formed by water molecules, and steric hindrance could lead to an incomplete cage structure.
(4)
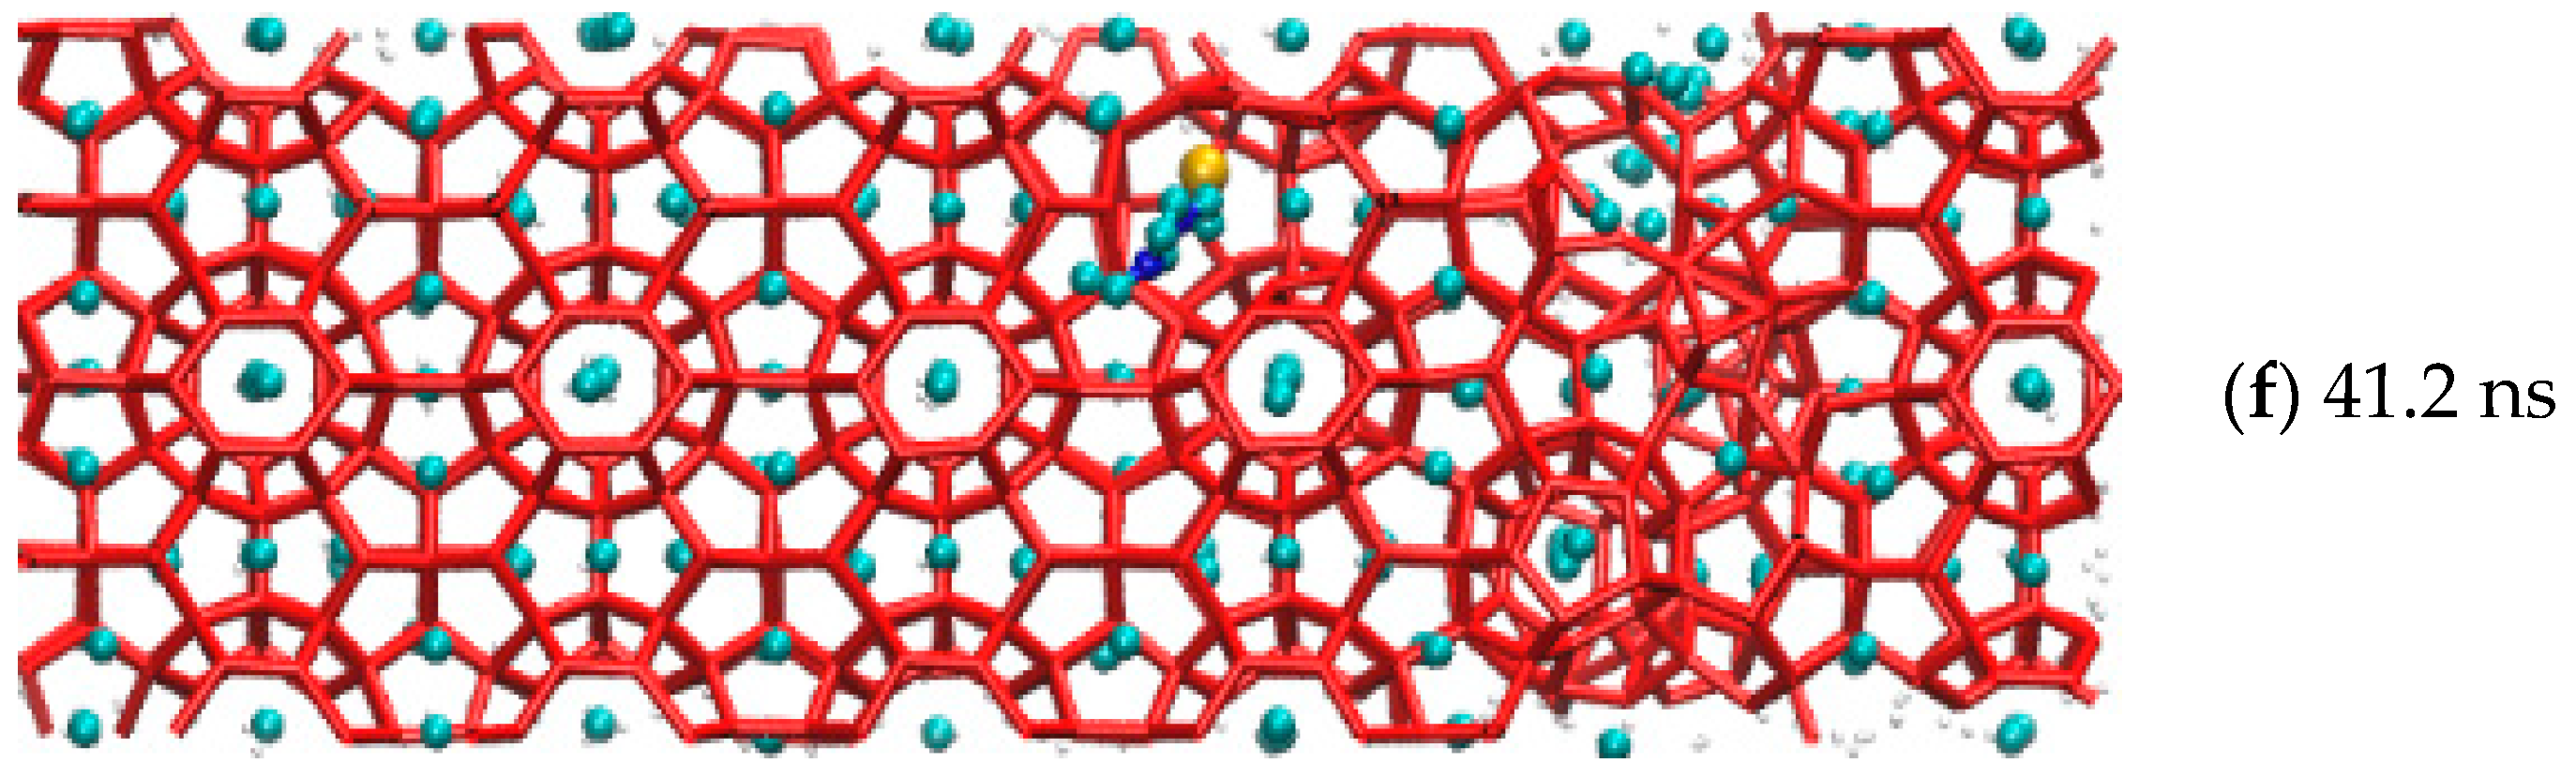
In a EMIM-Cl-containing system, some six-membered rings of SI methane hydrate cage-like structure evolved from five-membered rings, and the whole evolution process lasted about 4.1 ns, which delayed the formation time of overall methane hydrate to a certain extent.

Author Contributions

Conceptualization, G.X.; methodology, G.X.; software, G.X.; validation, N.X.; formal analysis, G.X. and X.S.; investigation, H.L.; resources, H.L. and Y.C.; data curation, F.Y. and H.L.; writing—original draft preparation, G.X. and Y.Q.; writing—review and editing, Y.C. and S.L.; project administration, B.S.; funding acquisition, B.S. All authors have read and agreed to the published version of the manuscript.

Funding

This research was funded by the National Natural Science Foundation of China (U21B2065, 51876222) and the Central University Basic Research Fund of China (22CX01003A-2).

Data Availability Statement

The data that support the findings of this paper are available upon request.

Conflicts of Interest

The authors declare no conflict of interest.

Abbreviations

AcronymsFull Name
AOPAngular order parameters
LDHIslow dosage inhibitors
LAMMPSLarge-scale Atomic/Molecular Massively Parallel Simulator
MDMolecular dynamics simulation
THIThermodynamic hydrate inhibitor
KHIKinetic hydrate inhibitor
ILsIonic liquids

References

  1. Yang, H.J.; Wu, M.W.; Yang, J.H.; Liang, H.; Jiang, H.F. Operation mode and key technologies for ultra-deep water gas well testing: A case study of first ultra-deep water gas well LSE1 in the South China Sea. China Offshore Oil Gas 2016, 28, 38–43. [Google Scholar] [CrossRef]
  2. Joao, V.A.; Raphael, M.; Sascha, T. Hydrate Remediation During Well Testing Operations in the Deepwater Campos Basin, Brazil. In Proceedings of the SPE/ICoTA Coiled Tubing & Well Intervention Conference & Exhibition, The Woodlands, TX, USA, 26–27 March 2013; SPE163881. pp. 154–196. [Google Scholar] [CrossRef]
  3. Yang, S.K.; Dai, Y.D.; Lv, Y. Key techniques of gas well testing in South China Sea deep water. China Offshore Oil Gas 2009, 21, 237–241. [Google Scholar] [CrossRef]
  4. Koh, C.A. Towards a fundamental understanding of natural gas hydrates. Chem. Soc. Rev. 2002, 31, 157–167. [Google Scholar] [CrossRef] [PubMed]
  5. Fan, S.S.; Wang, Y.H.; Lang, X.M. Progress in the research of kinetic hydrate inhibitors. Nat. Gas Ind. 2011, 31, 99–109. [Google Scholar] [CrossRef]
  6. Eslamimanesh, A.; Mohammadi, A.H.; Richon, D.; Naidoo, P.; Ramjugernath, D. Application of gas hydrate formation in separation processes: A review of experimental studies. J. Chem. Thermodyn. 2012, 46, 62–71. [Google Scholar] [CrossRef]
  7. Kelland, M.A. History of the Development of Low Dosage Hydrate Inhibitors. Energy Fuels 2006, 20, 825–847. [Google Scholar] [CrossRef]
  8. Xiao, C.; Wibisono, N.; Adidharma, H. Dialkylimidazolium halide ionic liquids as dual function inhibitors for methane hydrate. Chem. Eng. Sci. 2010, 65, 3080–3087. [Google Scholar] [CrossRef]
  9. Bavoh, C.B.; Nashed, O.; Rehman, A.N.; Othaman, N.A.A.B.; Lal, B.; Sabil, K.M. Ionic Liquids as Gas Hydrate Thermodynamic Inhibitors. Ind. Eng. Chem. Res. 2021, 60, 15835–15873. [Google Scholar] [CrossRef]
  10. Ul Haq, I.; Qasim, A.; Lal, B.; Zaini, D.B.; Foo, K.S.; Mubashir, M.; Khoo, K.S.; Vo, D.-V.N.; Leroy, E.; Show, P.L. Ionic liquids for the inhibition of gas hydrates. A review. Environ. Chem. Lett. 2022, 20, 2165–2188. [Google Scholar] [CrossRef]
  11. Masri, A.N.; Sulaimon, A.A. Amino acid-based ionic liquids as dual kinetic-thermodynamic methane hydrate inhibitor. J. Mol. Liq. 2022, 349, 118481. [Google Scholar] [CrossRef]
  12. Menezes, D.É.S.d.; Pessôa Filho, P.d.A.; Robustillo Fuentes, M.D. Use of 1-butyl-3-methylimidazolium-based ionic liquids as methane hydrate inhibitors at high pressure conditions. Chem. Eng. Sci. 2020, 212, 115323. [Google Scholar] [CrossRef]
  13. Yuha, Y.B.M.; Bavoh, C.B.; Lal, B.; Broni-Bediako, E. Methane hydrate phase behaviour in EMIM-Cl water based mud (WBM): An experimental and modelling study. S. Afr. J. Chem. Eng. 2020, 34, 47–56. [Google Scholar] [CrossRef]
  14. Zare, M.; Haghtalab, A.; Ahmadi, A.N.; Nazari, K. Experiment and thermodynamic modeling of methane hydrate equilibria in the presence of aqueous imidazolium-based ionic liquid solutions using electrolyte cubic square well equation of state. Fluid Phase Equilibria 2013, 341, 61–69. [Google Scholar] [CrossRef]
  15. Khan, M.S.; Bavoh, C.B.; Partoon, B.; Lal, B.; Bustam, M.A.; Shariff, A.M. Thermodynamic effect of ammonium based ionic liquids on CO2 hydrates phase boundary. J. Mol. Liq. 2017, 238, 533–539. [Google Scholar] [CrossRef]
  16. Richard, A.R.; Adidharma, H. The performance of ionic liquids and their mixtures in inhibiting methane hydrate formation. Chem. Eng. Sci. 2013, 87, 270–276. [Google Scholar] [CrossRef]
  17. Tung, Y.-T.; Chen, L.-J.; Chen, Y.-P.; Lin, S.-T. Growth of Structure I Carbon Dioxide Hydrate from Molecular Dynamics Simulations. J. Phys. Chem. C 2011, 115, 7504–7515. [Google Scholar] [CrossRef]
  18. Plimpton, S. Fast Parallel Algorithms for Short-Range Molecular Dynamics. J. Comput. Phys. 1994, 117, 1039. [Google Scholar] [CrossRef] [Green Version]
  19. McMullan, R.K.; Jeffrey, G.A. Polyhedral Clathrate Hydrates. IX. Structure of Ethylene Oxide Hydrate. J. Chem. Phys. 1965, 42, 2725–2732. [Google Scholar] [CrossRef]
  20. Jorgensen, W.L.; Maxwell, D.S.; Tirado-Rives, J. Development and Testing of the OPLS All-Atom Force Field on Conformational Energetics and Properties of Organic Liquids. J. Am. Chem. Soc. 1996, 118, 11225–11236. [Google Scholar] [CrossRef]
  21. Waldron, C.J.; English, N.J. Global-density fluctuations in methane clathrate hydrates in externally applied electromagnetic fields. J. Chem. Phys. 2017, 147, 024506. [Google Scholar] [CrossRef]
  22. Boda, D.; Henderson, D. The effects of deviations from Lorentz–Berthelot rules on the properties of a simple mixture. Mol. Phys. 2008, 106, 2367–2370. [Google Scholar] [CrossRef]
  23. Mohrdieck, C. Physical Chemistry for the Life Sciences. By Peter Atkins and Julio de Paula. ChemPhysChem 2006, 7, 1149. [Google Scholar] [CrossRef]
  24. Jorgensen, W.L.; Chandrasekhar, J.; Madura, J.D.; Impey, R.W.; Klein, M.L. Comparison of simple potential functions for simulating liquid water. J. Chem. Phys. 1983, 79, 926–935. [Google Scholar] [CrossRef]
  25. Faúndez, C.A.; Mulero, A.; Cuadros, F. Molecular models for the vapor-liquid equilibrium of simple binary mixtures. J. Phase Equilibria 2001, 22, 531–538. [Google Scholar] [CrossRef]
  26. Anderson, B.J.; Tester, J.W.; Borghi, G.P.; Trout, B.L. Properties of inhibitors of methane hydrate formation via molecular dynamics simulations. J. Am. Chem. Soc. 2005, 127, 17852–17862. [Google Scholar] [CrossRef]
  27. Udachin, K.A.; Ratcliffe, C.I.; Ripmeester, J.A. Single crystal diffraction studies of structure I, II and H hydrates: Structure, cage occupancy and composition. J. Supramol. Chem. 2002, 2, 405–408. [Google Scholar] [CrossRef]
  28. Bernal, J.D.; Fowler, R.H. A Theory of Water and Ionic Solution, with Particular Reference to Hydrogen and Hydroxyl Ions. J. Chem. Phys. 1933, 1, 515–548. [Google Scholar] [CrossRef]
  29. Ryckaert, J.P.; Herman, J.C.; Berendsen, H. Numerical integration of the cartesian equations of motion of a system with constraints: Molecular dynamics of n-alkanes. J. Comput. Phys. 1977, 23, 327–341. [Google Scholar] [CrossRef] [Green Version]
  30. Darden, T.; York, D.; Pedersen, L. Particle mesh Ewald: AnN⋅log(N) method for Ewald sums in large systems. J. Chem. Phys. 1993, 98, 10089–10092. [Google Scholar] [CrossRef]
  31. Verlet, L. Computer “Experiments” on Classical Fluids. I. Thermodynamical Properties of Lennard-Jones Molecules. Phys. Rev. 1967, 159, 98–103. [Google Scholar] [CrossRef] [Green Version]
  32. Verlet, L. Computer Experiments on Classical Fluids. II. Equilibrium Correlation Functions. Phys. Rev. 1968, 165, 201–214. [Google Scholar] [CrossRef]
  33. English, N.J.; MacElroy, J.M. Theoretical studies of the kinetics of methane hydrate crystallization in external electromagnetic fields. J. Chem. Phys. 2004, 120, 10247–10256. [Google Scholar] [CrossRef]
  34. Frenkel, D.; Smit, B.; Ratner, M.A. Understanding Molecular Simulation: From Algorithms to Applications. Phys. Today 1997, 50, 66. [Google Scholar] [CrossRef]
  35. Pollock, E.L.; Glosli, J. Comments on P3M, FMM, and the Ewald Method for Large Periodic Coulombic Systems. Comput. Phys. Commun. 1996, 95, 93–110. [Google Scholar] [CrossRef] [Green Version]
  36. Yu, K.B.; Yazaydin, A.O. Does Confinement Enable Methane Hydrate Growth at Low Pressures? Insights from Molecular Dynamics Simulations. J. Phys. Chem. C Nanomater. Interfaces 2020, 124, 11015–11022. [Google Scholar] [CrossRef]
  37. Ghaani, M.R.; English, N.J. Molecular-dynamics study of propane-hydrate dissociation: Fluctuation-dissipation and non-equilibrium analysis. J. Chem. Phys. 2018, 148, 114504. [Google Scholar] [CrossRef]
  38. Shirts, R.B.; Burt, S.R.; Johnson, A.M. Periodic boundary condition induced breakdown of the equipartition principle and other kinetic effects of finite sample size in classical hard-sphere molecular dynamics simulation. J. Chem. Phys. 2006, 125, 164102. [Google Scholar] [CrossRef] [Green Version]
  39. Walsh, M.R.; Beckham, G.T.; Koh, C.A.; Sloan, E.D.; Wu, D.T.; Sum, A.K. Methane Hydrate Nucleation Rates from Molecular Dynamics Simulations: Effects of Aqueous Methane Concentration, Interfacial Curvature, and System Size. J. Phys. Chem. C 2011, 115, 21241–21248. [Google Scholar] [CrossRef]
  40. Wan, L.; Liang, D.; Wu, N.; Guan, J. Molecular dynamics simulations of the mechanisms of thermal conduction in methane hydrates. Sci. China Chem. 2012, 55, 167–174. [Google Scholar] [CrossRef]
  41. Bai, J.; Li, D.L.; Liang, D.Q.; Fan, S.S.; Du, J.W.; Dai, X.X. Thermal analysis on the process of CO2 hydrate formation in static HiGee reactor. Nat. Gas Chem. Ind. 2010, 35, 30–34. [Google Scholar] [CrossRef]
  42. Li, K.; Chen, B.; Song, Y.; Yang, M. Molecular dynamics simulation of the effects of different thermodynamic parameters on methane hydrate dissociation: An analysis of temperature, pressure and gas concentrations. Fluid Phase Equilibria 2020, 516, 112606. [Google Scholar] [CrossRef]
  43. Gao, F.; Gupta, K.M.; Yuan, S.; Jiang, J. Decomposition of CH4 hydrate: Effects of temperature and salt from molecular simulations. Mol. Simul. 2018, 44, 1220–1228. [Google Scholar] [CrossRef]
  44. Kondori, J.; Zendehboudi, S.; James, L. New insights into methane hydrate dissociation: Utilization of molecular dynamics strategy. Fuel 2019, 249, 264–276. [Google Scholar] [CrossRef]
  45. Binsbergen, F.L. Computer simulation of nucleation and crystal growth. J. Cryst. Growth 1972, 16, 249–258. [Google Scholar] [CrossRef]
  46. Jiménez-Ángeles, F.; Firoozabadi, A. Nucleation of Methane Hydrates at Moderate Subcooling by Molecular Dynamics Simulations. J. Phys. Chem. C 2014, 118, 11310–11318. [Google Scholar] [CrossRef]
  47. Zi, M.; Chen, D.; Wu, G. Molecular dynamics simulation of methane hydrate formation on metal surface with oil. Chem. Eng. Sci. 2018, 191, 253–261. [Google Scholar] [CrossRef]
  48. Luzar, A.; Chandler, D. Hydrogen-bond kinetics in liquid water. Nature 1996, 379, 55–57. [Google Scholar] [CrossRef]
  49. Zhang, L.; Sun, L.; Lu, Y.; Kuang, Y.; Ling, Z.; Yang, L.; Dong, H.; Yang, S.; Zhao, J.; Song, Y. Molecular dynamics simulation and in-situ MRI observation of organic exclusion during CO2 hydrate growth. Chem. Phys. Lett. 2021, 764, 138287. [Google Scholar] [CrossRef]
  50. Yousuf, M.; Qadri, S.B.; Knies, D.L.; Grabowski, K.S.; Coffin, R.B.; Pohlman, J.W. Novel results on structural investigations of natural minerals of clathrate hydrates. Appl. Phys. A 2004, 78, 925–939. [Google Scholar] [CrossRef]
  51. Vatamanu, J.; Kusalik, P.G. Molecular Insights into the Heterogeneous Crystal Growth of sI Methane Hydrate. J. Phys. Chem. B 2006, 110, 15896–15904. [Google Scholar] [CrossRef]
Figure 1. Molecular structure of EMIM-Cl.
Energies 15 07928 g001
Figure 2. Methane gas hydrate formation in the system with EMIM-Cl.
Energies 15 07928 g002aEnergies 15 07928 g002b
Figure 3. The change of system energy during hydrate growth.
Energies 15 07928 g003
Figure 4. The area of hydrate change curve.
Energies 15 07928 g004
Figure 5. Hydrogen bonding diagram.
Energies 15 07928 g005
Figure 6. Hydrogen bonding diagram. (a) Hydrogen bonding; (b) Complete cage structure; (c) Hydrogen bond disrupts the position of water molecule; (d) Complete cage structure.
Energies 15 07928 g006
Figure 7. Macro view of steric hindrance of inhibitor.
Energies 15 07928 g007
Figure 8. Micrograph of steric hindrance of inhibitor.
Energies 15 07928 g008
Figure 9. Large cage structure of SI hydrate.
Energies 15 07928 g009
Figure 10. The front side is the incomplete structure of the five-membered ring. (A) The front of the incomplete structure of the five-membered ring; (a) The side of the incomplete structure of the five-membered ring; (B) The front of broke five-membered rings and became an irregular eight-membered ring; (b) The side of broke five-membered rings and became an irregular eight-membered ring; (C) The front of irregular seven-membered ring; (c) The side of irregular seven-membered ring; (D) The front of irregular four-membered ring; (d) The side of irregular four-membered ring; (E) The front of broke irregular four-membered ring; (e) The side of broke irregular four-membered ring; (F) The front of hydrogen bond bonding between EMIM-Cl and hydrate; (f) The side of hydrogen bond bonding between EMIM-Cl and hydrate; (G) The front of preliminary formation of regular pentagon structure in the side. (g) The side of preliminary formation of regular pentagon structure in the side. (H)The front of regular five-membered ring in the side of cage structure; (h)The front of regular five-membered ring in the side of cage structure.
Energies 15 07928 g010aEnergies 15 07928 g010b
Table 1. Lennard–Jones potential and charge parameters.
ElementMolecularε (kcal/mol)σ (Å)Electric Charge
OH2O0.162753.16435-
H0.0000.0000.5242
M--−1.0484
CCH40.0663.500−0.2400
H0.0302.5000.0600
Publisher’s Note: MDPI stays neutral with regard to jurisdictional claims in published maps and institutional affiliations.

