Article

Energy Performance Evaluation of a Solar PVT Thermal Energy Storage System Based on Small Size Borefield

by
Evangelos I. Sakellariou
1,
Petros J. Axaopoulos
1,*,
Bill Vaneck Bot
1,2 and
Ioannis E. Sarris
1
1
Department of Mechanical Engineering, Campus Ancient Olive Grove, University of West Attica, 250, Thivon & P. Ralli Str., 12241 Athens, Greece
2
Laboratory of Energy, Materials, Modelling and Methods, Higher National Polytechnic School, University of Douala, Douala P.O. Box 2701, Cameroon
*
Author to whom correspondence should be addressed.
Energies 2022, 15(21), 7906; https://doi.org/10.3390/en15217906
Submission received: 7 October 2022 / Revised: 16 October 2022 / Accepted: 21 October 2022 / Published: 25 October 2022
(This article belongs to the Special Issue Thermal Energy Storage and Energy Conversion Technologies)

Abstract

:
In this study, a PVT-based solar-assisted ground source heat pump (SAGSHP) system with a small size borefield as the long-term heat storage component was energetically evaluated. The mathematical model of the system was formulated in TRNSYS and three cities with distinctive climates were chosen: Athens (Greece); Melbourne (Australia); and Ottawa (Canada). The parametric analyses were carried out for 10 years by varying the number of the PVT collectors and the size of the earth energy bank (EEB). The evaluation of the systems was made via two energy indicators, and the heat flow across the EEB was analyzed. The under-consideration system was found capable of establishing self-sufficiency as regards the energy consumption (renewable power fraction RPF > 1) for all locations. Namely, for Athens, any system with more than four PVT collectors, and for Melbourne, any system with more than eight PVTs was found with an RPF higher than 1, regardless of the EEB size. For Ottawa, self-sufficiency can be achieved with PVT arrays larger than 12 collectors for small EEBs, and with eight collectors for larger EEBs. The storage capacity was found to be an important parameter for the energy performance of the system. In particular, it was determined that, as the storage capacity enlarges the RPF and the seasonal performance factor (SPF) of the system improves, mainly due to the reduction of the electricity consumed by the heat pump and the auxiliary heating. Moreover, a larger storage capacity facilitates solar heat production by enlarging the available heat storage volume and by maintaining the EEB at relatively low temperatures.
Keywords:
PVT; GHE; SAGSHP; GSHP; PVT-SAGSHP; EEB

1. Introduction

Manmade pollution and climate change are the greatest challenges of today. Combustion of conventional fuels releases greenhouse gases into the atmosphere, and these are considered to raise the average global temperature. A solution to this issue may be to use more renewable energy systems (RESs) and to displace fossil fuel-based systems. RESs are implemented in the household sector by providing thermal and electrical energy. Solar assisted heat pumps (SAHPs) [1,2] and shallow ground source heat pumps (GSHPs) [3,4,5] are both promising space heating technologies. The combination of the aforementioned systems is called solar-assisted ground source heat pump (SAGSHP) [6,7]. The first attempt to assess the SAGSHP systems dates back to the 1970s, with the innovative work conducted by Metz [8], from that time, the attention on this technology has increased.
The combination of the solar and geothermal systems can promote long-term, or interseasonal, heat storage. Despite the fact that SAGSHP systems dominate the market at the current stage, the idea of interseasonal solar heat storage goes back to 1939. Thus, the first attempt to store summer solar heat was made by MIT’s solar house [9]. The storage container was a horizontal insulated cylindrical steel water tank of 68 m3. A house of 45 m2 was built, and the storage water temperature was 90 °C at the end of the charging period and dropped to 55 °C in February. The area of the solar collectors was 33 m2, thus the storage capacity of the system was about 1.6 m3 m−2. Since then, many seasonal thermal energy methods have been invented [10,11,12,13,14,15]. The majority of the utilized interseasonal thermal energy storage (TES) methods store the heat sensibly via water tanks or lakes [16] and into the soil via borefields as well. TES systems based on soil as the sensible heat storage material are becoming popular because they can be used on systems with heat pumps, thus the storage temperature can be relatively low (no excessive heat loss) and the construction cost is lower than that of a water tank. For the soil-based TES, a geothermal heat exchanger (GHE) is required, this type of system is called the borehole thermal energy storage (BTES) system [15,17,18] and the majority of the SAGSHP systems are based on this method for long-term-heat storage.
Up to now, the majority of the experimental [19,20,21,22] or theoretically [23,24,25,26] studies on SAGSHP systems are made with a variety of components, layouts, operation-control, and for different weather conditions. The solar collectors used for the studies on SAGSHP systems vary from flat plate collectors (FPC) [27] to PVTs [28], and the GHE includes BHEs [29] and very shallow borefields [22,30,31]. All these types of components can be combined in many configurations in addition to numerus layouts (hydraulic connection of systems) [32,33,34]. In conclusion, SAGSHP systems are multiple-aspect projects, and their design is unique for every case.
A special configuration of SAGSHP systems is the one with PVT collectors, which has the ability to coproduce heat and power. Bertram et al. [28] investigated a PVT-based SAGSHP system with a concentrical BHE built in Munich. PVT collectors and one photovoltaic panel were placed alongside with the goal to assess their energy production. With a two-year trial data referring to their performance, the PVT collector was more productive by 4% than the photovoltaic as regards to the power, and the system’s seasonal performance factor (SPF) was found to be 4.2. A trial based on PVT utilization was carried out by Wright et al. [35], the study shows a newly built dwelling designed in accordance with zero carbon emission regulations. A similar study with a PVT-based SAGSHP system was coupled with a novel borefield and presented by Mendoza et al. [36]. The borefield was very shallow and it was installed beneath the building with the goal of restricting the surface heat losses. A pilot system was designed and implemented by De Montfort University with the aim of assessing its performance energetically for the UK Midlands climate [22]. The seven PVT collectors and a borefield of 16 BHEs with only 1.5 m of depth were its main components. With the experimental data, the SPF of the system was found to be 2.51 out of 20 months of operation.
Computer-based work has been carried out for the Netherlands’ climate, aiming to evaluate the contribution of PVTs paired with a conventional GSHP system [37]. The study was carried out with the TRNSYS simulation platform [38]. The outcomes were that: 96% of the electricity demanded by the SAGSHP system was offered by the PVTs; and the heat energy requirements were covered by the GHE to 83% of its total demand. A theoretical study with a low exergy concept was conducted to appraise the performance of a PVT-based SAGSHP system [39]. Via simulations carried out with TRNSYS, the SPF was estimated to be 6, which is a significantly high value.
A study was carried out to assess the contribution of PVTs added to a conventional GSHP system by considering many parameters [40]. In particular, the evaluation was made of the system’s energy and financial performance for a block of flats in Stockholm. The primary results were a reduction of 18% in the borefield’s size and a 50% decrease in the distance among BHEs. Both above-mentioned reductions assist the economy of the system. It is important that the system was benefited by the PVTs’ addition and performed with an SPF equal to that of the conventional GSHP system (without PVTs). The reduction in the GHE’s size, paired with PVTs, against the GSHP system is translated into a reduced initial capital investment. A trial was conducted, seeking to find out the advantages of having flat plate solar collectors paired with a GSHP system [41]. A low-rise building built in Milton (Canada) was monitored as regards to its energy demand. Data from the building was utilized and, along with the SAGSHP system, were modeled in TRNSYS. The storage capacity of the systems was one of the important parameters. The storage capacity with the best energy performance of the system was that with 4.7 m of BHE per m2 of FPC. With the optimum storage capacity, the required total length of the BHE was determined to be shorter by 32 m. This reduction can be achieved by installing 6.81 m2 of FPC. The economy of the systems was appraised via the net present value (NPV) index for a 20-year period. It can be concluded that the SAGSHP has a somewhat higher NPV compared to the conventional GSHP system.
SAGSHP may be an alternative solution for space heating systems by being based on renewable energy sources and by facilitating interseasonal solar heat storage. Thus, in this paper, a novel PVT-based SAGSHP system was studied energetically as a space heating system solution for low-rise dwellings in three locations: Athens (Greece); Melbourne (Australia); and Ottawa (Canada). The novelty of the system is based on the very shallow borefield (2 m deep), which may potentially reduce the construction cost of the GHE by avoiding costly deep drilling. The investigated borefield is the long-term solar heat storage component of the system. The system’s mathematical model was built in TRNSYS by having the main parts of the system validated via experimental data. Based on the built model, parametric analyses were conducted with the variation of the PVT collectors and the size of the GHE (Earth Energy Bank, EEB). Through the simulation results, the systems were evaluated by two energy indexes. The evaluation of the SAGSHP system is an essential task, with the aim of identifying the contribution of the long-term heat storage component to the energy performance of the system.

2. Methodology

In the current study, a PVT-based SAGSHP system is evaluated energetically for three cities with distinctive climates. The three cities are: Athens, Greece (37.54° N, 23.44° E), with a Mediterranean climate Csa; Melbourne, Australia (37.40° S, 144.50° E), with a temperate oceanic climate Cfb; and Ottawa, ON, Canada (43.40° N, 79.19° W), with a warm summer continental climate Dfb (Köppen–Geiger [42,43]). For all three cities, the SAGSHP system was installed to provide thermal energy for a low-rise single-family dwelling for space heating and domestic hot water (DHW). Figure 1 and Figure 2 show the mean ambient db air temperature and the monthly global horizontal solar energy, respectively, for all locations. Data from Meteonorm for the typical meteorological year (TMY) were utilized for these figures.
The main components of a SAGSHP system are the PVT array, the earth energy bank (EEB), and the heat pump. The EEB is comprised of the GHE and the adjacent soil volume, in other words, this is the long-term solar heat storage element of the system. The analysis of the system along with the dwellings is illustrated in Section 2.1, while the topology of the system is shown in Figure 3. A combined mathematical model of the SAGSHP system and of the dwelling was formulated in the TRNSYS simulation platform [38]. With the developed model, simulation-based parametric analyses were conducted by varying the size of the PVT array and of the EEB. Based on that, twenty-five simulations were carried out for each city, with five different sizes of the PVT array and five different sizes of the EEB, Section 2.1.
For the evaluation of the systems, a 20-year period was considered by executing simulations with hourly steps. The considered period over which the analysis takes place is substantial to get accurate results, especially about the transient behavior of the soil during the initial years of operation. The meteorological data provided by Meteonorm formulated according to the Typical Meteorological Year (TMY) format was inserted into the model. The results from simulations were utilized to energetically assess the SAGSHP system. Two energy indexes were found to be adequate for the analysis (Section 2.2), and these can provide a holistic view regarding the performance of the system.
The operation of the proposed system is briefly described in Table 1. The implementation of the control was made via Type 40 of TRNSYS, which provides the ability to program a microcontroller as inputs to Type 40, where: the collectors’ exiting brine temperature; the adjacent to the BHEs’ mean ground temperature; and the space hating (SH) and DHW thermostats. It is important to note that the system was responsible for covering the SH demand first and then DHW. Moreover, the additional thermal energy was provided (if needed) via two elements installed at each consumption point, SH and DHW (Figure 3).

2.1. The Energy System and the Dwelling

The studied system is inspired by pilot experimental work carried out by DMU [22,36]. The model of the pilot project with minor modifications was implemented in TRNSYS [44]. Moreover, the major components of the system, such as the PVTs and the borefield, are validated via experimental data from DMU’s project and additional experimentation [44,45]. Due to the already made assessment of the system’s mathematical model, the analysis of the system is overviewed. However, basic information is presented below regarding the mathematical model of each component, with the aim of facilitating the comprehension of the presented study.
The mathematical model of the PVT collector is based on Sakellariou and Axaopoulos [45] transient model, which is an evolution of the steady state energy balance model introduced by the Hottel and Whillier [46]. The useful heat rate produced by the PVT collectors can be estimated by the general solution of Equation (1), which is the transient energy balance equation of the collector [45]. The transient model has been validated through experimental data [45] by achieving RMSD of 0.66% to 4.22% for the temperature of the fluid exiting the collector and from 4.15% to 14.9% for the power production. Moreover, the model was formulated as a new TYPE (component) in TRNSYS for the needs of the parametric analysis. In Table 2, the main parameters of the PVT collectors used for the current study are listed.
( M c p ) C d T p m d t = S A C Q · u P · e Q · loss
where, in Equation (1): Tpm is the collector’s absorber mean temperature (K); t is time (s); (MCP)C is the heat capacity of the collector; S is the absorbed irradiance (W m−2); Ac is the collector’s area (m2); Qu is the useful heat rate produced by the collector (W); Pe is the power produced by the PV cells (W); and Qloss are the heat loss rate of the collector (W).
With regard to the mathematical model of the geothermal heat exchanger, this was formulated via Hellström’s Duct Ground Heat Storage Model (DST) [47]. The solution provided by the DST model is estimated by superimposing two numerical calculations and one analytical calculation of the heat conduction equation in the soil (TYPE 557 from TRNSYS). The proposed heat exchanger has been validated via four months of experimental data. The RMSD of the model against the data was found to be 4.43% for the GHE outlet temperature. Concerning the GHE used at the current study, it is a very shallow borefield, 2 m deep, with a distance among the BHEs of 2 m. It has to be noted that the size (volume, VEEB) of the EEB is related to the number (Nbor), the length of the borehole heat exchangers (Lbor) and the distance between boreholes (Dbor) according to Equation (2). The borefield was 1 m underneath the dwelling without any thermal insulation, and the main parameters of the GHE are listed in Table 2.
V EEB = L bor N bor π ( 0.525 D bor ) 2
For the heat pump, a new TYPE was formulated in TRNSYS. The heat pump’s new type was developed to account for the performance data according to EN 14511 and the delivered heat, forming the GHE and PVTs. The performance data of the heat pump are sourced from a well-known German manufacturer. The operation envelop of the heat pump is from −10 °C to 25 °C for the evaporator and from 30 °C to 55 °C for the condenser.
The hydraulic connection between the PVTs and the GHE was implemented to be in-series, via the plate heat exchanger, as is shown in Figure 3. The heat from PVTs was used by the system when the PVT’s exit bribe temperature was 6 K higher than that of the EEB (soil temperature adjacent to BHEs). The evaporator of the heat pump supplied heat by solar and/or the ground (EEB) loop. If no heat was demanded by the dwelling, the heat from PVTs was stored in the EEB (Table 1). The dwelling’s heat transfer system was an under-floor heating system, with heat pump providing water at 31 °C. As regards the DHW, this was based on an immersed heat exchanger in the DHW tank supplying water from the heat pump at 45 °C. As regards the electric energy yield of PVTs, this was delivered totally to the power grid by accepting an overall loss of 10%. The aforementioned loss accounts for joule cable losses and the efficiency of the inverters. Moreover, an annual drop of 1% in the PVTs’ electrical efficiency was considered. The above operation modes of the system are listed in Table 1.
As regards the simulation scenarios, these were carried out with five sizes of PVT arrays paired with five sizes of EEB. For PVT arrays of 4, 8, 12, 16, and 20 collectors (strings of four PVTs connected hydraulically) and with EEB of 4, 8, 12, 16, and 20 BHE; in total, 25 simulations for each city. For each string of PVTs, a flowrate of 100 kg h−1 was applied (25 kg h−1 PVT−1) and 8 m of thermally insulated piping was assumed for every string. Table 3 illustrates all the PVT arrays along with the borefields and the volume of the EEB and the corresponding storage capacity (SC) for each pair. The storage capacity is the ratio between the heat storage volume of the EEB and the PVT collectors’ area. In other words, here the SC depicts the ratio between the storage volume–capacity and the apparatuses of the heat production.
As regards the dwelling, this was assumed to be a two-story building with a total occupation area of 100 m2 for a single family of four. It was hypothesized that the dwelling was built according to the national energy-saving regulations for residential buildings applied in each country. The dwelling’s model was developed in TRNSYS via TYPE 56, and the layout was common for all cities. Moreover, it was assumed that both stories were maintained at a mean air db temperature of 19 °C all day round (during the heating season). The DHW needs of the dwelling were set to be 35 L per day per person (140 L day−1 for a family of four) at 45 °C. The volume of the DHW tank was set to be 200 L and the consumption profile of DHW was based on the well-known f-Chart method [48]. The main parameters of the heating load (space heating and DHW) are listed in Table 4 for all locations. Concerning the space heating load (Table 4), this was estimated through the TYPE 56, which can provide the user with the hourly thermal energy demand of the building. Similarly, the DHW load was estimated by the difference between the water main temperature at the given time and the DHW set temperature of 45 °C multiplied by the hourly water demand. The water main temperature was provided by the weather TYPE 15 of TRNSYS. The auxiliary space heating and DHW systems were set to consume electricity when necessary. This is an acceptable solution for a relatively small-sized system, especially one in which electricity is already available.

2.2. Energy Metrics

The energy performance evaluation of the system was carried out through two energy indicators. The first index is the ratio between the delivered electricity from PVTs and the electricity consumed (in total) by the system. In other words, the renewable power fraction (RPF) [52] depicts the level of the energy self-sufficiency of the system (Equation (3)). It is worth mentioning that, in the current study, household consumption is not considered (kitchen, fridge, etc.). The RPF is a ratio which gets on its numerator the electricity delivered to the power grid by the PVTs (EPVT_u), while the denominator receives all the system’s consumption. In more detail, the power consumption of the system is the heat pump (EHP), the consumption of the circulation pumps (Eparasitic), and the auxiliary heat (Eaux). In this study, Qaux and the Eaux represent the same amount of energy, by assuming the conversion factor from electricity to heat equal to 1. Lastly, it is important note that an RPF higher than one indicates an energetically self-sufficient system.
RPF = i = year 20 [ E PVT _ u E H P + E parasitic + E a u x ] i
As the second energy indicator, the seasonal performance factor (SPF) is chosen. In the present work, the 4th boundary for the estimation of the SPF is implemented according to the [53]. By that, all the consumption up to the heat to be delivered from the sources to the dwelling are considered in the denominator of Equation (4). The SPFH4 states the ratio between the delivered heat (Qcond) by the system and the system’s consumed electricity, Equation (4).
S P F = i = y e a r 20 ( Q c o n d ) i i = y e a r 20 ( E H P + E parasitic + E a u x ) i

3. Results and Discussion

The simulation results are presented and discussed in three sections, which correspond to three different aspects and energy indicators: the renewable power fraction (Section 3.1); the seasonal performance factor (Section 3.2); and the heat flow on the EEB (Section 3.3).

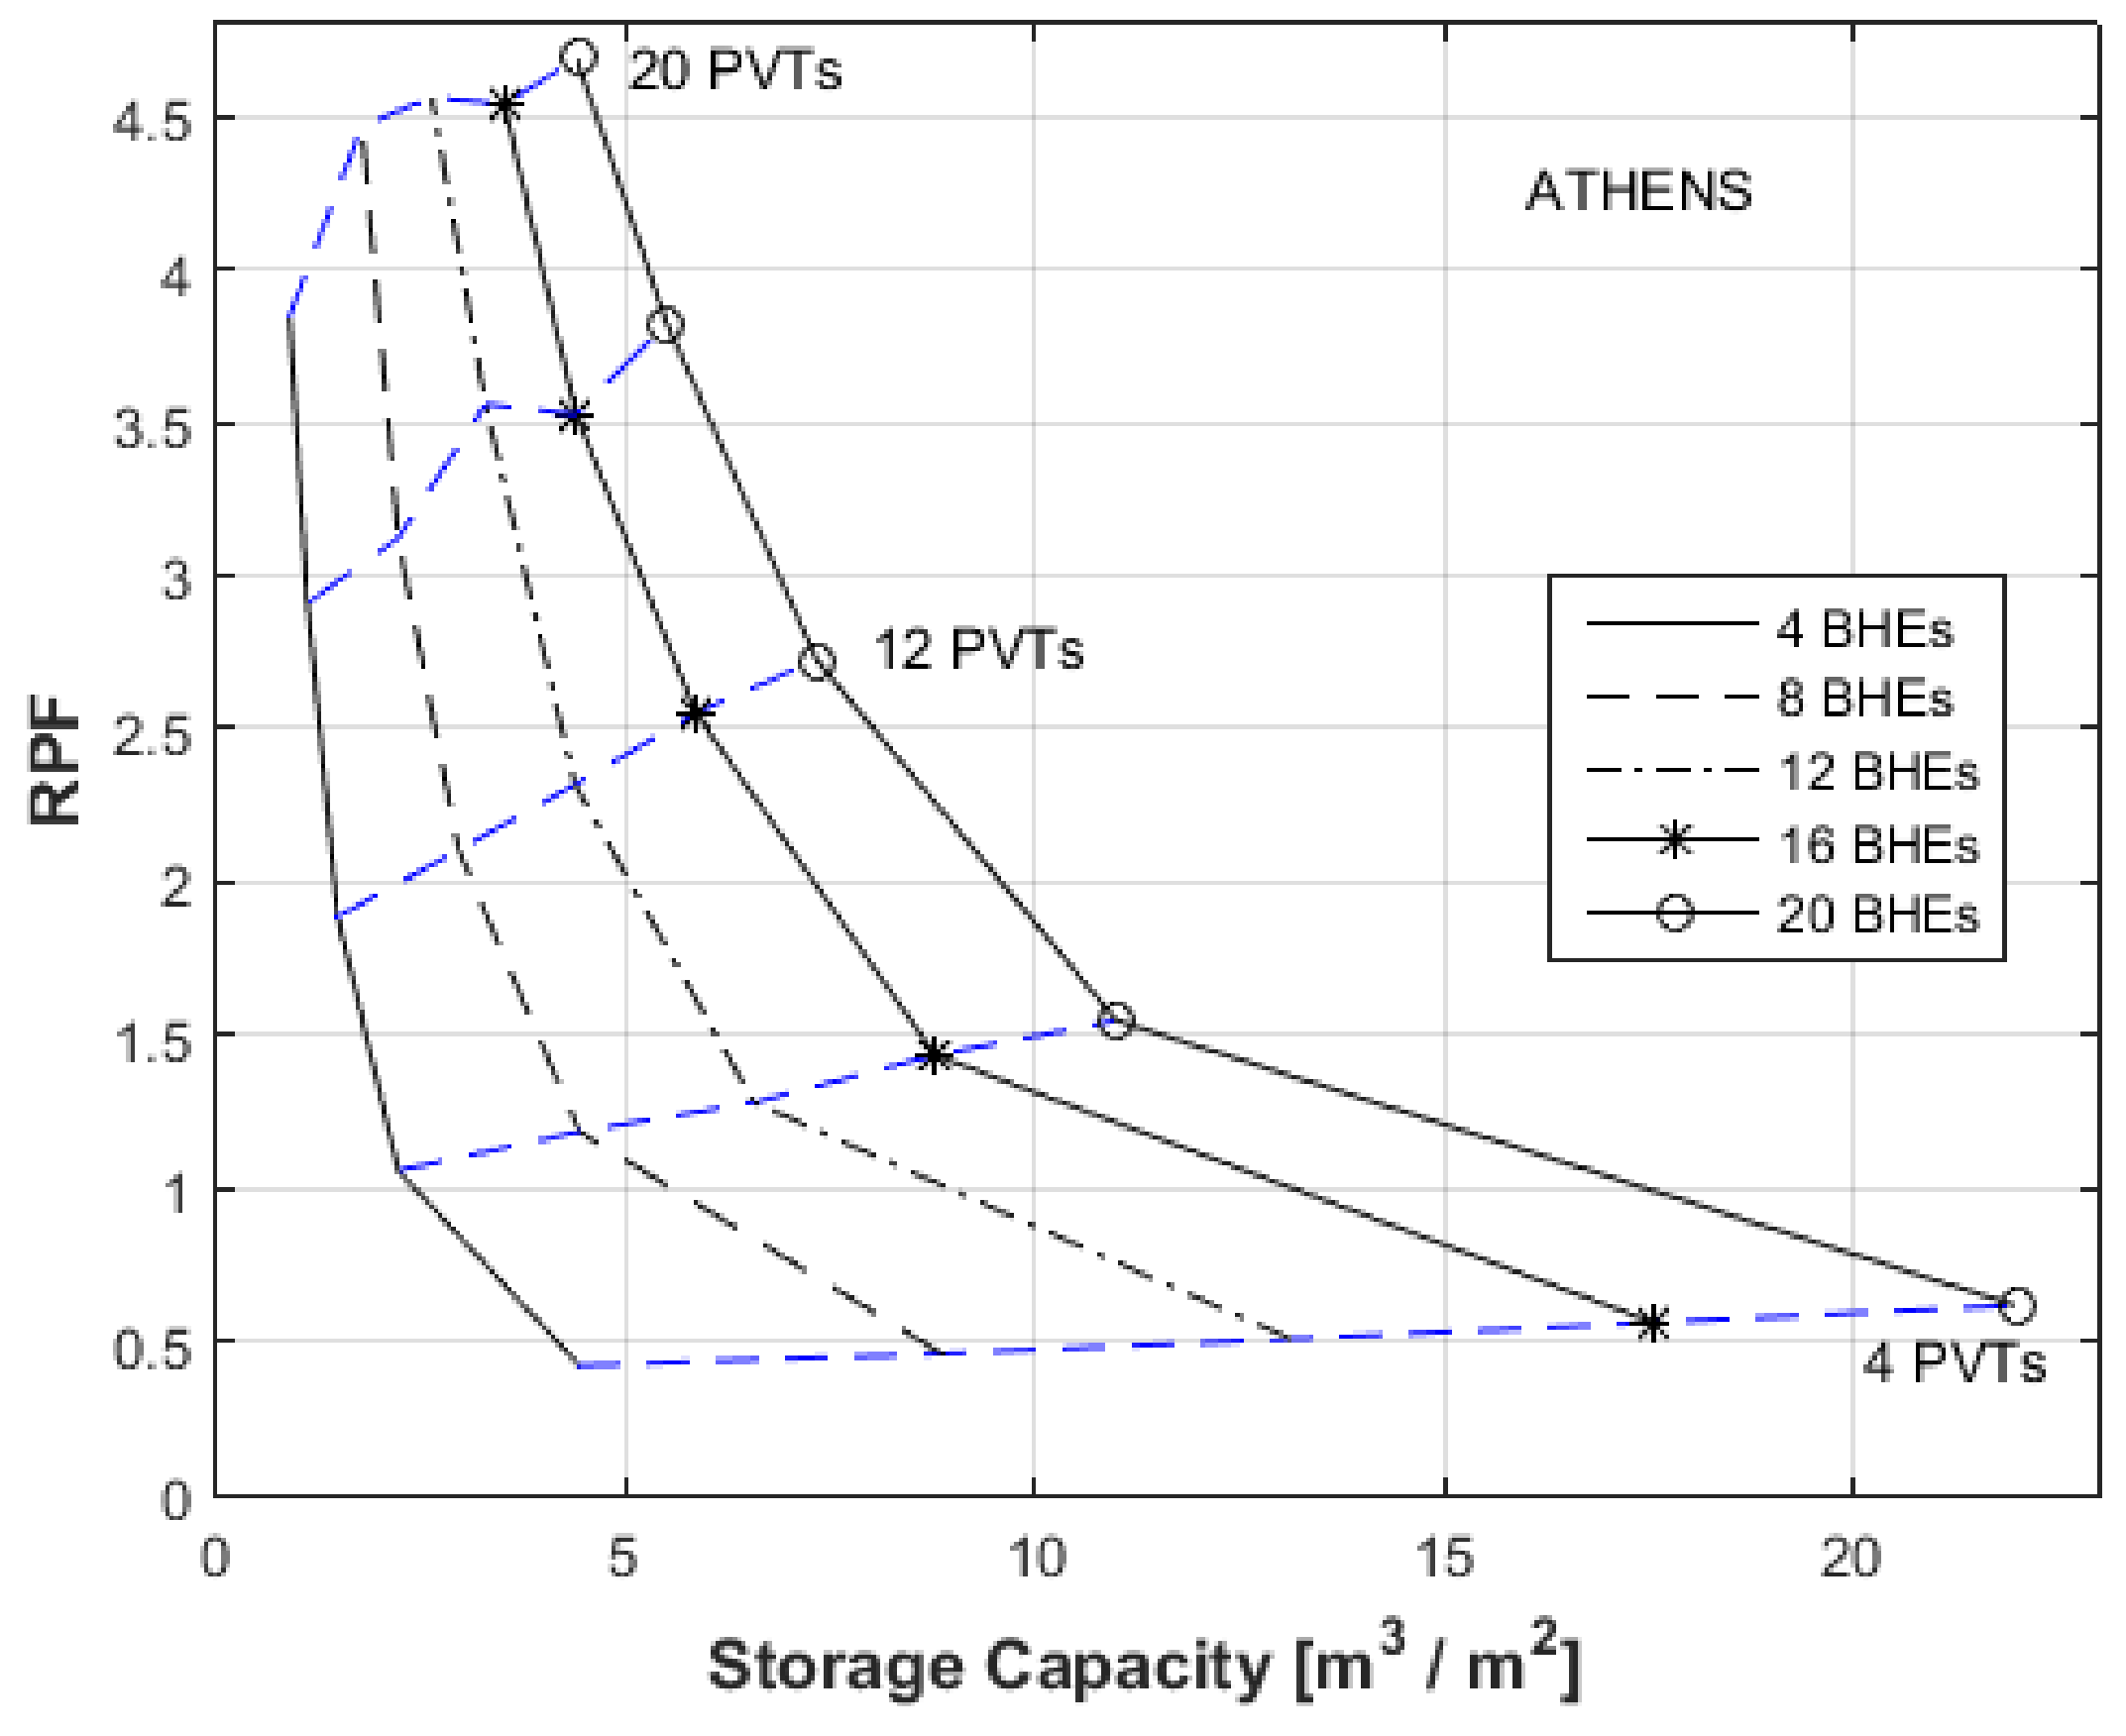
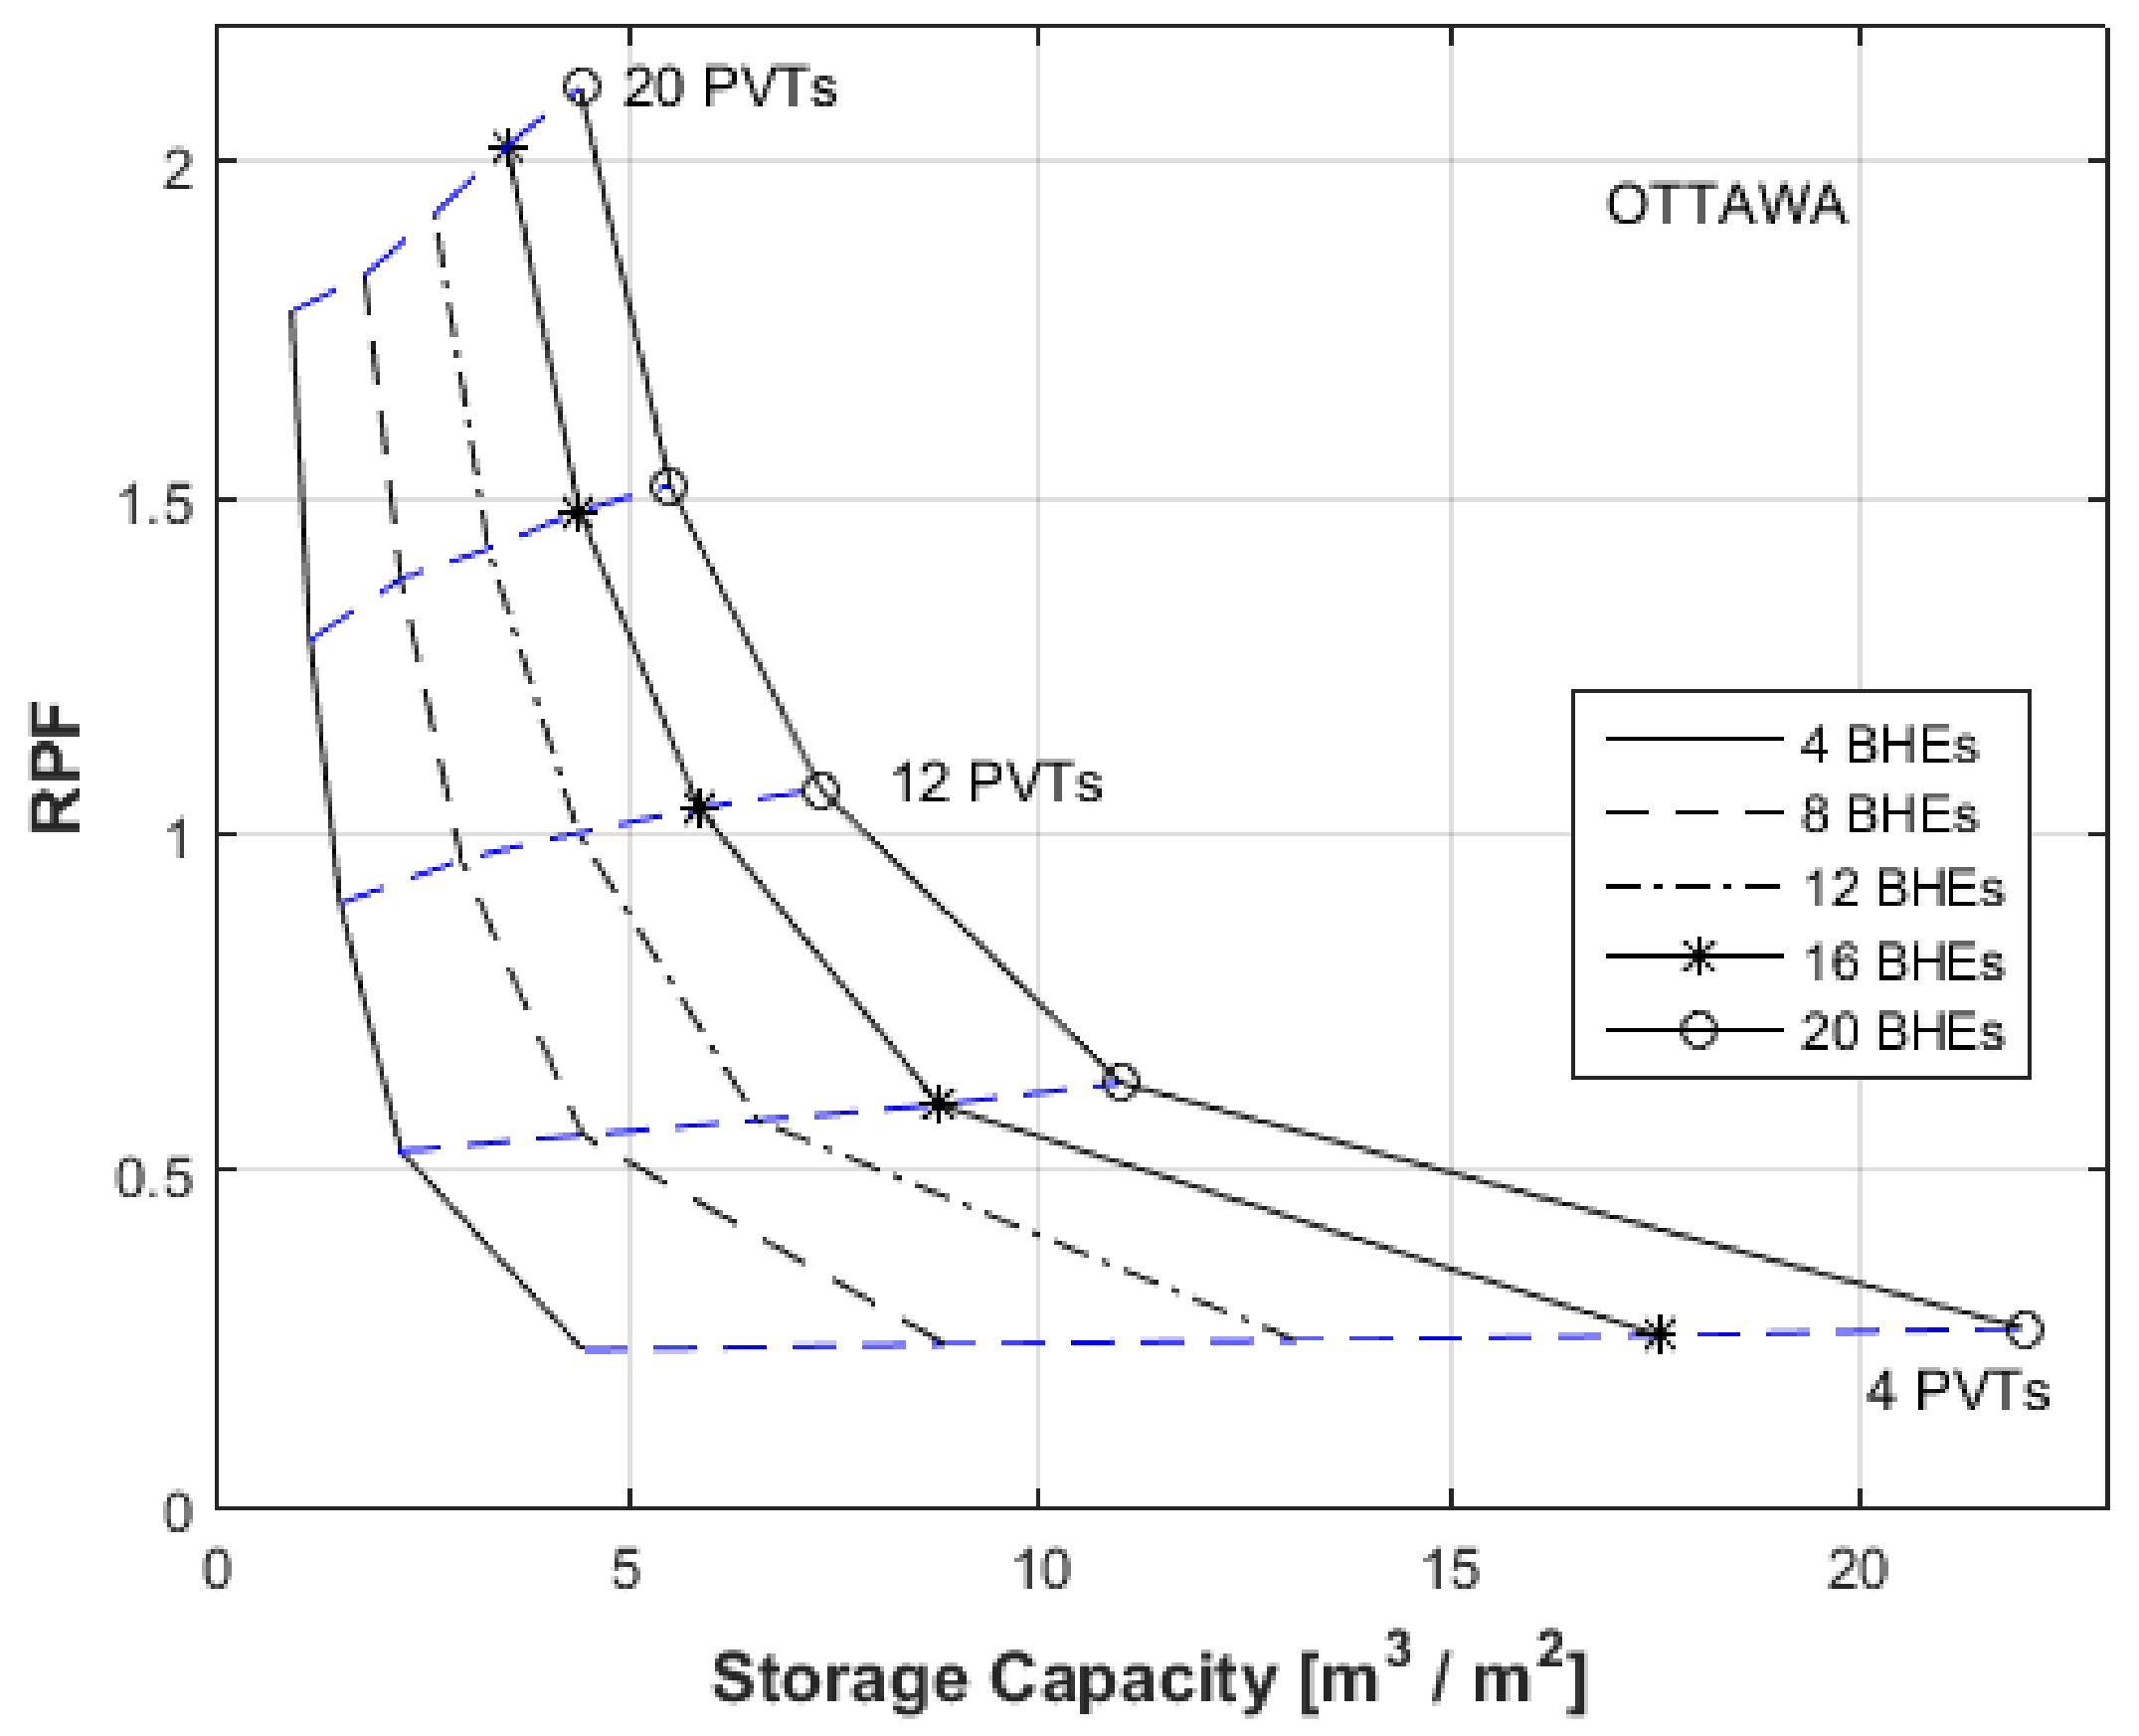
3.1. Renewable Power Fraction

The investigated PVT-based SAGSHP system has the capability to coproduce heat and power. In this regard, power production is interrelated to heat production and, particularly, to the temperature at which the heat is stored in the EEB. The EEB is the long-term thermal energy storage component of the system. As the storage temperature increases, the soil temperatrue negatively influences the power production of the PVT array by increasing the PV-cell temperature [54]. A valid method to evaluate the overall energy performance of the system equipped with PVTs is to utilize the RPF (Section 2.2), this indicator has been used successfully in many cases [52].
In Figure 4, the RPF for Athens is illustrated as a function of the storage capacity. Based on the results, the system, out of all its size variations, obtains an RPF of about 0.4 to 4.7. All RPF values higher than 1 indicate a self-sufficient system, as regards its annual electricity anergy consumption. Thus, all systems with a PVT array of 8 PVTs and larger are self-sufficient for Athens, regardless of the size of the EEB. That is justified by the tabulated results in Table 5, which show the consumption and the generated electricity for the systems with all PVT array variations paired with a borefield of 12 BHEs. The results of Table 5 refer to the midline of Figure 4 (the third from the bottom). As it can be seen in Table 5, the electricity produced by PVTs is proportional to the size of the array. As regards the consumption, that of the heat pump (EHP) is larger across all scenarios and drops as the PVT array enlarges. The reduction is caused by the larger amount of augmented solar heat production, which charges the EEB with more heat and, due to that, raises the average temperature of the soil. The higher temperature of the soil positively influences the performance of the heat pump by elevating the temperature of the brine entering the evaporator. As is well known, the higher the evaporator temperature, the higher the performance of the heat pump, and this lowers the consumption of electricity by the compressor. The second significant consumption of the system is that of the auxiliary heat (Eaux_SH, Eaux_DHW), the consumption also reduces as the PVT array enlarges. This improvement is made by the system’s capability to have more available heat, thus the requirement for auxiliary heat is reduced.
A trend that can be identified in Figure 4 is that the enlargement of the storage capacity improves the RPF of the system for all PVT arrays. Moreover, it can be seen that the larger storage capacity enhances the RPF as the PVT array enlarges. Therefore, for the system with four PVTs, the RPF increases by about 0.2 from the smallest EEB (four BHEs) to the largest one (20 BHEs), versus the system with 20 PVTs, where the largest EEB improves the RPF by 0.9 from the smallest one. The asset of having large EEBs lies in the fact that the available solar heat from the PVT collectors can be stored and used later, on the evaporator of the heat pump or by reducing the electricity consumed by the systems, as is discussed in the previous paragraph.
Figure 5 illustrates the RPF for Melbourne for all the investigated scenarios. The obtained RPF for Melbourne varies from about 0.2 to 3 for the smallest to the largest system, respectively. The RPF for Melbourne exhibits similar trends to those described for Athens, the RPF increases as the PVT array and the EEB enlarge. As regards the self-sustainability of the system, this can be obtained with the PVT array having more than eight collectors. The storage capacity for all scenarios with 20 collectors remained lower than 5 m3 m−2, but in this range, the system increases the RPF by about 0.8. In other words, the systems with 20 PVTs can produce 80% of their annual electric energy consumption by installing the largest EEB against the smallest one. The contribution of the storage capacity to the RPF diminishes as the number of collectors reduces.
In Table 6, the electric energy consumption and the electricity produced by the PVTs for the systems with 12 BHEs and all PVT arrays for Melbourne are listed. As can be noted, the demand for electricity by the heat pump (EHP) is the larger consumption for almost all scenarios. The only exception is for the array of four PVTs, where the auxiliary energy (Eaux_SH, Eaux_DHW) is larger than that of the heat pump. It is worth mentioning that auxiliary consumption is significantly high, and it is assumed that this is provided by electricity. It turned out that this amount of auxiliary energy should be considered during the design of the system, with the aim of achieving higher self-sustainability. Other than that, the auxiliary heat is reduced rabidly as the solar heat from PVTs (QPVT) contributes more to the system by elevating the average temperature of the soil and increasing the available heat in the EEB.
In Figure 6, the RPF for Ottawa is illustrated as a function of the storage capacity. The largest value for Ottawa is recorded as 2.1 for the largest system and the lowest as 0.25 for the smallest one, respectively. The obtained RPF for Ottawa can be marked as significantly lower than that of Athens (Figure 4), with the main cause being the hard winter (Figure 1). Low temperatures implicitly influence the space heating load and the temperature of the soil, thus, consequently, heat loss from the EEB. The self-sufficiency for Ottawa can be distinguished into three sections: (a) for small EEBs of four and eight BHEs with PVT arrays larger than 12 collectors are required; (b) the case of 12 BHEs, where the system gets RPF larger than 1 from the array of 12 PVTs; and (c) for the larger EEBs of 16 and 20 BHEs, all PVT arrays equal and above 12 collectors are capable of RPF larger than 1.
The annual electric energy consumption for Ottawa is listed in Table 7, along with the generated electricity from PVTs for the system with 12 BHEs and all PVT arrays. Similarly to the results for Athens and Melbourne, the annual consumption of the heat pump is the largest consumption of the system throughout all the scenarios, followed by the auxiliary heat, which reduces significantly as the PVT array enlarges.

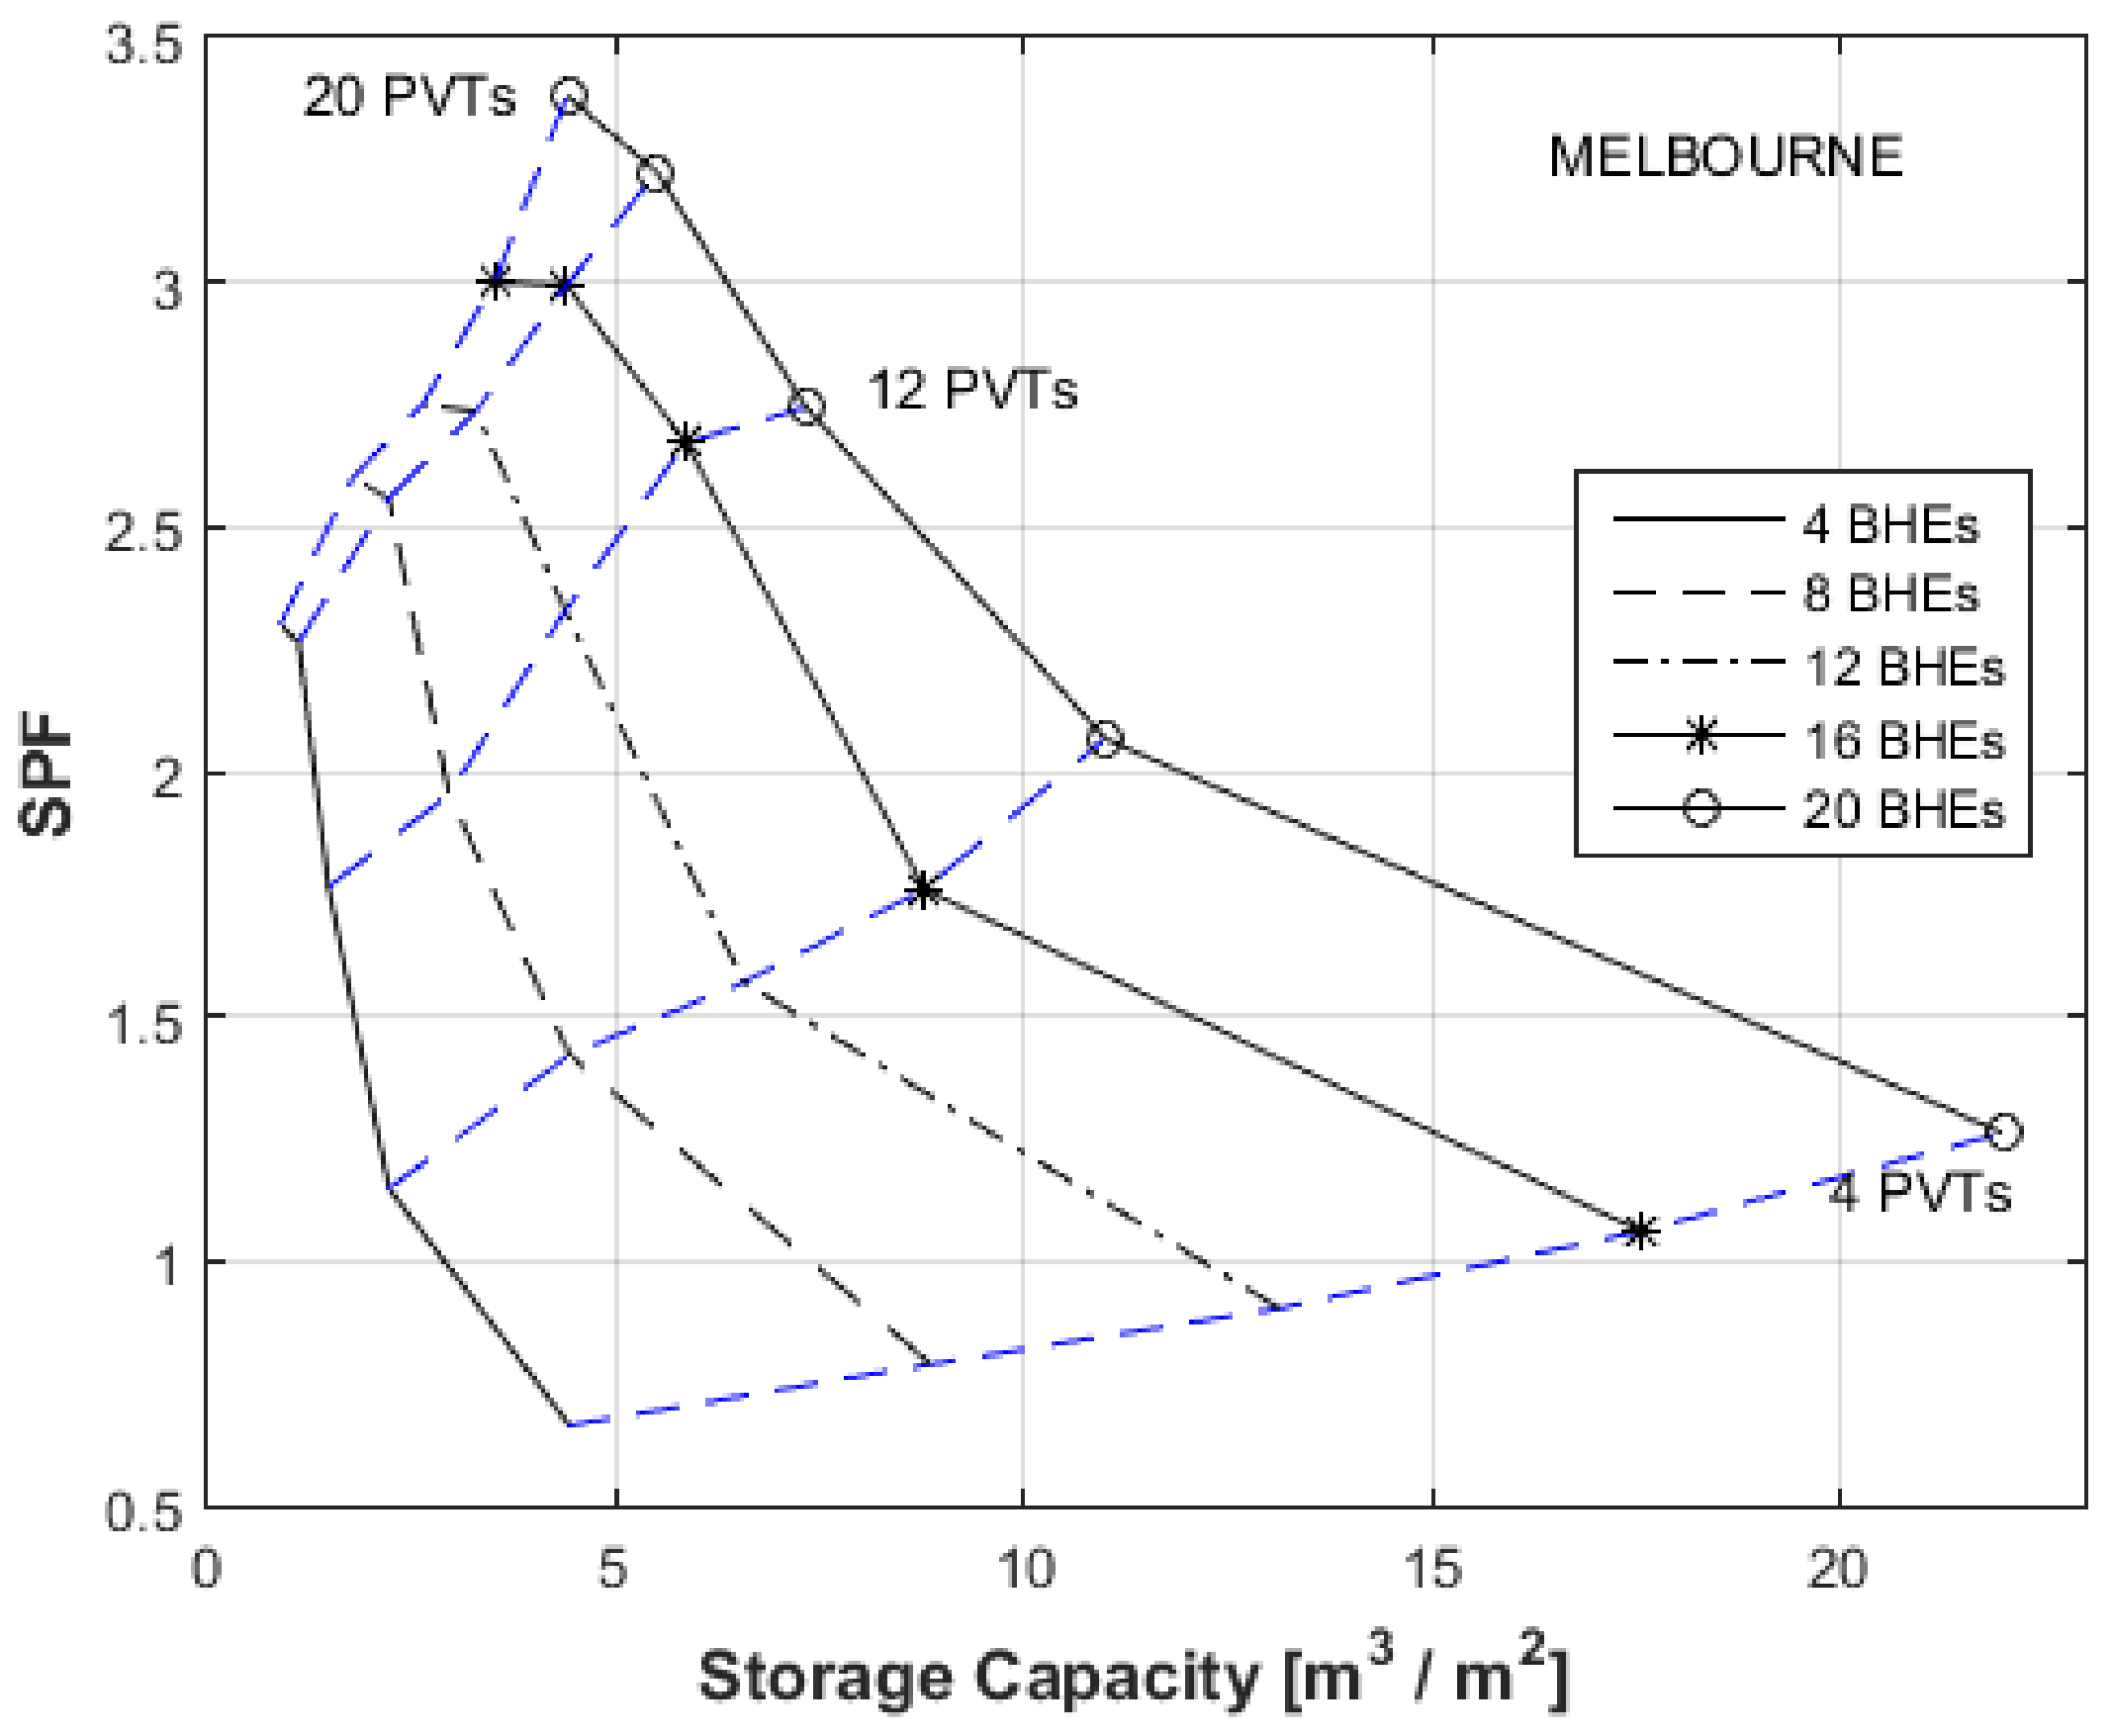
3.2. Seasonal Performance Factor

The SPF depicts the ratio between the heat delivered by the heat pump and the electricity consumed by the system (annually kWhheat/kWhelectricity). In the current analysis, it is assumed that the electricity from PVTs does not contribute to the SPF (Section 2.2). This is not exact regarding the performance of the system, but with this index, useful information can be gained regarding the heat production by the heat pump. In addition, by subtracting the EPVT in the denominator from the consumption, the SPF receives an infinity value for RPF larger than 1, and that does not provide any useful information. In this regard, Figure 7 illustrates the SPF for Athens and for all PVT and BHE arrays. The obtained SPF for Athens was found to be 0.65 for the smallest system and up to about 2.6 for the largest one. The SPF is influenced significantly by the storage capacity, with the higher values improving the energy performance of the system with specific PVT arrays. Table 5 illustrates many energy aspects—the results for Athens and for the system with 12 BHEs and all available PVT arrays. These results stand for the mid line of Figure 7 and, as it can be seen, the larger the PVT array, the higher the SPF. By reading Figure 7 in conjunction with Table 5, for the EEB of 12 BHEs, the heat provided by the heat pump (QHP_cond) increases as the PVT array enlarges. Concurrently, the consumption of all these decreases as the number of collectors increases, with the only exception being the parasitic energy (Eparasitic), which is negligible compared to the others. Additionally, for a specific EEB, as the PVT array enlarges, the improvement in the SPF is due to the additional solar heat. In more detail, from the array of 4 PVT to this of 8, the SPF increases by 0.5, but for the larger number of collectors, the incrementation of the SPF drops.
Figure 8 illustrates the SPF for all investigated scenarios of PVTs and BHEs for Melbourne. The SPF for Melbourne was found to vary from about 0.6 to 3.4 for the smallest and the largest systems, accordingly. Overall, the SPF calculated for Melbourne is higher than that for Athens, this is justified by the substantially higher QHP_heat (Table 6) delivered for Melbourne compared to that for Athens (Table 5). The high heating load of Melbourne drives the heating system (heat pump) to deliver more heat, which depletes the stored heat in the EEB and reduces the soil temperature. Consequently, this facilitates the capability of the system to deliver more solar heat and to store this in the ground. Given this, it can be stated that the ability of the system to provide heat is restricted by the demanded heating load: no or low load, the soil temperature stagnates and the solar energy cannot be stored further.
As regards the SPF for Ottawa, this is illustrated by Figure 9 in the simulation scenarios. Based on the simulation results, the SPF was estimated to be from 0.5 to about 1.8 for the system with the smallest PVT array and EEB to the largest PVT array paired with the largest EEB. The high EHP along with the significant large Eaux (Table 7) are the major factors for the relatively low SPF.

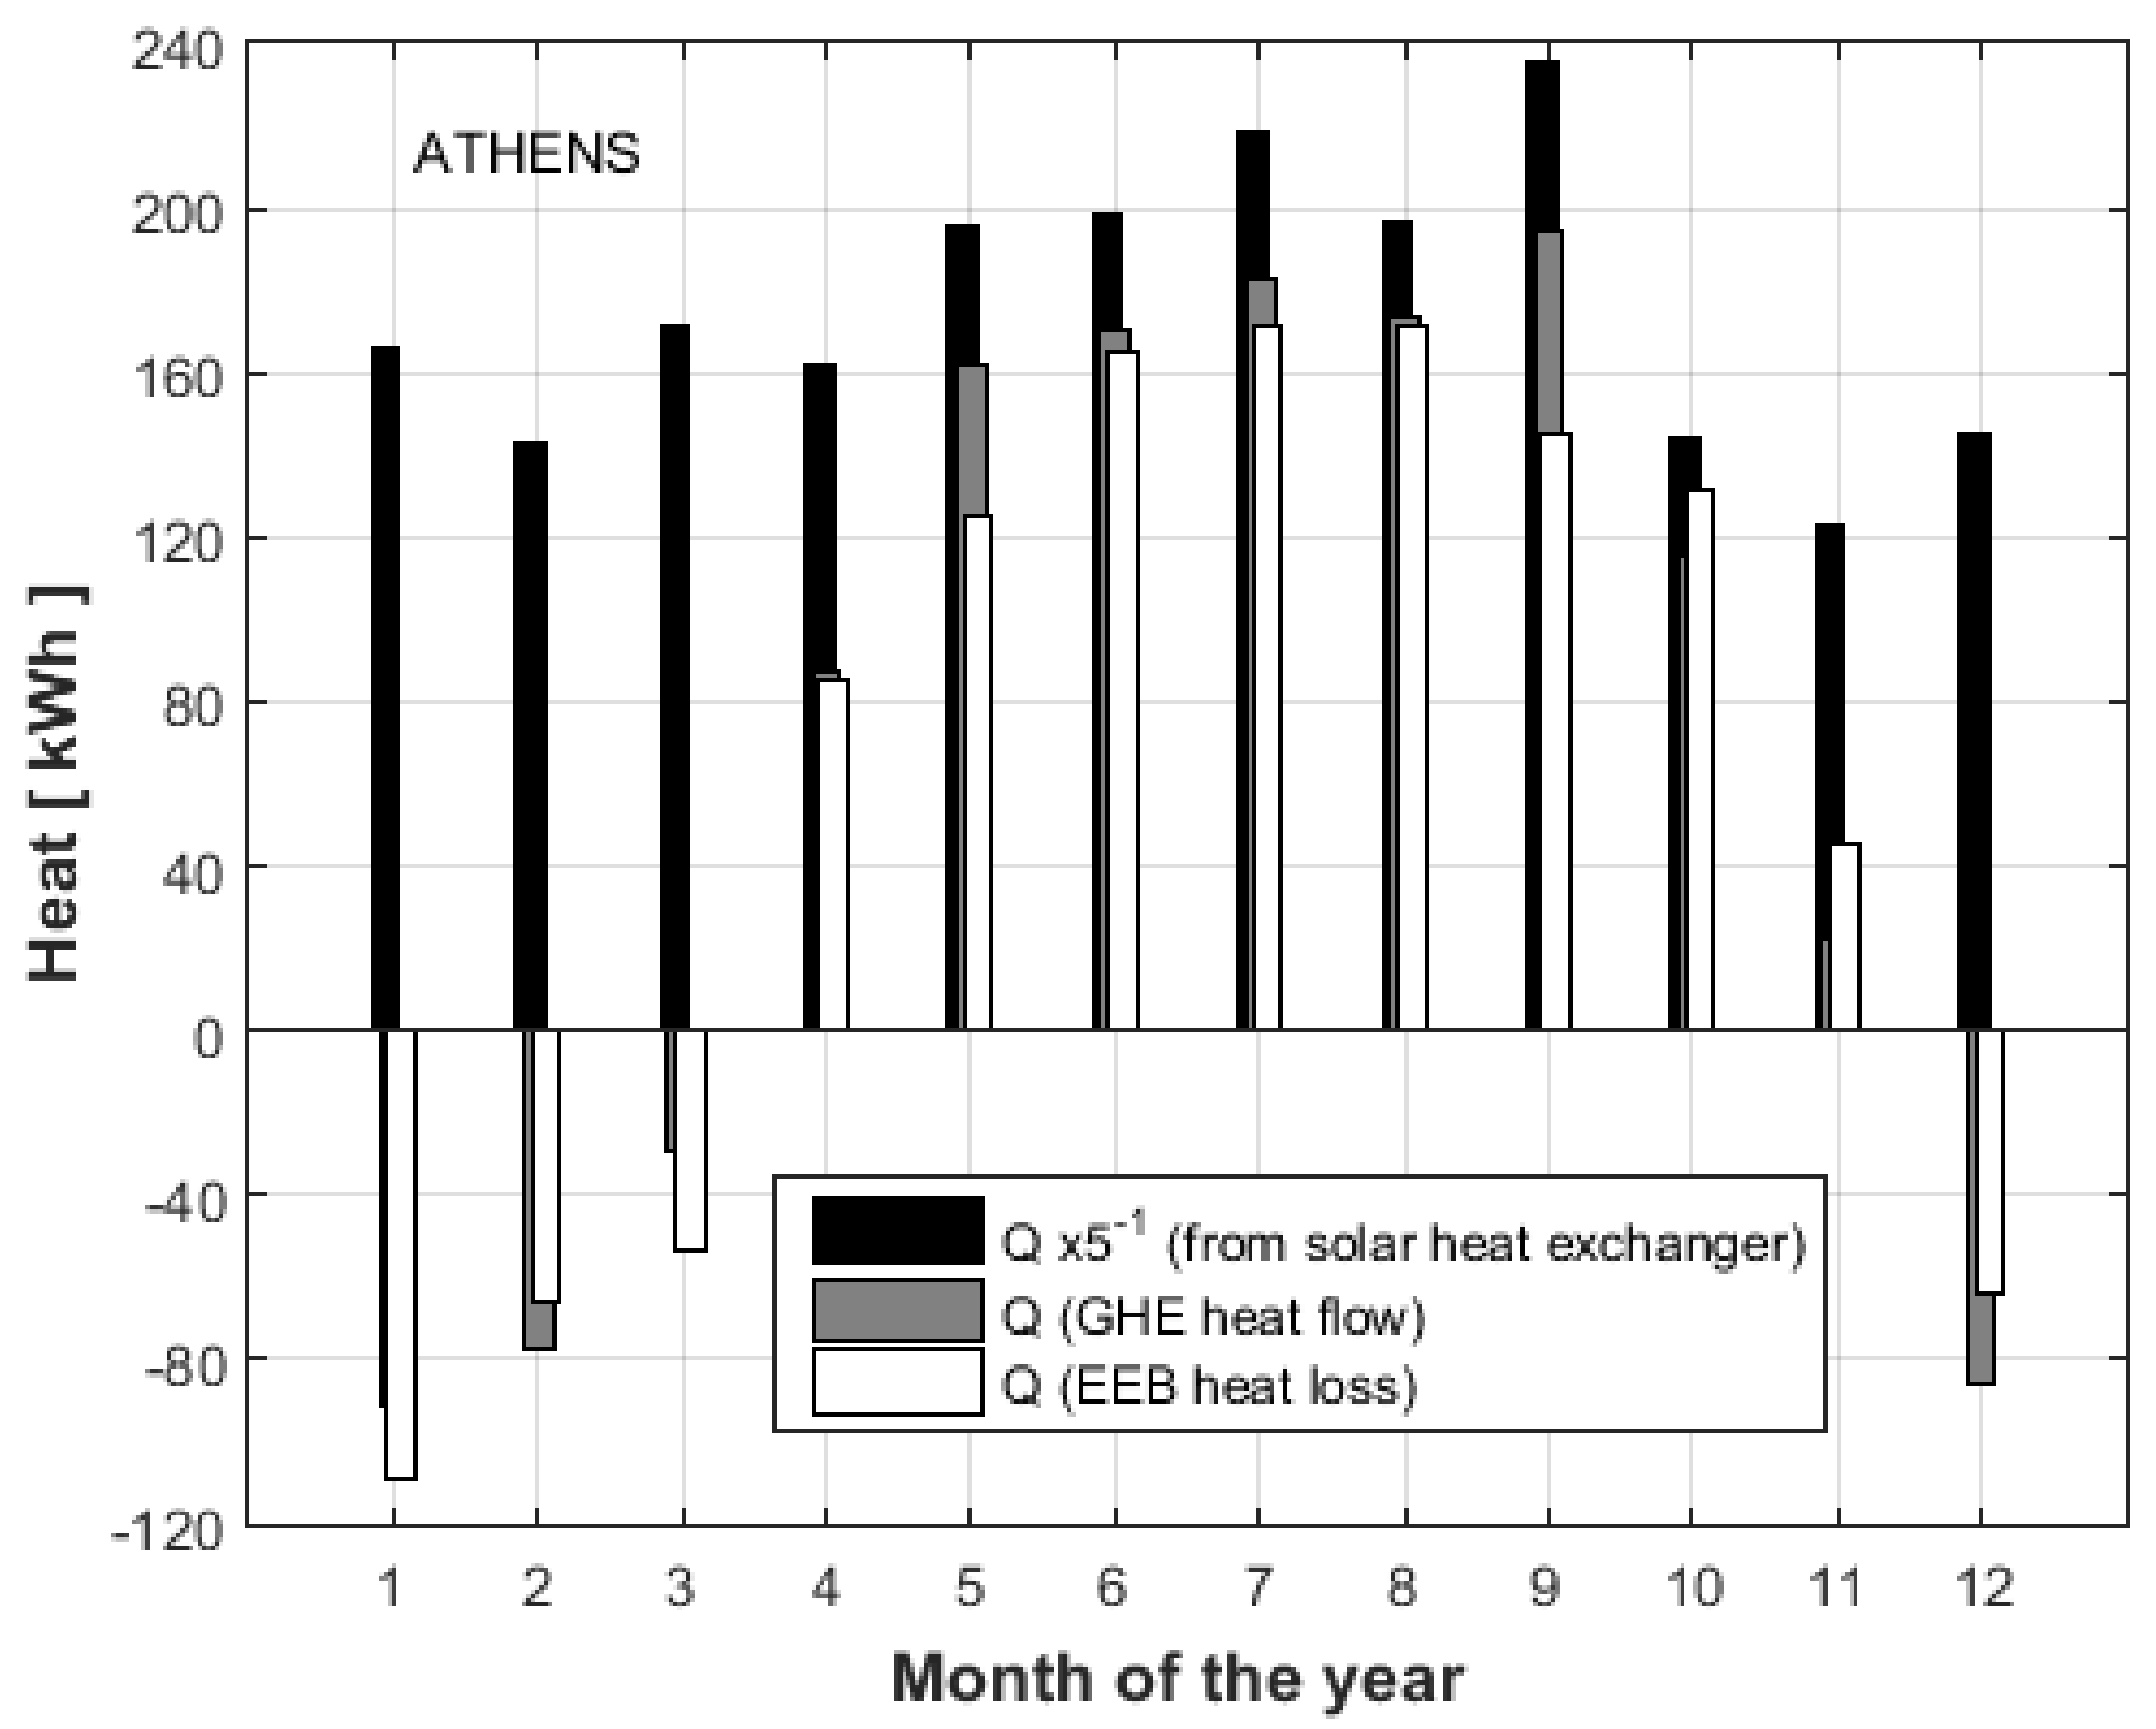
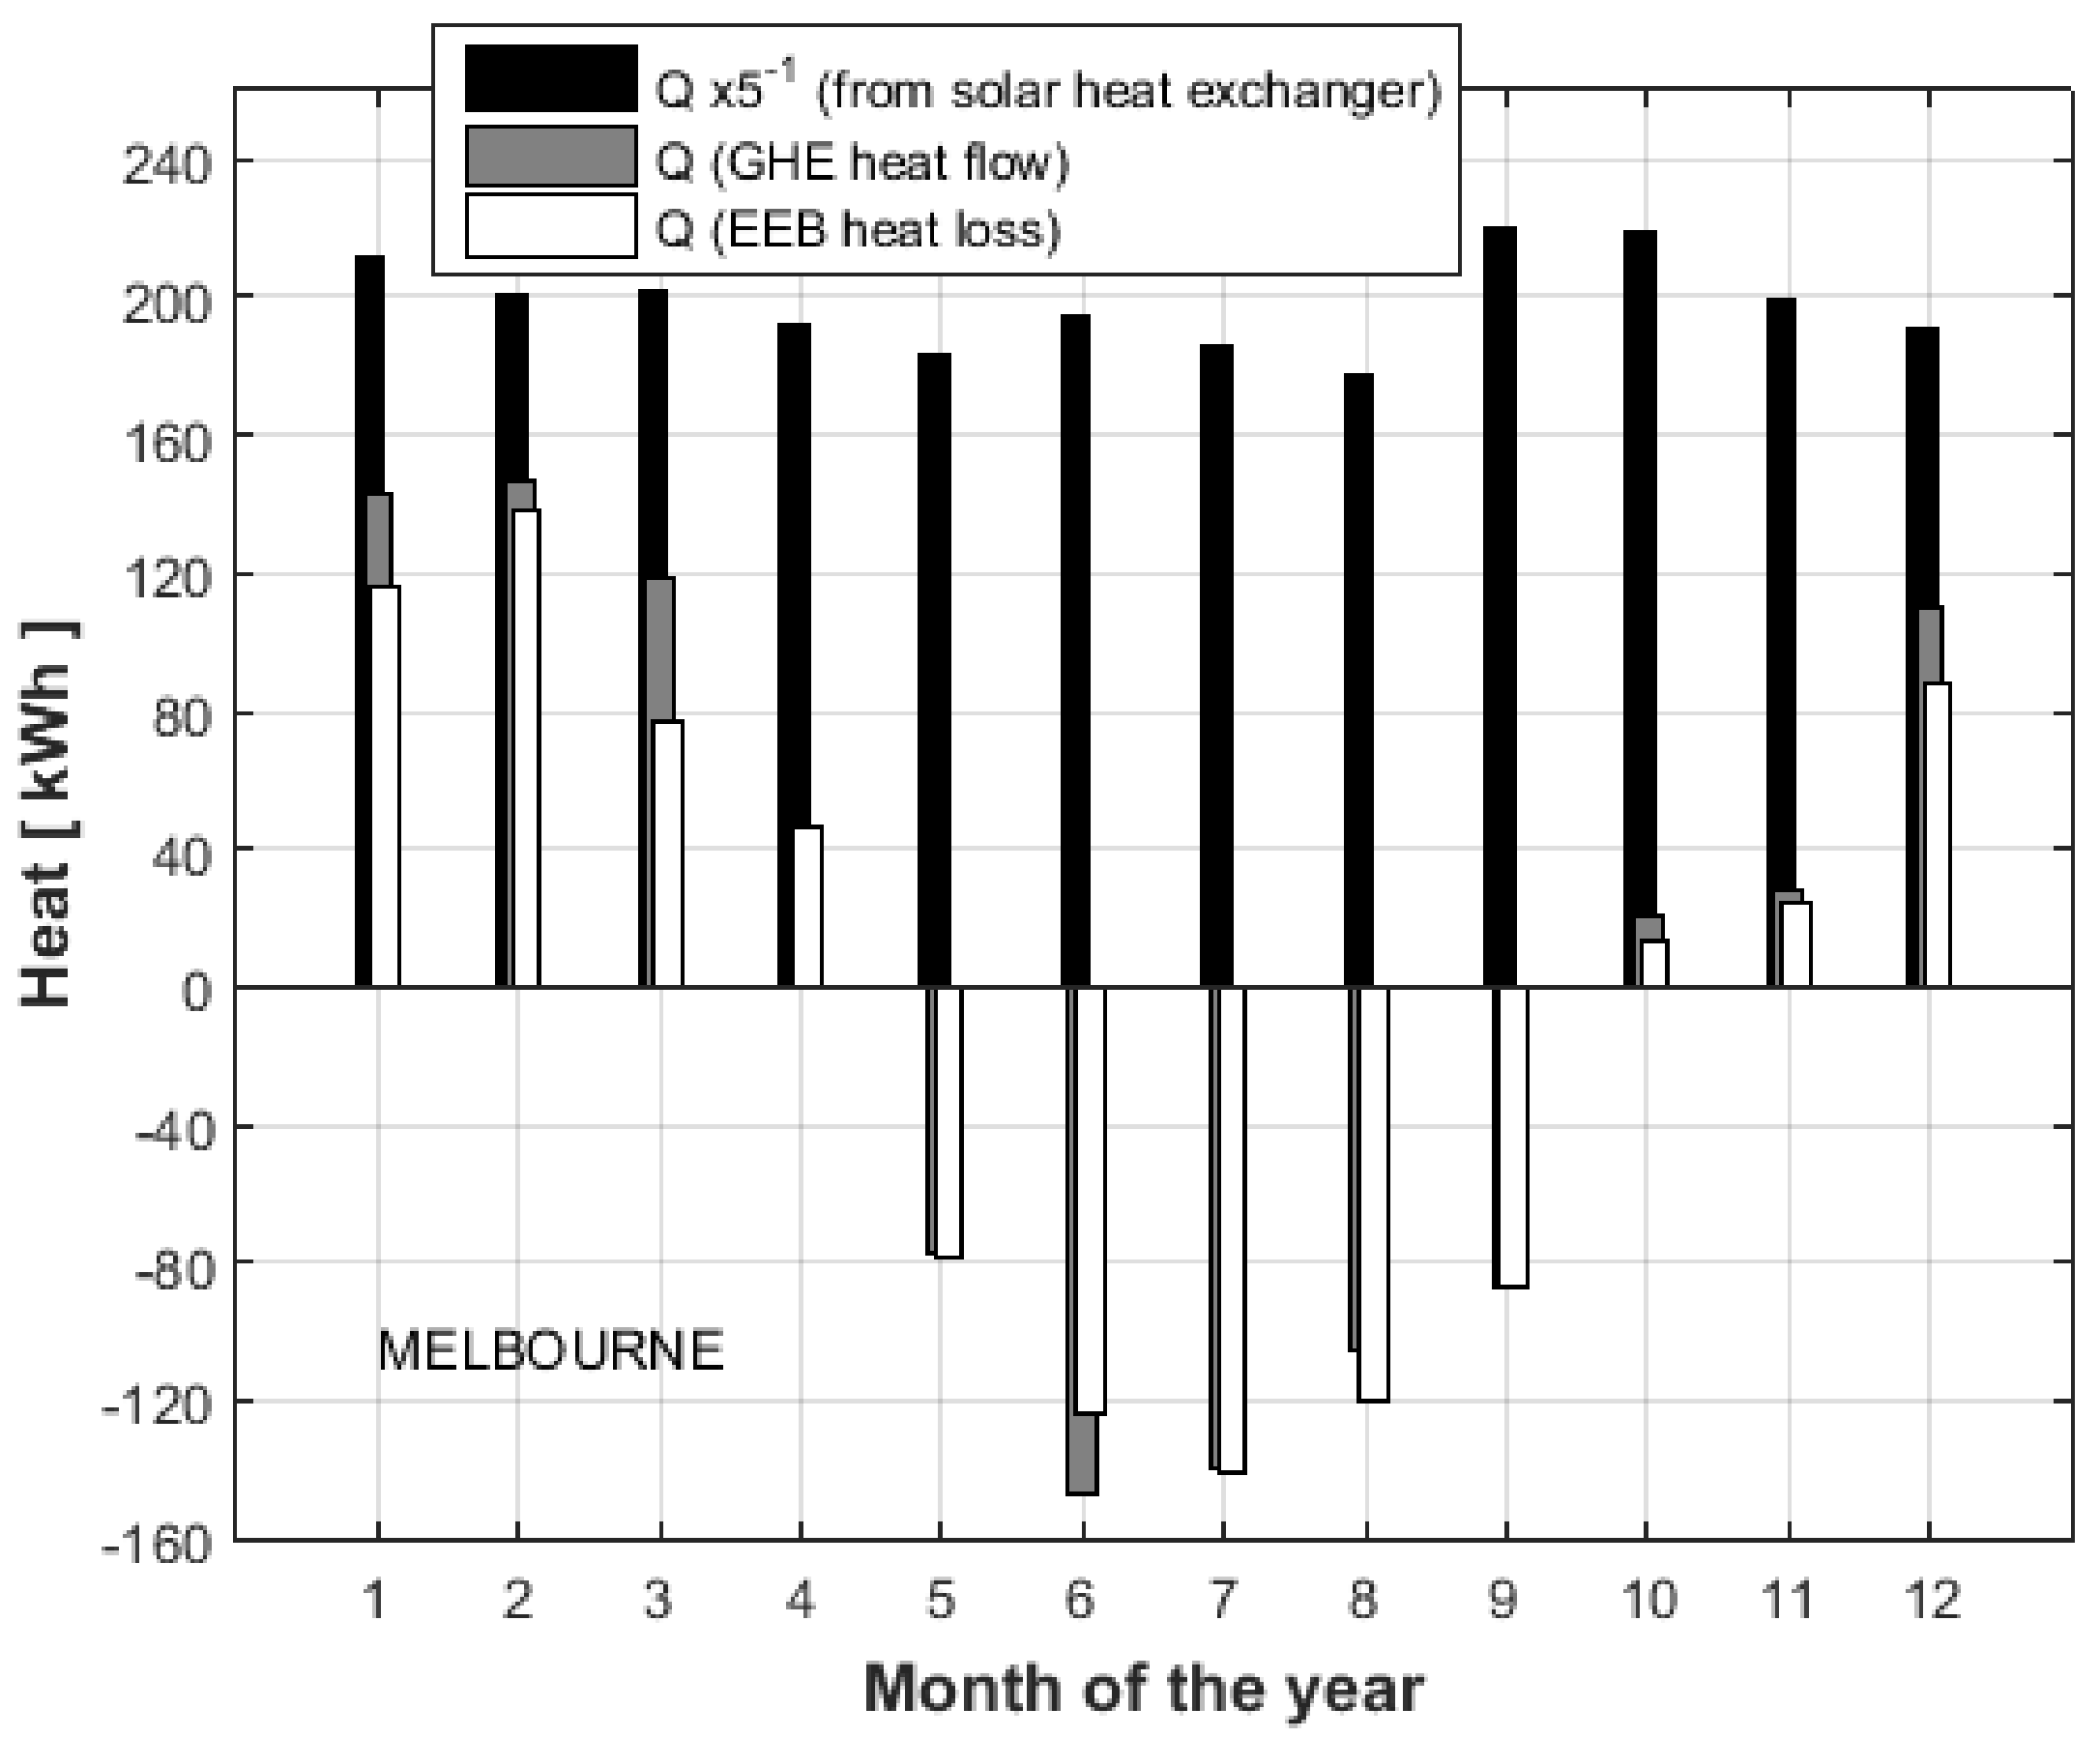
3.3. Heat Flow on the EEB

In Figure 10, Figure 11 and Figure 12, the monthly heat flow across the EEB for the 6th year of simulation for all cities and for the system with 12 PVTs paired with 12 BHEs (EEB = 83 m3) is illustrated. The 6th year is chosen with the need to get results referring to the EEB after the initial transient period as regards the soil temperature, which, for the current analyses, was the post-three period after initiation. These figures show three monthly thermal energy values related to the EEB: the heat provided by the solar heat exchanger (QSHE), the heat transferred from the solar loop to the ground loop via the plate heat exchanger (Figure 3); the heat transferred to (+) and from (−) the soil (QGHE) via the GHE (borefield); and the heat loss from the EEB (QGHE_loss) to the adjacent soil mass (which can be loss and gains as well).
As illustrated in Figure 10, for Athens, the solar heat QSHE is provided to the systems all year long, with the most productive month being September. The solar heat production remains high during the heating season as well due to low soil temperatures, which augments the operation of the PVTs. As regards the solar heat stored in the EEB, this is the positive part of the QGHE and takes place from April to November, with the highest value being September. From December to March, the heat stored in the ground is provided as additional heat to the solar on the heat pump, this is the negative part of the QGHE. Moreover, the stored heat in the ground is utilized disproportionally during the heating season, from the about 1000 kWh transferred into the ground during the charging period, only about 200 kWh is used during the heating period. This discrepancy is due to two major causes: the EEB suffers from heat loss QGHE_loss, which follows the storage production pattern and is proportional to the soil temperature of the EEB; and secondly, the offered solar heat QSHE is substantial during winter, thus it can be used directly with no need to extract the stored amount. It is worth noting that, during the heating season, the EEB receives heat from the adjacent soil mass (negative loss), which contributes to the available heat.
Figure 11 shows the heat flow across the EEB for Melbourne and for the systems of 12 PVTs installed with 12 BHEs. Similarly to the results for Athens, the solar heat production can be considered all year round for Melbourne. The most productive months are September and October, which are spring months for Melbourne. The high levels of solar heat (Table 6) production all year round are caused by the high heat demand, which discharges the EEB and, by that, reduces the soil temperature. With a low temperature regime in the soil, the solar heat production augments (more frequently reaching the ΔT of 6 K between the PVTs and the soil). The storage period of the solar heat for Melbourne can be seen to be from October until April; similarly, the discharging period (heating season) extends from May to September. The stored solar heat (+QGHE) and the heat discharged from the EEB (−QGHE) are balanced, with about 500 kWh of heat to be stored and the same amount to be discharged. The heat loss of the EEB follows the pattern of the heat from the GHE, with positive and negative values to be balanced annually.
Ottawa has the coldest climate among the study locations (Figure 1 and Figure 2). The relative heat flows across the EEB for the system in Ottawa are graphed by Figure 12. The solar heat QSHE is produced throughout the year, by having the highest value in July and significantly lower production during the winter months. The heat storage period is from April to October, and from November to March, the heat is discharged from the EEB. The heat storage is uneven for the heat drug from the EEB, which indicates excessive heat loss during the charging period, which reduces the available heat of the EEB.

4. Conclusions

In the present work, a PVT-SAGSHP system is investigated regarding its energy performance for three cities with distinctive climates: Athens (Greece); Melbourne (Australia); and Ottawa (Canada). The mathematical model of the system along with the three buildings was formulated in TRNSYS and parametric analyses were carried out. The major aim was to get quantitative information regarding the influence of the system’s performance by the size of its long-term storage component (EEB) and the PVT array.
The self-sufficiency of the system as regards the annual energy was evaluated via the RPF; values larger than 1 indicate self-sufficiency. The highest RPF was found for all locations with the largest system (20 PVTs and 20 BHEs). The highest RPF was found at 4.7, 3, and 2.1 for Athens, Melbourne, and Ottawa, respectively. Athens and Melbourne were found to be self-sufficient with all PVT arrays larger than four collectors and four collectors, respectively, regardless of the size of the EEB. As regards Ottawa, the self-sufficiency was found to be related to the size of the EEB, thus, for small EEBs (four and eight BHEs), more than 12 PVTs are needed, for the larger EEB, any PVT array larger than eight collectors is substantial. Moreover, it was found that as the storage capacity enlarges, the RPF improves, and this augmentation is amplified as the number of PVT collectors grows.
Similarly to the RPF, the SPF was found to be improved as the storage capacity of the system increased. For both indices, the improvement was caused by the reduction of the electricity consumed by the heat pump; the reduction of the auxiliary heat; the increase of the solar heat produced by the PVTs; and the generally higher heat availability in the EEB. Melbourne was found to have the highest values of SPF across all locations. The systems with the highest SPF were found to be for all the cities, with 20 PVTs and 20 BHEs, namely, 2.6, 3.7, and 1.8 for Athens, Melbourne, and Ottawa, accordingly. The greater SPF for Melbourne than the other two locations was due to a larger heating load, which drove the heat pump to deliver more heat.
Solar heat was found to be delivered throughout the year for all cities, with the largest amount being delivered during summer for Athens and Ottawa, while for Melbourne, this was at the end of spring. For the systems with 12 PVTs and 12 BHEs located in Athens and Ottawa, the solar heat stored in the EEB was found to be unbalanced with the heat being discarded during the heating season. For Athens, the excessive heat was dissipated into the adjacent soil mass as heat loss, whereas, for Ottawa, it was all utilized within the heating period. For Melbourne, the charging and discharging of heat from the EEB was found to be about balanced annually. The heat loss and gains were found to follow the same pattern as that of the charging and discharging of the EEB. Heat loss is taking place during the charging months where the ground temperature is higher than that of the adjacent soil mass, whereas heat gains are entering the EEB during the heating months when the soil temperature in the EEB drops.

Author Contributions

Conceptualization, E.I.S.; Formal analysis, I.E.S.; Investigation, P.J.A.; Methodology, E.I.S. and B.V.B.; Software, E.I.S. and B.V.B.; Supervision, P.J.A.; Writing—original draft, E.I.S., P.J.A. and I.E.S. All authors have read and agreed to the published version of the manuscript.

Funding

This research received no external funding.

Conflicts of Interest

The authors declare no conflict of interest.

Nomenclature

AcPVT collector area, m2
Eelectricity, kWh
PVT_ielectricity generated by PVT, kWh
PVT_uelectricity delivered to the power grid, kWh
Qheat, kWh
RPFrenewable power fraction, -
SPFseasonal performance factor, -
Abbreviations
BHEborehole heat exchanger
DHWdomestic hot water
EEBearth energy bank
FPCflat plate collector
GHEgeothermal heat exchanger
GSHPground source heat pump
PV photovoltaic panel
PVTphotovoltaic and thermal collector
SAGSHPsolar assisted ground source heat pump
SAHPsolar assisted heat pump
TESthermal energy storage
Subscripts
auxauxiliary
condcondenser
evevaporator
HPheat pump
parasiticsystem’s parasitic electricity

References

  1. Ozgener, O.; Hepbasli, A. A review on the energy and exergy analysis of solar assisted heat pump systems. Renew. Sustain. Energy Rev. 2007, 11, 482–496. [Google Scholar] [CrossRef]
  2. Buker, M.S.; Riffat, S.B. Solar assisted heat pump systems for low temperature water heating applications: A systematic review. Renew. Sustain. Energy Rev. 2016, 55, 399–413. [Google Scholar] [CrossRef]
  3. Sarbu, I.; Sebarchievici, C. General review of ground-source heat pump systems for heating and cooling of buildings. Energy Build. 2014, 70, 441–454. [Google Scholar] [CrossRef]
  4. Atam, E.; Helsen, L. Ground-coupled heat pumps: Part 1—Literature review and research challenges in modeling and optimal control. Renew. Sustain. Energy Rev. 2016, 54, 1653–1667. [Google Scholar] [CrossRef]
  5. Shukla, S.; Bayomy, A.M.; Antoun, S.; Mwesigye, A.; Leong, W.H.; Dworkin, S.B. Performance characterization of novel caisson-based thermal storage for ground source heat pumps. Renew. Energy 2021, 174, 43–54. [Google Scholar] [CrossRef]
  6. Nouri, G.; Noorollahi, Y.; Yousefi, H. Solar assisted ground source heat pump systems—A review. Appl. Therm. Eng. 2019, 163, 114351. [Google Scholar] [CrossRef]
  7. Naili, N.; Kooli, S. Solar-assisted ground source heat pump system operated in heating mode: A case study in Tunisia. Renew. Sustain. Energy Rev. 2021, 145, 111144. [Google Scholar] [CrossRef]
  8. Metz, P.D. Development of a validated model of ground coupling. In Proceedings of the American Section of the International Solar Energy Society Conference, Phoenix, AZ, USA, 2–6 June 1980. [Google Scholar]
  9. Givoni, B. Underground longterm storage of solar energy—An overview. Sol. Energy 1977, 19, 617–623. [Google Scholar] [CrossRef]
  10. Pinel, P.; Cruickshank, C.A.; Beausoleil-Morrison, I.; Wills, A. A review of available methods for seasonal storage of solar thermal energy in residential applications. Renew. Sustain. Energy Rev. 2011, 15, 3341–3359. [Google Scholar] [CrossRef]
  11. Xu, J.; Wang, R.Z.; Li, Y. A review of available technologies for seasonal thermal energy storage. Sol. Energy 2014, 103, 610–638. [Google Scholar] [CrossRef]
  12. Braun, J.E.; Klein, S.A.; Mitchell, J.W. Seasonal storage of energy in solar heating. Sol. Energy 1981, 26, 403–411. [Google Scholar] [CrossRef]
  13. Yang, T.; Liu, W.; Kramer, G.J.; Sun, Q. Seasonal thermal energy storage: A techno-economic literature review. Renew. Sustain. Energy Rev. 2021, 139, 110732. [Google Scholar] [CrossRef]
  14. Dahash, A.; Ochs, F.; Janetti, M.B.; Streicher, W. Advances in seasonal thermal energy storage for solar district heating applications: A critical review on large-scale hot-water tank and pit thermal energy storage systems. Appl. Energy 2019, 239, 296–315. [Google Scholar] [CrossRef]
  15. Mahon, H.; O’Connor, D.; Friedrich, D.; Hughes, B. A review of thermal energy storage technologies for seasonal loops. Energy 2022, 239, 122207. [Google Scholar] [CrossRef]
  16. Bott, C.; Dressel, I.; Bayer, P. State-of-technology review of water-based closed seasonal thermal energy storage systems. Renew. Sustain. Energy Rev. 2019, 113, 109241. [Google Scholar] [CrossRef]
  17. Chapuis, S.; Bernier, M. Seasonal storage of solar energy in borehole heat exchangers. In Proceedings of the 11th International IBPSA Conference, Glasgow, UK, 27–30 July 2009; pp. 599–606. [Google Scholar]
  18. Lanahan, M.; Tabares-Velasco, P.C. Seasonal thermal-energy storage: A critical review on BTES systems, modeling, and system design for higher system efficiency. Energies 2017, 10, 743. [Google Scholar] [CrossRef] [Green Version]
  19. Dai, L.; Li, S.; DuanMu, L.; Li, X.; Shang, Y.; Dong, M. Experimental performance analysis of a solar assisted ground source heat pump system under different heating operation modes. Appl. Therm. Eng. 2015, 75, 325–333. [Google Scholar] [CrossRef]
  20. Stojanović, B.; Akander, J. Build-up and long-term performance test of a full-scale solar-assisted heat pump system for residential heating in Nordic climatic conditions. Appl. Therm. Eng. 2010, 30, 188–195. [Google Scholar] [CrossRef] [Green Version]
  21. Bakirci, K.; Ozyurt, O.; Comakli, K.; Comakli, O. Energy analy sis of a solar-ground source heat pump system with vertical closed-loop for heating applications. Energy 2011, 36, 3224–3232. [Google Scholar] [CrossRef]
  22. Naranjo-Mendoza, C.; Oyinlola, M.A.; Wright, A.J.; Greenough, R.M. Experimental study of a domestic solar-assisted ground source heat pump with seasonal underground thermal energy storage through shallow boreholes. Appl. Therm. Eng. 2019, 162, 114218. [Google Scholar] [CrossRef]
  23. Eslami-nejad, P.; Langlois, A.; Chapuis, S.; Bernier, M.; Faraj, W. Solar heat injection into boreholes. In Proceedings of the 4th Canadian Solar Buildings Conference, Toronto, ON, Canada, 25–27 June 2009; pp. 237–246. [Google Scholar]
  24. Han, Z.; Zheng, M.; Kong, F.; Wang, F.; Li, Z.; Bai, T. Numerical simulation of solar assisted ground-source heat pump heating system with latent heat energy storage in severely cold area. Appl. Therm. Eng. 2008, 28, 1427–1436. [Google Scholar] [CrossRef]
  25. Kjellsson, E.; Hellström, G.; Perers, B. Optimization of systems with the combination of ground-source heat pump and solar collectors in dwellings. Energy 2010, 35, 2667–2673. [Google Scholar] [CrossRef]
  26. Carbonell, D.; Haller, M.Y.; Frank, E. Potential Benefit of Combining Heat Pumps with Solar Thermal for Heating and Domestic Hot Water Preparation. Energy Procedia 2014, 57, 2656–2665. [Google Scholar] [CrossRef] [Green Version]
  27. Trillat-Berdal, V.; Souyri, B.; Fraisse, G. Experimental study of a ground-coupled heat pump combined with thermal solar collectors. Energy Build. 2006, 38, 1477–1484. [Google Scholar] [CrossRef]
  28. Bertram, E.; Glembin, J.; Rockendorf, G. Unglazed PVT collectors as additional heat source in heat pump systems with borehole heat exchanger. Energy Procedia 2012, 30, 414–423. [Google Scholar] [CrossRef] [Green Version]
  29. Yang, W.; Sun, L.; Chen, Y. Experimental investigations of the performance of a solar-ground source heat pump system operated in heating modes. Energy Build. 2015, 89, 97–111. [Google Scholar] [CrossRef]
  30. Sakellariou, E.I.; Wright, A.J.; Axaopoulos, P.J. Energy, economic and emission assessment of a solar assisted shallow earth borehole field heat pump system for domestic space heating in a north European climate. Geothermics 2021, 95, 102159. [Google Scholar] [CrossRef]
  31. Sakellariou, E.I.; Axaopoulos, P.J.; Wright, A.J. Energy and economic evaluation of a solar assisted ground source heat pump system for a north Mediterranean city. Energy Build. 2020, 231, 110640. [Google Scholar] [CrossRef]
  32. Nicholson-Cole, D. Domestic Solar Earth Charging: Modelling the process for augmentation of heat pump. In Proceedings of the CIBSE ASHRAE Technical Symposium, Imperial College, London, UK, 18–19 April 2012; pp. 1–14. [Google Scholar]
  33. Verma, V.; Murugesan, K. Experimental study of solar energy storage and space heating using solar assisted ground source heat pump system for Indian climatic conditions. Energy Build. 2017, 139, 569–577. [Google Scholar] [CrossRef]
  34. Loose, A.; Drück, H. Field test of an advanced solar thermal and heat pump system with solar roof tile collectors and geothermal heat source. Energy Procedia 2014, 48, 904–913. [Google Scholar] [CrossRef]
  35. Wright, A.J.; Talbot, R.; Goddard, M. The solar house—A true low carbon solution for 2016? In Proceedings of the CIBSE ASHRAE Technical Symposium, Dublin, Ireland, 3–4 April 2014; pp. 3–4. [Google Scholar]
  36. Naranjo-Mendoza, C.; Greenough, R.M.; Wright, A.J. Are shallow boreholes a suitable option for inter-seasonal ground heat storage for the small housing sector? Conf. IGSHPA 2018, 1–10. [Google Scholar] [CrossRef] [Green Version]
  37. Bakker, M.; Zondag, H.A.; Elswijk, M.J.; Strootman, K.J.; Jong, M.J.M. Performance and costs of a roof-sized PV/thermal array combined with a ground coupled heat pump. Sol. Energy 2005, 78, 331–339. [Google Scholar] [CrossRef]
  38. Solar Energy Laboratory University of Wisconsin-Madison. GmbH—TRANSSOLAR Energietechnik, CSTB—Centre Scientifique et Technique du Bâtiment, TESS—Thermal Energy Systems Specialists. 2009; TRNSYS 17—A TRaNsientSYstem. Simulation program. Simulation. [Google Scholar]
  39. Baetschmann, M.; Leibundgut, H. LowEx Solar Building System: Integration of PV/T Collectors into Low Exergy Building Systems. Energy Procedia 2012, 30, 1052–1059. [Google Scholar] [CrossRef] [Green Version]
  40. Sommerfeldt, N.; Madani, H. In-depth techno-economic analysis of PV / Thermal plus ground source heat pump systems for multi-family houses in a heating dominated climate. Sol. Energy 2019, 190, 44–62. [Google Scholar] [CrossRef]
  41. Rad, F.M.; Fung, A.S.; Leong, W.H. Combined solar thermal and ground source heat pump system. In Proceedings of the IBPSA 2009—International Building Performance Simulation Association, Glasgow, Scotland, 27–30 July 2009; pp. 2297–2305. [Google Scholar]
  42. Beck, H.E.; Zimmermann, N.E.; McVicar, T.R.; Vergopolan, N.; Berg, A.; Wood, E.F. Present and future köppen-geiger climate classification maps at 1-km resolution. Sci. Data 2018, 5, 180214. [Google Scholar] [CrossRef] [Green Version]
  43. Kottek, M.; Grieser, J.; Beck, C.; Rudolf, B.; Rubel, F. World map of the Köppen-Geiger climate classification updated. Meteorol. Zeitschrift 2006. [Google Scholar] [CrossRef]
  44. Sakellariou, E.I.; Wright, A.J.; Axaopoulos, P.; Oyinlola, M.A. PVT based solar assisted ground source heat pump system: Modelling approach and sensitivity analyses. Sol. Energy 2019, 193, 37–50. [Google Scholar] [CrossRef]
  45. Sakellariou, E.; Axaopoulos, P. An experimentally validated, transient model for sheet and tube PVT collector. Sol. Energy 2018, 174, 709–718. [Google Scholar] [CrossRef]
  46. Hottel, H.C.; Whillier, A. Evaluation of flat-plate solar collector performance. Transcr. Conf. Use Sol. Energy 1955, 2, 74–104. [Google Scholar]
  47. Hellström, G. Duct Ground Heat Storage Model, Manual for Computer Code. Energy 1989, 915. [Google Scholar]
  48. Duffie, J.A.; Beckman, W.A. Solar Engineering of Thermal Processes, 4th ed.; John Wiley & Sons: Hoboken, NJ, USA, 2013. [Google Scholar] [CrossRef]
  49. Technical Chamber of Greece. Technical Directive 20701-1: National Specifications of Parameters for Calculating the Energy Performance of Buildings and the Issue of the Energy Performance Certificate; Technical Chamber of Greece: Athens, Greece, 2017. [Google Scholar]
  50. Australian Building Codes Board. 2022. Available online: https://ncc.abcb.gov.au/ (accessed on 1 October 2022).
  51. National Research Council of Canada. National Energy Code of Canada for Buildings; National Research Council of Canada: Ottawa, ON, Canada, 2017. [Google Scholar]
  52. Sakellariou, E.I.; Axaopoulos, P.J. Energy performance indexes for solar assisted ground source heat pump systems with photovoltaic-thermal collectors. Appl. Energy 2020, 272, 115241. [Google Scholar] [CrossRef]
  53. European Parliament. Decision (2013/114/EU) Establishing the Guidelines for Member States on Calculating Renewable Energy from Heat Pumps from Different Heat Pump Technologies pursuant to Article 5 of Directive 2009/28/EC of the European Parliament an dof the Council; Official Journal of the European Union: Maastricht, The Netherlands, 2016; Union 27–35. [Google Scholar]
  54. Sakellariou, E.I.; Axaopoulos, P.J.; Sarris, I.E.; Abdullaev, N. Improving the Electrical Efficiency of the PV Panel via Geothermal Heat Exchanger: Mathematical Model, Validation and Parametric Analysis. Energies 2021, 14, 6415. [Google Scholar] [CrossRef]
Figure 1. Monthly mean dry bulb ambient air temperature for all three cities. (Derived from TMY2, Meteonorm).
Energies 15 07906 g001
Figure 2. Monthly global horizontal solar energy for all three cities. (Derived from TMY2, Meteonorm).
Energies 15 07906 g002
Figure 3. SAGSHP system’s layout: 1. DC to AC inverters; 2. Solar system pump; 3. Four-way deviator; 4. Solar-soil charging pump; 5. Three-way deviator; 6. Space heating auxiliary heater; 7. Temperature control valve; 8. DHW auxiliary heater.
Energies 15 07906 g003
Figure 4. RPF for Athens as function of the storage capacity.
Energies 15 07906 g004
Figure 5. RPF for Melbourne as function of the storage capacity.
Energies 15 07906 g005
Figure 6. RPF for Ottawa as function of the storage capacity.
Energies 15 07906 g006
Figure 7. Annual seasonal performance factor as function of the storage capacity for Athens.
Energies 15 07906 g007
Figure 8. Annual seasonal performance factor as function of the storage capacity for Melbourne.
Energies 15 07906 g008
Figure 9. Annual seasonal performance factor as function of the storage capacity for Ottawa.
Energies 15 07906 g009
Figure 10. Monthly heat flow across the EEB for Athens, for the scenario of 12 PVTs paired with 12 BHEs and for the 6th year of simulation.
Energies 15 07906 g010
Figure 11. Monthly heat flow across the EEB for Melbourne, for the scenario of 12 PVTs paired with 12 BHEs and for the 6th year of simulation.
Energies 15 07906 g011
Figure 12. Monthly heat flow across the EEB for Ottawa, for the scenario of 12 PVTs paired with 12 BHEs and for the 6th year of simulation.
Energies 15 07906 g012
Table 1. The system’s main operation modes. Where: D.V is deviation valve; PHE is plate heat exchanger; and HP is heat pump.
Operation ModeDescriptionControl
PVTs-GHE-Heat Pump-LoadBoth PVTs and GHE are the thermal energy sources of HP. The PVT outlet temperature is 6 K higher than the soil temperature (EEB) D.V 3 and 5 (Figure 3) are
engaged to drive the brine via the GHE and PHE. Pump 2 operates for the delivery of solar heat. Pump 4 is bypassed
GHE-Heat Pump-LoadThe system operates as a conventional GSHP. Low solar irradiance or solar heat cannot be utilized. The ΔΤ between the PVT outlet temperature and that of the soil is lower than 6 K D.V 3 and 5 (Figure 3) are responsible for delivering heat to HP by bypassing the PHE and pump 4
PVTs-GHESolar heat is delivered to the EEB for storage. SH or DHW are not required. The PVT outlet temperature is 6 K higher than the soil temperature (EEB)D.V 3, 5 (Figure 3) and pump 4 deliver the solar heat to the EEB
Table 2. Main system parameters.
SubsystemDetails
PVTsPVT arrays: 4, 8, 12, 16, and 20 collectors.
Peak power 235Wp. Absorber’s area 1.58 m2 [45]. Inclination 30 degrees. South or north (Melbourne) facing fixed.
Borefield4, 8, 12, 16, and 20 BHEs with a very short length of 2 m.
Soil thermal conductivity 1.5 W m−1 K−1
Soil heat capacity (clay) 2400 kJ m−3 K−1
Spacing between BHEs at 2 m.
Heat pumpNominal heat capacity 6 kWTH for Athens and Melbourne, 8 kWTH for Ottawa.
Operation envelope is −10 °C to 25 °C for the evaporator and 30 °C to 55 °C for the condenser.
Nominal power 1.5 kWe for Athens and Melbourne, 2 kWe for Ottawa.
Flowrate evaporator side 1200 kg h−1 for Athens and Melbourne, 1720 kg h−1 for Ottawa.
Flowrate condenser side 700 kg h−1 for Athens and Melbourne, 1400 kg h−1 for Ottawa.
Table 3. Storage capacity [m3/m2) as product of the heat storage volume allocated to the EEB and the utilized PVT arrays.
 4 BHE
VEEB (28 m3)
8 BHE
VEEB (56 m3)
12 BHE
VEEB (83 m3)
16 BHE
VEEB (111 m3)
20 BHE
VEEB (139 m3)
4 (PVTs)4.438.8613.1317.5621.99
8 (PVTs)2.224.436.578.7811.00
12 (PVTs)1.482.954.385.857.33
16 (PVTs)1.112.223.284.395.50
20 (PVTs)0.891.772.633.514.40
Table 4. Dwellings and DHW main parameters values for all three cities.
PartAthens Melbourne Ottawa
Exterior walls U-value0.45
W m−2 K−1
Regulation for energy efficiency on buildings [49] 0.375
W m−2 K−1
Australian construction code volume two [50]0.32
W m−2 K−1
National Energy Code of Canada for Buildings [51]
Ground floor U-value0.80
W m−2 K−1
0.444
W m−2 K−1
0.45
W m−2 K−1
Exterior roof U-value 0.40
W m−2 K−1
0.244
W m−2 K−1
0.21
W m−2 K−1
Windows U-value 2.60
W m−2 K−1
2.60
W m−2 K−1
1.60
W m−2 K−1
Windows to walls ratio0.150.150.15
Infiltration 1 ACH 1 ACH 0.5 ACH
Consumption of DHW140 L day−1 at 45 °C140 L day−1 at 45 °C140 L day−1 at 45 °C
Annual heating load 3393 kWh
(19 °C)
7150 kWh
(19 °C)
5240 kWh
(19 °C)
Annual DHW load1445 kWh
(45 °C)
1667 kWh
(45 °C)
2185 kWh
(45 °C)
Table 5. Annual electric energy (E) consumed on the SAGSHP system and the annual electricity and heat produced by the PVTs, along with the heat provided by the heat pump for Athens.
 4 PVTs X 12 BHEs8 PVTs X 12 BHEs12 PVTs X 12 BHEs16 PVTs X 12 BHEs20 PVTs X 12 BHEs
EHP (kWh/year)1797.31699.31572.11550.91456.7
Eparasitic (kWh/year)5.38.510.612.613.5
Eaux_SH (kWh/year)1188.0668.4376.6122.6105.3
Eaux_DHW (kWh/year)119.685.978.381.568.1
EPVT (kWh/year)1576.63149.54722.16293.47860.7
QPVT (kWh/year)heat880.21604.82150.12648.22885.6
QHP_cond (kWh/year)heat3145.13665.33957.34211.34148.6
Table 6. Annual electric energy (E) consumed on the SAGSHP system and the annual electricity and heat produced by the PVTs, along with the heat provided by the heat pump for Melbourne.
 4 PVTs X 12 BHEs8 PVTs X 12 BHEs12 PVTs X 12 BHEs16 PVTs X 12 BHEs20 PVTs X 12 BHEs
EHP (kWh/year)3351.53277.52987.12735.42600.9
Eparasitic (kWh/year)12.321.428.030.532.8
Eaux_SH (kWh/year)3366.91618.7691.6458.7405.5
Eaux_DHW (kWh/year)319.4252.0175.7164.5156.5
EPVT (kWh/year)1629.53257.64878.66495.08088.7
QPVT (kWh/year)heat2234.34437.26116.36322.58072.7
QHP_cond (kWh/year)heat6365.28113.49040.59273.48966.6
Table 7. Annual electric energy (E) consumed on the SAGSHP system and the annual electricity and heat produced by the PVTs, along with the heat provided by the heat pump for Ottawa.
 4 PVTs X 12 BHEs8 PVTs X 12 BHEs12 PVTs X 12 BHEs16 PVTs X 12 BHEs20 PVTs X 12 BHEs
EHP (kWh/year)3469.73438.93469.23354.03192.0
Eparasitic (kWh/year)4.17.611.413.916.1
Eaux_SH (kWh/year)2694.11908.51129.3928.9778.3
Eaux_DHW (kWh/year)442.1328.9277.1278.3248.2
EPVT (kWh/year)1628.23263.14897.26519.48144.7
QPVT (kWh/year)heat768.11596.42509.92972.53473.6
QHP_cond (kWh/year)heat4618.35403.96183.26383.56534.2
Publisher’s Note: MDPI stays neutral with regard to jurisdictional claims in published maps and institutional affiliations.

