
Comprehensive Performance Assessment of Dual Loop Organic Rankine Cycle (DORC) for CNG Engine: Energy, Thermoeconomic and Environment
Abstract
:1. Introduction
1.1. Working Conditions and Waste Heat Characteristics
1.2. Influence of Operating Parameter
1.3. Performance Analysis of DORC
1.4. Work and Contribution
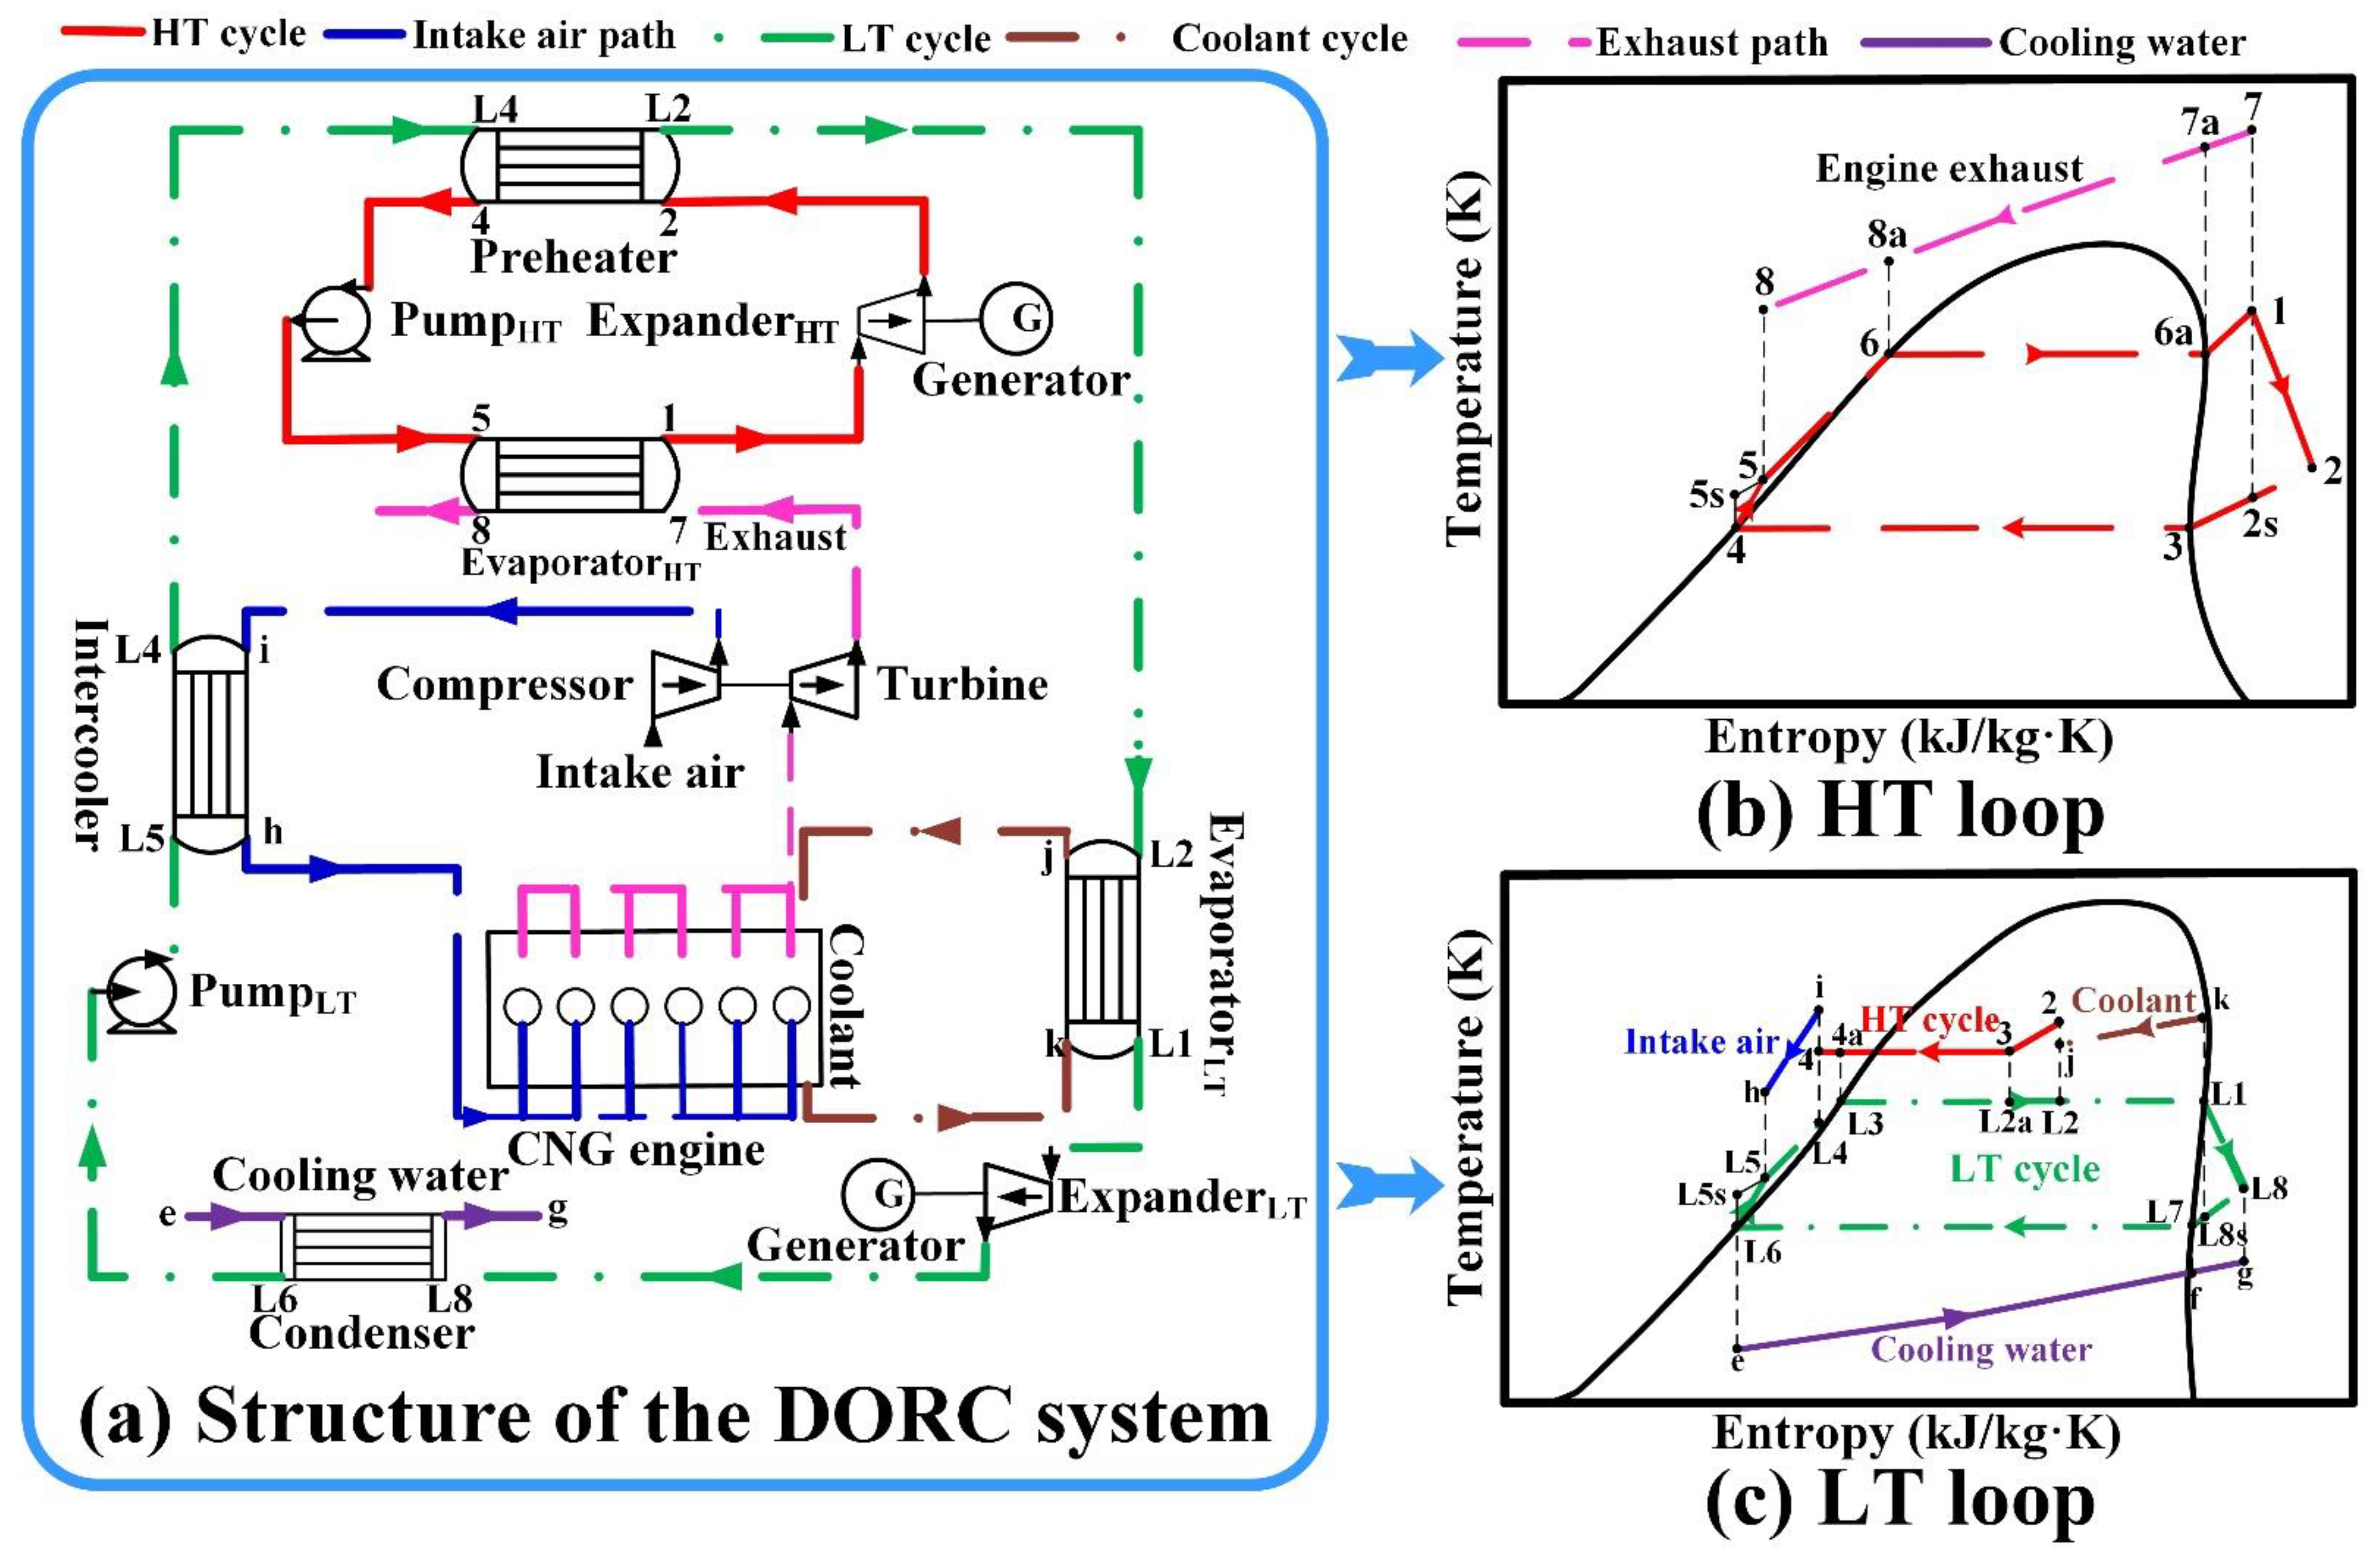
2. Description of DORC
3. Construction of Mathematical Model
3.1. Thermal Balance Model
3.2. Thermodynamic Model
3.3. Heat Transfer and Thermoeconomic Model
3.4. Exergy Destruction Model
3.5. Environmental Impact Model
3.6. Validation
4. Results and Discussion
4.1. Waste Heat Characteristics of CNG Engine
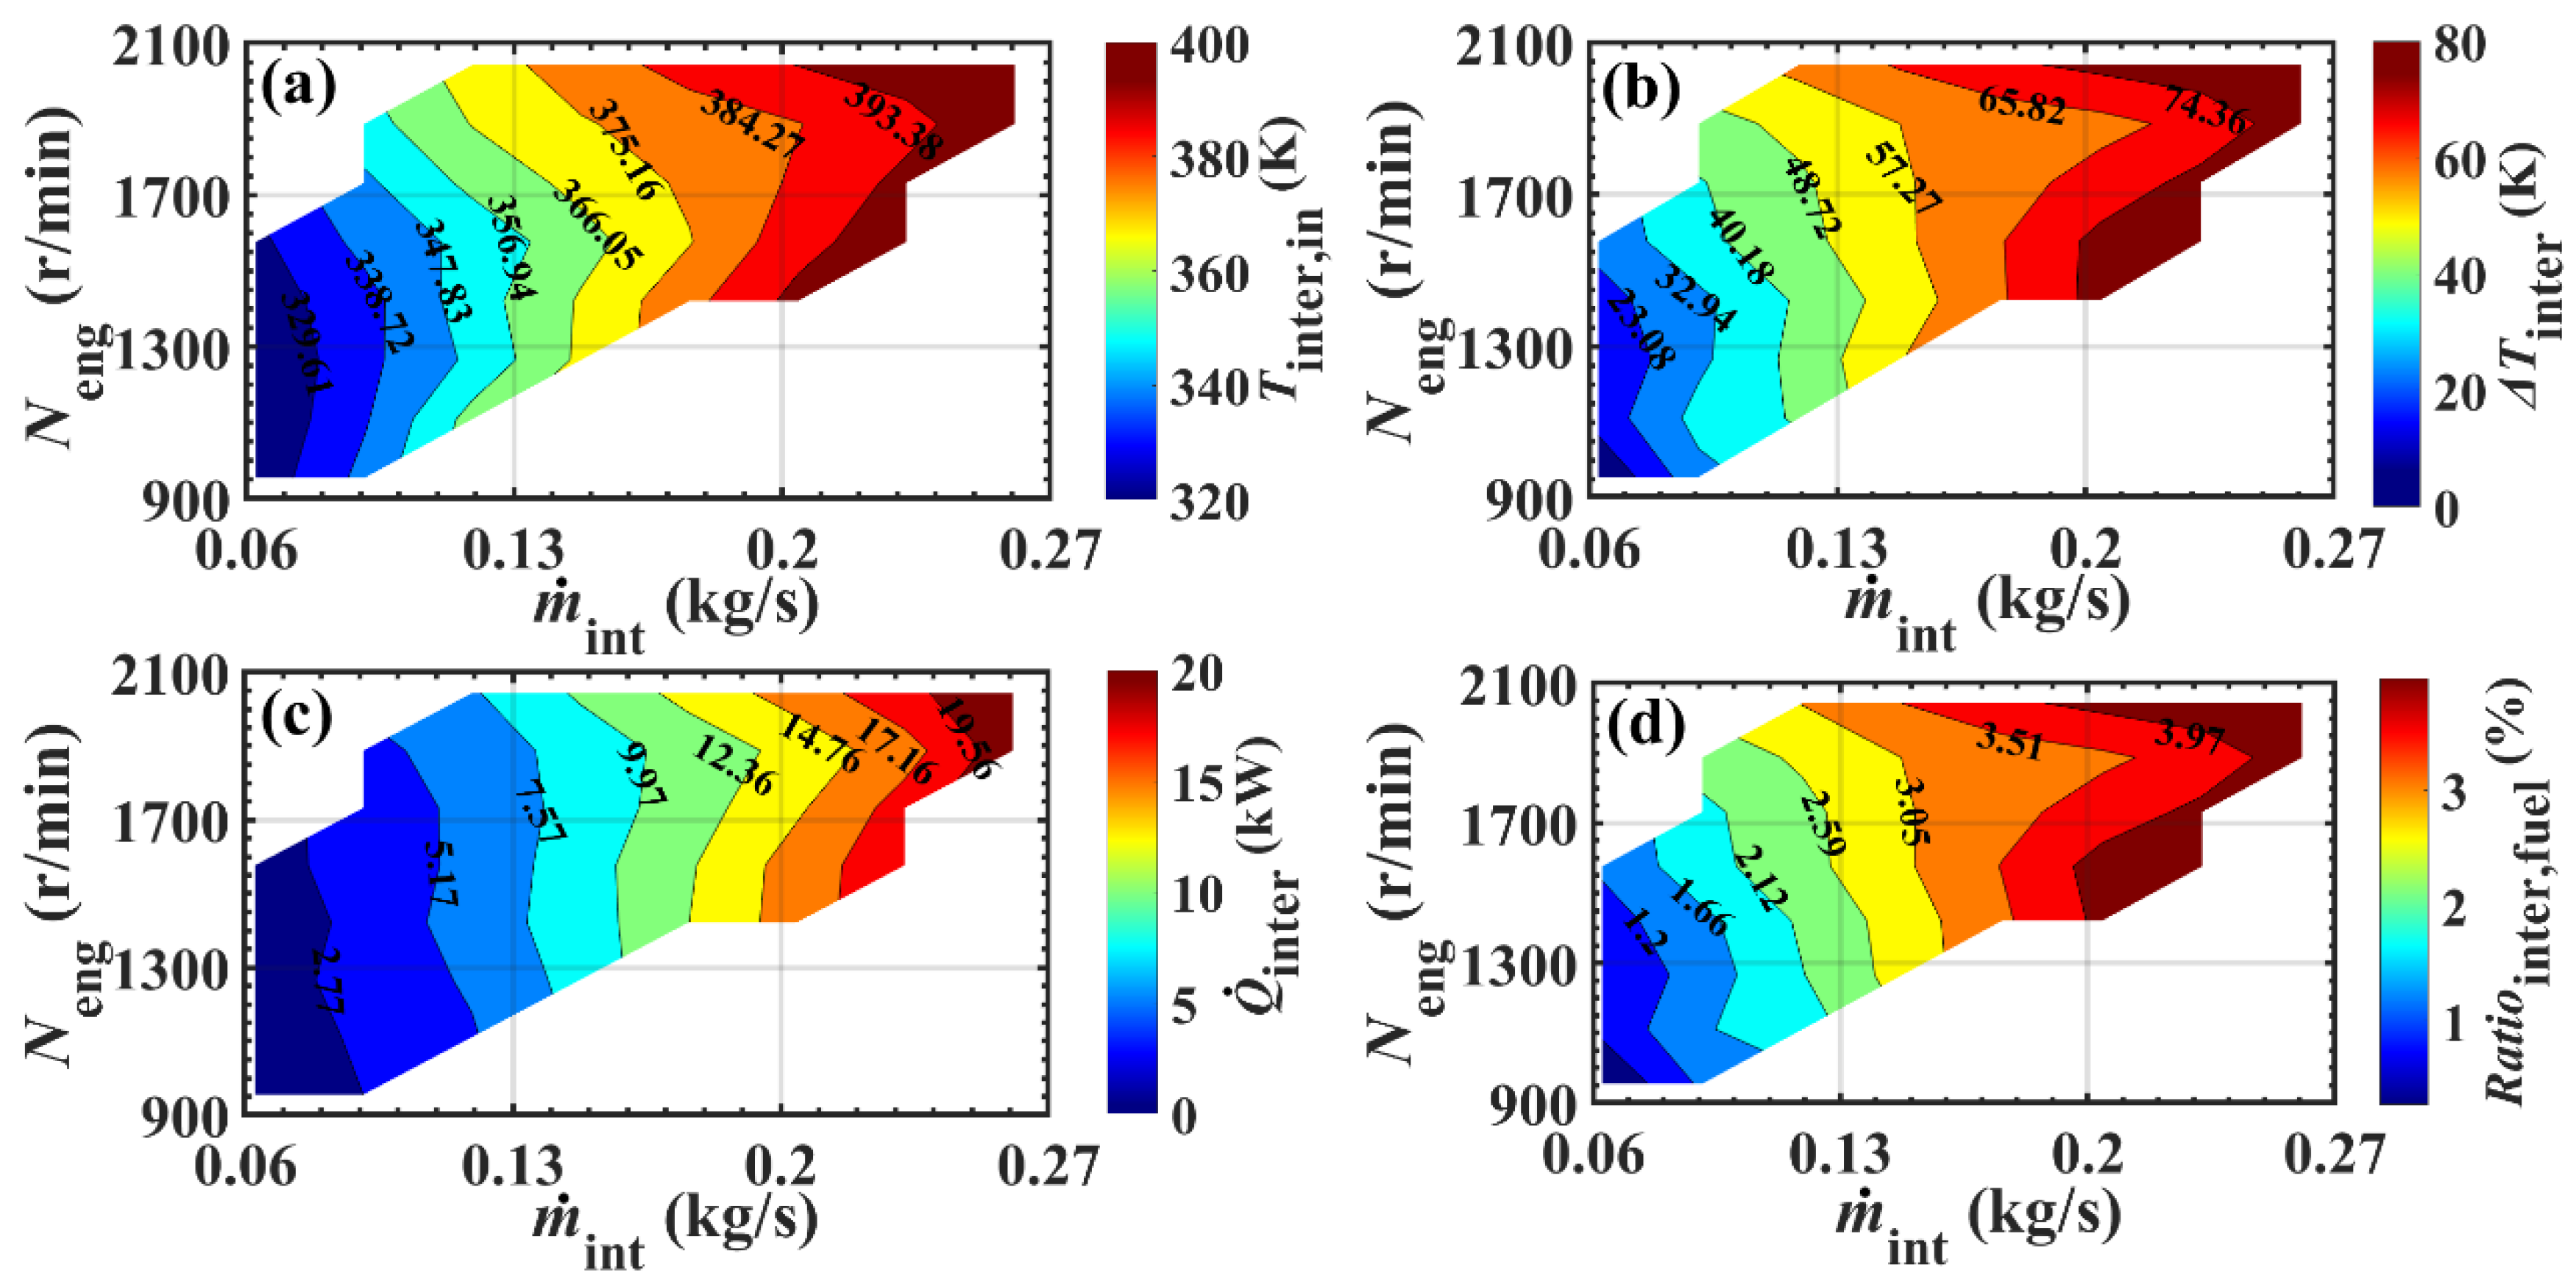
4.1.1. Intercooler
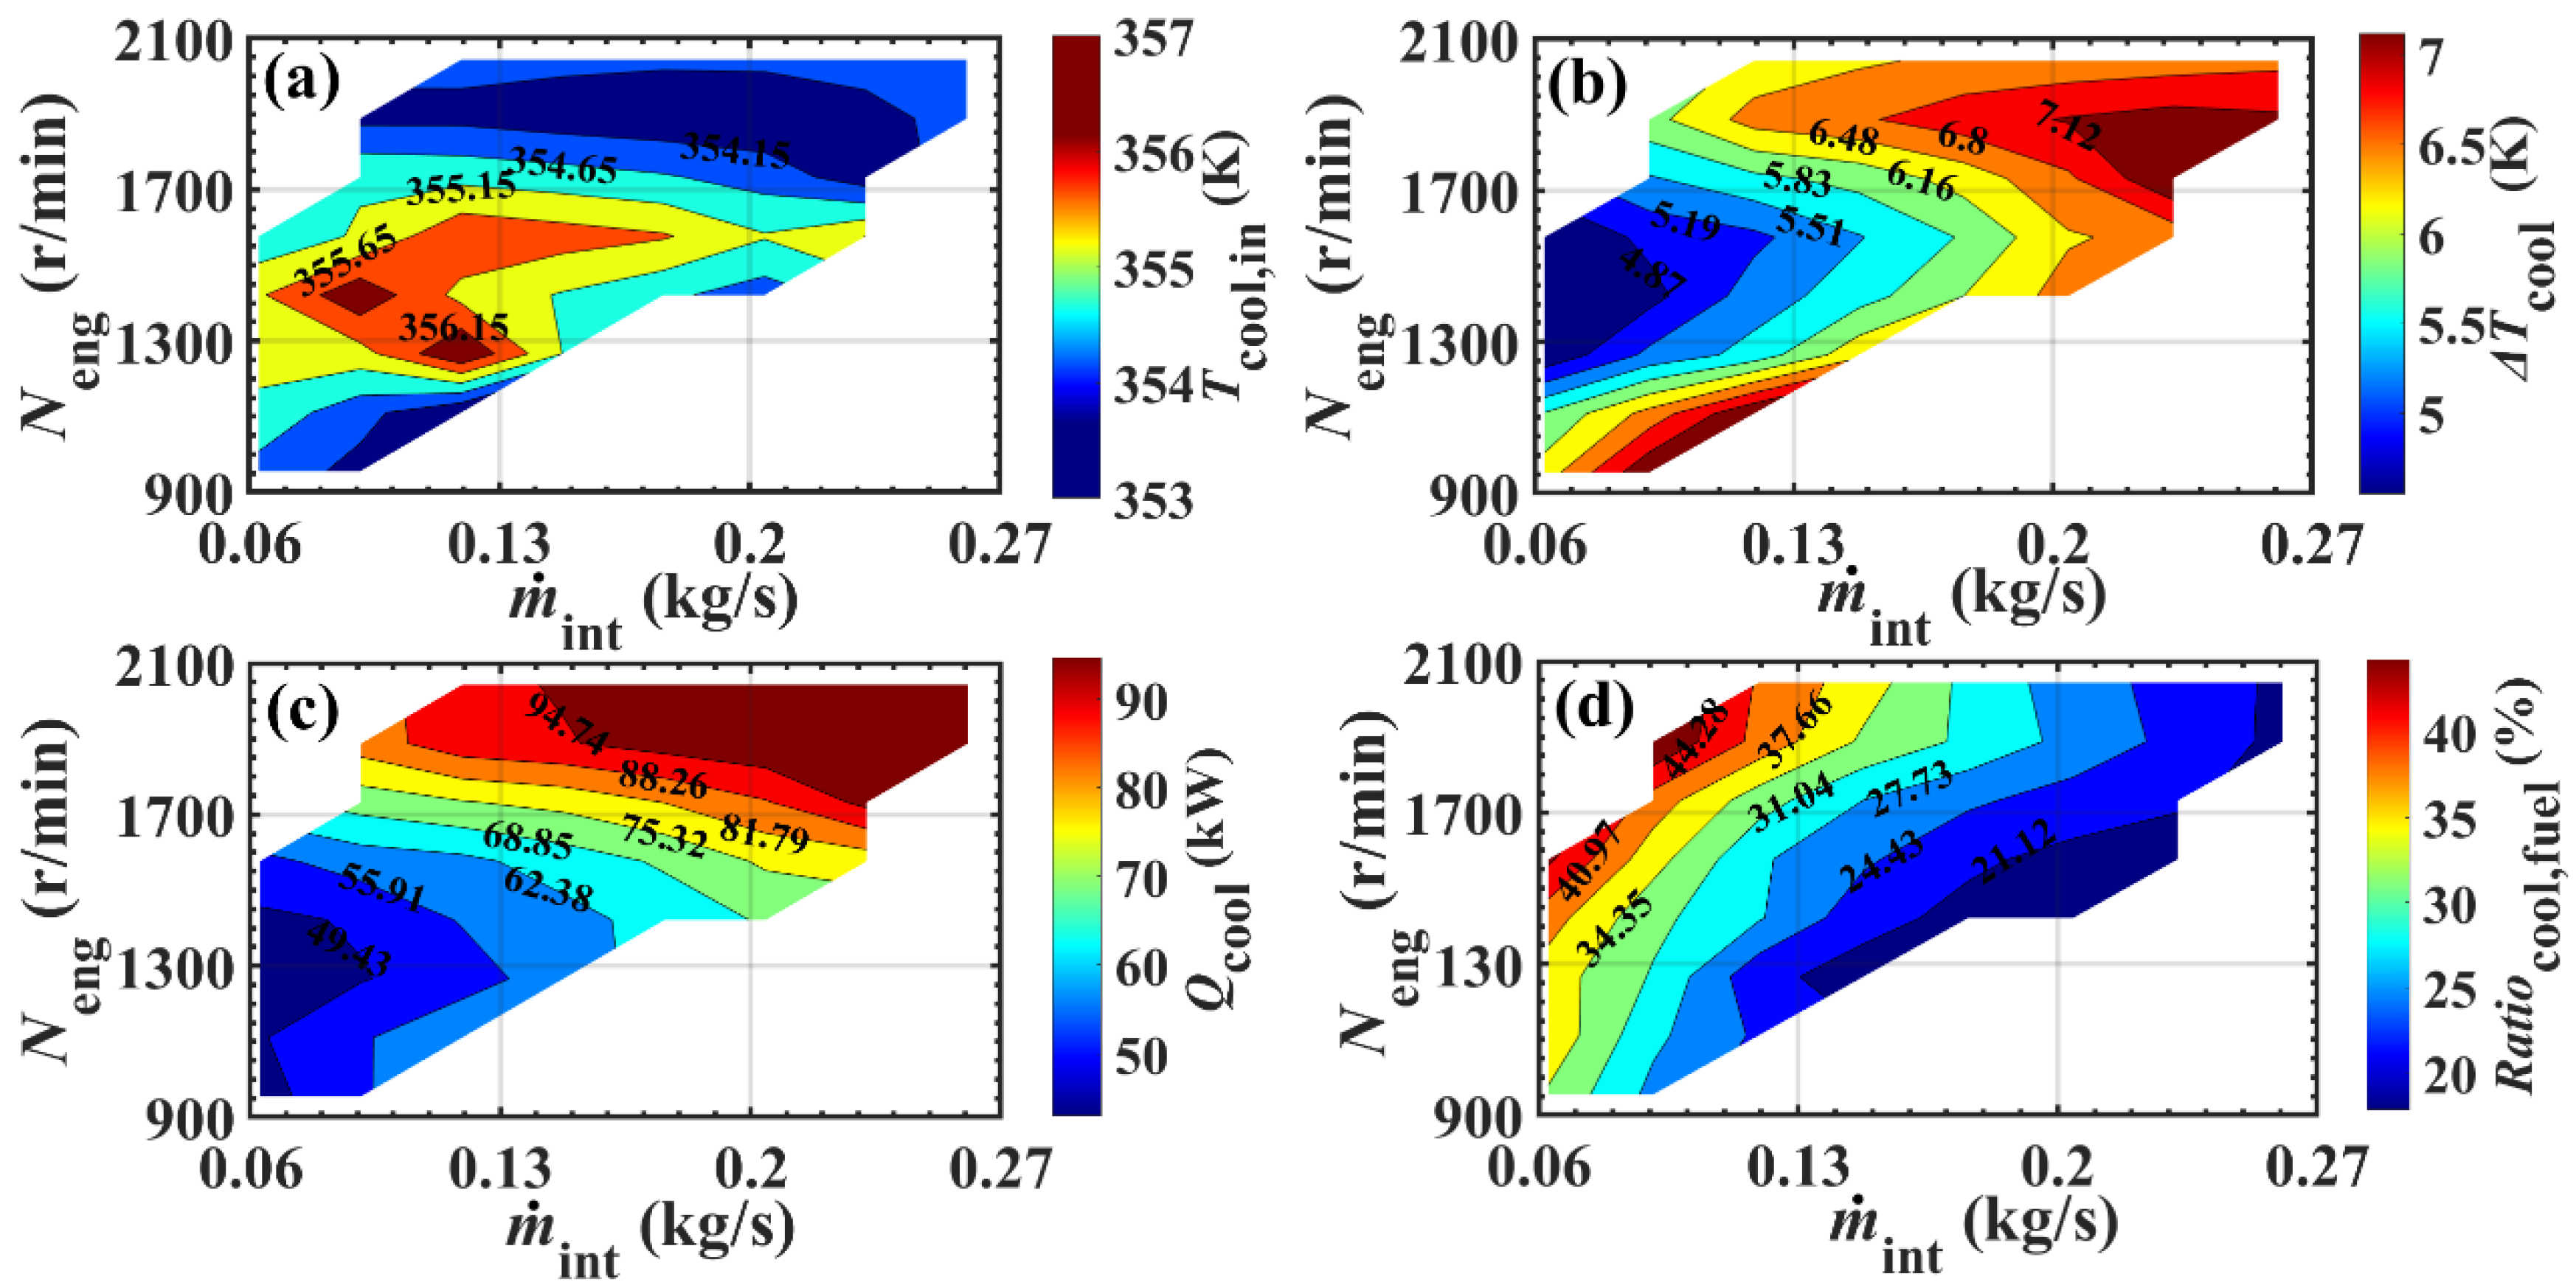
4.1.2. Coolant
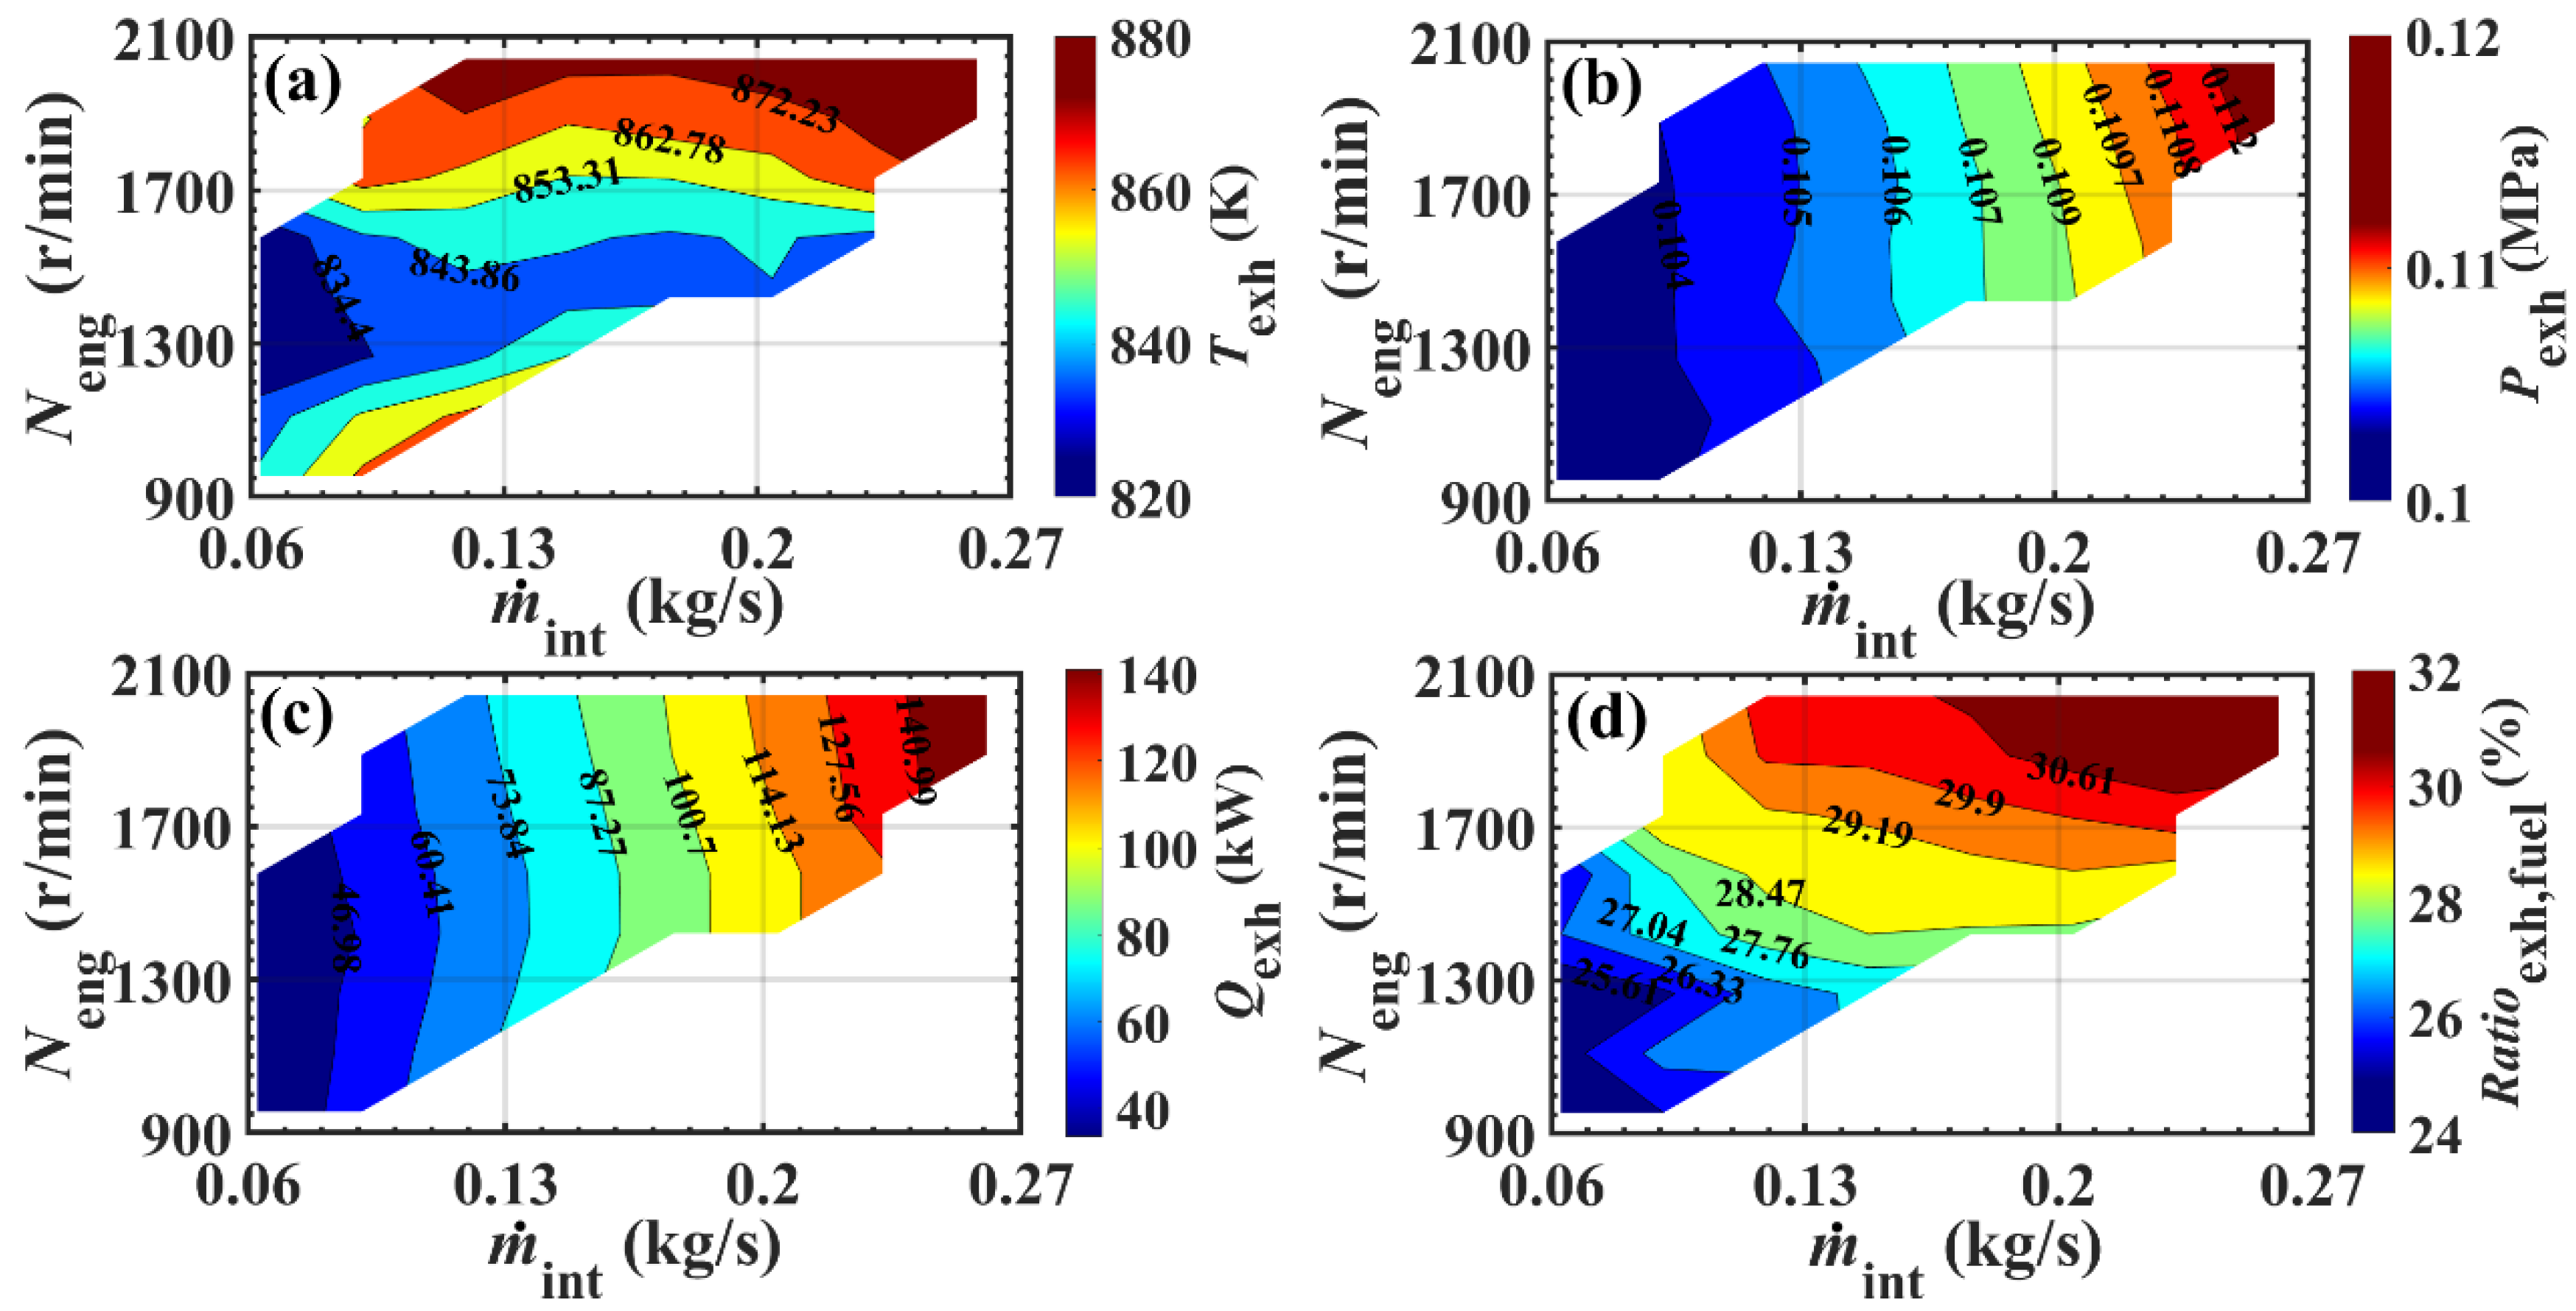
4.1.3. Exhaust
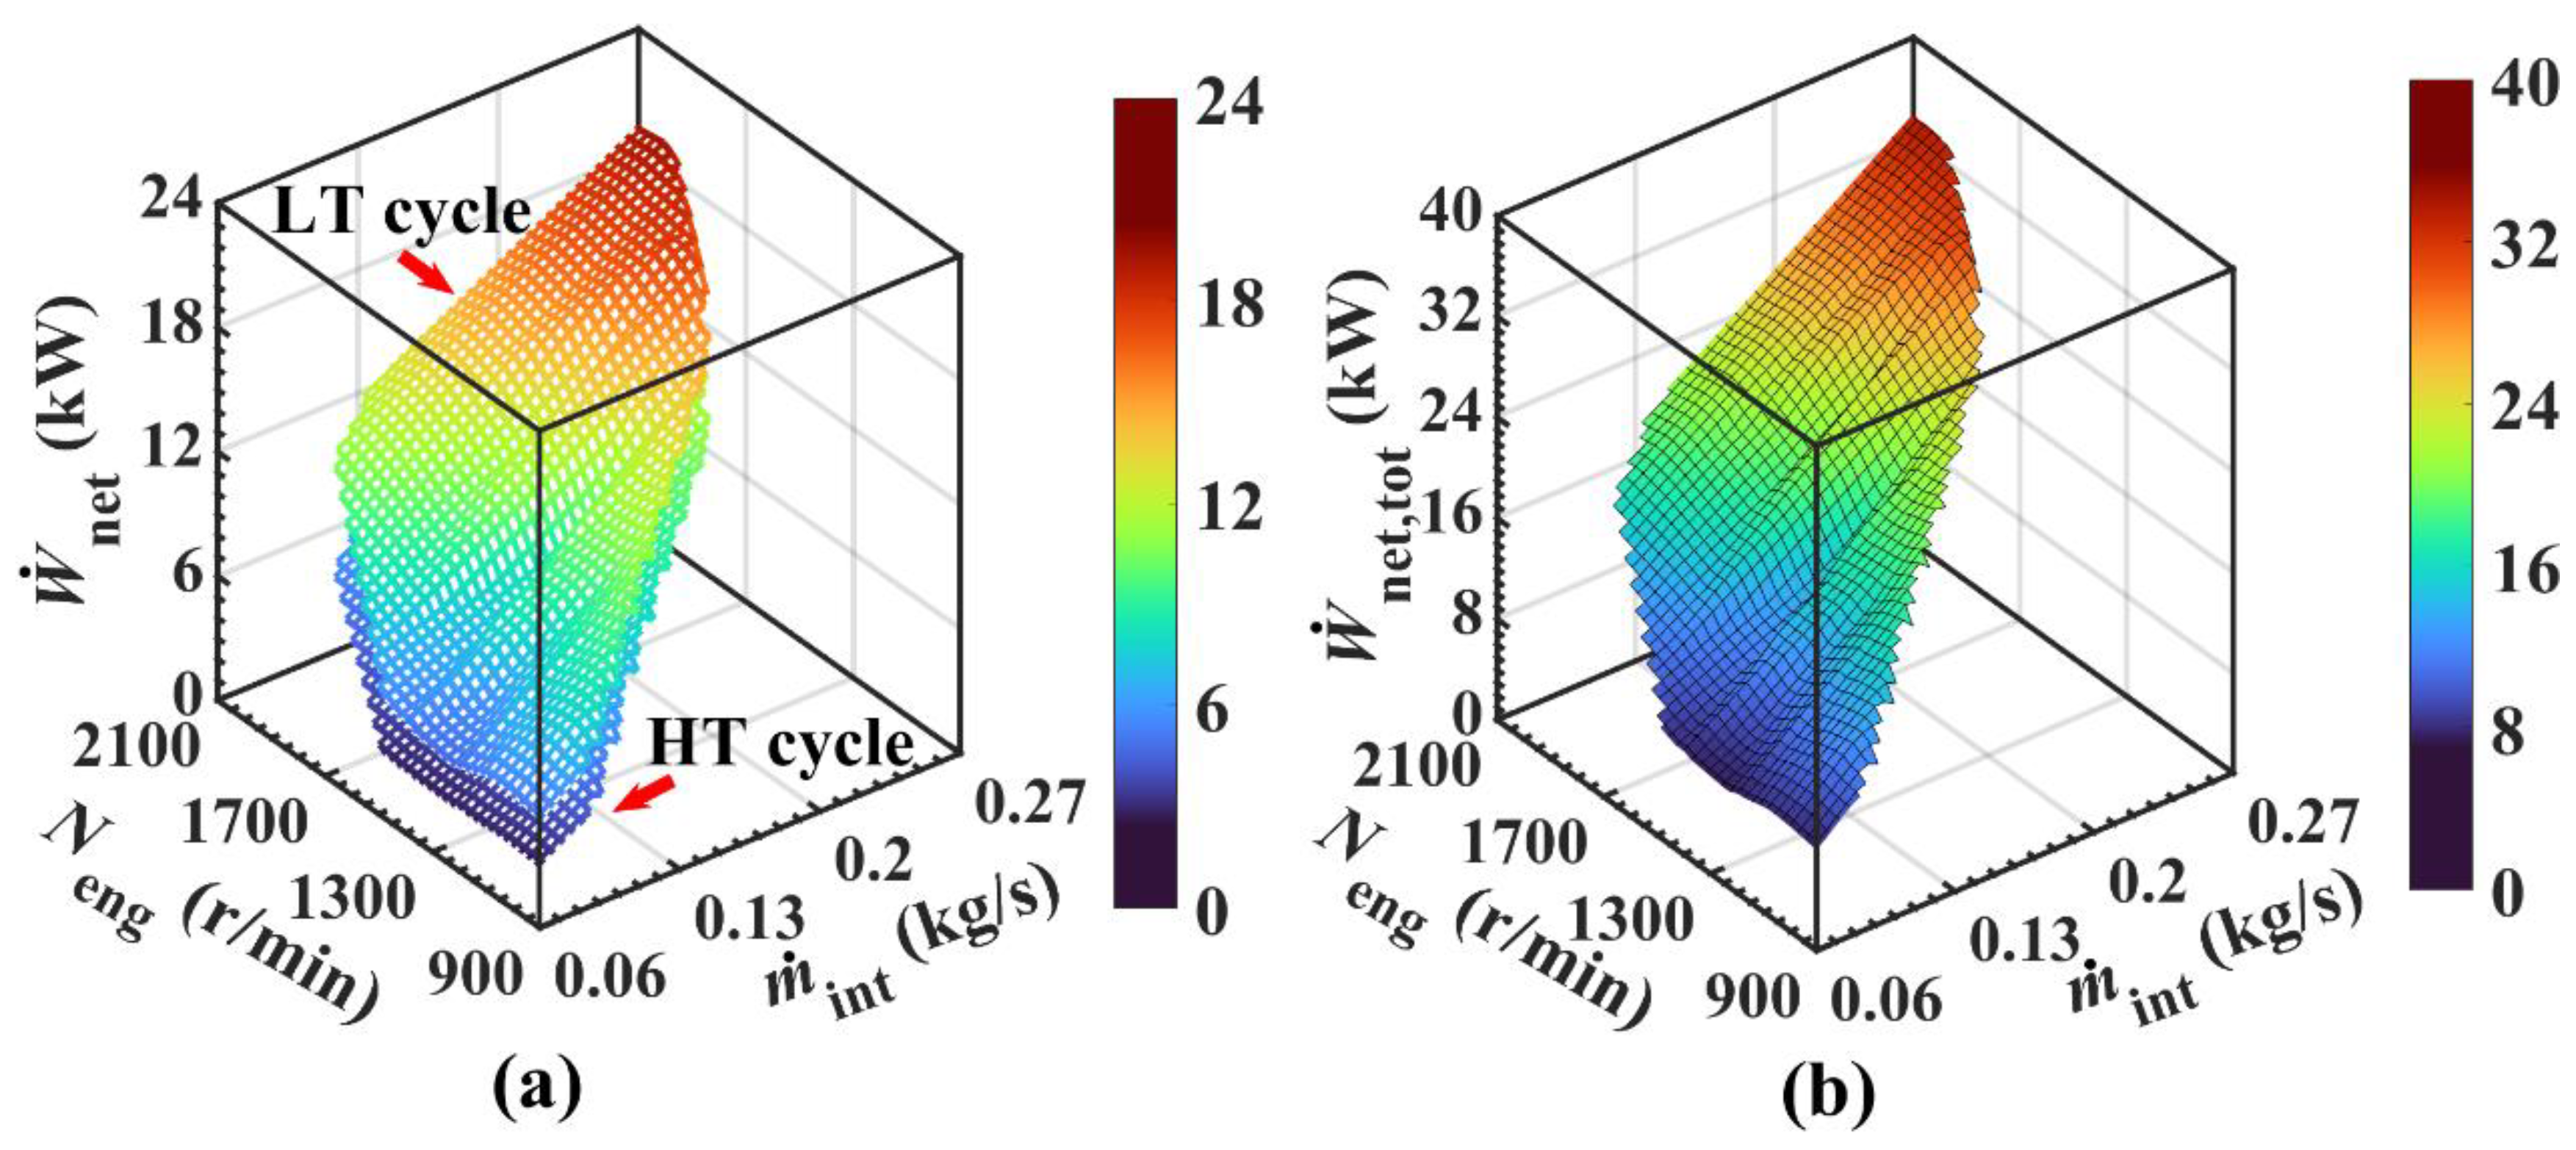
4.2. Power Analysis
4.2.1. Variable Working Conditions
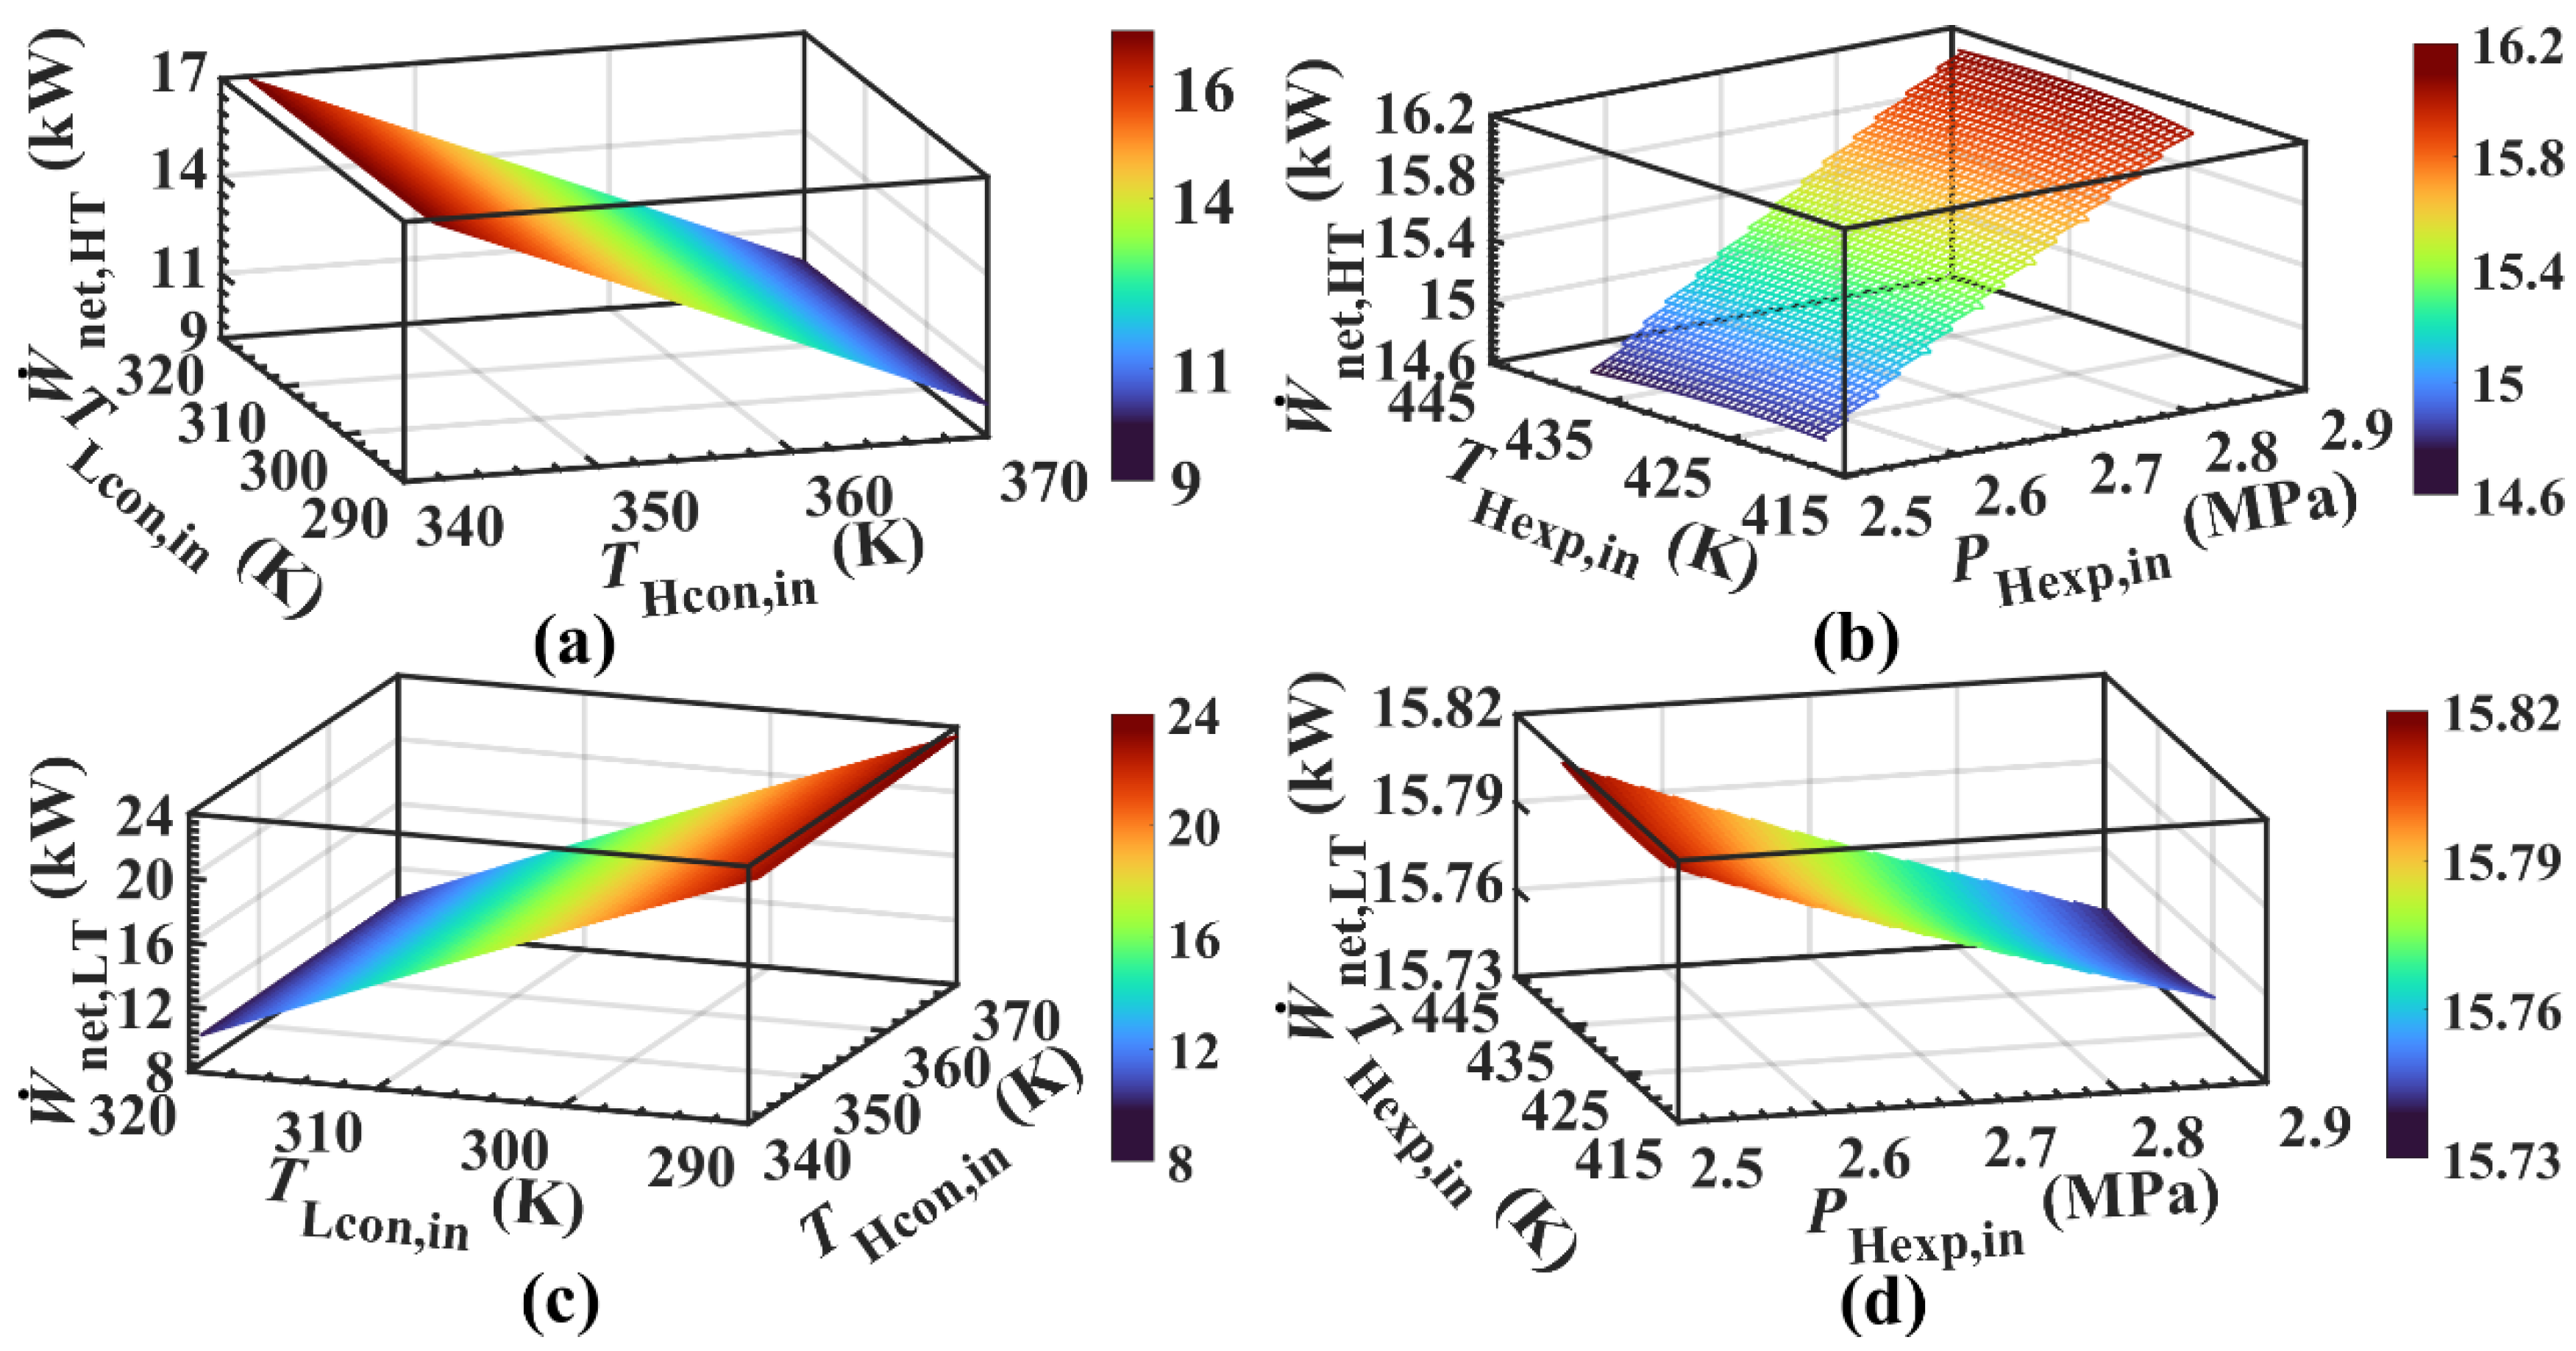
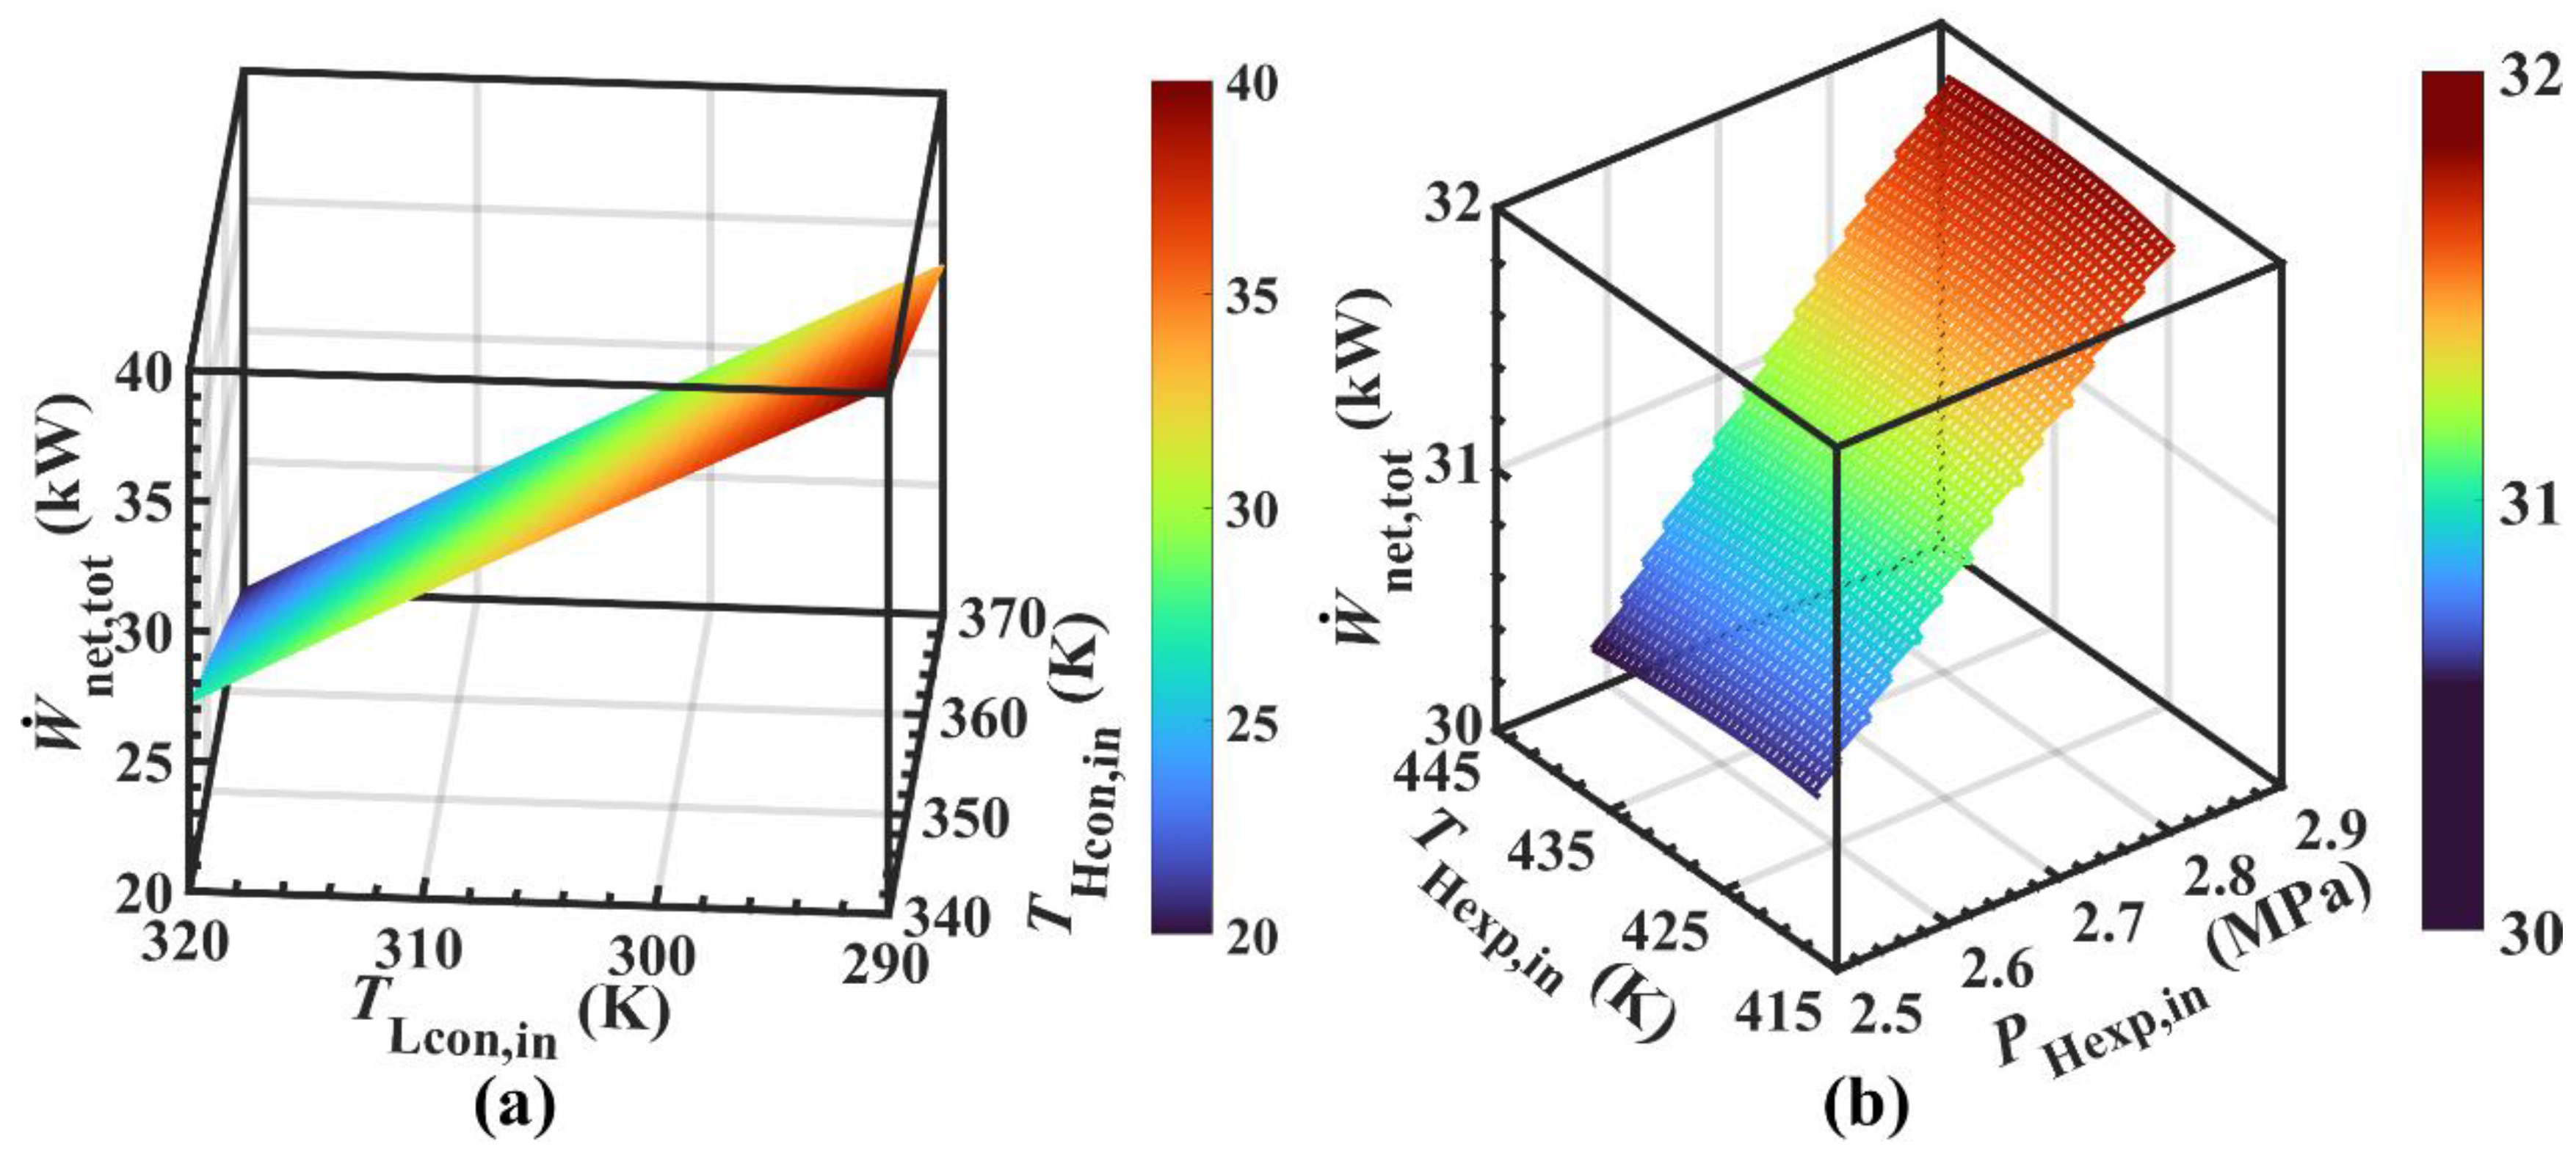
4.2.2. Key Variables
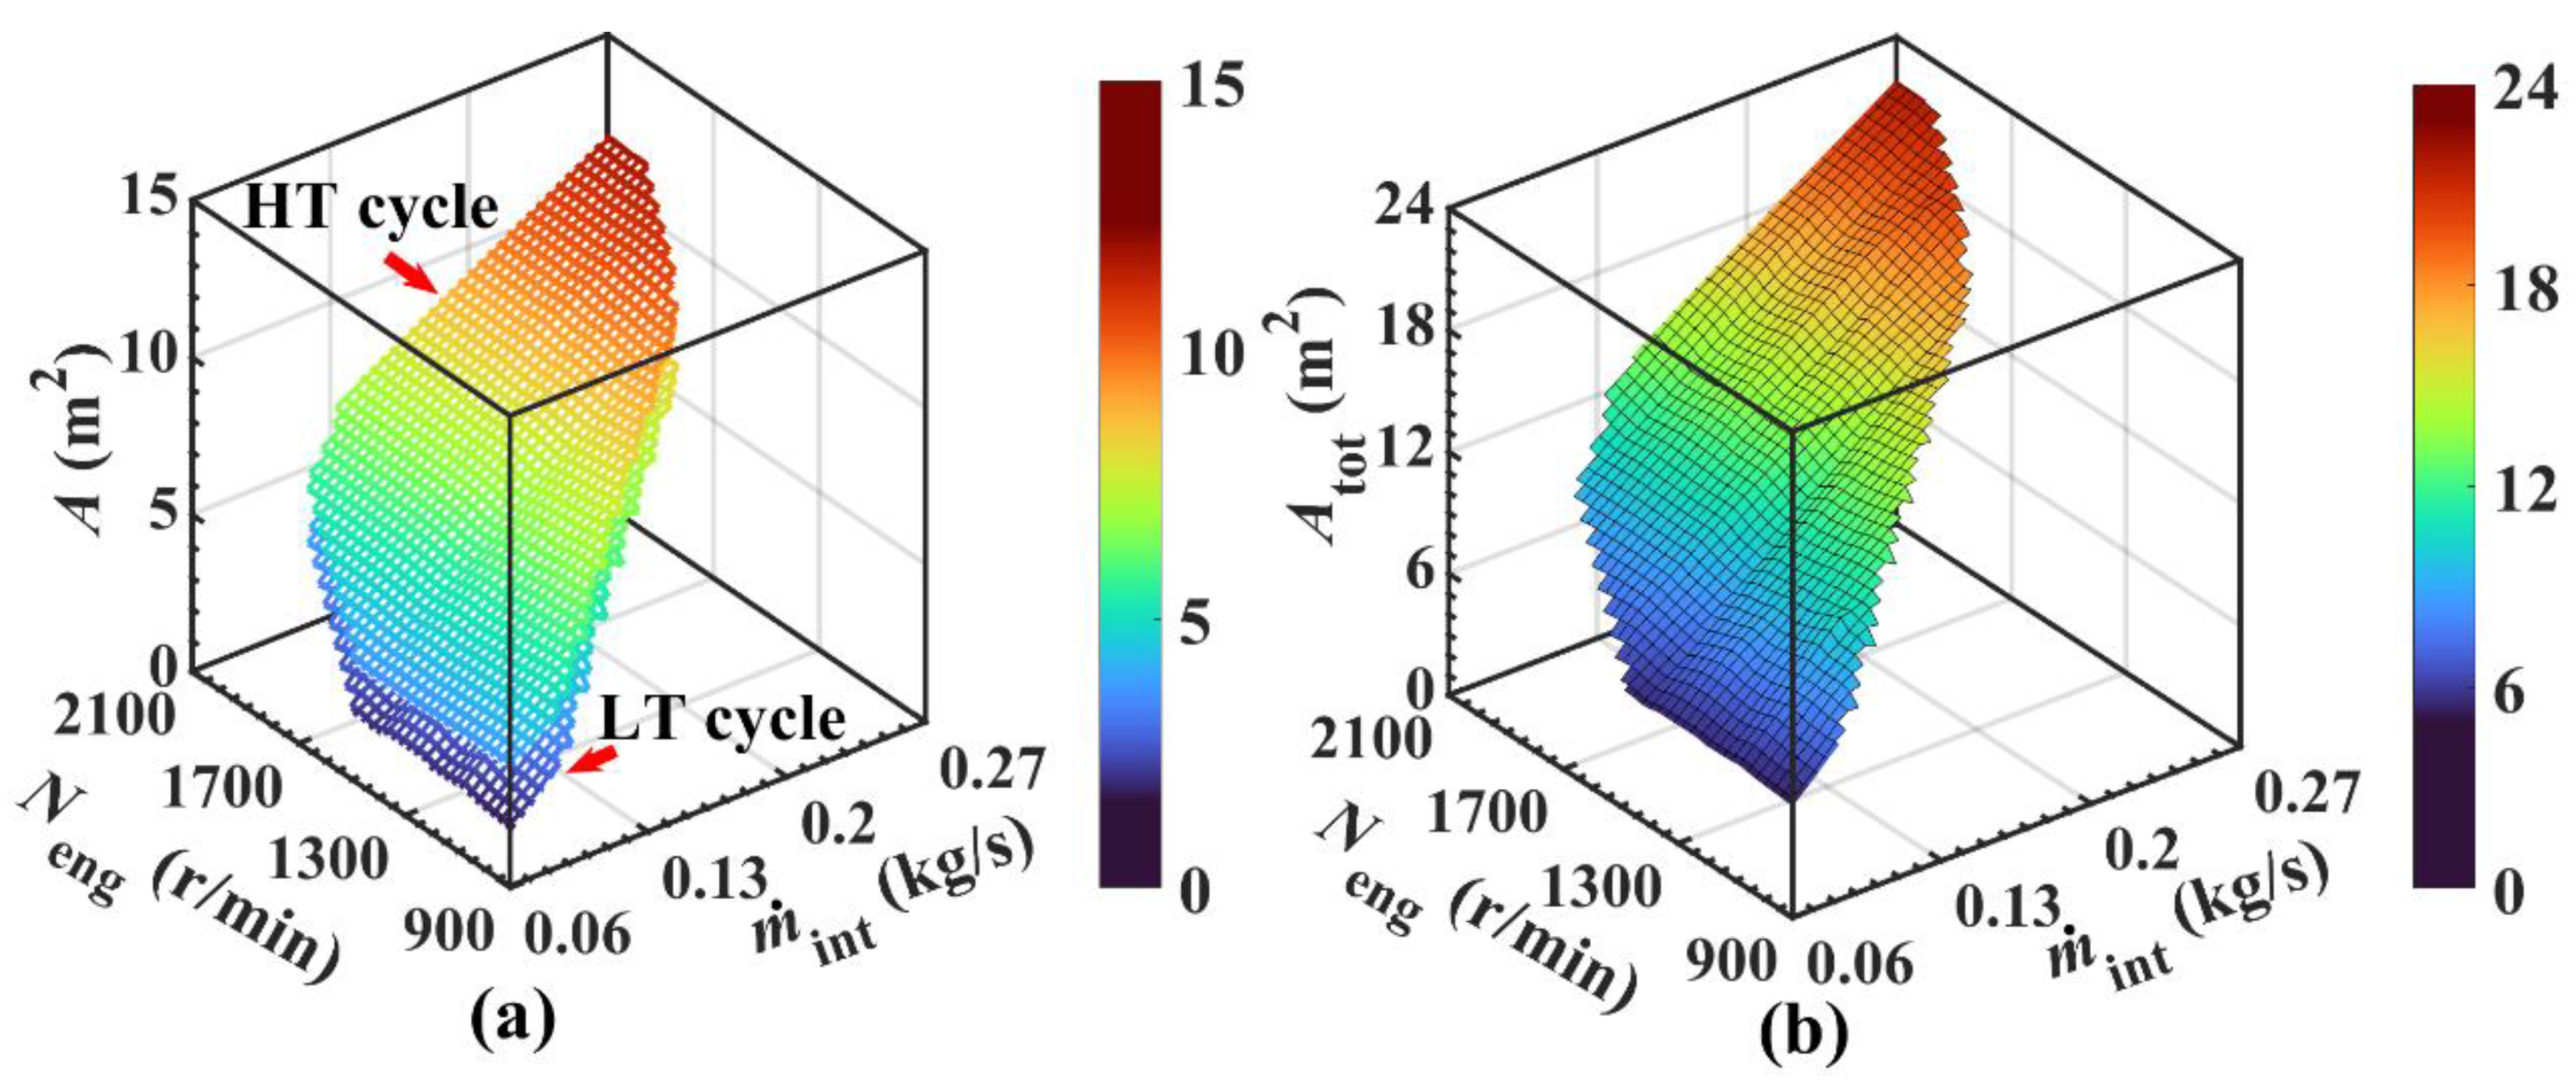
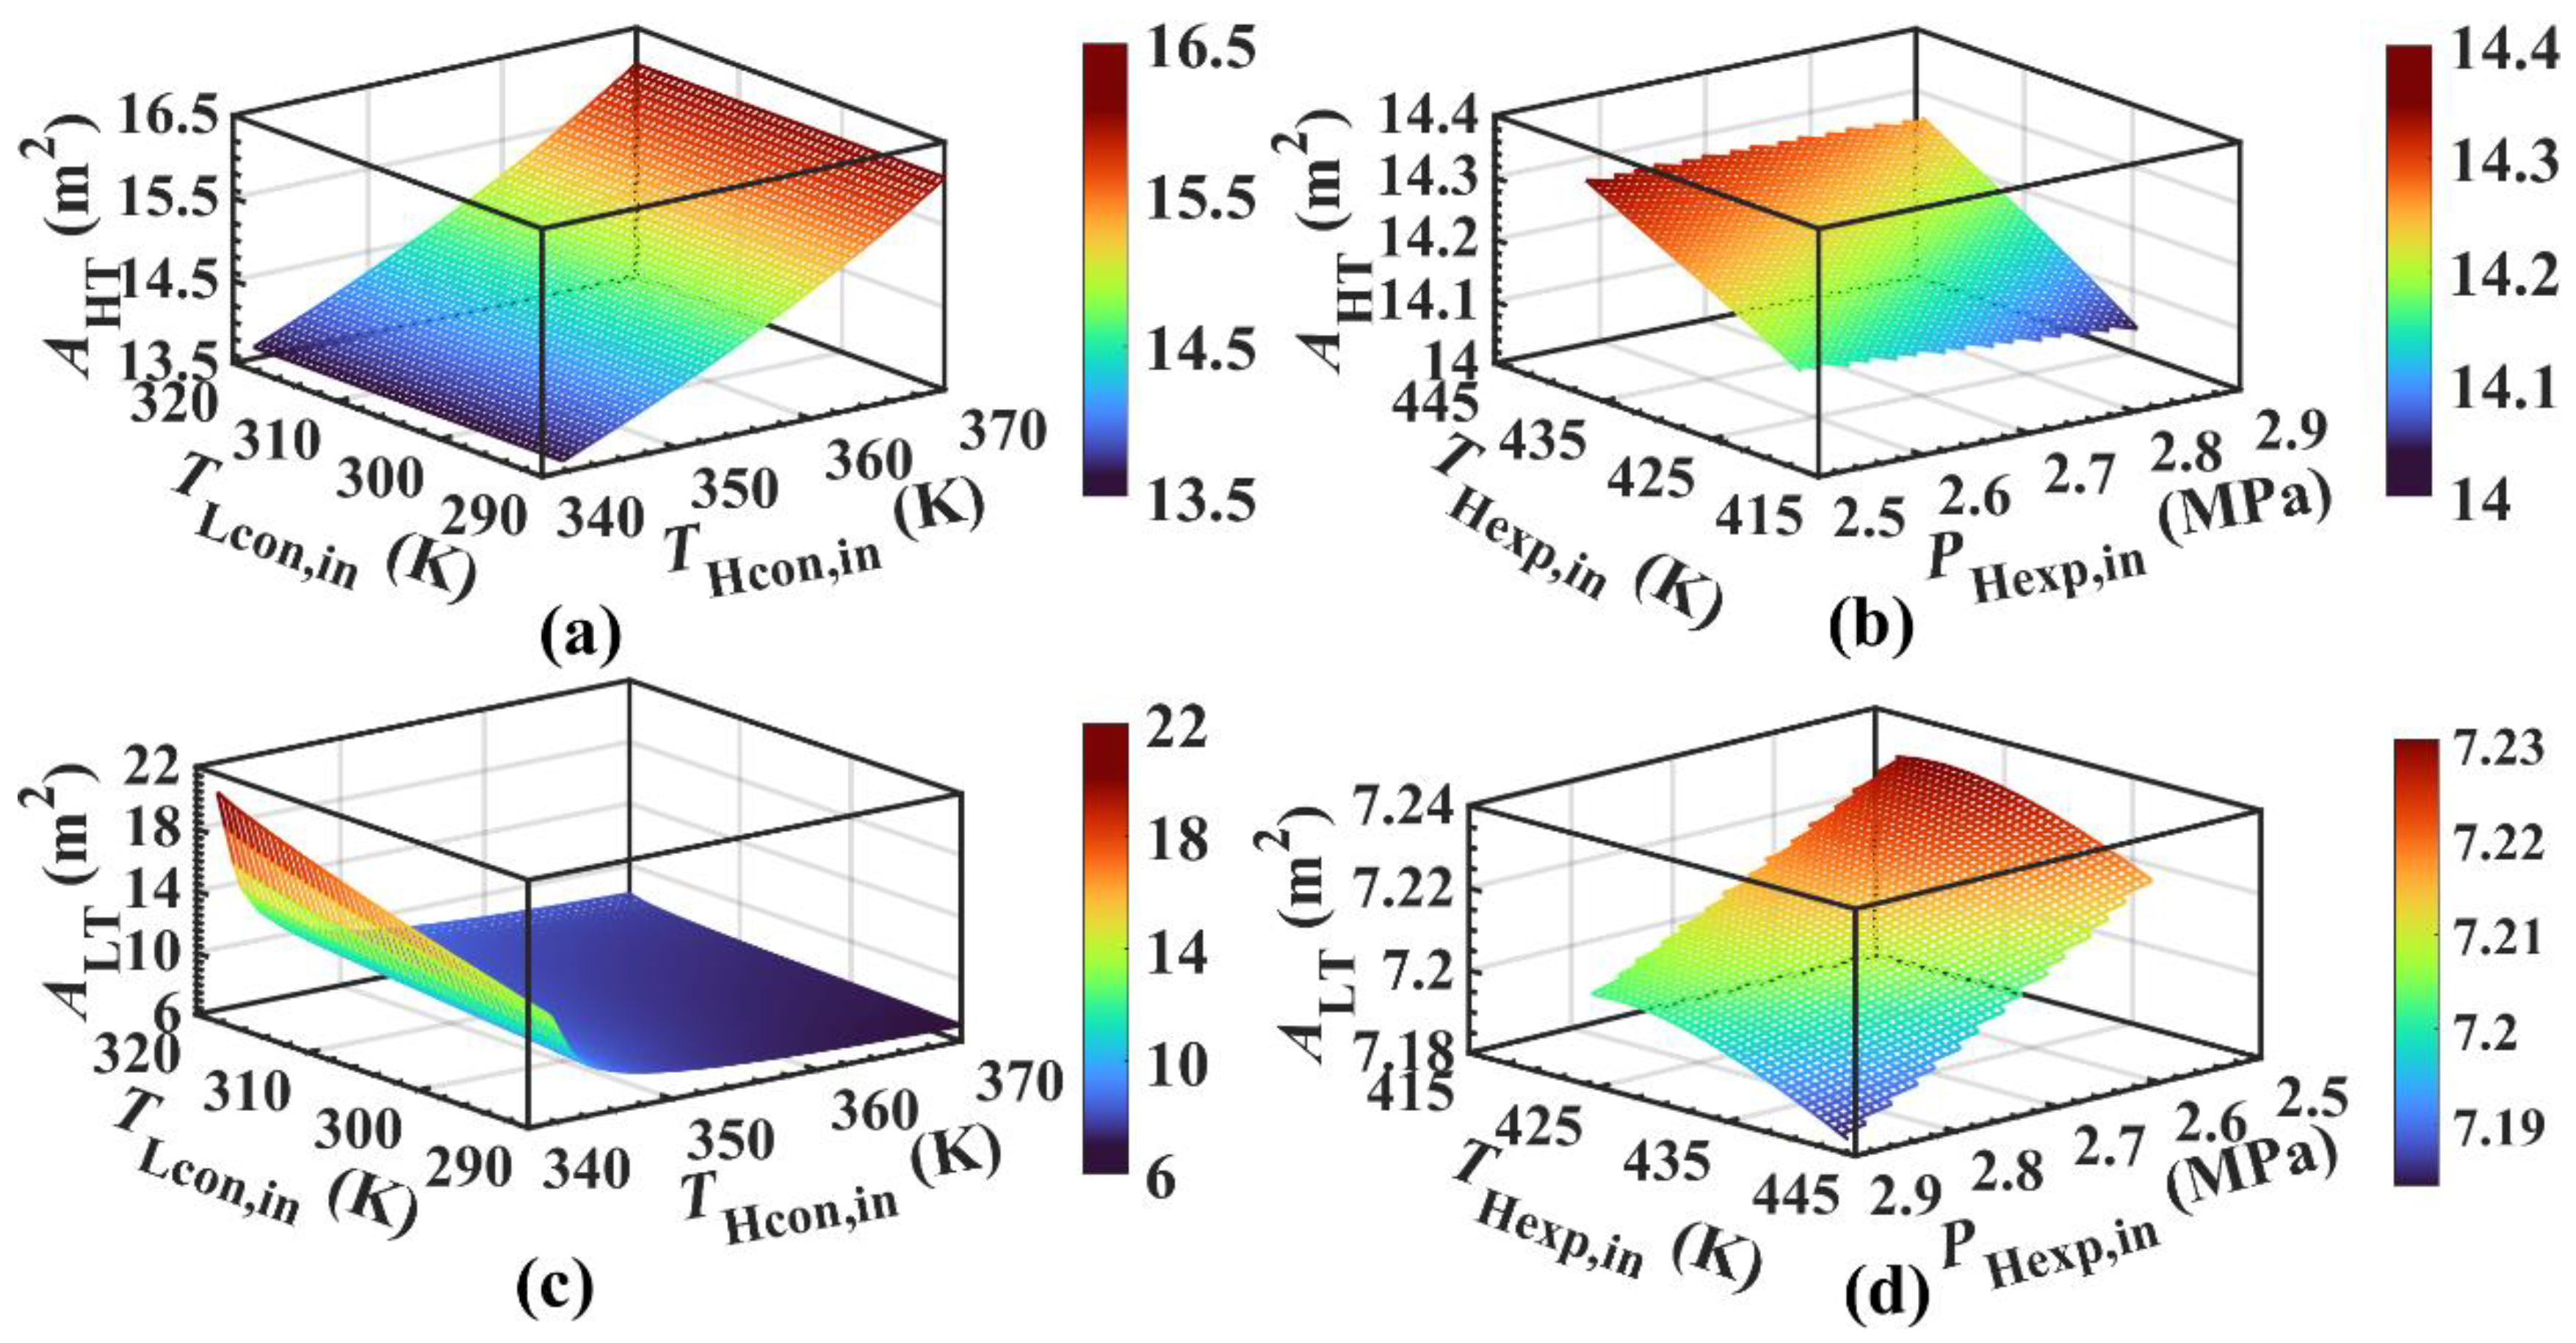
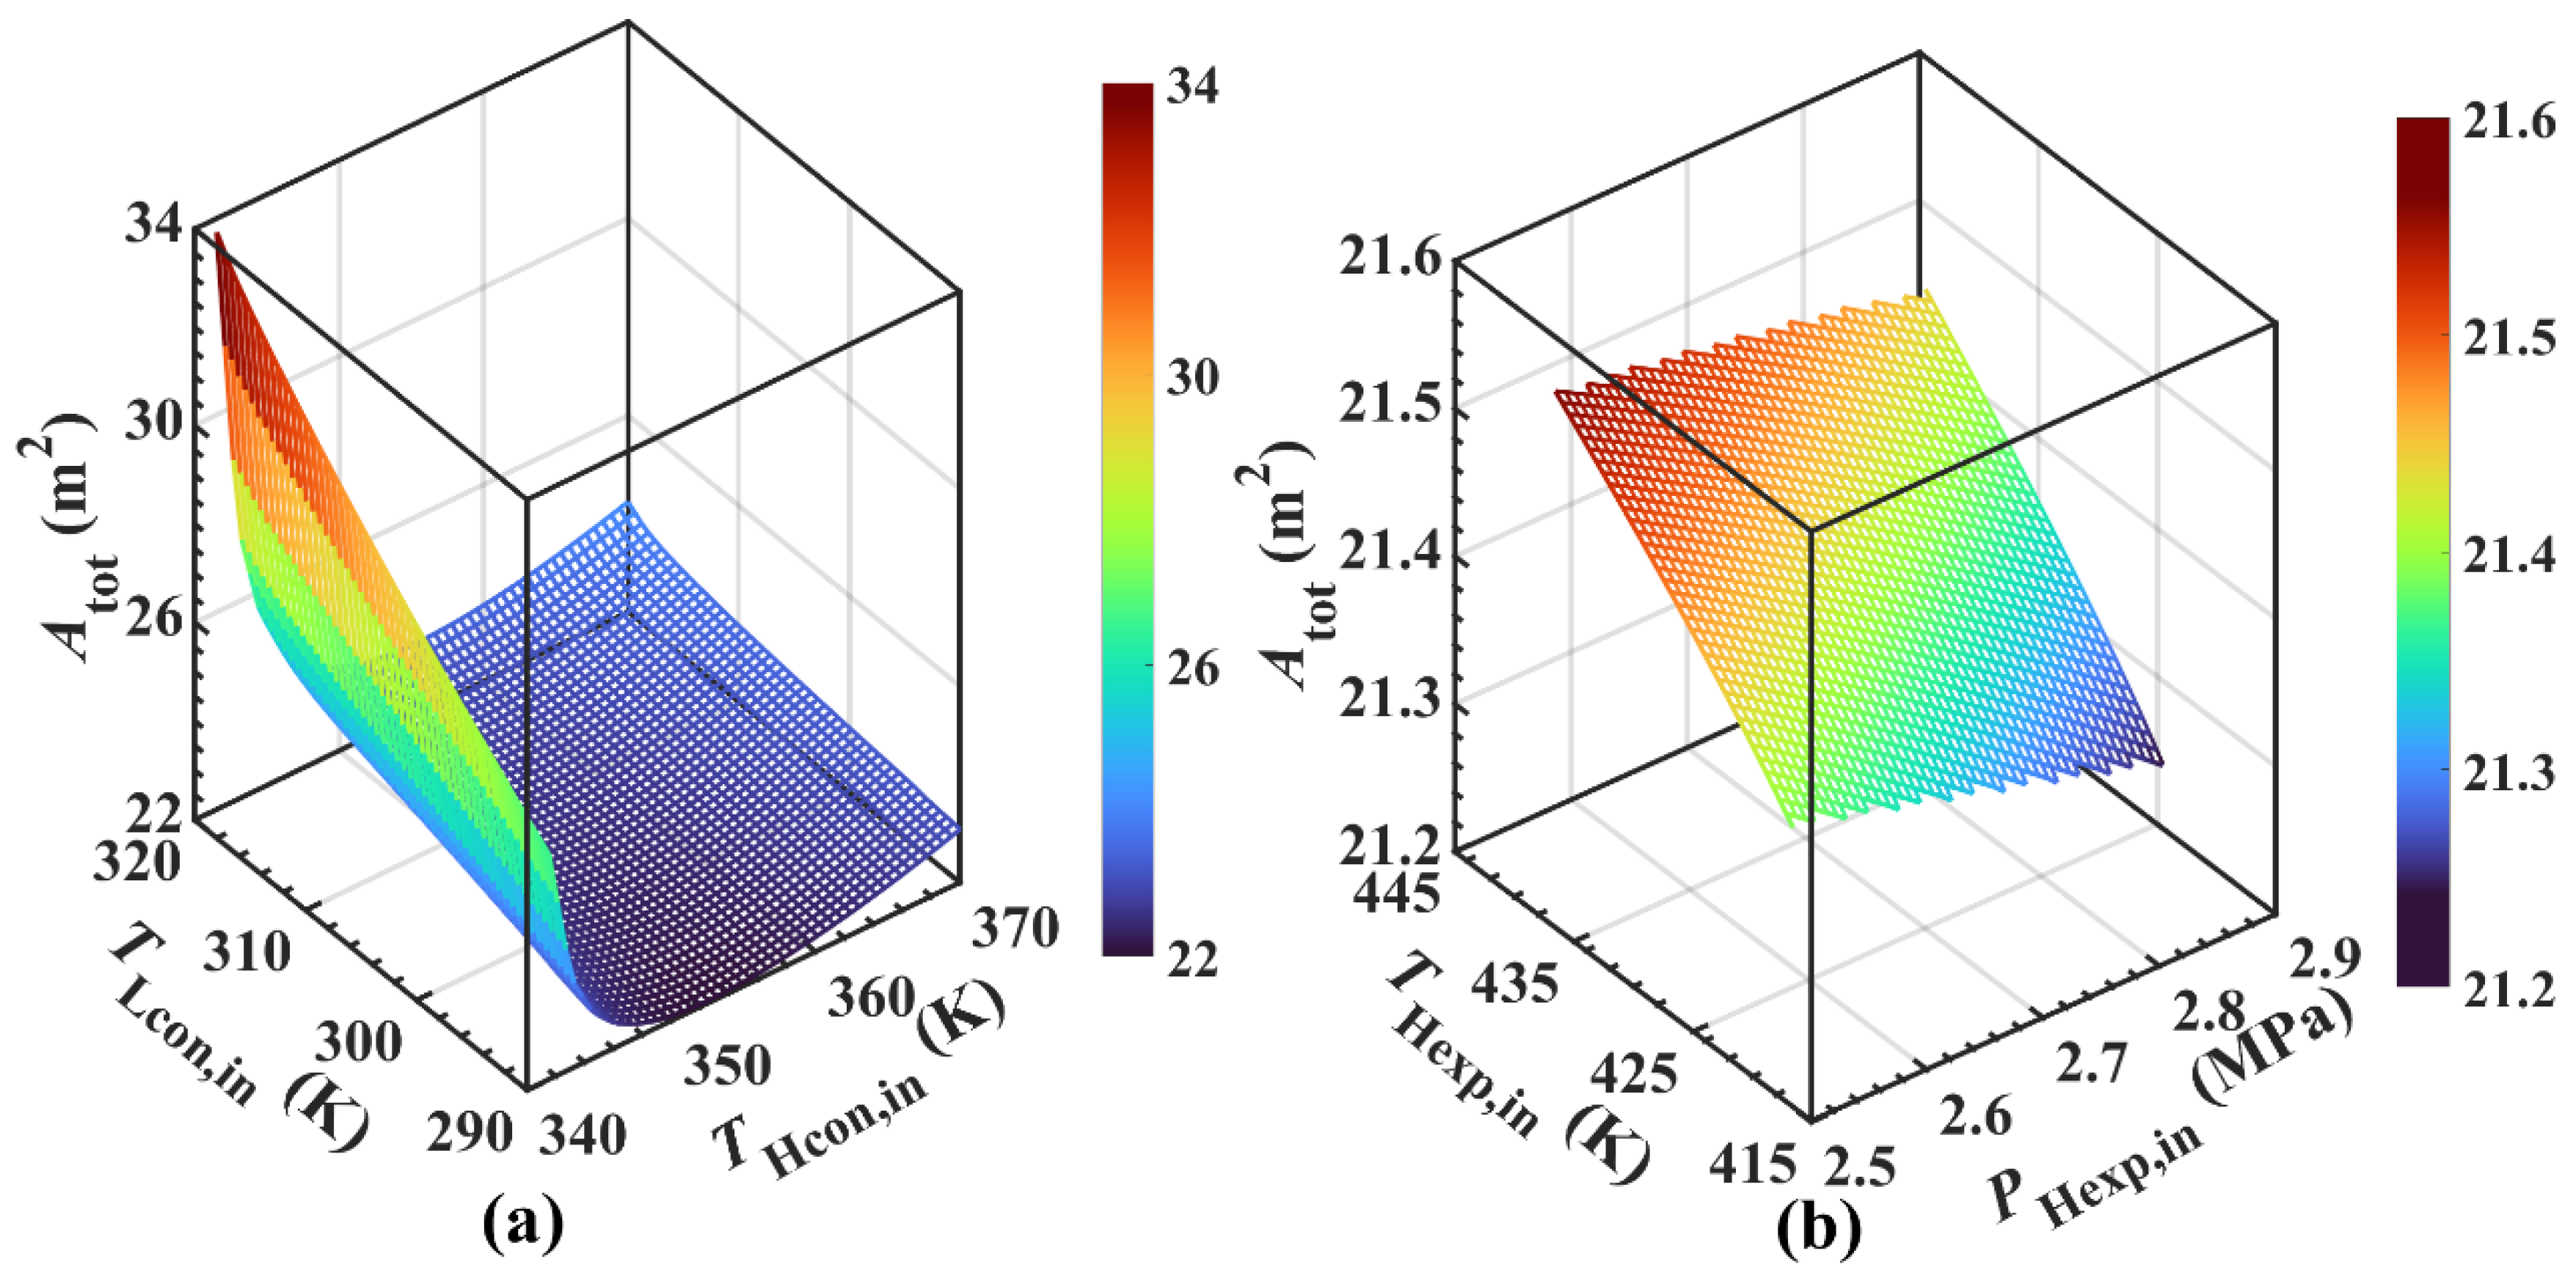
4.3. Heat Transfer Surface Analysis
4.3.1. Variable Working Conditions
4.3.2. Key Variables
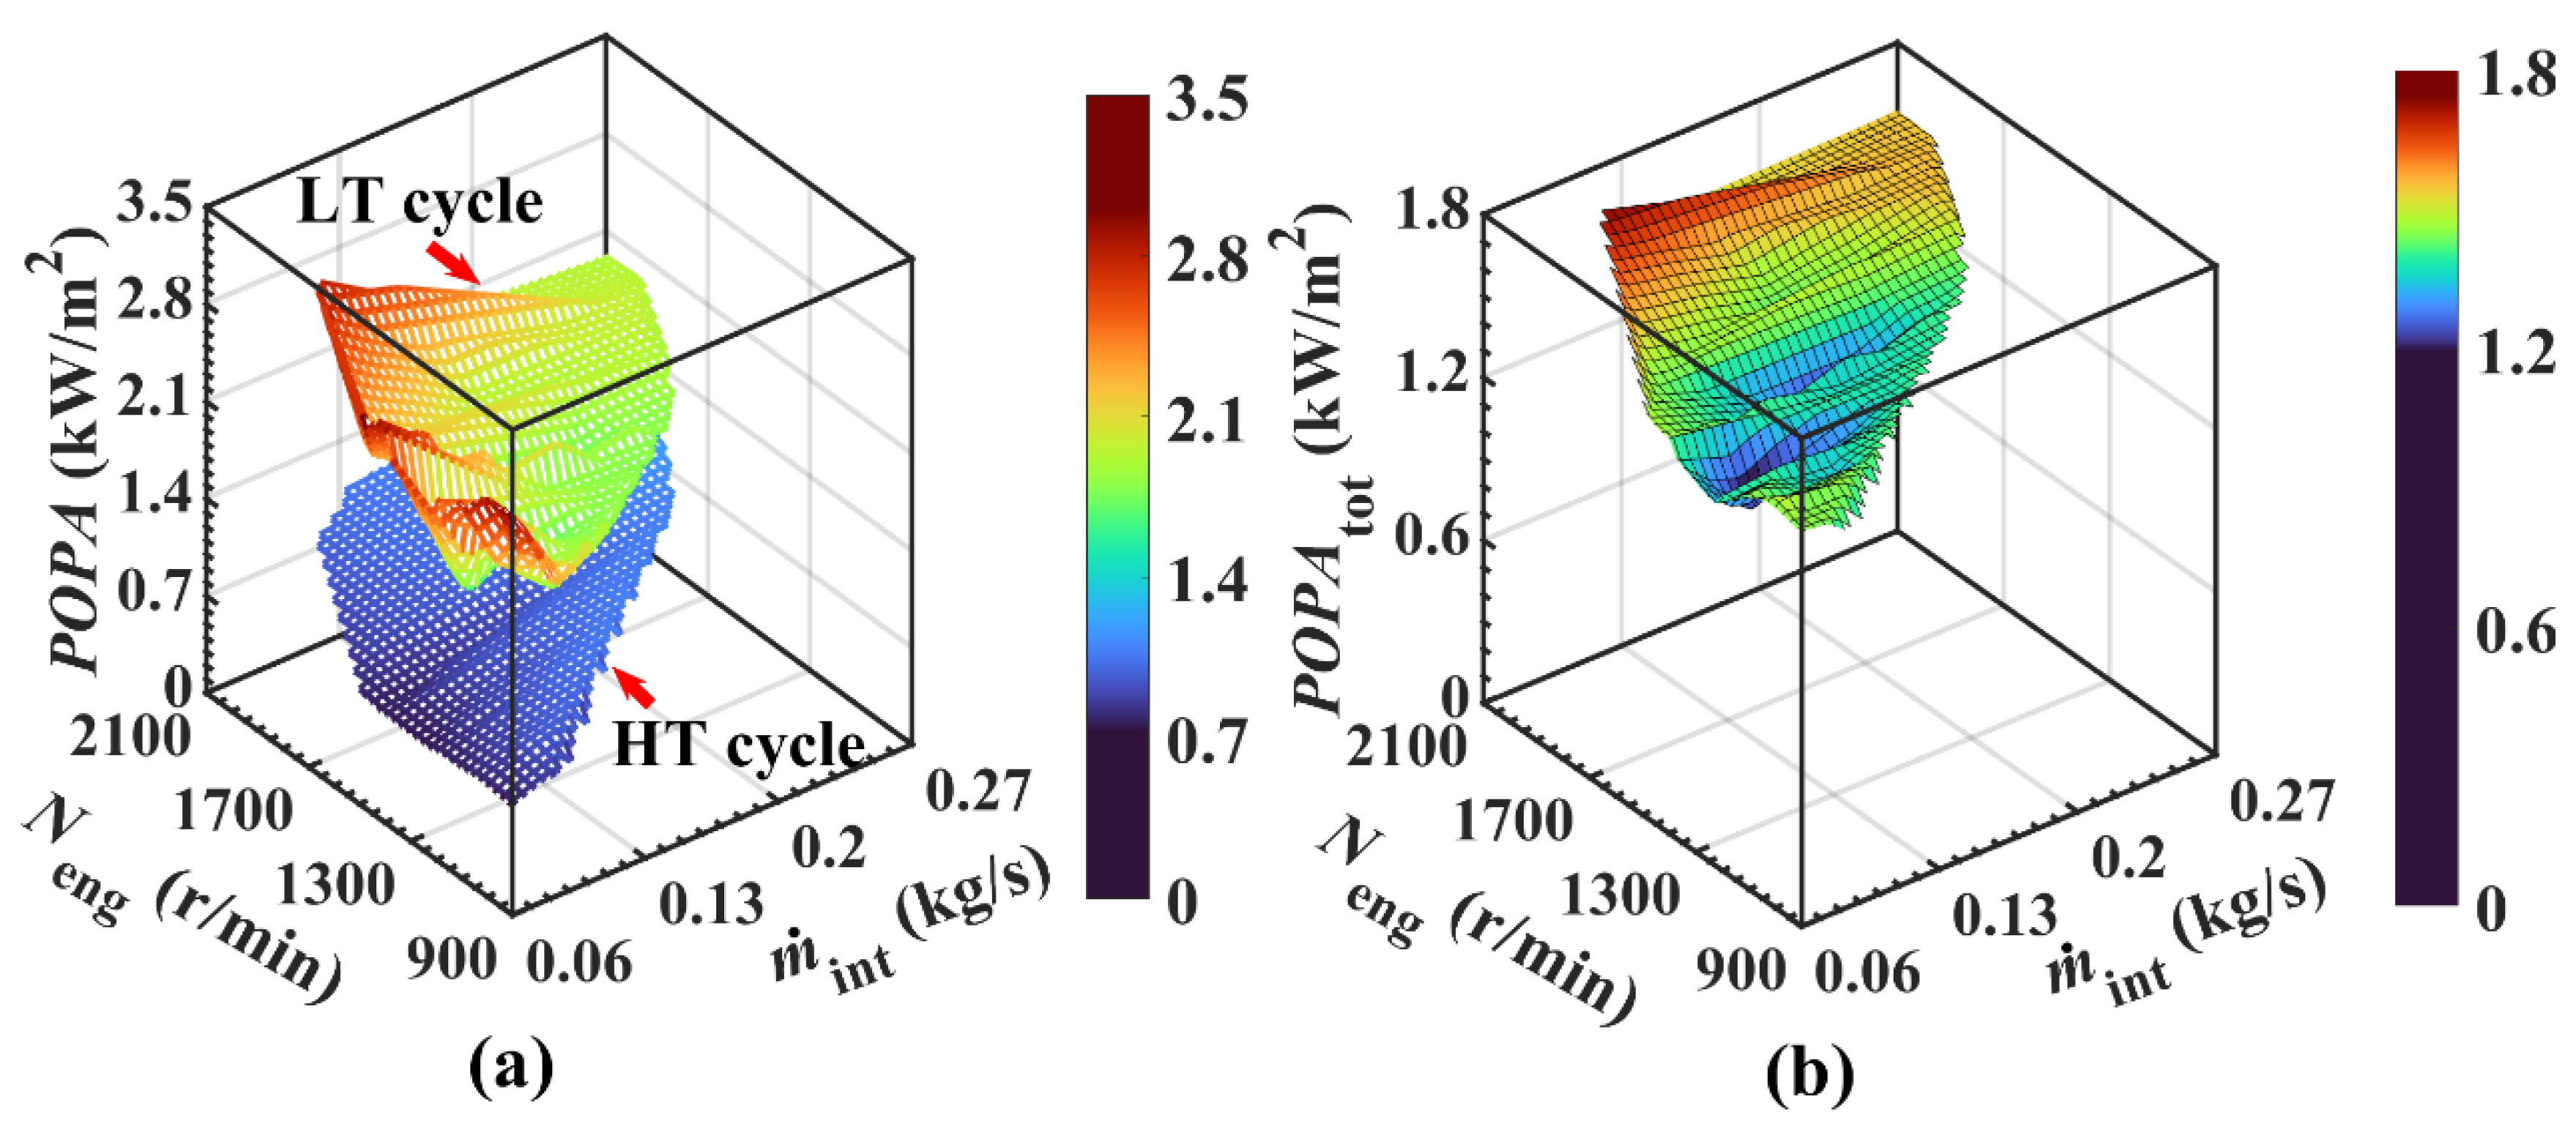
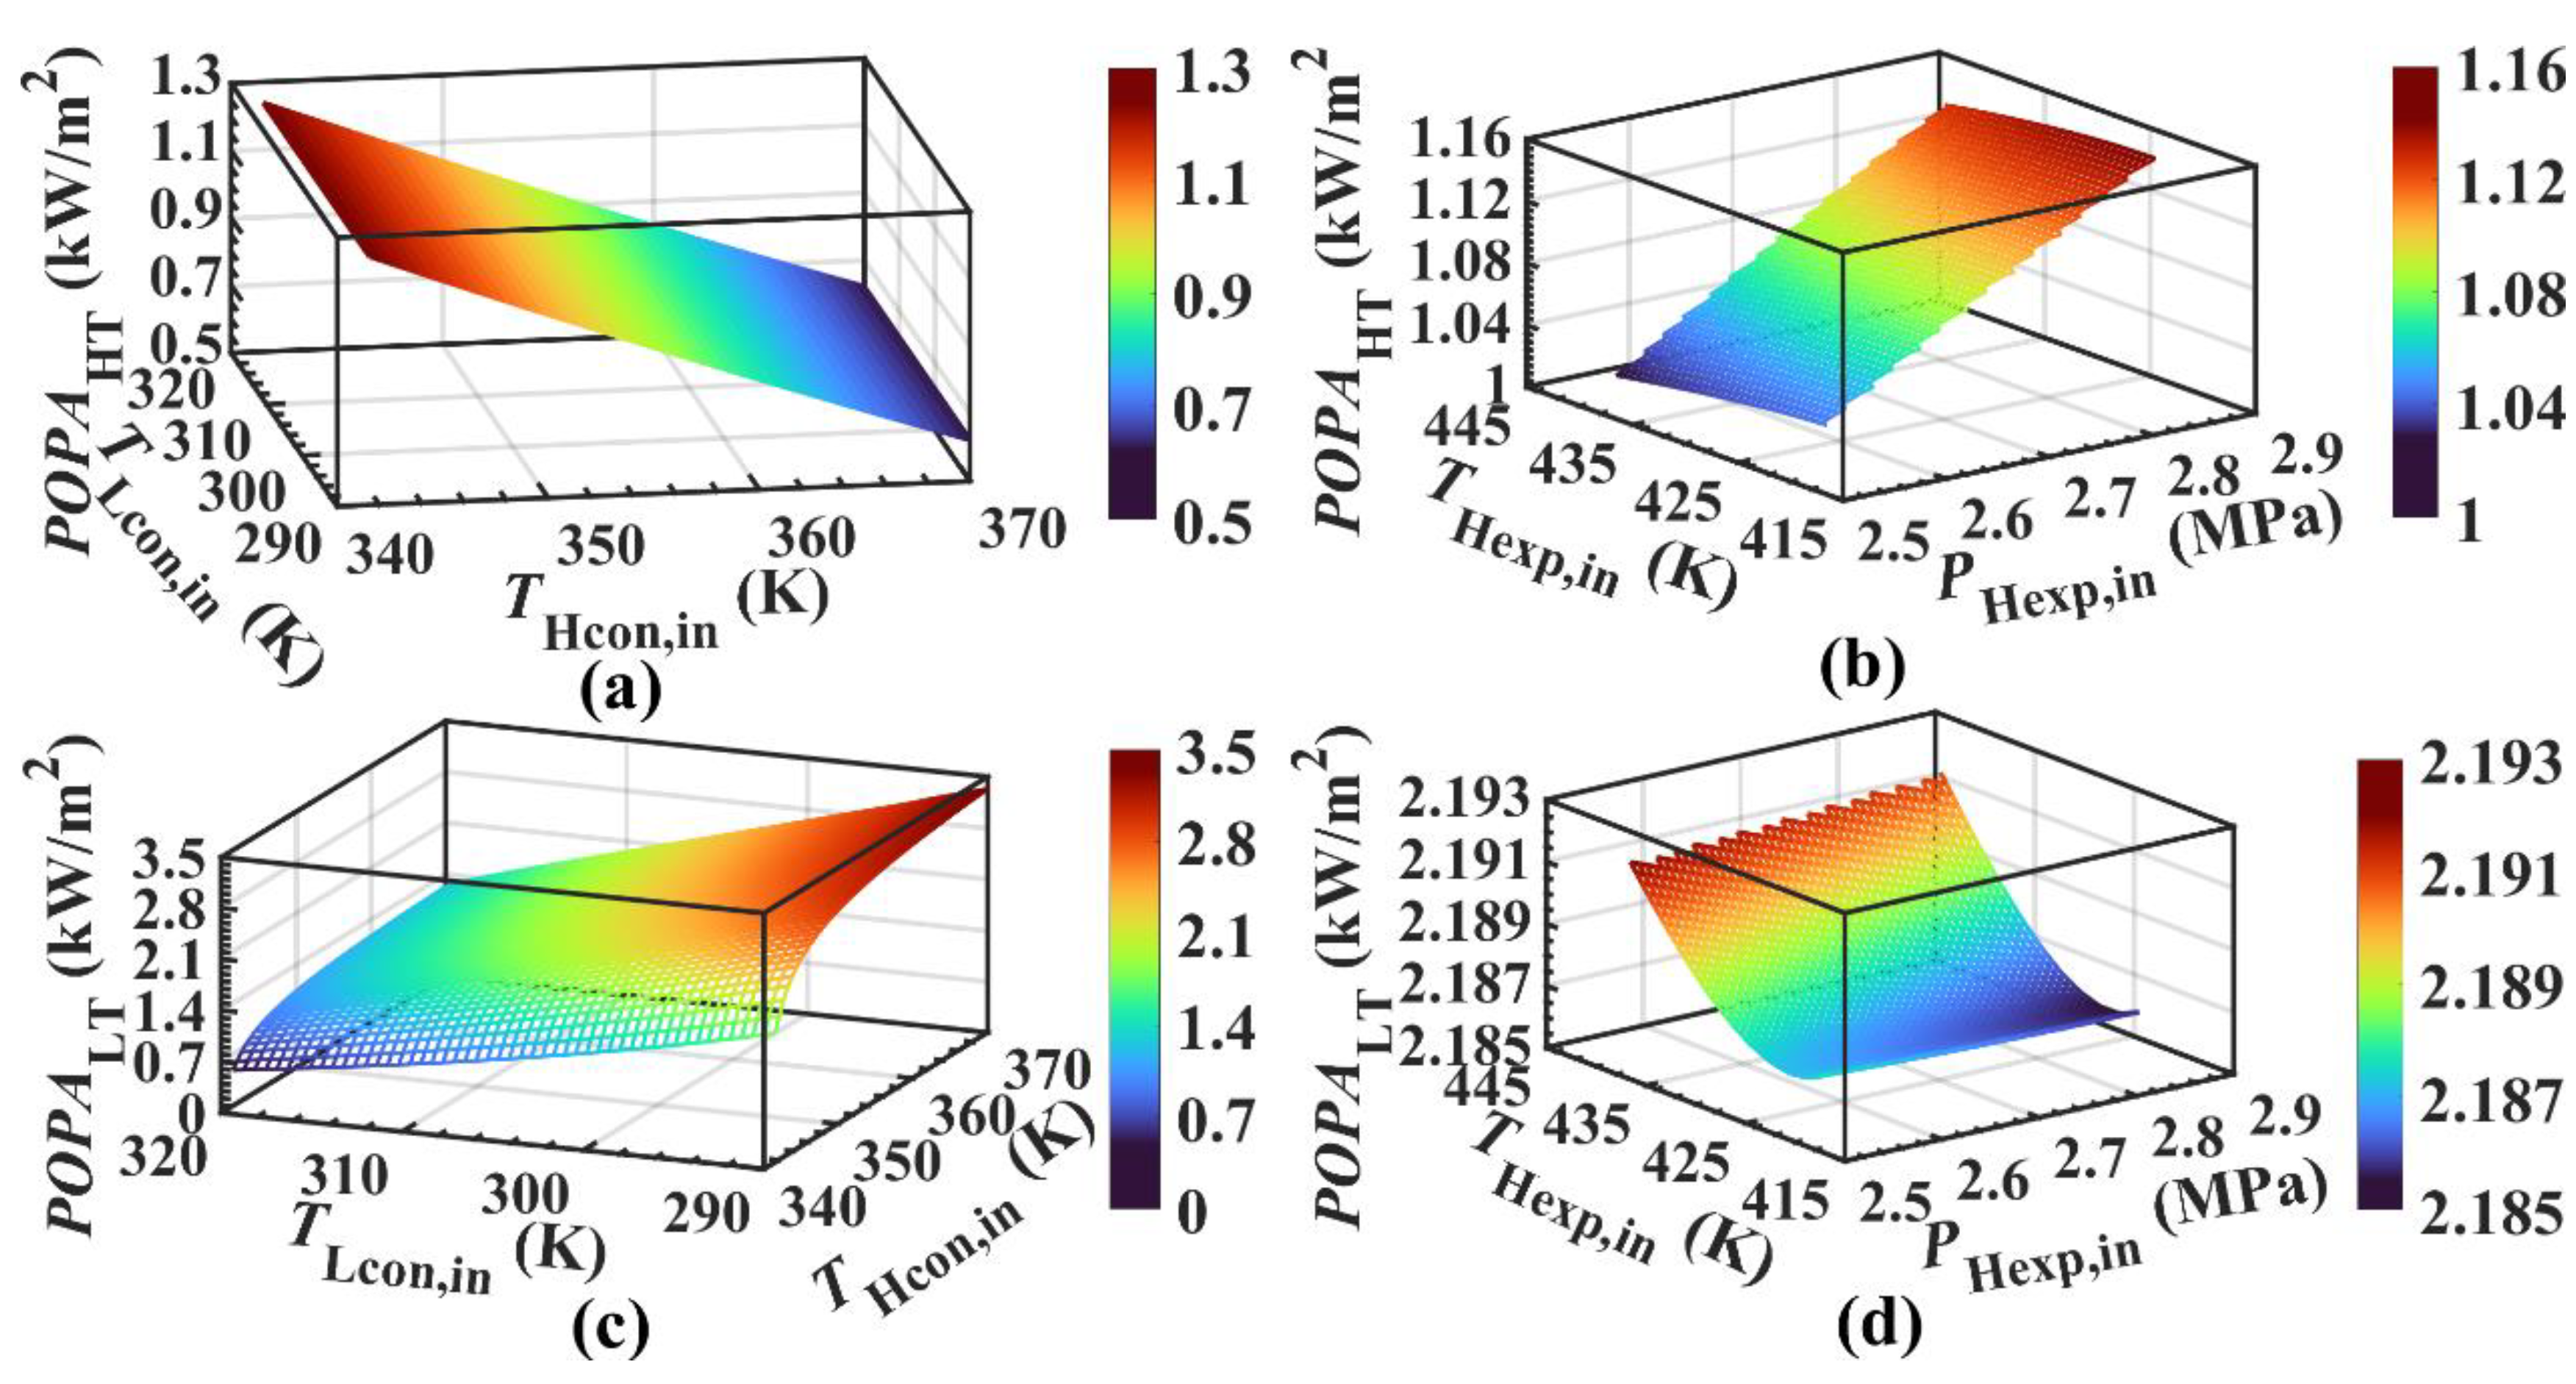
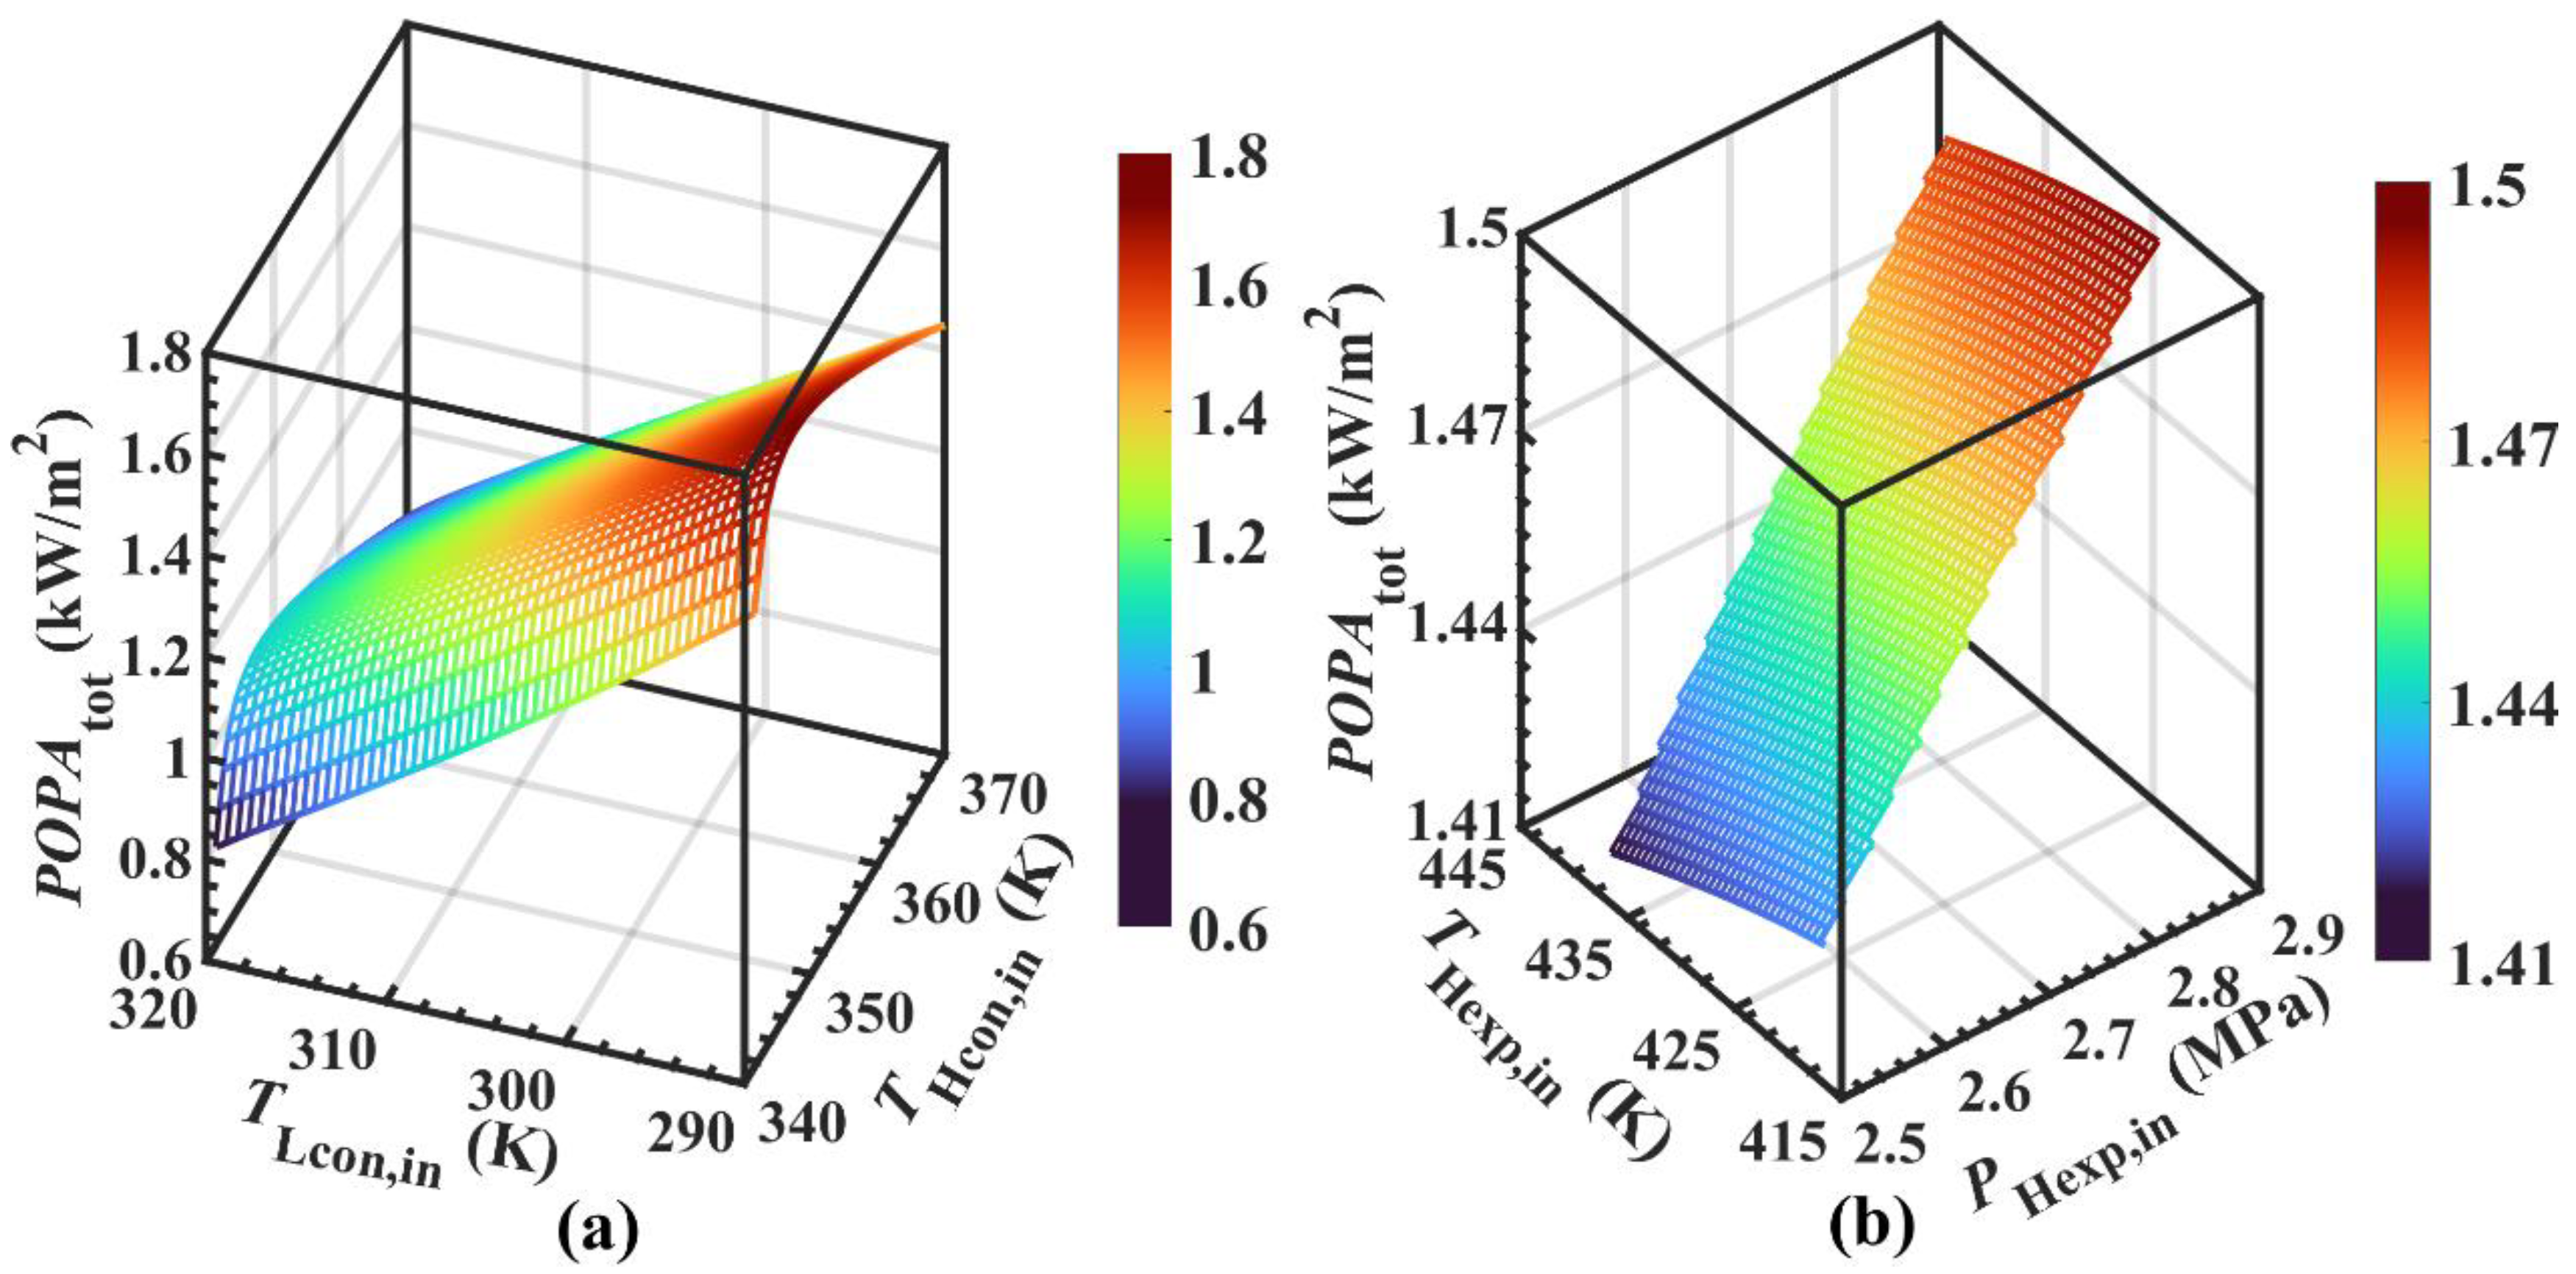
4.4. POPA
4.4.1. Variable Working Conditions
4.4.2. Key Variables
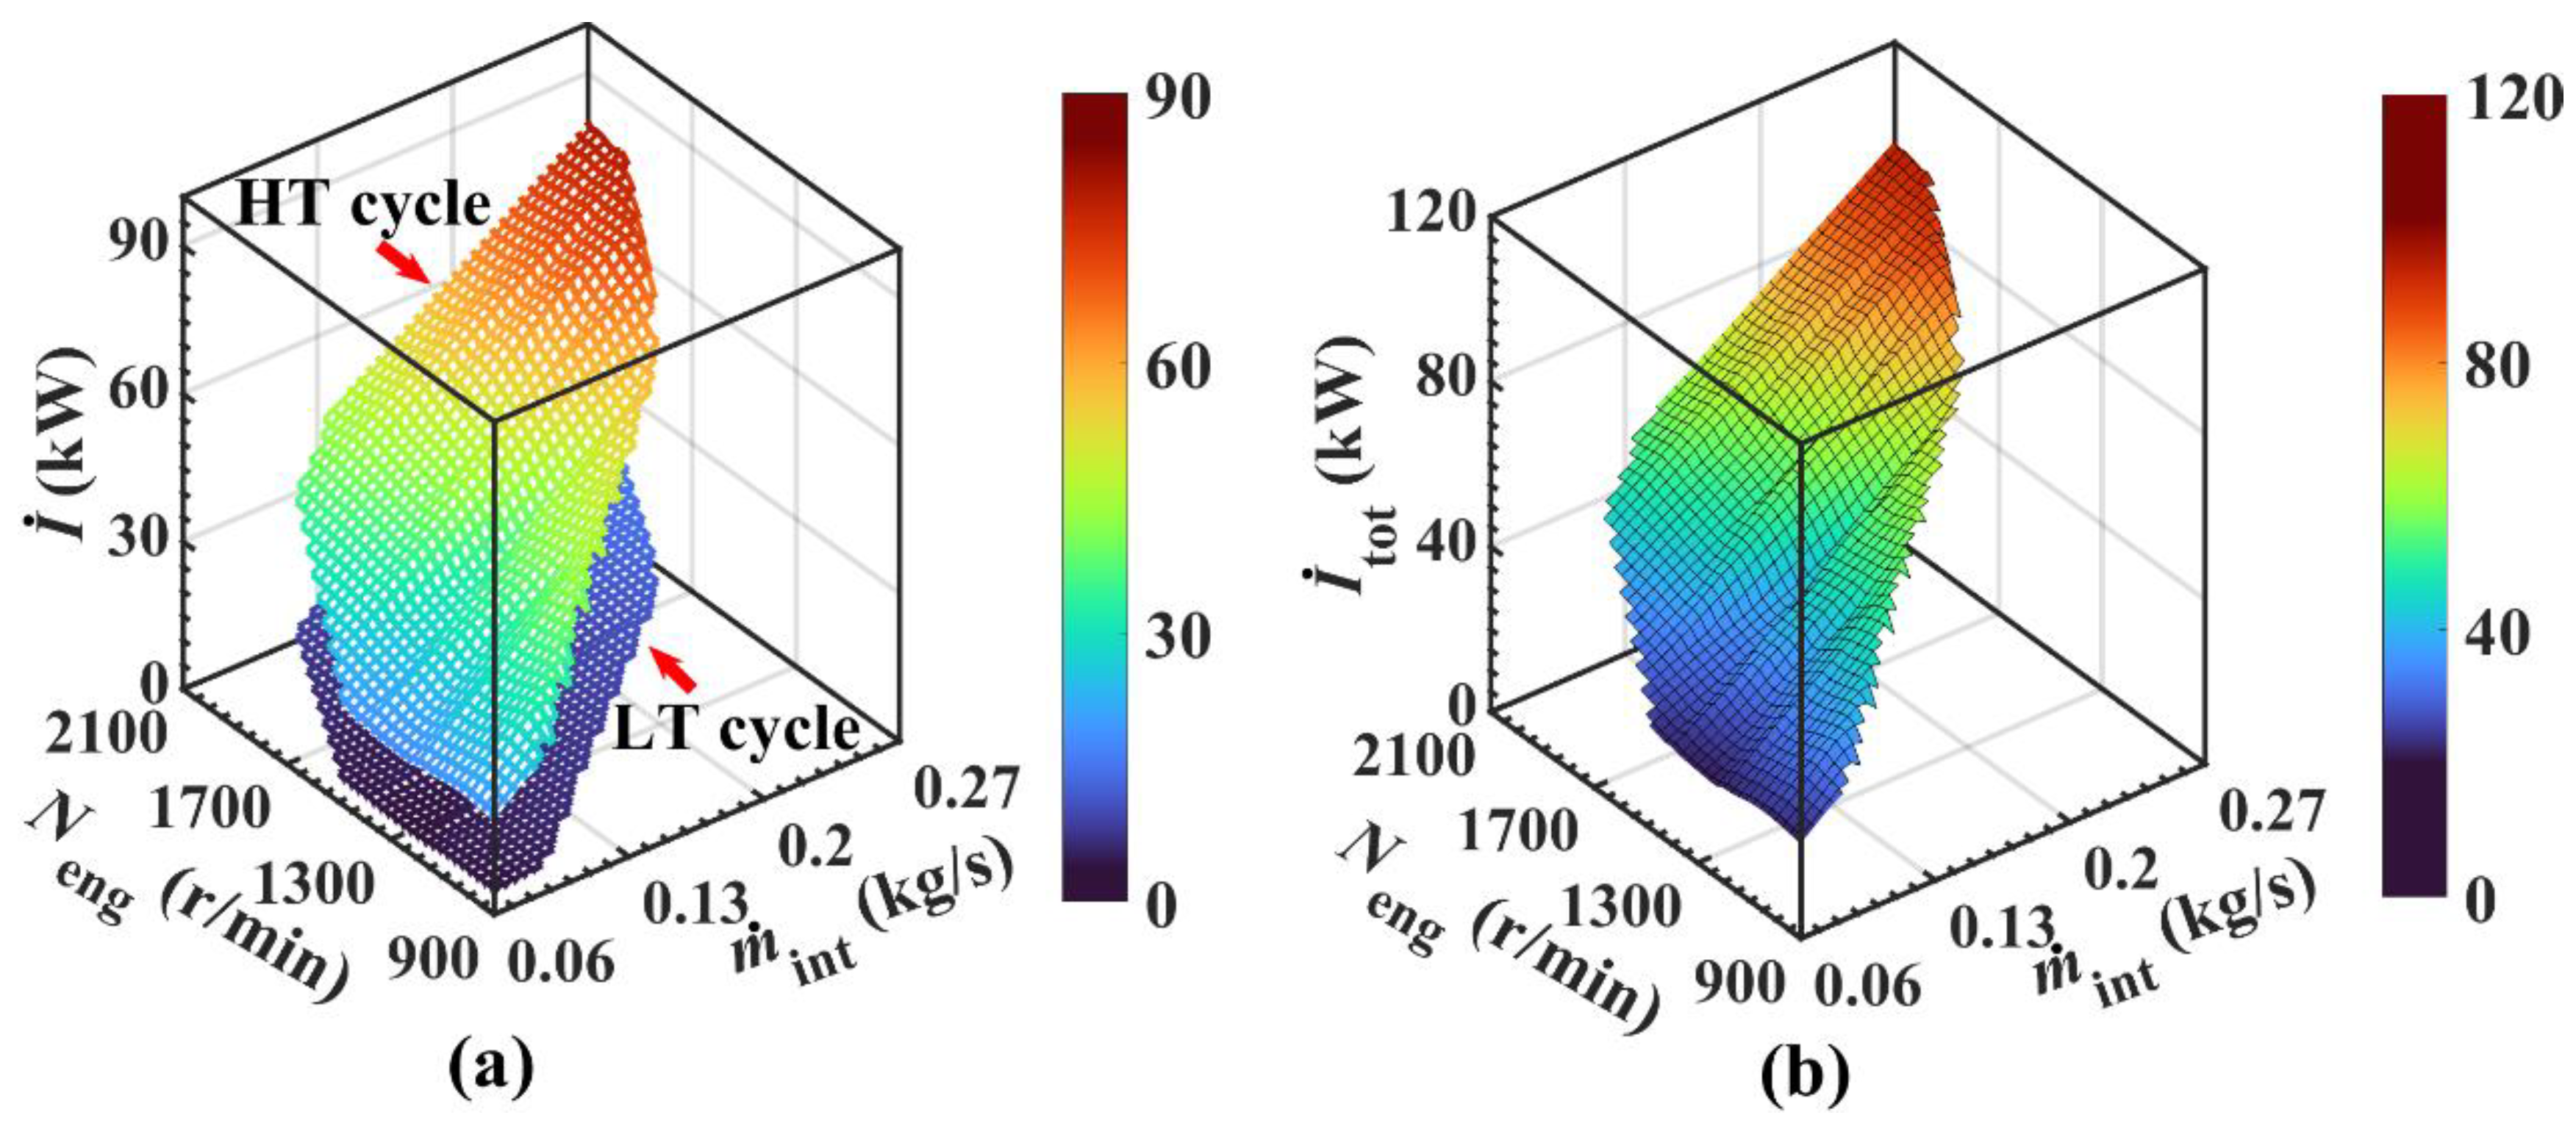
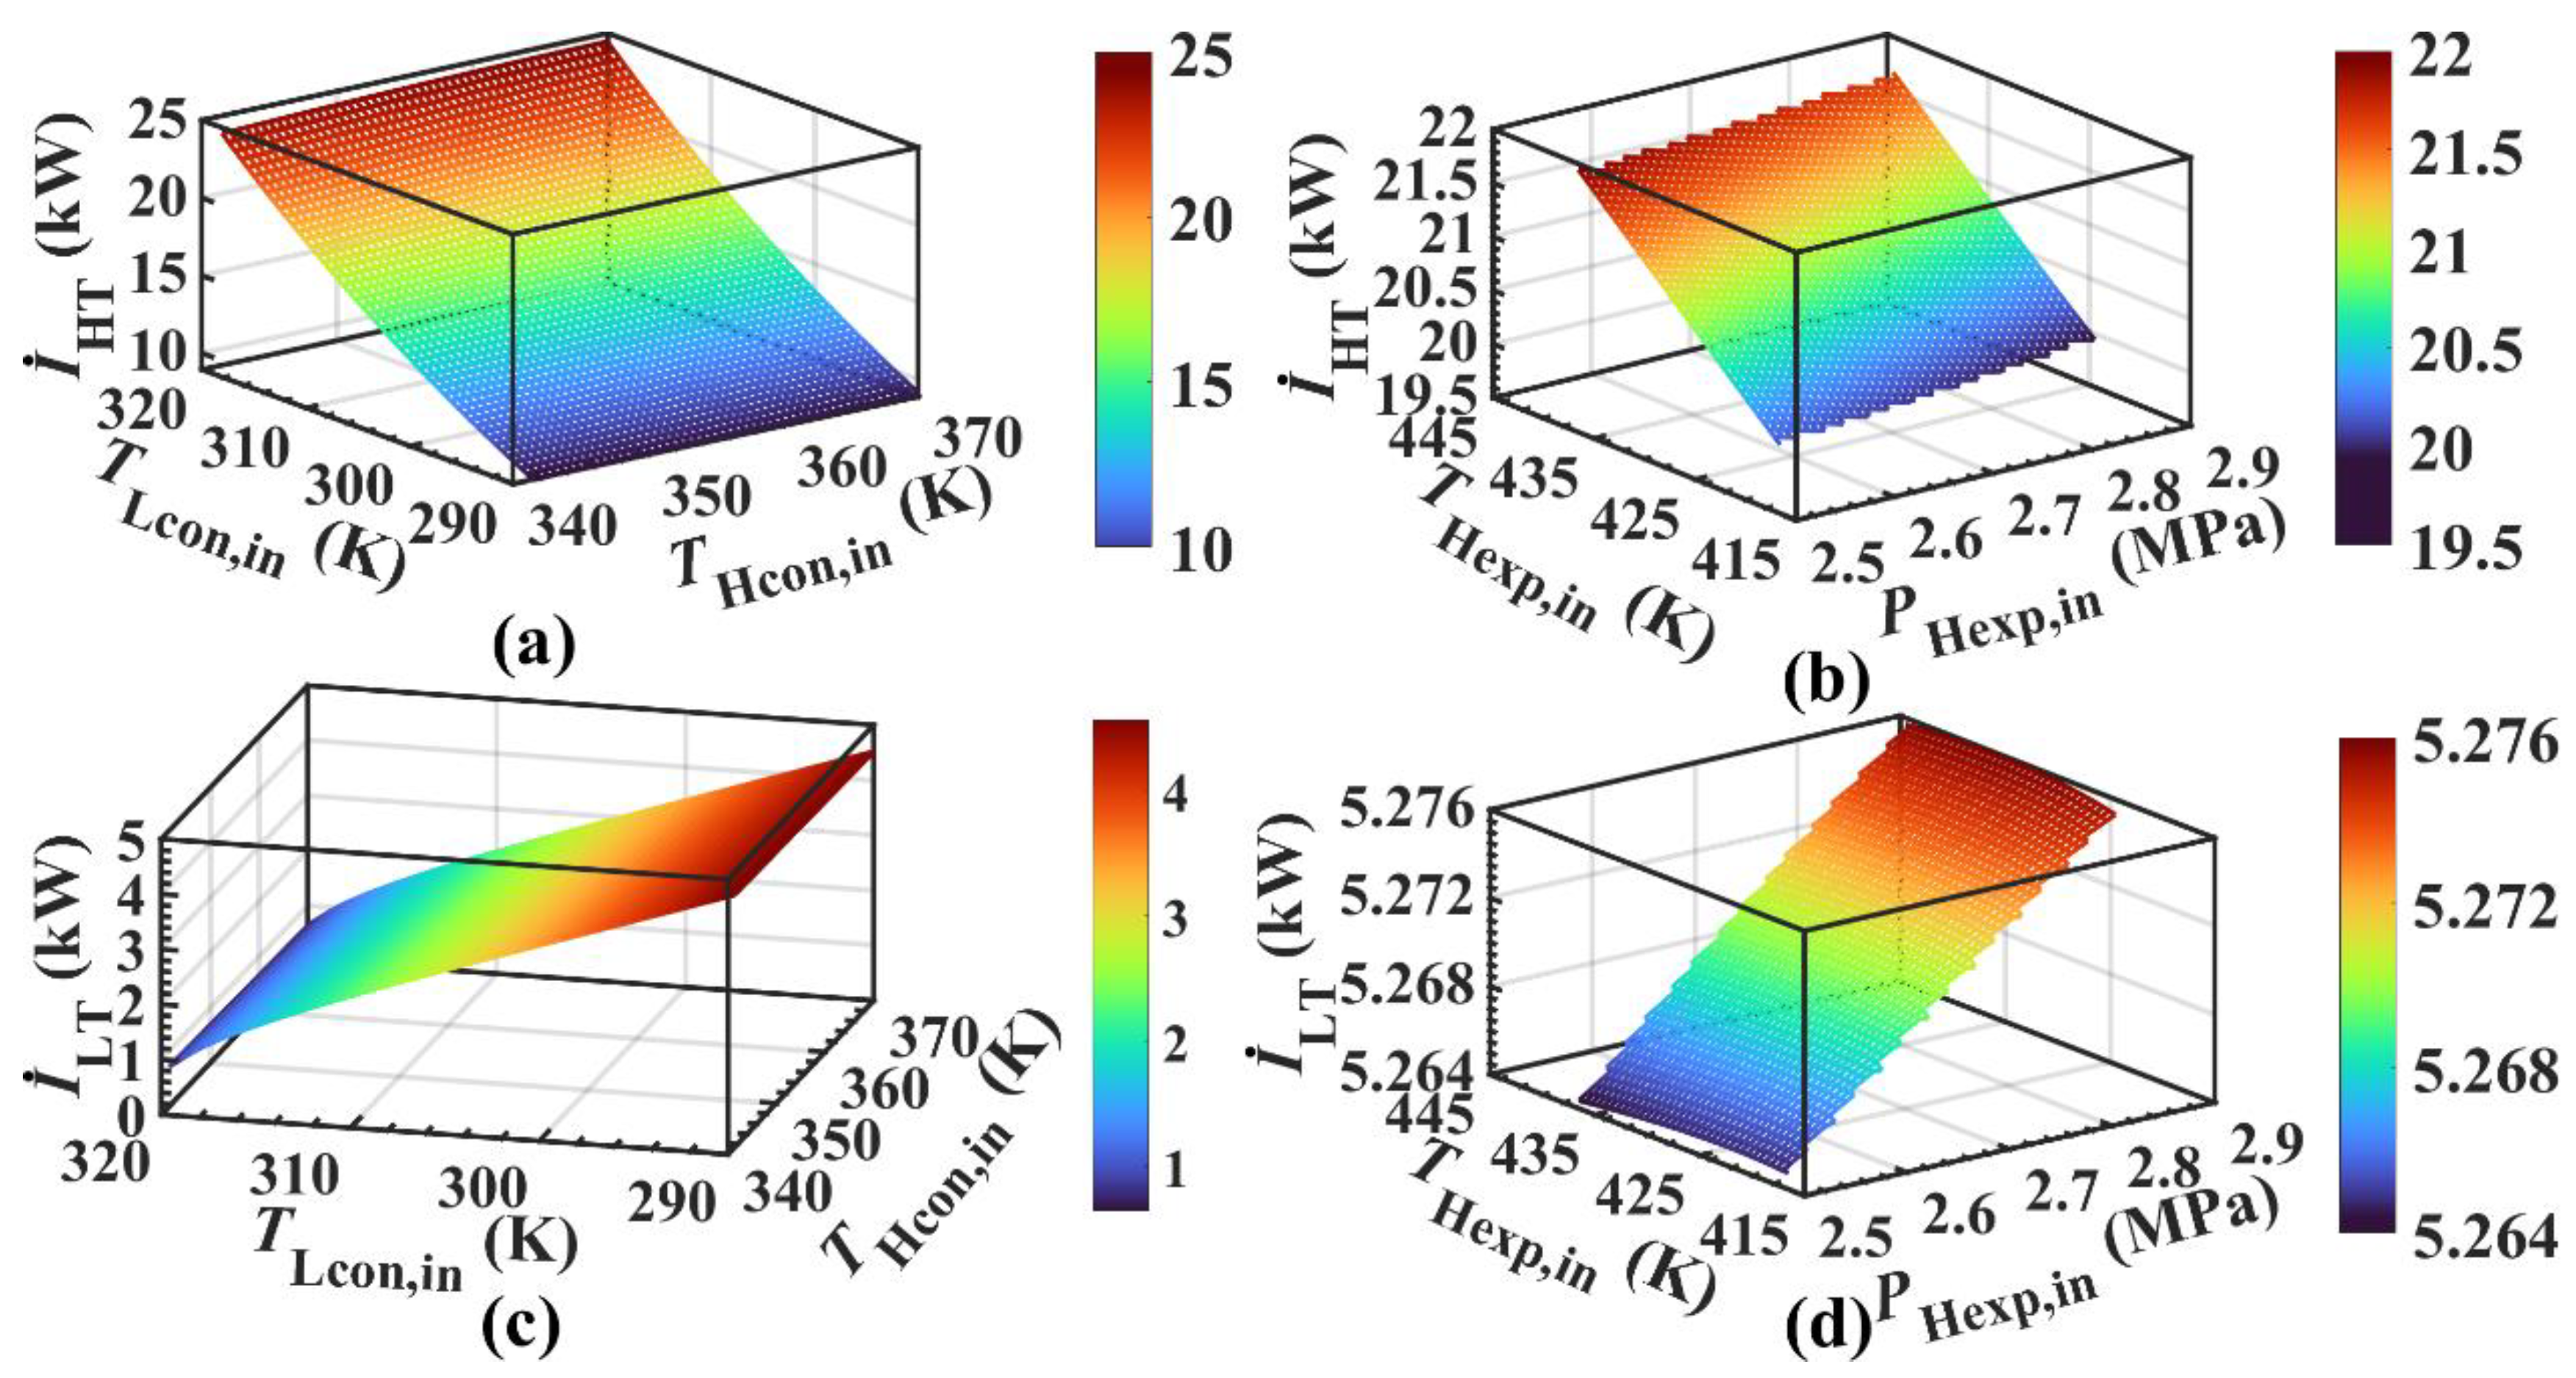
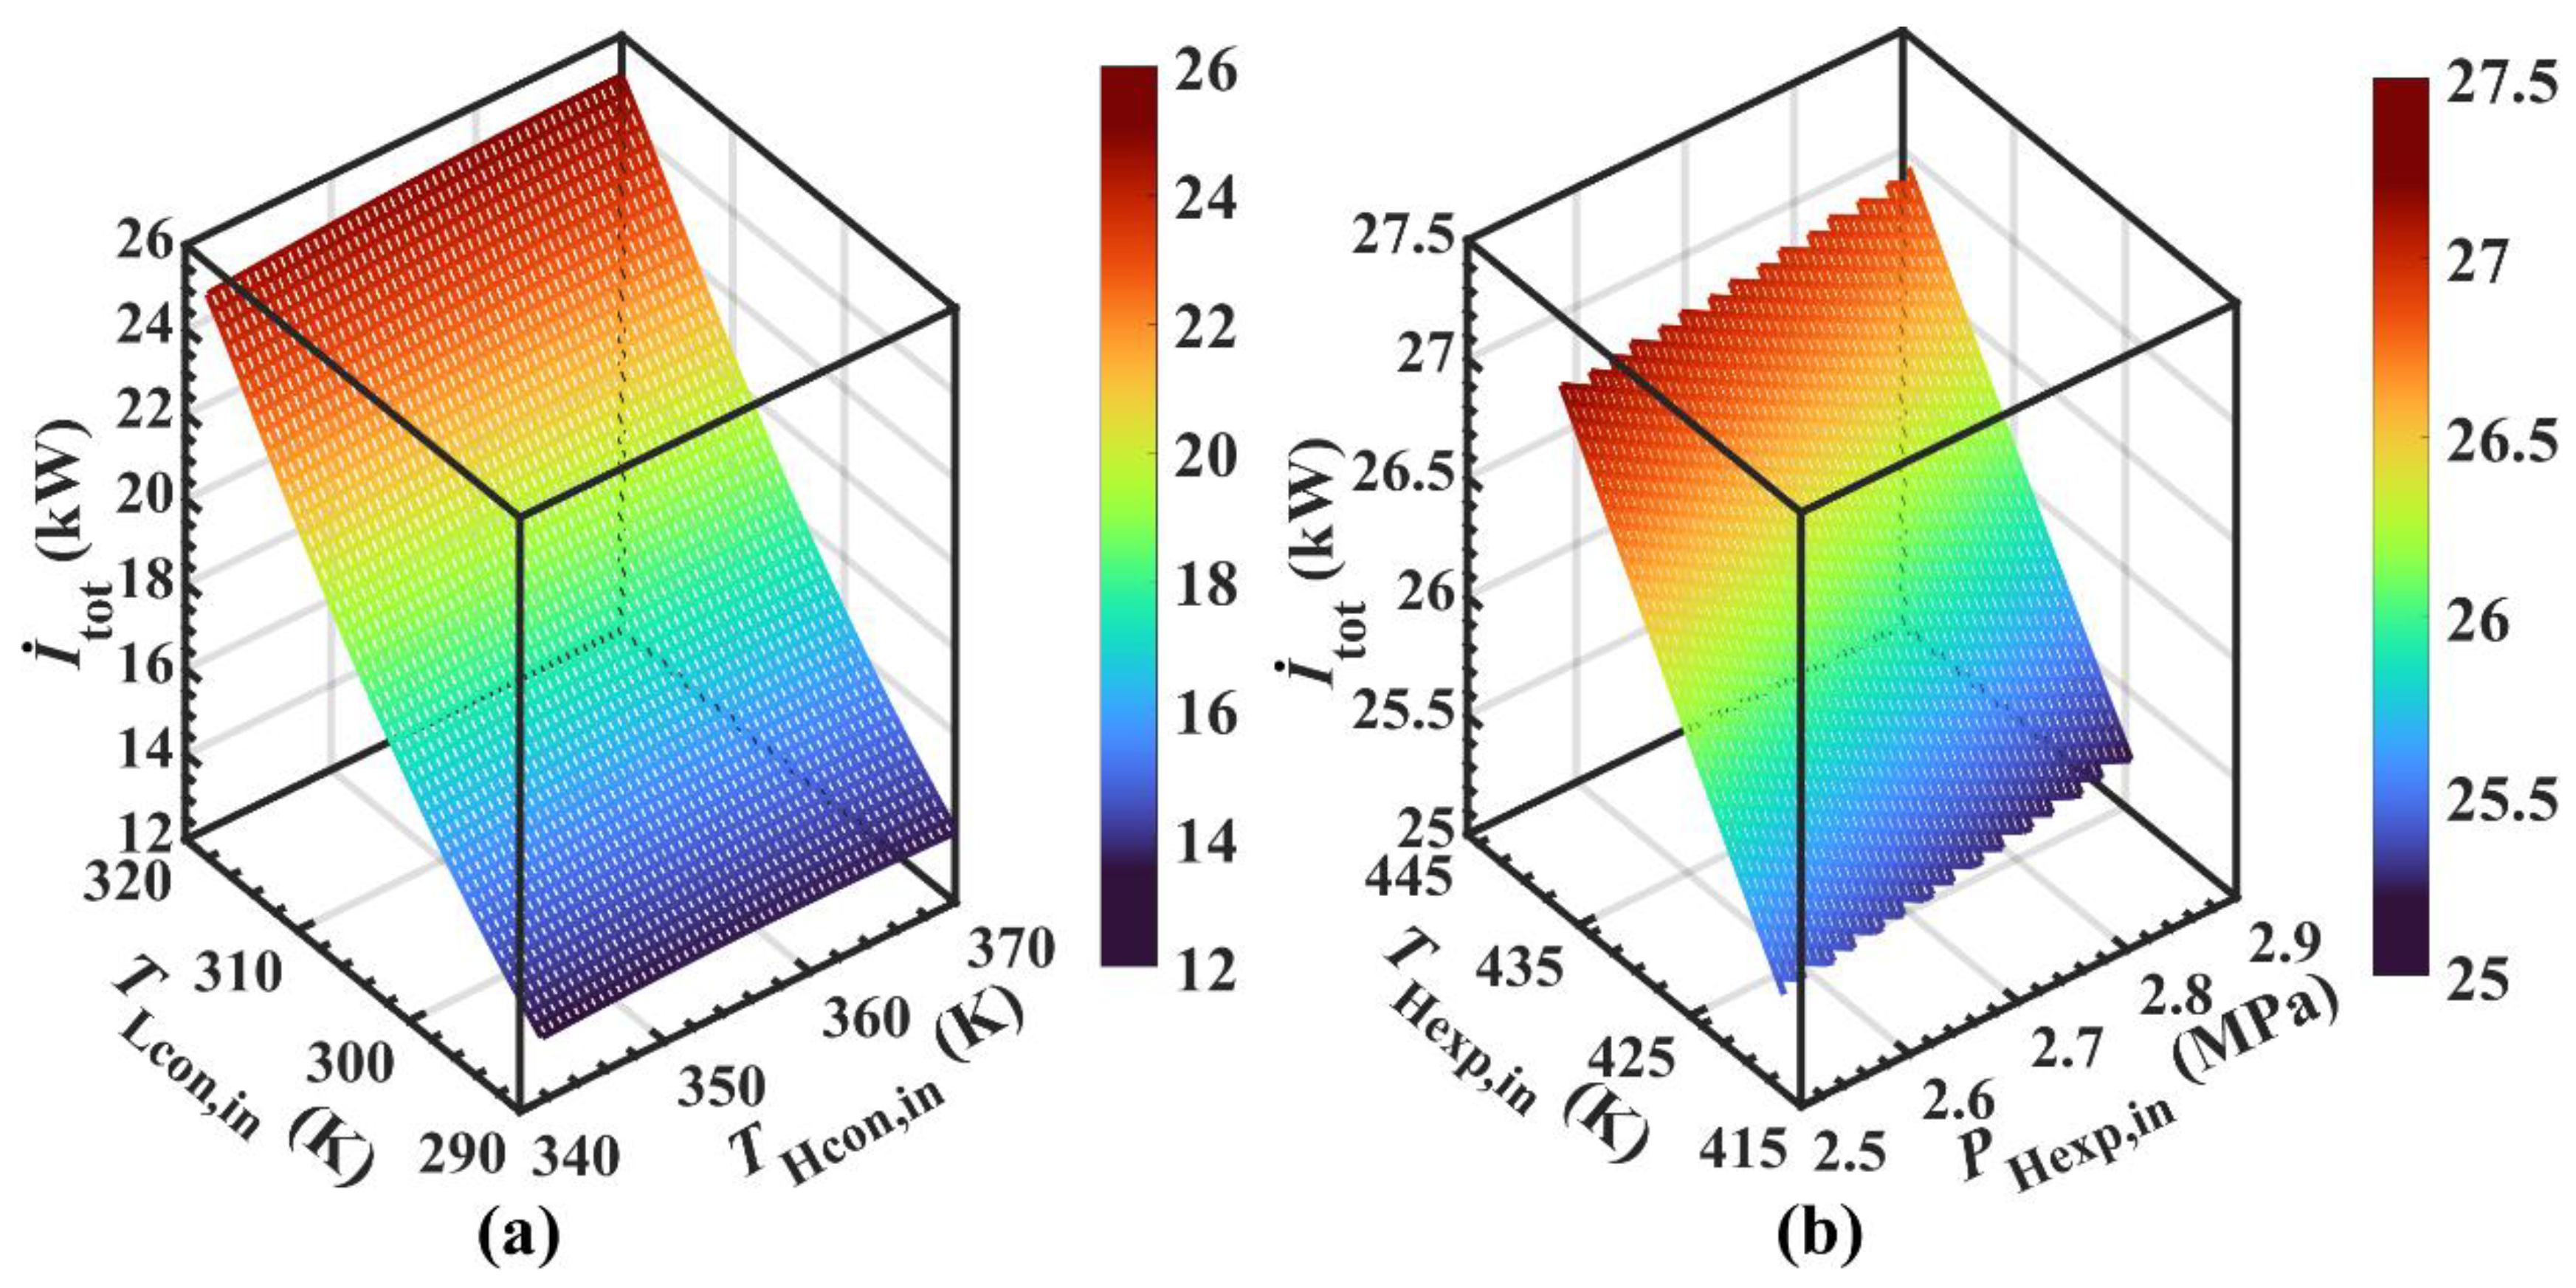
4.5. Exergy Destruction
4.5.1. Variable Working Conditions
4.5.2. Key Variables
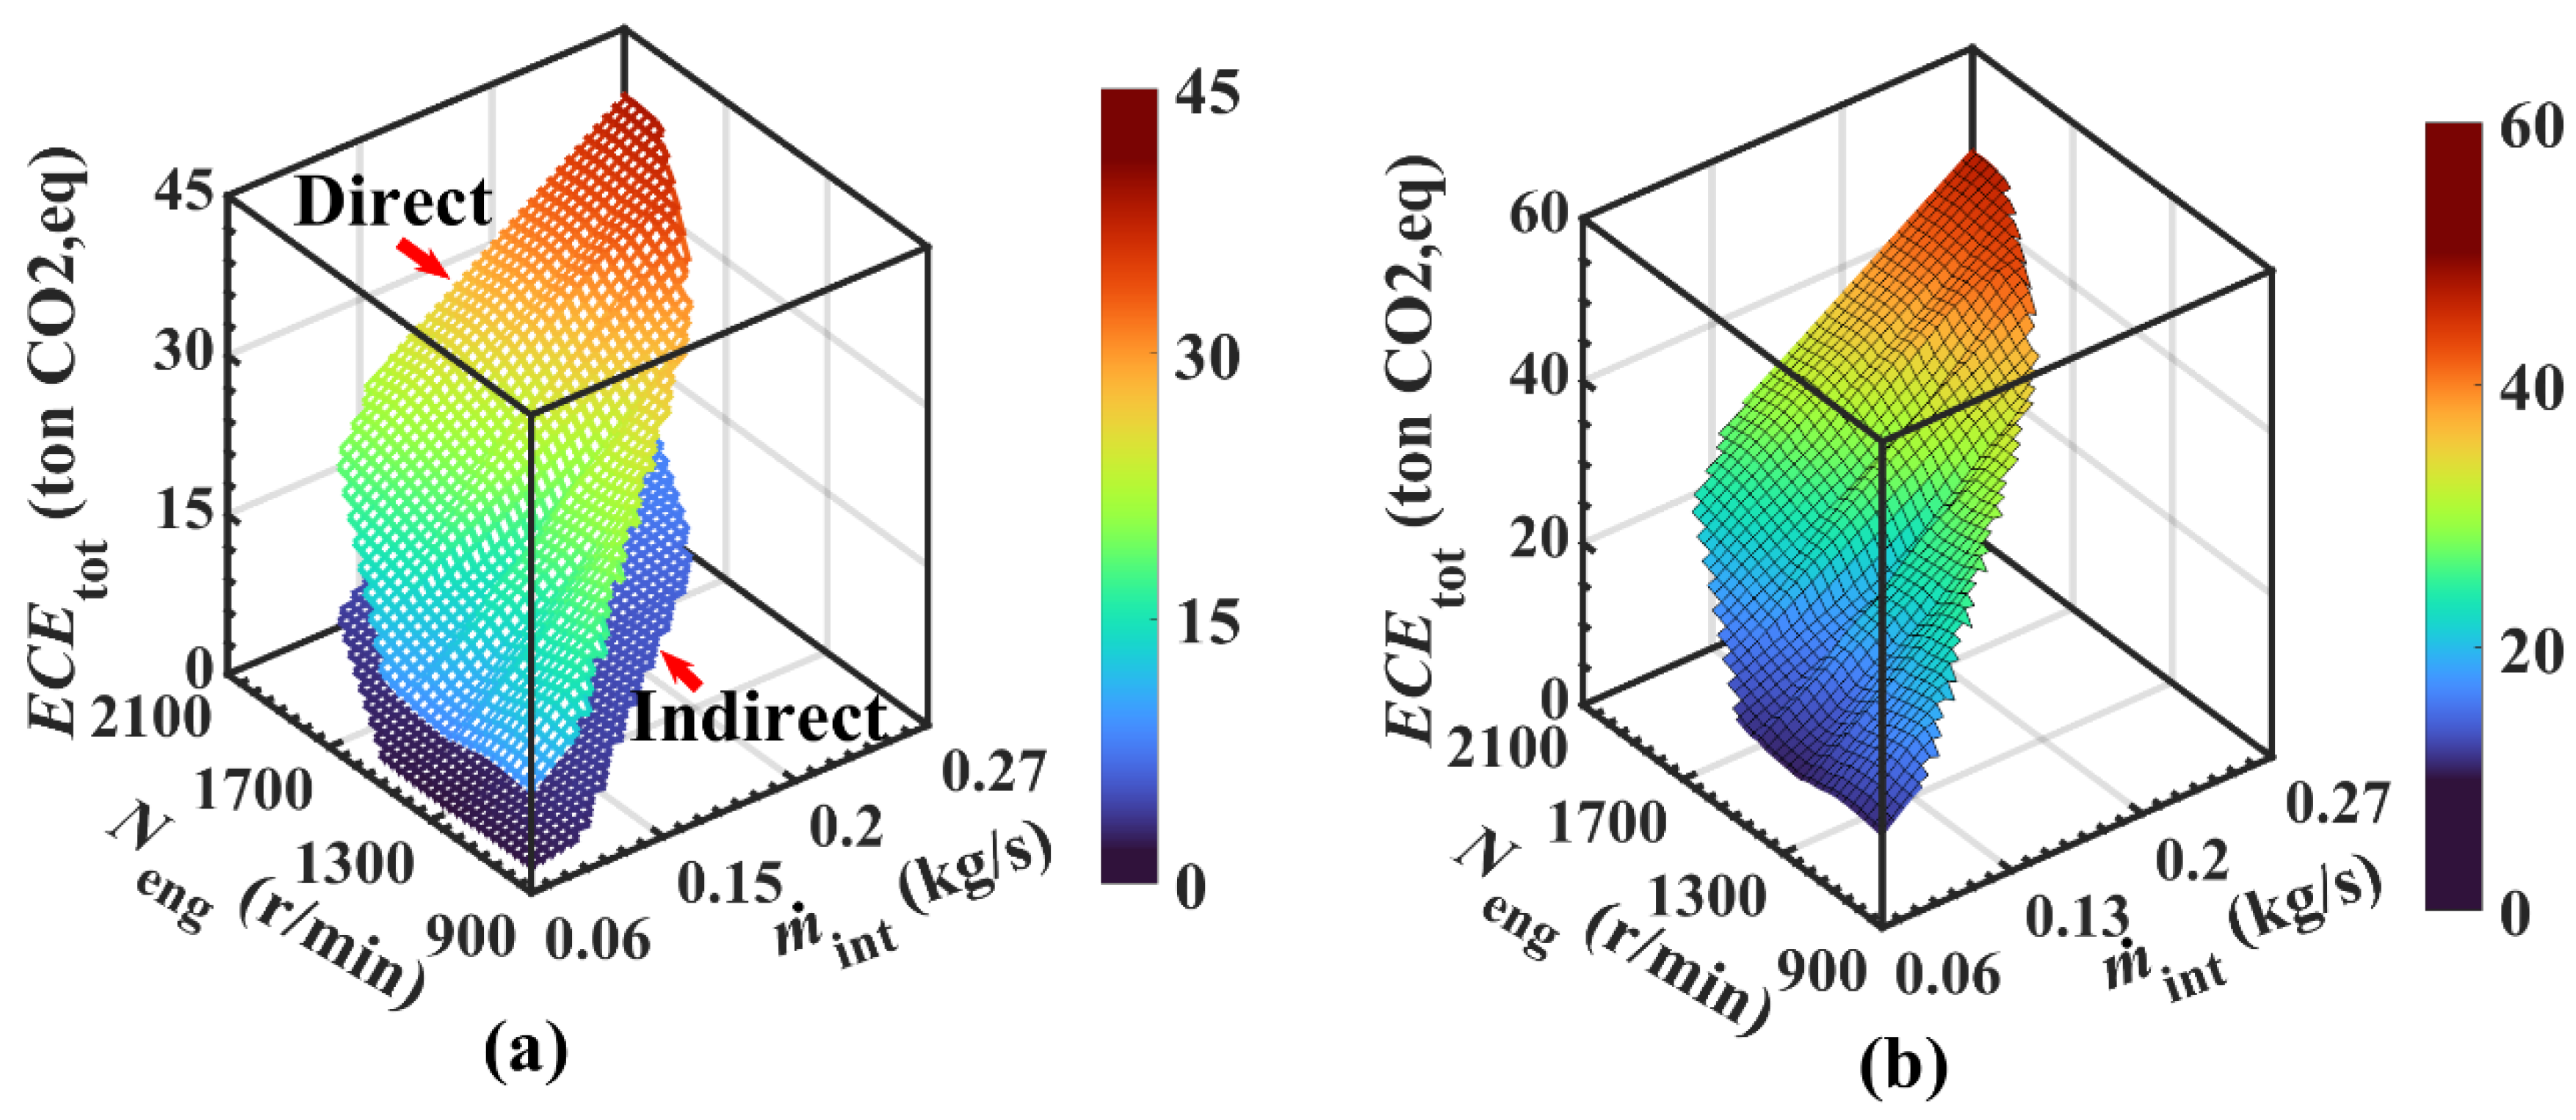
4.6. ECE
4.6.1. Variable Working Conditions
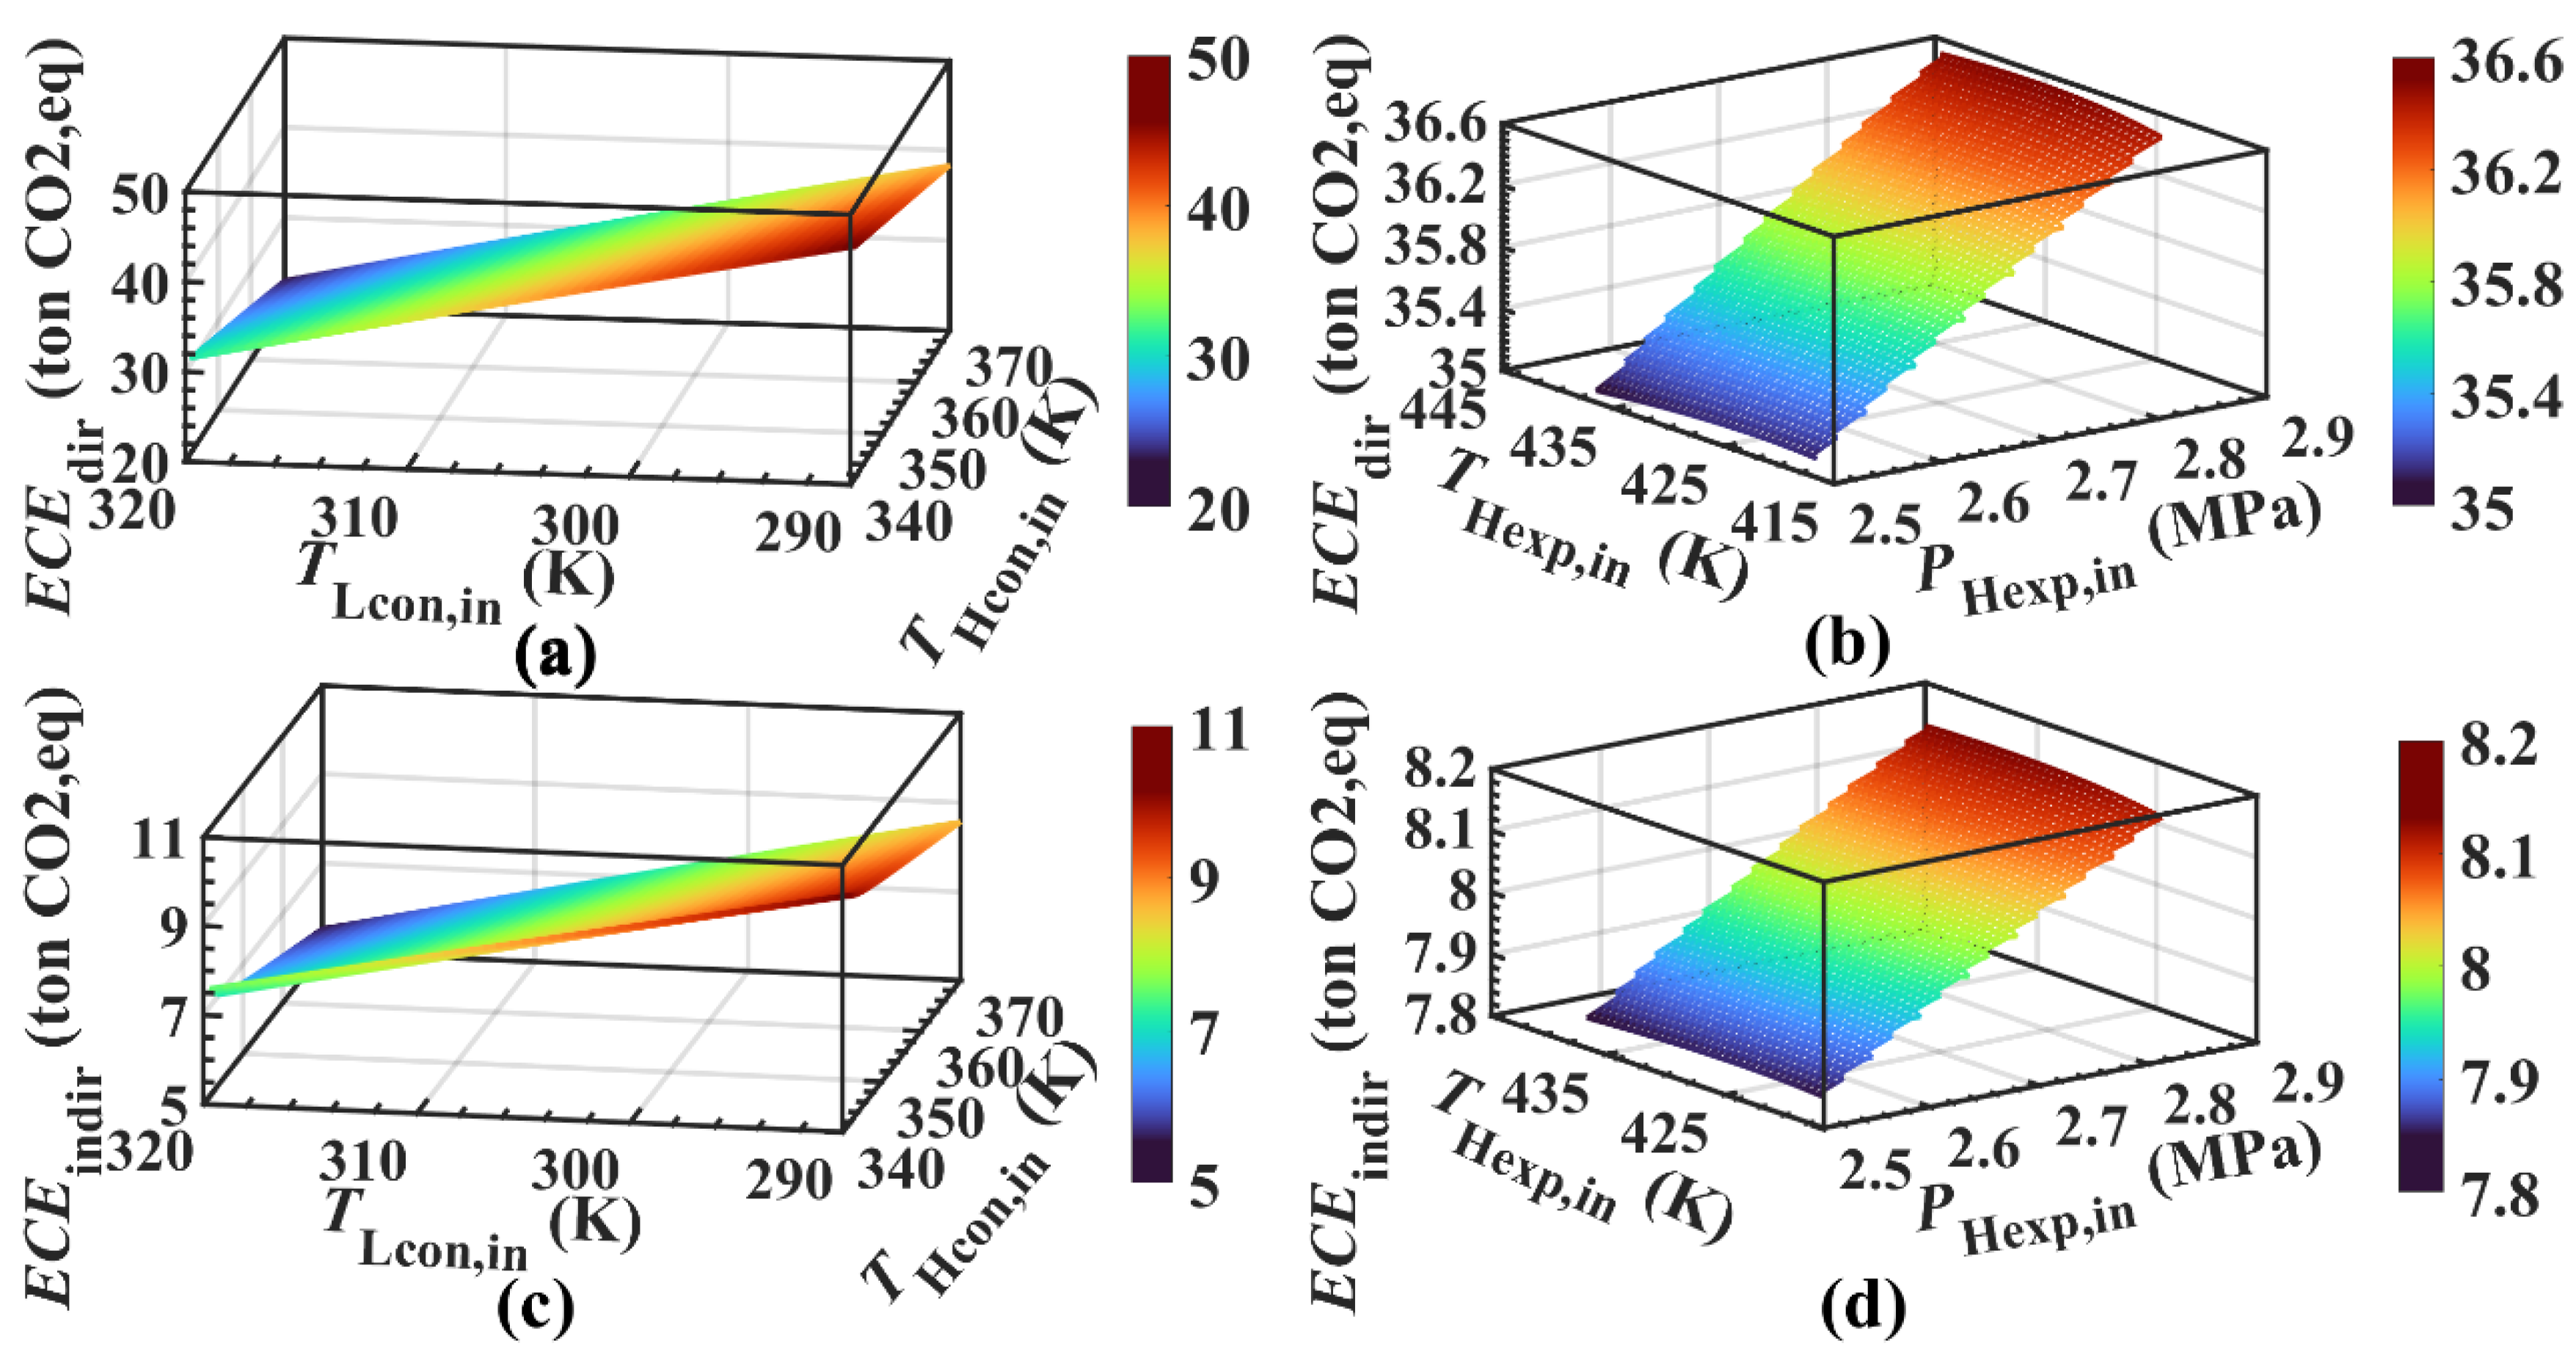
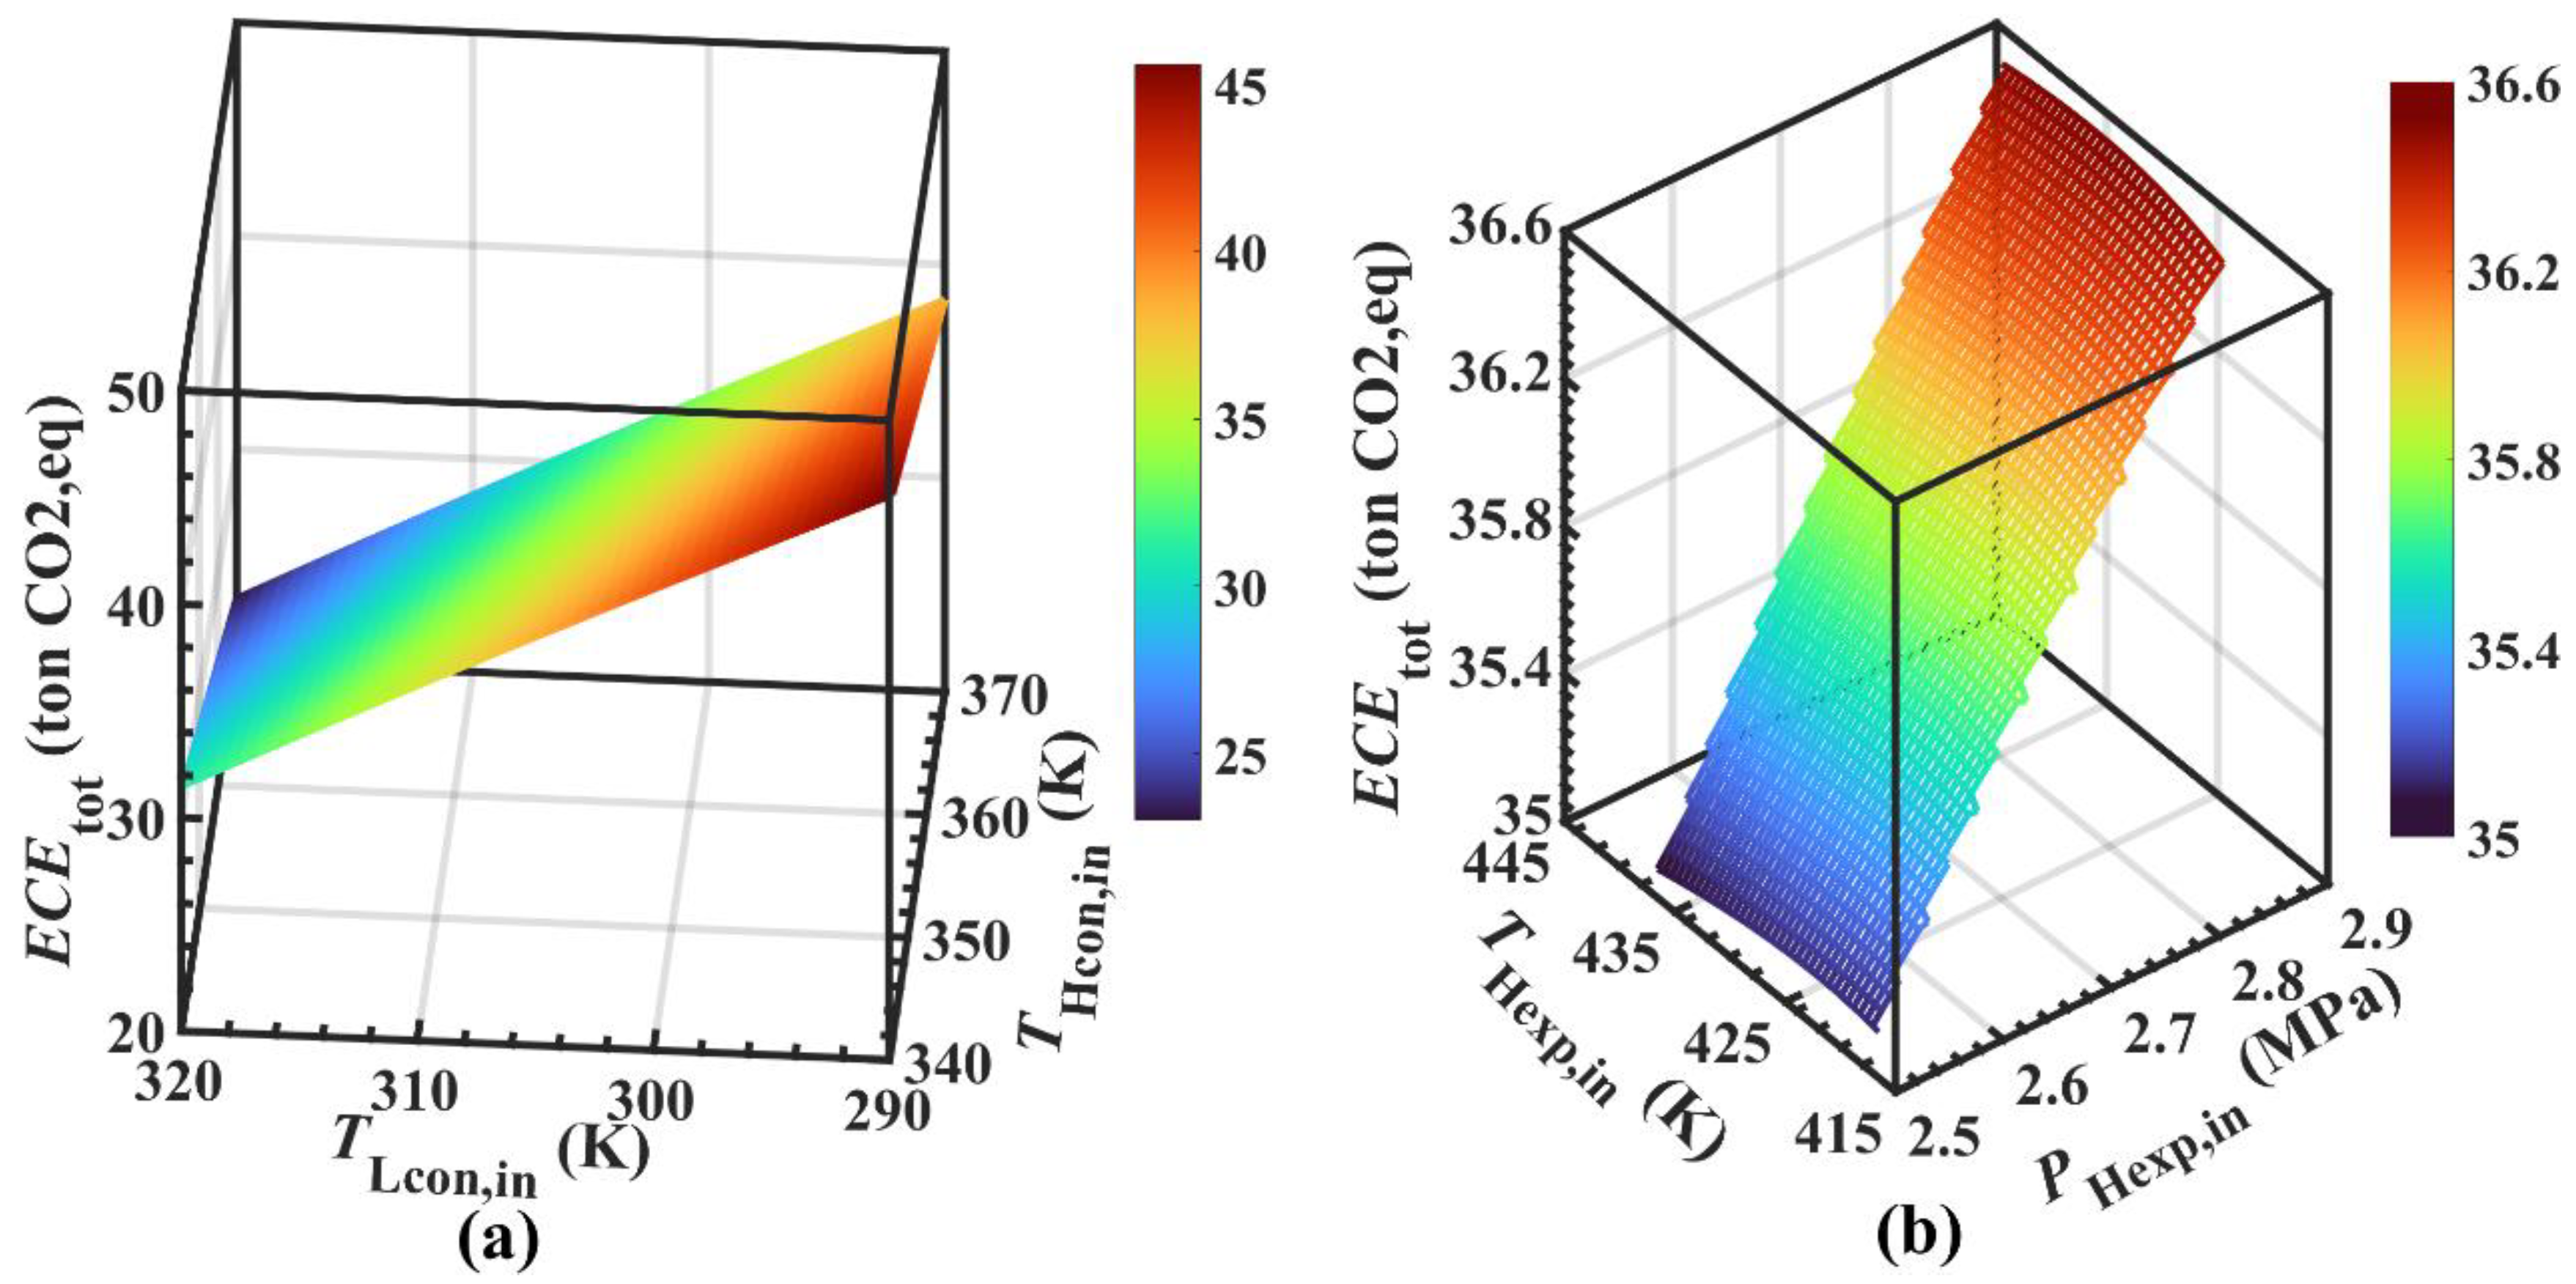
4.6.2. Key Variables
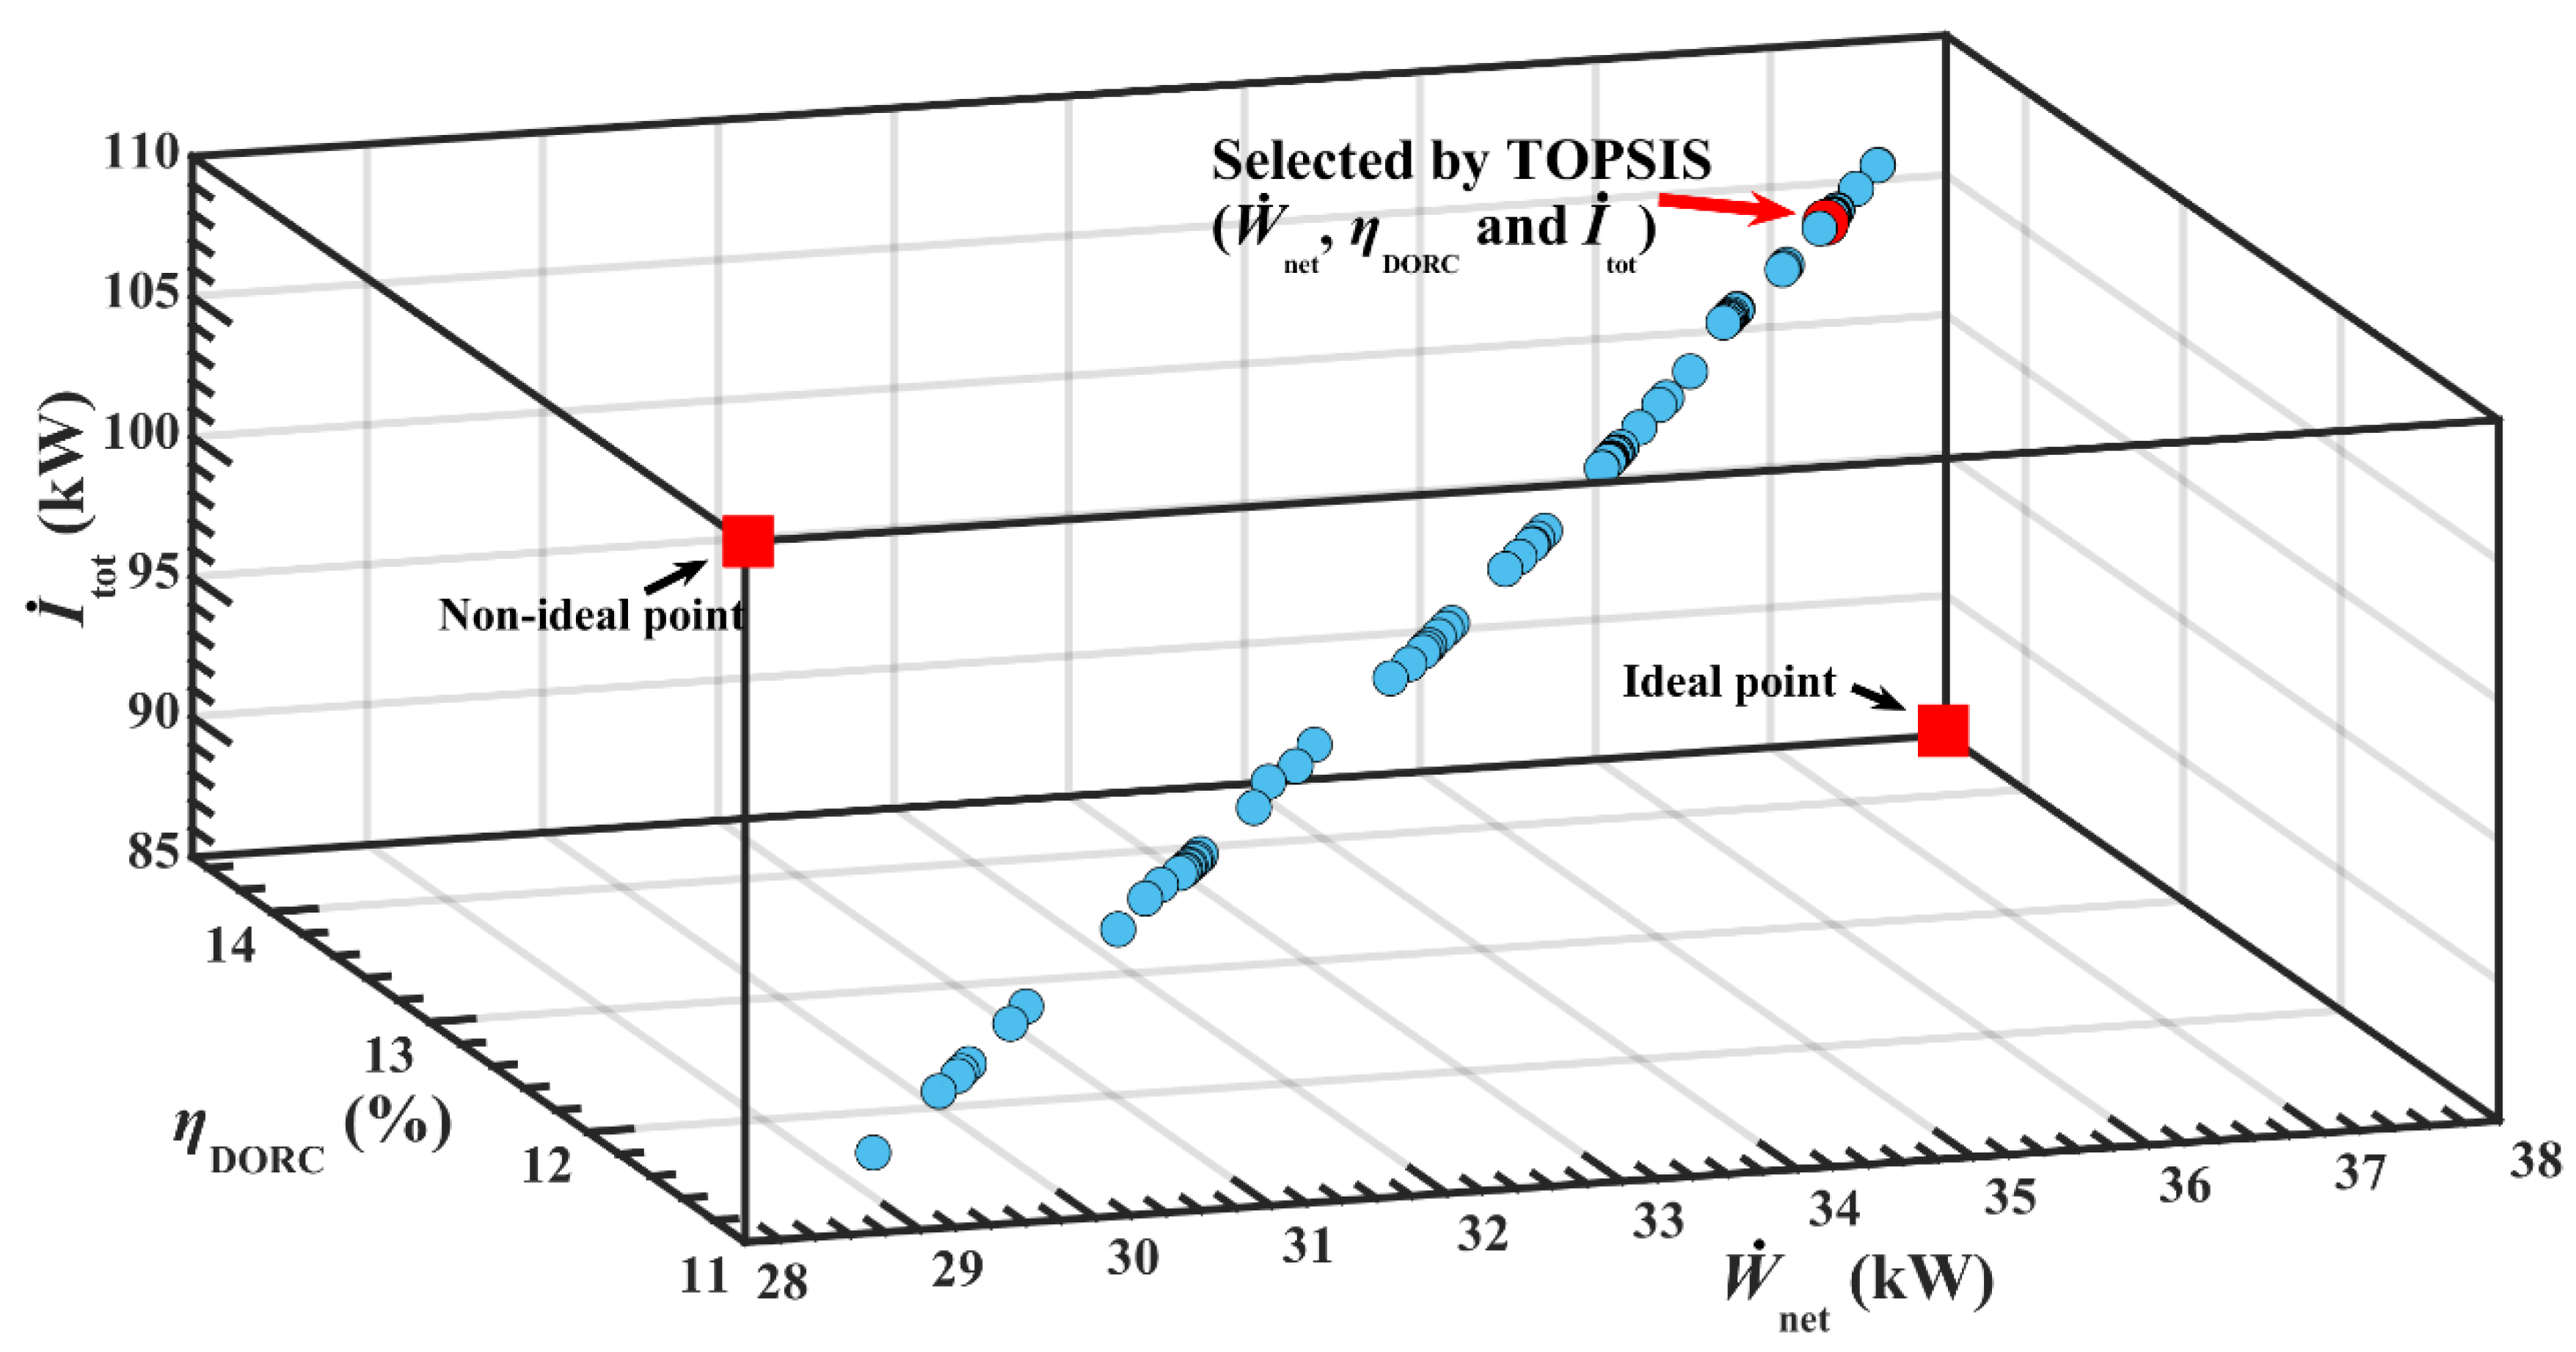
4.7. Multi Objective Optimization and TOPSIS Selection
5. Conclusions
Author Contributions
Funding
Conflicts of Interest
Nomenclature
| heat transfer area (m2) | |
| boiling number | |
| channel spacing (m) | |
| specific heat at constant pressure | |
| temperature difference correction factor | |
| diameter (m) | |
| forced convective heat transfer enhancement factor | |
| Darcy resistance coefficient | |
| mass velocity (kg/m2·s) | |
| fuel low calorific value | |
| specific enthalpy (kJ/kg) | |
| exergy destruction (kW) | |
| annual interest rate | |
| overall heat transfer coefficient (W/m2·K) | |
| length (m) | |
| molecular weight (kg/kmol) | |
| mass flow rate (kg/s) | |
| Nusselt number | |
| pressure (MPa) | |
| reduced pressure | |
| Prandtl number | |
| heat transfer rate (kW) | |
| heat flux (kW/(m2·K)) | |
| enthalpy of vaporization (J/kg) | |
| Reynolds number | |
| suppression factor | |
| specific entropy | |
| temperature (K) | |
| power output (kW) | |
| channel width (m) | |
| mass fraction | |
| Greek letters | |
| thermal conductivity (W/m·K) | |
| rib effect coefficient | |
| fouling resistance (m2·K/W) | |
| correction factor | |
| fin height (m) | |
| heat transfer coefficient (W/m2·K) | |
| dynamic viscosity (N·s/m2) | |
| Subscripts | |
| cool | coolant |
| env | environment |
| eng | engine |
| exh | exhaust |
| eva | evaporator |
| exp | expander |
| eq | equivalent |
| f | fin |
| ft | fin-and-tube heat exchanger |
| fb | film boiling |
| h | hydraulic |
| in | inner |
| inter | intercooler |
| l | liquid |
| LT | lifetime or low temperature |
| nb | nucleate boiling |
| th | thermal |
| tp | two-phase |
| tot | total |
| out | outer |
| P | pressure (MPa) or pump |
| pl | plate heat exchanger |
| pre | preheater |
| tot | total |
| v | vapor |
| w | wall |
| wf | working fluid |
| 6a-l | state points in HT loop |
| Acronyms | |
| CNG | compressed natural gas |
| DORC | dual loop organic Rankine cycle |
| ECE | emissions of CO2 equivalent |
| HT | high temperature |
| IC | internal combustion |
| LT | low temperature |
| LMTD | logarithmic mean temperature difference |
| ORC | organic Rankine cycle |
| POPA | net power output per unit heat transfer area |
References
- Wang, E.H.; Zhang, M.R.; Meng, F.X.; Zhang, H.G. Zeotropic working fluid selection for an organic Rankine cycle bottoming with a marine engine. Energy 2022, 243, 123097. [Google Scholar] [CrossRef]
- Zhao, Y.; Gao, C.H.; Li, C.J.; Sun, J.; Wang, C.Y.; Liu, Q.; Zhao, J. Energy and Exergy Analyses of Geothermal Organic Rankine Cycles Considering the Effect of Brine Reinjection Temperature. Energies 2022, 15, 6230. [Google Scholar] [CrossRef]
- Lu, Y.J.; Roskilly, A.P.; Yu, X.L.; Jiang, L.; Chen, L.F. Technical feasibility study of scroll-type rotary gasoline engine: A compact and efficient small-scale Humphrey cycle engine. Appl. Energy 2018, 221, 67–74. [Google Scholar] [CrossRef]
- Prasad, R.K.; Mustafi, N.; Agarwal, A.K. Effect of spark timing on laser ignition and spark ignition modes in a hydrogen enriched compressed natural gas fuelled engine. Fuel 2020, 276, 118071. [Google Scholar] [CrossRef]
- Ping, X.; Yang, F.B.; Zhang, H.G.; Zhang, W.J.; Song, G.G.; Yang, Y.X. Prediction and optimization of isentropic efficiency of vortex pump under full operating conditions in Organic Rankine Cycle waste heat recovery system based on deep learning and intelligent algorithm. Sustain. Energy Technol. Assess. 2020, 42, 100898. [Google Scholar] [CrossRef]
- Meng, F.X.; Wang, E.H.; Zhang, B. Possibility of optimal efficiency prediction of an organic Rankine cycle based on molecular property method for high-temperature exhaust gases. Energy 2021, 222, 119974. [Google Scholar]
- Ping, X.; Yang, F.B.; Zhang, H.G.; Zhang, J.; Zhang, W.J.; Song, G.G. Introducing machine learning and hybrid algorithm for prediction and optimization of multistage centrifugal pump in an ORC system. Energy 2021, 222, 120007. [Google Scholar] [CrossRef]
- Feng, Y.Q.; Xu, J.W.; He, Z.X.; Hung, T.C.; Shao, M.; Zhang, F.Y. Numerical simulation and optimal design of scroll expander applied in a small-scale organic rankine cycle. Energy 2022, 260, 124981. [Google Scholar] [CrossRef]
- Xie, H.; Yang, C. Dynamic behavior of Rankine cycle system for waste heat recovery of heavy duty diesel engines under driving cycle. Appl. Energy 2013, 112, 130–141. [Google Scholar] [CrossRef]
- Ping, X.; Yang, F.B.; Zhang, H.G.; Xing, C.D.; Wang, C.Y.; Zhang, W.J.; Wang, Y. Energy, economic and environmental dynamic response characteristics of organic Rankine cycle (ORC) system under different driving cycles. Energy 2022, 246, 123438. [Google Scholar] [CrossRef]
- Ramli, W.R.B.W.; Pesyridis, A.; Gohil, D.; Alshammari, F. Organic Rankine Cycle Waste Heat Recovery for Passenger Hybrid Electric Vehicles. Energies 2020, 13, 4532. [Google Scholar] [CrossRef]
- Wang, Z.Q.; Hu, Y.H.; Xia, X.X.; Zuo, Q.S.; Zhao, B.; Li, Z.X. Thermo-economic selection criteria of working fluid used in dual-loop ORC for engine waste heat recovery by multi-objective optimization. Energy 2020, 197, 117053. [Google Scholar] [CrossRef]
- Zhi, L.H.; Hu, P.; Chen, L.X.; Zhao, G. Performance analysis and optimization of engine waste heat recovery with an improved transcritical-subcritical parallel organic Rankine cycle based on zeotropic mixtures. Appl. Therm. Eng. 2020, 181, 115991. [Google Scholar] [CrossRef]
- Zhi, L.H.; Hu, P.; Chen, L.X.; Zhao, G. Thermodynamic analysis of an innovative transcritical CO2 parallel Rankine cycle driven by engine waste heat and liquefied natural gas cold. Energy Convers. Manag. 2020, 209, 112583. [Google Scholar] [CrossRef]
- Song, J.; Li, X.Y.; Wang, K.; Markides, C.N. Parametric optimisation of a combined supercritical CO2 (S-CO2) cycle and organic Rankine cycle (ORC) system for internal combustion engine (ICE) waste-heat recovery. Energy Convers. Manag. 2020, 218, 112999. [Google Scholar] [CrossRef]
- De Oliveira Neto, R.; Sotomonte, C.A.R.; Coronado, C.J.R.; Nascimento, M.A.R. Technical and economic analyses of waste heat energy recovery from internal combustion engines by the Organic Rankine Cycle. Energy Convers. Manag. 2016, 129, 168–179. [Google Scholar] [CrossRef]
- Wang, X.; Shu, G.Q.; Tian, H.; Liu, P.; Jing, D.Z.; Li, X.Y. Dynamic analysis of the dual-loop Organic Rankine Cycle for waste heat recovery of a natural gas engine. Energy Convers. Manag. 2017, 148, 724–736. [Google Scholar] [CrossRef]
- Ping, X.; Yao, B.F.; Zhang, H.G.; Yang, F.B. Thermodynamic, economic, and environmental analysis and multi-objective optimization of a dual loop organic Rankine cycle for CNG engine waste heat recovery. Appl. Therm. Eng. 2021, 193, 116980. [Google Scholar] [CrossRef]
- Huang, H.Z.; Zhu, J.; Yan, B. Comparison of the performance of two different Dual-loop organic Rankine cycles (DORC) with nanofluid for engine waste heat recovery. Energy Convers. Manag. 2016, 126, 99–109. [Google Scholar] [CrossRef]
- Ping, X.; Yao, B.F.; Zhang, H.G.; Yang, F.B. Thermodynamic analysis and high-dimensional evolutionary many-objective optimization of dual loop organic Rankine cycle (DORC) for CNG engine waste heat recovery. Energy 2021, 236, 121508. [Google Scholar] [CrossRef]
- Ochoa, G.V.; Rojas, J.P.; Forero, J.D. Advance Exergo-Economic Analysis of a Waste Heat Recovery System Using ORC for a Bottoming Natural Gas Engine. Energies 2020, 13, 267. [Google Scholar] [CrossRef]
- He, M.; Wang, E.H.; Zhang, Y.Y.; Zhang, W.; Zhang, F.J.; Zhao, C.L. Performance analysis of a multilayer thermoelectric generator for exhaust heat recovery of a heavy-duty diesel engine. Appl. Energy 2020, 274, 115298. [Google Scholar] [CrossRef]
- Ping, X.; Yang, F.B.; Zhang, H.G.; Xing, C.D.; Zhang, W.J.; Wang, Y. Evaluation of hybrid forecasting methods for organic Rankine cycle: Unsupervised learning-based outlier removal and partial mutual information-based feature selection. Appl. Energy 2022, 311, 118682. [Google Scholar] [CrossRef]
- Fouad, W.A. A combined heat, hydrogen and power tri-generation system based on the use of catalytic membrane reactors with a dual-loop organic Rankine cycle. Energy Convers. Manag. 2020, 222, 113255. [Google Scholar] [CrossRef]
- Linnemann, M.; Priebe, K.P.; Heim, A.; Wolff, C.; Vrabec, J. Experimental investigation of a cascaded organic Rankine cycle plant for the utilization of waste heat at high and low temperature levels. Energy Convers. Manag. 2020, 205, 112381. [Google Scholar] [CrossRef] [Green Version]
- Liu, X.Y.; Nguyen, M.Q.; He, M.G. Performance analysis and optimization of an electricity-cooling cogeneration system for waste heat recovery of marine engine. Energy Convers. Manag. 2020, 214, 112887. [Google Scholar] [CrossRef]
- Surendran, A.; Seshadri, S. Performance investigation of two stage Organic Rankine Cycle (ORC) architectures using induction turbine layouts in dual source waste heat recovery. Energy Convers. Manag. 2020, 6, 100029. [Google Scholar] [CrossRef]
- Mohammadkhani, F.; Yari, M. A 0D model for diesel engine simulation and employing a transcritical dual loop Organic Rankine Cycle (ORC) for waste heat recovery from its exhaust and coolant: Thermodynamic and economic analysis. Appl. Therm. Eng. 2019, 150, 329–347. [Google Scholar] [CrossRef]
- Cavazzini, G.; Bari, S. Optimization of the Adsorption/Desorption Contribution from Metal-Organic-Heat-Carrier Nanoparticles in Waste Heat Recovery Applications: R245fa/MIL101 in Organic Rankine Cycles. Energies 2022, 15, 1138. [Google Scholar] [CrossRef]
- Ping, X.; Yang, F.B.; Zhang, H.G.; Zhang, J.; Zhang, W.J. Elman and back propagation neural networks based working fluid side energy level analysis of shell-andtube evaporator in organic Rankine cycle (ORC) system. Alex. Eng. J. 2022, 61, 7339–7352. [Google Scholar] [CrossRef]
- Feng, Y.Q.; Hung, T.C.; Zhang, Y.N.; Li, B.X.; Yang, J.F.; Shi, Y. Performance comparison of low-grade ORCs (organic Rankine cycles) using R245fa, pentane and their mixtures based on the thermoeconomic multi-objective optimization and decision makings. Energy 2015, 93, 2018–2029. [Google Scholar] [CrossRef]
- Shu, G.Q.; Liu, P.; Tian, H.; Wang, X.; Jing, D.Z. Operational profile based thermal-economic analysis on an Organic Rankine cycle using for harvesting marine engine’s exhaust waste heat. Energy Convers. Manag. 2017, 146, 107–123. [Google Scholar] [CrossRef]
- Ping, X.; Yao, B.F.; Niu, K.; Yuan, M. A machine learning framework with intelligent algorithm for predicting the isentropic efficiency of hydraulic diaphragm metering pump in organic Rankine cycle system. Front. Energy Res. 2022, 10, 851513. [Google Scholar] [CrossRef]
- Xu, B.; Li, X.Y. A Q-learning based transient power optimization method for organic Rankine cycle waste heat recovery system in heavy duty diesel engine applications. Appl. Energy 2021, 286, 116532. [Google Scholar] [CrossRef]
- Douvartzides, S.L.; Tsiolikas, A.; Charisiou, N.D.; Souliotis, M.; Karayannis, V.; Taousanidis, N. Energy and Exergy-Based Screening of Various Refrigerants, Hydrocarbons and Siloxanes for the Optimization of Biomass Boiler–Organic Rankine Cycle (BB–ORC) Heat and Power Cogeneration Plants. Energies 2022, 15, 5513. [Google Scholar] [CrossRef]
- Li, X.Y.; Xu, B.; Tian, H.; Shu, G.Q. Towards a novel holistic design of organic Rankine cycle (ORC) systems operating under heat source fluctuations and intermittency. Renew. Sustain. Energy Rev. 2021, 147, 111207. [Google Scholar] [CrossRef]
- Ping, X.; Yang, F.B.; Zhang, H.G.; Xing, C.D.; Zhang, W.J.; Wang, Y.; Yao, B.F. Dynamic response assessment and multi-objective optimization of organic Rankine cycle (ORC) under vehicle driving cycle conditions. Energy 2023, 263, 125551. [Google Scholar] [CrossRef]
- Li, X.Y.; Song, J.; Yu, G.P.; Liang, Y.C.; Tian, H.; Shu, G.Q.; Markides, C.N. Organic Rankine cycle systems for engine waste-heat recovery: Heat exchanger design in space-constrained applications. Energy Convers. Manag. 2019, 199, 111968. [Google Scholar] [CrossRef]
- Zinsalo, J.M.; Lamarche, L.; Raymond, J. Performance analysis and working fluid selection of an Organic Rankine Cycle Power Plant coupled to an Enhanced Geothermal System. Energy 2022, 245, 123259. [Google Scholar] [CrossRef]
- Ping, X.; Yang, F.B.; Zhang, H.G.; Wang, Y.; Lei, B.; Wu, Y.T. Performance limits of the single screw expander in organic Rankine cycle with ensemble learning and hyperdimensional evolutionary many-objective optimization algorithm intervention. Energy 2022, 245, 123254. [Google Scholar] [CrossRef]
- Zukauskas, A. Heat Transfer from Tubes in Crossflow. Adv. Heat Transf. 1972, 8, 93–160. [Google Scholar]
- Gnielinski, V. New equations for heat mass transfer in turbulent pipe and channel flows. Int. J. Chem. Eng. 1976, 16, 359–368. [Google Scholar]
- Liu, Z.; Winterton, R.H.S. A general correlation for saturated and subcooled flow boiling in tubes and annuli, based on a nucleate pool boiling equation. Int. J. Heat Mass Transf. 1991, 34, 2759–2766. [Google Scholar] [CrossRef]
- Ghiaasiaan, S.M. Two-Phase Flow, Boiling and Condensation in Conventional and Miniature Systems; Cambridge University Press: Cambridge, UK, 2008; pp. 321–353. [Google Scholar]
- Ping, X.; Yang, F.B.; Zhang, H.G.; Zhang, W.J.; Zhang, J.; Song, G.G.; Wang, C.Y.; Yao, B.F.; Wu, Y.T. Prediction and optimization of power output of single screw expander in organic Rankine cycle (ORC) for diesel engine waste heat recovery. Appl. Therm. Eng. 2021, 182, 116048. [Google Scholar] [CrossRef]
- Sanaye, S.; Khakpaay, N. Thermo-economic multi-objective optimization of an innovative cascaded organic Rankine cycle heat recovery and power generation system integrated with gas engine and ice thermal energy storage. J. Energy Storage 2020, 32, 101697. [Google Scholar] [CrossRef]
- Zhao, Y.J.; Wang, J.F. Exergoeconomic analysis and optimization of a flash-binary geothermal power system. Appl. Energy 2016, 179, 159–170. [Google Scholar] [CrossRef]
- García-Cascales, J.R.; Vera-García, F.; Corberán-Salvador, J.M.; Gonzálvez-Maciá, J. Assessment of boiling and condensation heat transfer correlations in the modelling of plate heat exchangers. Int. J. Refrig. 2007, 30, 1029–1041. [Google Scholar] [CrossRef]
- Tian, H.; Shu, G.Q.; Wei, H.Q.; Liang, X.Y.; Liu, L.N. Fluids and parameters optimization for the organic Rankine cycles (ORCs) used in exhaust heat recovery of Internal Combustion Engine (ICE). Energy 2012, 47, 125–136. [Google Scholar] [CrossRef]
- Liu, Q.; Shen, A.J.; Duan, Y.Y. Parametric optimization and performance analyses of geothermal organic Rankine cycles using R600a/R601a mixtures as working fluids. Appl. Energy 2015, 148, 410–420. [Google Scholar] [CrossRef]
- Wang, S.K.; Liu, C.; Ren, J.Z.; Liu, L.; Li, Q.B.; Huo, E.G. Carbon footprint analysis of organic rankine cycle system using zeotropic mixtures considering leak of fluid. J. Clean. Prod. 2019, 239, 118095. [Google Scholar] [CrossRef]
- Fergani, Z.; Touil, D.; Morosuk, T. Multi-criteria exergy based optimization of an Organic Rankine Cycle for waste heat recovery in the cement industry. Energy Convers. Manag. 2016, 112, 81–90. [Google Scholar] [CrossRef]
- Ping, X.; Yang, F.B.; Zhang, H.G.; Xing, C.D.; Yao, B.F.; Wang, Y. An outlier removal and feature dimensionality reduction framework with unsupervised learning and information theory intervention for organic Rankine cycle (ORC). Energy 2022, 254, 124268. [Google Scholar] [CrossRef]
- Ping, X.; Yang, F.B.; Zhang, H.G.; Xing, C.D.; Yu, M.Z.; Wang, Y. Investigation and multi-objective optimization of vehicle engine-organic Rankine cycle (ORC) combined system in different driving conditions. Energy 2023, 263, 125672. [Google Scholar] [CrossRef]
- Zhang, C.; Liu, C.; Xu, X.X.; Li, Q.B.; Wang, S.K. Energetic, exergetic, economic and environmental (4E) analysis and multi-factor evaluation method of low GWP fluids in trans-critical organic Rankine cycles. Energy 2019, 168, 332–345. [Google Scholar] [CrossRef]
- Yang, F.B.; Cho, H.J.; Zhang, H.G.; Zhang, J. Thermodynamic multi-objective optimization of a dual loop organic Rankine cycle (ORC) for CNG engine waste heat recovery. Appl. Energy 2017, 205, 1100–1118. [Google Scholar] [CrossRef]
- Yaglı, H.; Koç, Y.; Kalay, H. Optimisation and exergy analysis of an organic Rankine cycle (ORC) used as a bottoming cycle in a cogeneration system producing steam and power. Sustain. Energy Technol. Assess. 2021, 44, 100985. [Google Scholar]
- Köse, Ö.; Koç, Y.; Yaglı, H. Energy, exergy, economy and environmental (4E) analysis and optimization of single, dual and triple configurations of the power systems: Rankine Cycle/Kalina Cycle, driven by a gas turbine. Energy Convers. Manag. 2021, 227, 113604. [Google Scholar] [CrossRef]
- Koç, Y.; Yağlı, H.; Kalay, I. Energy, Exergy, and Parametric Analysis of Simple and Recuperative Organic Rankine Cycles Using a Gas Turbine–Based Combined Cycle. J. Energy Eng. 2020, 146, 04020041. [Google Scholar] [CrossRef]


| Application | Year | Refs. | Working Conditions |
|---|---|---|---|
| Select the working fluid for loop organic Rankine cycle (DORC). | 2020 | Wang et al. [12] | The exhaust temperature and mass flow are 519 °C and 990.79 kg/h, respectively. |
| The operation performance of the transcritical-subcritical parallel ORC is analyzed. Based on evaluation results, the performance of the system is optimized. | 2020 | Zhi et al. [13] | The exhaust temperature and mass flow are 573.15 K and 1.91 kg/s, respectively. |
| The energy utilization efficiency and exergy efficiency of the transcritical CO2 parallel Rankine cycle are analyzed. | 2020 | Zhi et al. [14] | The exhaust temperature and mass flow are 300 °C and 1.91 kg/s, respectively. |
| The thermodynamic and economical performance of supercritical CO2-ORC are evaluated. Based on evaluation results, the system performance is optimized. | 2020 | Song et al. [15] | The exhaust temperature and mass flow are 457 °C and 1.69 kg/s, respectively. |
| The economy of ORC is analyzed. Furthermore, the application potential of ORC in waste heat recovery of an IC engine is analyzed. | 2016 | de Oliveira Neto et al. [16] | The exhaust temperature and mass flow are A and B, respectively. |
| Index | Description | Year | Refs. |
|---|---|---|---|
| Power and efficiency | The waste heat of biomass is recovered and utilized through DORC. | 2020 | Fouad et al. [24] |
| Power and efficiency | Based on the distribution of waste heat energy in the power plant, the operational performance of two cascaded ORC is analyzed. | 2020 | Linnemann et al. [25] |
| Power and efficiency | Combine ORC, ranking cycle and absorption refrigeration cycle into a hybrid system. | 2020 | Liu et al. [26] |
| Power, exergy and thermal efficiency | The application potential of series ORC and parallel ORC in vehicle waste heat is compared. | 2020 | Surendran et al. [27] |
| Power, thermal efficiency, payback period and investment cost | The working fluid of the DORC cycle is selected. The difference of DORC operation performance under working fluids is evaluated. | 2019 | Mohammadkhani et al. [28] |
| Parameters | Units | Values |
|---|---|---|
| Stroke and bore | mm | 114 × 144 |
| Maximum torque | Nm | 1120 |
| Displacement | L | 8.9 |
| Cylinder number | - | 6 |
| Parameters | Units | Values |
|---|---|---|
| Plate heat exchanger | ||
| Plate width | m | 0.123 |
| Plate thickness | mm | 0.35 |
| Corrugation depth | mm | 3 |
| Fin-and-tube heat exchanger | ||
| Fin height | mm | 12 |
| Tube pitch | mm | 60 |
| Row pitch | mm | 100 |
Publisher’s Note: MDPI stays neutral with regard to jurisdictional claims in published maps and institutional affiliations. |
© 2022 by the authors. Licensee MDPI, Basel, Switzerland. This article is an open access article distributed under the terms and conditions of the Creative Commons Attribution (CC BY) license (https://creativecommons.org/licenses/by/4.0/).
Share and Cite
Ping, X.; Yao, B.; Zhang, H.; Zhang, H.; Liang, J.; Yuan, M.; Niu, K.; Wang, Y. Comprehensive Performance Assessment of Dual Loop Organic Rankine Cycle (DORC) for CNG Engine: Energy, Thermoeconomic and Environment. Energies 2022, 15, 7832. https://doi.org/10.3390/en15217832
Ping X, Yao B, Zhang H, Zhang H, Liang J, Yuan M, Niu K, Wang Y. Comprehensive Performance Assessment of Dual Loop Organic Rankine Cycle (DORC) for CNG Engine: Energy, Thermoeconomic and Environment. Energies. 2022; 15(21):7832. https://doi.org/10.3390/en15217832
Chicago/Turabian StylePing, Xu, Baofeng Yao, Hongguang Zhang, Hongzhi Zhang, Jia Liang, Meng Yuan, Kai Niu, and Yan Wang. 2022. "Comprehensive Performance Assessment of Dual Loop Organic Rankine Cycle (DORC) for CNG Engine: Energy, Thermoeconomic and Environment" Energies 15, no. 21: 7832. https://doi.org/10.3390/en15217832